")
Back to Journals » Journal of Pain Research » Volume 14
Development and Psychometric Testing of the Japanese Version of the Fremantle Neck Awareness Questionnaire: A Cross-Sectional Study
Authors Yamashita Y , Nishigami T, Mibu A , Tanaka K , Wand BM, Catley MJ, Higashi T
Received 19 June 2020
Accepted for publication 21 December 2020
Published 4 February 2021 Volume 2021:14 Pages 311—324
DOI https://doi.org/10.2147/JPR.S267930
Checked for plagiarism Yes
Review by Single anonymous peer review
Peer reviewer comments 3
Editor who approved publication: Professor Robert B. Raffa
Yuh Yamashita,1,2 Tomohiko Nishigami,3 Akira Mibu,4 Katsuyoshi Tanaka,5 Benedict M Wand,6 Mark J Catley,7 Toshio Higashi1
1Nagasaki University Graduate School of Biomedical Sciences, Nagasaki, Nagasaki, 852-8520, Japan; 2Department of Rehabilitation, Morinaga Orthopedic Clinic, Saga, 849-0934, Japan; 3Department of Physical Therapy, Prefectural University of Hiroshima, Mihara, Hiroshima, 723-0053, Japan; 4Department of Nursing and Physical Therapy, Konan Women’s University, Kobe, Hyogo, 658-0001, Japan; 5Department of Rehabilitation, Tennouji-ku, Osaka, 543-0027, Japan; 6School of Physiotherapy, The University of Notre Dame Australia, Fremantle, WA, 6959, Australia; 7School of Health Sciences, University of South Australia, Adelaide, SA, 5001, Australia
Correspondence: Yuh Yamashita
Nagasaki University Graduate School of Biomedical Sciences, 1-7-1, Sakamoto, Nagasaki, 852-8520, Japan
Tel\Fax +81 95 819 7994 Email [email protected]
Purpose: Contemporary theories of pain suggest that how the body is perceived is central to the emergence of pain. The Fremantle Back Awareness Questionnaire (FreBAQ) was developed to assess body-perception specific to the back in people with chronic low back pain. However, there is no comprehensive measure to quantify self-perception of the painful area in Japanese people with neck pain. This study aimed to develop a Japanese version of a self-perception questionnaire specific to the neck and evaluate the validity and reliability of the scale using Rasch analysis.
Materials and Methods: The Fremantle Neck Awareness Questionnaire (FreNAQ-J) was developed by modifying the FreBAQ-J. One hundred people with chronic neck pain and fifty-six matched healthy controls completed the questionnaire. Rasch analysis was used to evaluate targeting, category order, unidimensionality, person fit, internal consistency, differential item functioning, and differential test functioning in the neck pain population. Validity was investigated by examining the relationship between the FreNAQ-J and clinical status.
Results: People with chronic neck pain endorsed FreNAQ-J items with greater frequency than healthy controls. FreNAQ-J did not reject the null hypothesis of fitting the Rasch model, had acceptable internal consistency and good test–retest reliability. Summed FreNAQ-J scores were significantly correlated with pain intensity, disability, pain-related catastrophizing and fear of movement.
Conclusion: The individual items of the FreNAQ-J can be validly summed to provide a score of self-perception. The FreNAQ-J is the first scale developed for comprehensively evaluating disturbed body perception in Japanese patients with chronic neck pain.
Keywords: neck pain, neck-specific body-perception questionnaire, reliability and validity, Rasch analysis
Introduction
Chronic neck pain (CNP) is one of the world’s leading causes of disability, and is associated with low quality of life, and considerable psychological distress.1–3 It is clear that, like many other persistent pain conditions, CNP is a complex problem contributed to by numerous biological, psychological and social factors.4 One factor that has attracted some attention recently is the association between persistent pain and how the body is perceived and experienced. Numerous investigations have reported alterations in various body representations in people with chronic pain.5–7 Largely these alterations seem to relate to clinical status8,9 and treatments that target body representation show some promise.10–12 Moreover, contemporary models of perception highlight the importance of cognitive modulation of sensory information in constructing a perceptual experience.13 Prior information about internal and external states is used to generate predictions about the causes of sensory information. Percepts, such as pain, are thought to represent the brains best fitting model for incoming sensory information weighed against predictions about the causes of the information.13–15 One important implication of this process for musculoskeletal pain problems is that perception of pain with movement will always be influenced by factors that drive us to predict pain with movement. This places body representation as central to the emergence of pain. Representations of the body inform beliefs about the health, robustness and load tolerance of the body and the risk to the body associated with a particular movement or activity. If the body is viewed and experienced as vulnerable and unhealthy, stronger and more precise expectations of pain with loading will result. In turn, this increases the likelihood of the emergence of pain with movement and also potentially influences its perceived intensity. One small study using body drawings provided data to suggest that body representation might be impaired in people with CNP.16 Also, some evidence is available suggesting that several mechanisms that contribute to body perception, such as tactile acuity9,12,17 and cervical proprioception,18,19 are disrupted in people with CNP.
The Fremantle Back Awareness Questionnaire (FreBAQ) was developed as a simple and quick way of assessing disturbed body perception of the back in people with chronic low back pain (CLBP).20,21 The FreBAQ is composed of nine items that ask questions about neglect-like symptoms (three items), reduced proprioceptive acuity (two items) and issues of body shape and size (four items),20 and it has since been translated into Japanese,22 Dutch,23 German24 and Turkish.25 Furthermore, researchers have recently developed a modified FreBAQ for patients with knee osteoarthritis,26 and shoulder pain (Nishigami under review), both of which appear psychometrically sound and demonstrate associations with clinical status. Similarly, a Turkish research group has modified the FreBAQ content to develop a new questionnaire that specifically assesses body perception disturbance in patients with CNP.27 However, there is no comprehensive measure to directly quantify abnormalities in body perceptions in Japanese patients with CNP.
Some modifications in the key wording of questionnaire items to make them appropriate for different clinical populations is not uncommon. For example, the Keele STarT Back Screening Tool28–31 and the Fear-Avoidance Beliefs Questionnaire32–34 for LBP were modified for other musculoskeletal pain conditions such as lumbar stenosis, knee pain, shoulder pain and neck pain. However, it is essential that thorough psychometric testing of the modified scale is undertaken before adopting the questionnaire into clinical practice. Therefore, the present study aimed to develop a Japanese version of a self-perception questionnaire specific to the neck for individuals with CNP and evaluate the validity and reliability of the scale using the Rasch probability model.
Materials and Methods
Development of the Japanese Version of the Fremantle Neck Awareness Questionnaire (FreNAQ-J)
The FreBAQ was originally developed and validated to assess the degree of distorted body perception in people with CLBP.20 A Japanese version of the FreBAQ (FreBAQ-J) was linguistically validated through the general cross-cultural adaptation process including forward-translation, back-translation and cognitive debriefing.22 We adapted the FreBAQ-J for use in people with neck pain by substituting the character for “back” with the character for “neck”.
Participants
One hundred people with CNP were recruited consecutively from three orthopedic clinics. All participants were screened and recruited by a medical doctor. A previous study on Rasch analyses demonstrated that there were more stable estimates observed in samples with 100 participants or greater.35 Criteria for inclusion were, aged between 18 and 80 years and complaining of unilateral or bilateral non-specific neck pain for longer than three months. Participants were excluded if they had, any neurological disorders, problems with vision and hearing, vestibular pathology, or other neurological deficits, had undergone any previous spinal surgery, were diagnosed with serious spinal pathology (cancer, inflammatory arthropathy, or acute vertebral fracture), or were currently pregnant. Fifty-six healthy individuals with no history of neck pain and who matched the age and gender of the enrolled patients were recruited as controls. Ethical approval was obtained from the institutional ethics committee of Konan Women’s University. Written informed consent was obtained from all subjects prior to the study. The study was conducted in compliance with the Declaration of Helsinki.
Procedures
Demographic data (age, gender, height, weight) were assessed in all participants, and pain duration, pain intensity, pain-related catastrophizing, fear of movement and neck pain-related disability was evaluated in the participants with CNP. Average pain intensity at rest and during movement in the past seven days were measured using a 0–100 visual analog scale anchored at the left with “0 = no pain” and at the right with “100 = unbearable pain”.36,37 Pain-related catastrophizing was measured using the Japanese version of the Pain Catastrophizing Scale (PCS)38,39 and pain-related fear was assessed using the Japanese version of the Tampa Scale of Kinesiophobia (TSK).40,41 Functional disability was measured using the Japanese version of the Neck Disability Index (NDI),42,43 which quantifies neck pain related disability, with higher scores representing greater perceived disability (scores reported as a percentage). In addition, all of the participants completed the FreNAQ-J. The instructions used for the control participants when filling out the FreNAQ-J read “please indicate the degree to which your neck feels this way today”.
Comparisons Between the Patients and the Control Group
To determine whether people with neck pain experience perceptual impairments, we compared the FreNAQ-J scores between people with CNP and healthy controls. Data distribution was tested for homoscedasticity using the Levene’s test. Age, height, weight and FreNAQ-J total score (for discriminative validity) were compared between the CNP group and the control group using Student’s t-test. Gender was compared between the CNP group and the control group using Fisher’s exact test. P-values of less than 0.05 were considered statistically significant. Comparisons between the CNP group and the control group was performed with EZR (Saitama Medical Center, Jichi Medical University, Saitama, Japan),44 which is a graphical user interface for R (The R Foundation for Statistical Computing, Vienna, Austria, Version 3.4.3).
Psychometric Assessment of the FreNAQ-J
We conducted Rasch analysis45 on the patient data using the Andrich rating scale model,46 to assess the psychometric properties of the FreNAQ-J. Rasch analysis is a formal testing of an outcome scale against a mathematical measurement model.45 Rasch analysis supports this process by comparing raw data from the questionnaire to the Rasch model “standard” to assess how well the FreNAQ-J measured perceptual impairment. This analysis allows us to compare the ordinal FreNAQ-J data to a probabilistic mathematical model that is based on fundamental principles of measurement.45–47 Rasch analysis creates a hierarchy of items with an estimate of the difficulty of the item. Difficulty refers to the relative rarity with which an item is endorsed, with the more rarely endorsed items showing more difficulty.48 In this analysis, the term item endorsability will be used in place of difficulty. We used the Rasch analysis to determine whether the item content and category scoring of the FreNAQ-J is valid, reliable, and has adequate measurement characteristics. We used Winstep software (v3.90.2, Chicago, Illinois) to analyze the following.
Differential Test Functioning
Differential test functioning assesses whether CNP patients using the FreNAQ-J and CLBP patients using the FreBAQ-J22 do so in a similar manner. Because the FreBAQ has a theoretical construct of perceptual impairment,21–25 we evaluated whether the FreNAQ-J is likely a valid assessment of perceptual impairment by comparing the FreBAQ-J and FreNAQ-J. Differential test functioning was assessed visually by exploring the hierarchical progression of the average item difficulties.
Targeting
Targeting compares the endorsability of the items to the agreeability of the sampled individuals. In a well-targeted instrument, the mean person agreeability would be close to the default mean item endorsability, which is anchored at 0 logits, and the items would be evenly spaced across the range of agreeability. We evaluated targeting by visual inspection of the distribution of person and item thresholds and consideration of the summary statistics. We also considered the presence of floor and ceiling effects.
Category Order
Category ordering was assessed to determine how participants used the Likert-type scale, and ascertain whether respondents are able to identify incremental levels of perceptual disturbance. The FreNAQ-J has five response categories (category 0 = Never, category 1 = Rarely, category 2 = Occasionally, category 3 = Often, category 4 = Always). Category probability curves were visually analyzed to explore the rating scale function. In a well-functioning rating scale, each curve should have distinct peaks and, in this instance, four clear thresholds between the five categories that represent the point at which the likelihood of endorsing one category is equal to that of endorsing the next. Disordered thresholds indicate that the categories do not advance incrementally in endorsability. We assessed how each of the five categories were used and whether the respondents used each category in the expected manner.
Unidimensionality
The Rasch model is a unidimensional measurement model, therefore the assumption is that items summed together form a unidimensional scale.47 In the case of this study, we sought to examine whether each item of the FreNAQ-J evaluates the same characteristic of perceptual impairment. In order to support this assumption, we assessed unidimensionality using the item fit statistics and principal component analysis of residuals (PCA).49 Fit statistics indicate the degree of conformity between the data and the Rasch probabilistic model, and are expressed in mean-squares based on a chi-square model.47 In general, mean squares near 1.0 indicate little distortion of the measurement system, regardless of the standardized value. We used infit/outfit mean square values between 0.6 and 1.4 as an indicator of acceptable fit.47 The item characteristic curves of misfitting items were visually inspected to assess item performance across the person agreeability range. The PCA residual correlation matrix was inspected visually to identify the presence of secondary dimensions. Item clusters with substantial positive or negative loadings equivalent to an eigenvalue >2 were reviewed to ascertain whether a second dimension was present. If the eigenvalue of the first principal component is greater than 2.0, it could indicate the presence of a secondary dimension.50 Local dependency between the items was examined by inspecting the residual correlation matrix51 for pairs of items. We have calculated average observed residual correlations between items and defined the critical value for a violation of local independence obtained by adding 0.2 to this average based on previous studies.52
Person Fit
Person fit was used to identify response patterns that are deemed unlikely to be observed based on the Rasch model. People with excessive fit residuals, greater than 2.0 logits, were examined to determine the reason for poor fit.53 They were compared with those who fit the model using Fisher’s exact test of significance (for gender) or the Mann–Whitney U-test (for age, pain intensity, pain duration, disability and FreNAQ-J score). Response strings of misfitting participants were analyzed to identify patterns in their responses. The presence of seriously misfitting cases has been shown to influence item parameter estimates.54 If there was no clear pattern in the response data, re-analysis was performed after excluding misfit participants to examine which FreNAQ-J responses were affected by misfitting cases.
Internal Consistency
Winstep calculates a Person Reliability Index and Cronbach’s alpha55 as indicators of internal consistency. Acceptable internal consistency is considered to be >0.7 in both instances.56 A minimum Person Reliability Index value of 0.7 is suggested for group use of the scale, and a minimum of 0.85 is suggested for individual use.51
Differential Item Functioning (DIF)
Differential item functioning assesses the difference in responses between groups on individual items.57 The FreNAQ-J item responses should not be biased by factors other than perceptual impairments; that is, they should function similarly for all persons of the same level of agreeability. We assessed DIF for the following subgroups; gender (female or male), age (elderly or not), pain intensity at rest and with motion (severe or not), pain duration (long term or not), and disability (high disability or not). We use the following cut off for each sub group. (1) Age - the elderly were considered to be 60 years of age or older, according to the United Nations definition.58 (2) Pain intensity - a VAS value of over 50 mm was defined as severe pain, based on previous research.59 (3) Duration of pain - over 12 months was defined as long term, based on previous research.60–62 (4) Disability - a median split was used, with NDI scores of 21% or higher defined as a higher level of disability. We further ran analyses divided by the median FreNAQ-J score (FreNAQ-J score ≤6, >6) to determine whether specific items were biased between those with low and high scores. DIF was tested using a Mantel-Haenszel chi-square test63 with significance set at p = 0.01 for each item to help account for type 1 errors. DIF was explored if an item yielded a significant difference of greater than 0.5 logits between subgroups.64
Test–Retest Reliability
Test–retest reliability of the FreNAQ-J was assessed using scores obtained from the second round of questionnaire administration. Participants were invited to complete the questionnaire a second time within two weeks of their initial assessment. An intraclass correlation coefficient (ICC) 2-way mixed effect model with absolute agreement was used to determine measurement reliability.65 ICC values less than 0.5 were interpreted as poor, values between 0.5 and 0.75 as moderate, values between 0.75 and 0.9 as good, and values greater than 0.90 as excellent reliability.66
Construct Validity
A series of univariate correlations were performed to examine the relationships between the FreNAQ-J total score and, pain intensity, disability, pain catastrophizing, and kinesiophobia. These correlations were investigated using Spearman correlation coefficient. Correlation coefficients from 0.1 to 0.3 were considered to indicate a weak association, 0.4 to 0.6 as moderate, and 0.7 to 0.9 as strong.67 We adjusted alpha to 0.008 using the Bonferroni method as we undertook six separate analyses. The correlation analysis was performed with EZR (Saitama Medical Center, Jichi Medical University, Saitama, Japan).44
Results
Development of the Japanese Version of the Fremantle Neck Awareness Questionnaire (FreNAQ-J)
The FreBAQ-J is a nine items questionnaire used to assess perceptual impairment in people with back pain. In a previous study, a knee specific version of the questionnaire26 was developed based on the FreBAQ-J by substituting the Japanese character for “back” with the character for “knee” (the FreKAQ-J). Using a similar methodology in this study, we adapted the FreBAQ-J for the use in people with neck pain by substituting the character for “back” with the character for “neck”. In the case of the FreKAQ-J,26 slight changes to the final item were needed to account for the differences in axial and appendicular anatomy, but the FreNAQ-J did not require the same modifications.
Comparisons Between the Patient and the Control Groups
The characteristics of both groups are summarized in Table 1. There was no significant difference in gender (p = 0.86), age (p = 0.92), height (p = 0.14), weight (p = 0.33) or BMI (p = 0.72) between the CNP group and the control group. The average total score for the FreNAQ-J in the CNP group was 7.7 (standard deviation [SD] = 5.4) whereas the average score for the healthy control group was 2.9 (SD = 4.8). This difference was statistically significant (mean difference = 4.8, 95% confidence interval [CI] = 3.0 to 6.4, p < 0.001), suggesting the FreNAQ has discriminative validity. For a more detailed understanding of item endorsement, Table 2 describes the frequency of responses for each questionnaire item in the CNP group.
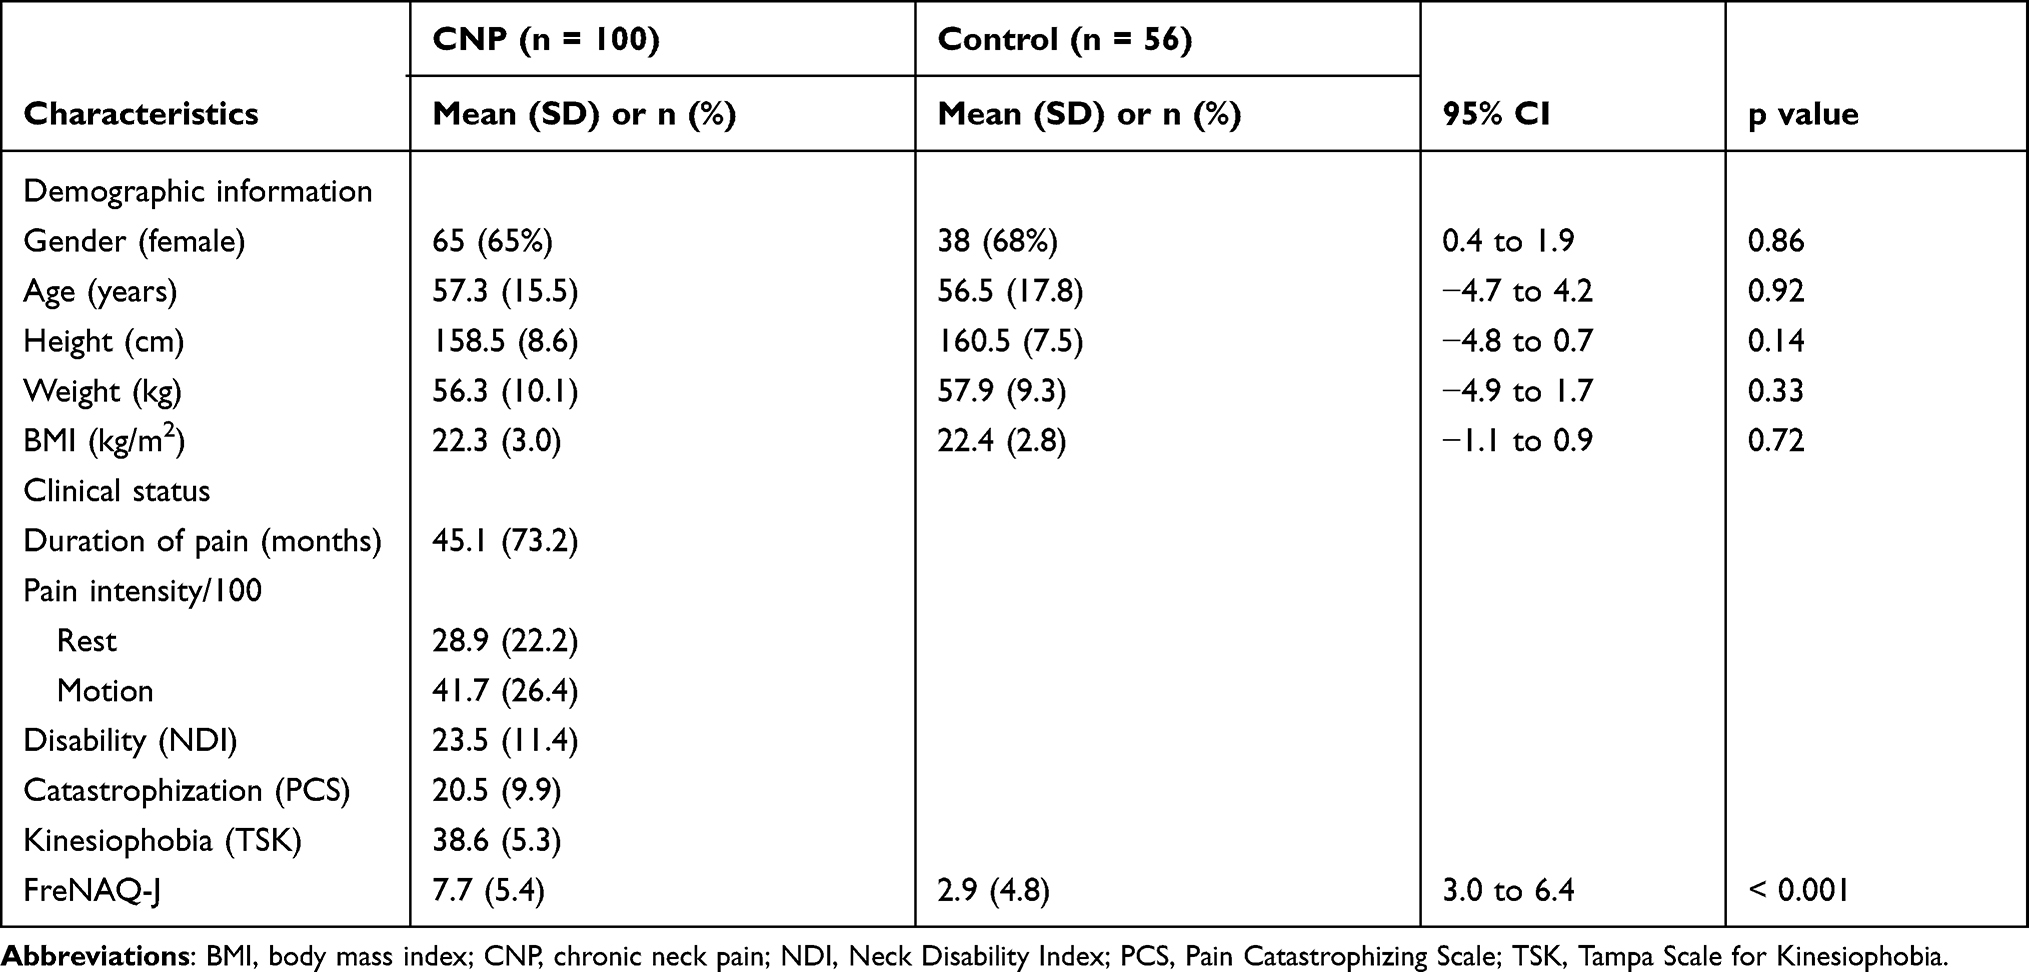 |
Table 1 Participants Demographic and Clinical Information |
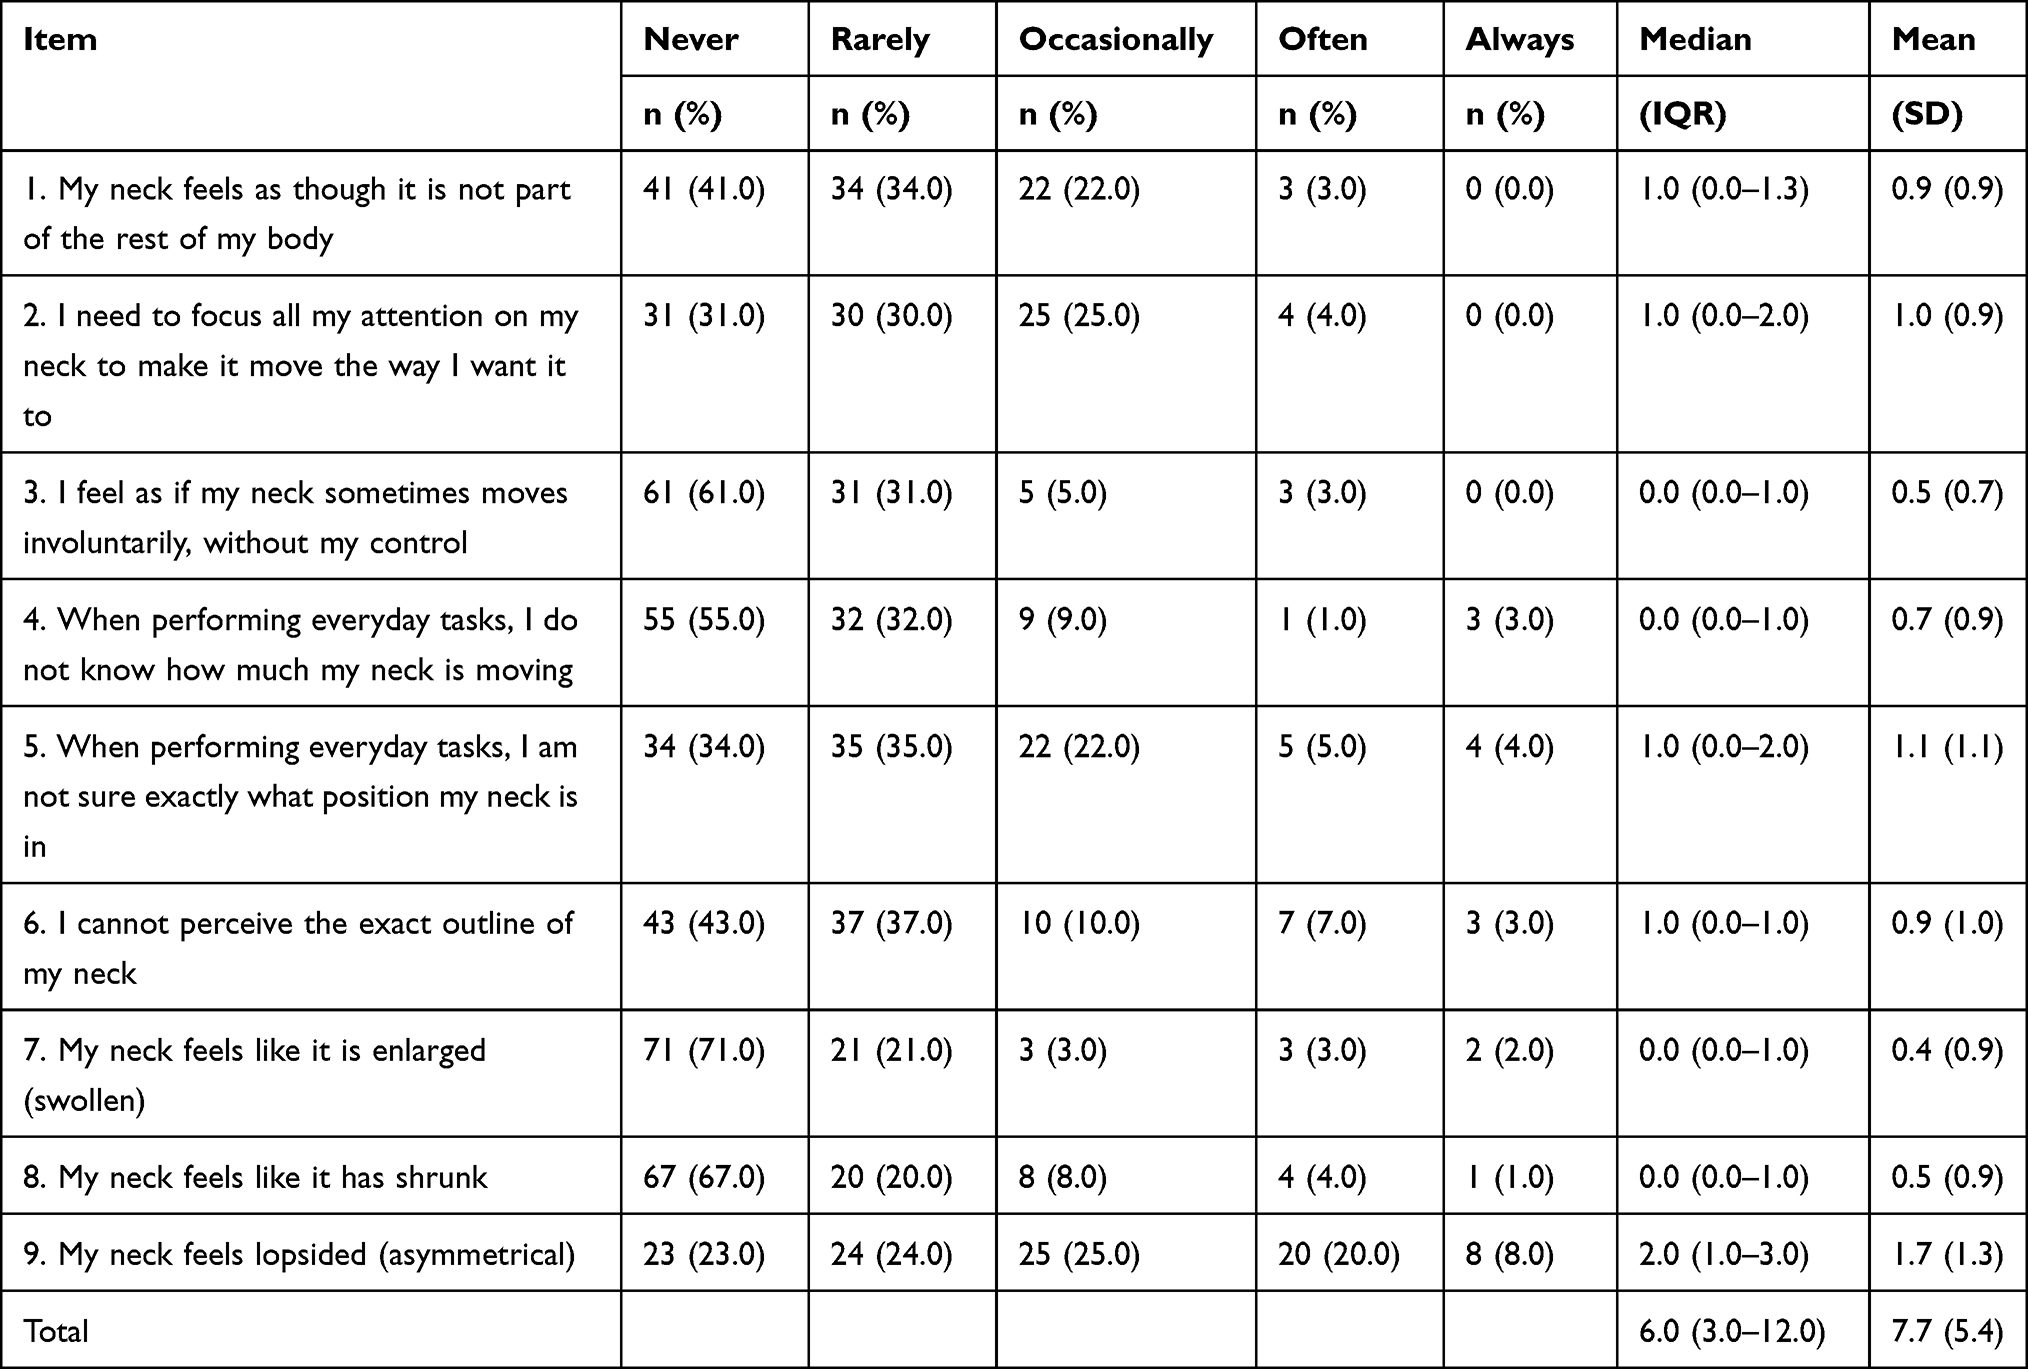 |
Table 2 Frequency of Responses to Each Item of the FreNAQ-J (n = 100) |
Psychometric Assessment of the FreNAQ-J
Rasch analysis was conducted on the data from 100 people with CNP.
Differential Test Functioning
Comparison of these data and FreBAQ-J data previously collected in people with chronic back pain demonstrated a similar item hierarchy (Figure 1).
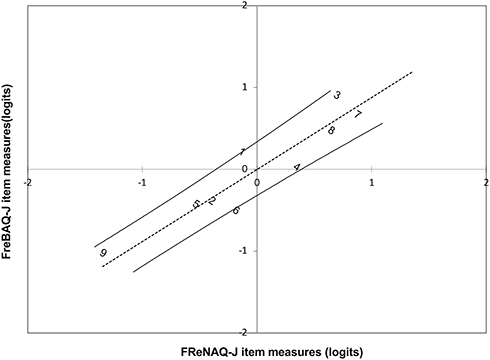 |
Figure 1 Differential test functioning between the FreBAQ-J and FreNAQ-J. The dashed line shows a trend-line through the mean of both sets of items, and the black lines show the upper and lower 95% confidence bands. |
Targeting
Figure 2A shows the relationship between FreNAQ-J items and person logit ratings (n = 100). Table 3 shows the average endorsability thresholds for each item. The sample was not well targeted by the FreNAQ-J. The average person agreeability was −1.82 logits (SD = 1.37, range = −5.22 to 0.46), compared with a default item endorsability average of 0 logits (SD = 0.67, range = −1.34 to 0.88). That person agreeability was shifted to the left when compared with item endorsability indicated that participants with low levels of disturbed body perception were not targeted well by the scale. Item 9 (My neck feels lopsided) was the easiest item for participants to endorse. Item 7 (My neck feels like it is enlarged) was the most difficult item to endorse. Only five participants (5.0%) scored zero for all items, and no participants recorded the maximum score on all items.
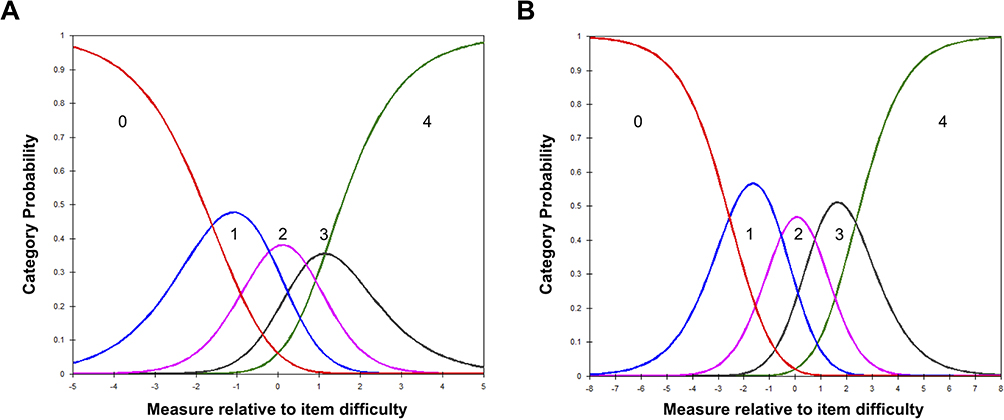 |
Figure 2 Category probability curves for the FreNAQ-J. (A) All cases (n=100), (B) Misfitting cases removed (n=89). Response; 0 “never”, 1 “rarely”, 2 “occasionally”, 3 “often”, and 4 “always”. |
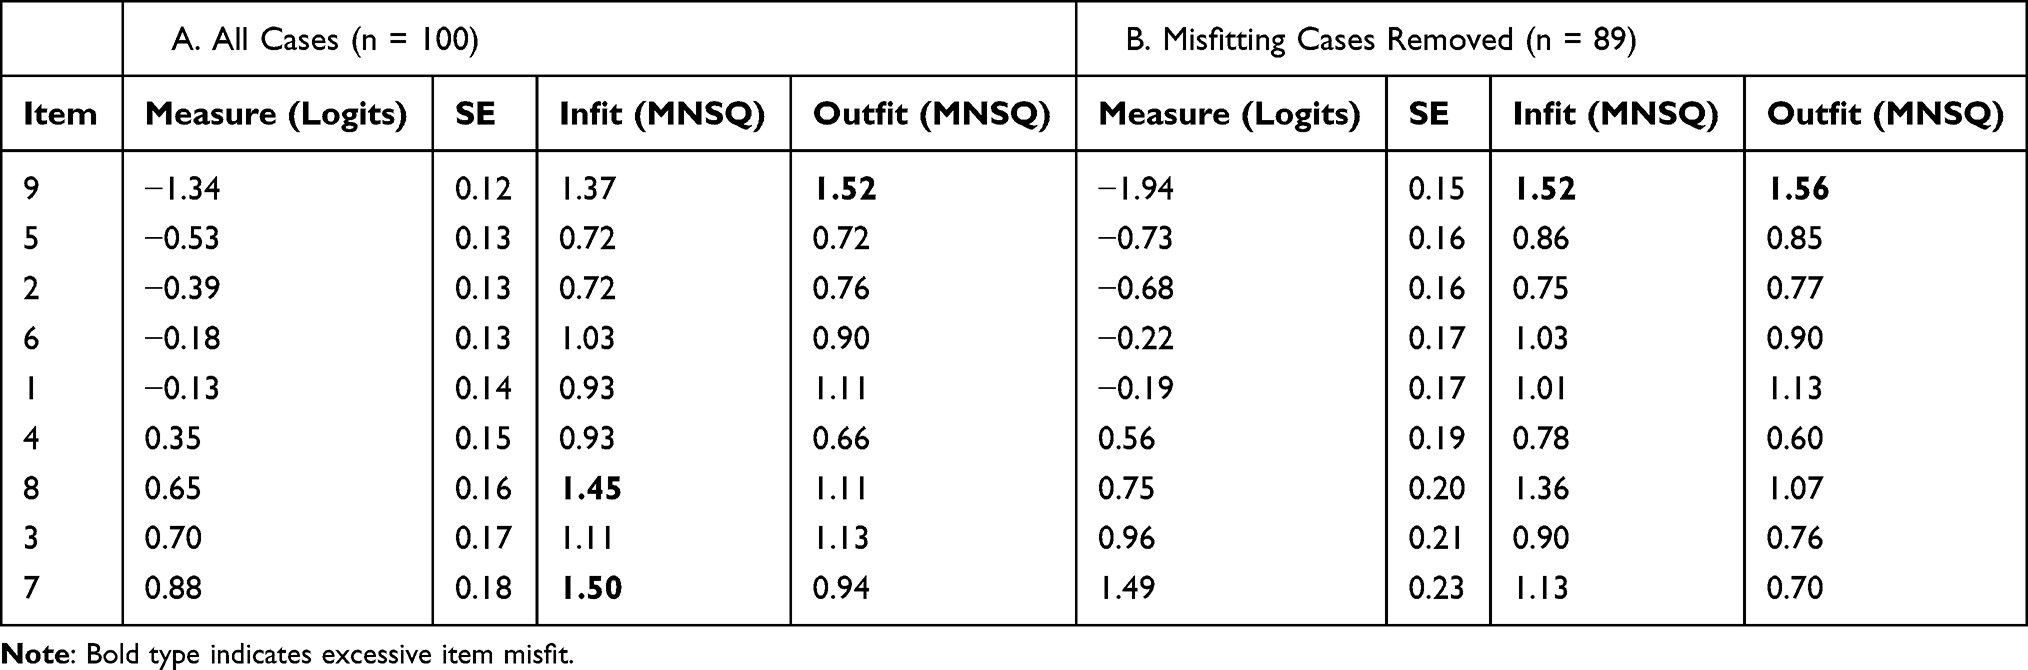 |
Table 3 Average Item Endorsability Thresholds, Including Fit Statics |
Category Order
The percentages of category utilization were 47% (0 = Never), 30% (1 = Rarely), 14% (2 = Occasionally), 6% (3 = Often), and 2% (4 = Always). The average agreeability measures of the respondents advanced as expected throughout the rating scale categories (Figure 3A). However, Categories 3 “often” and 4 “always” were disordered suggesting underutilization.
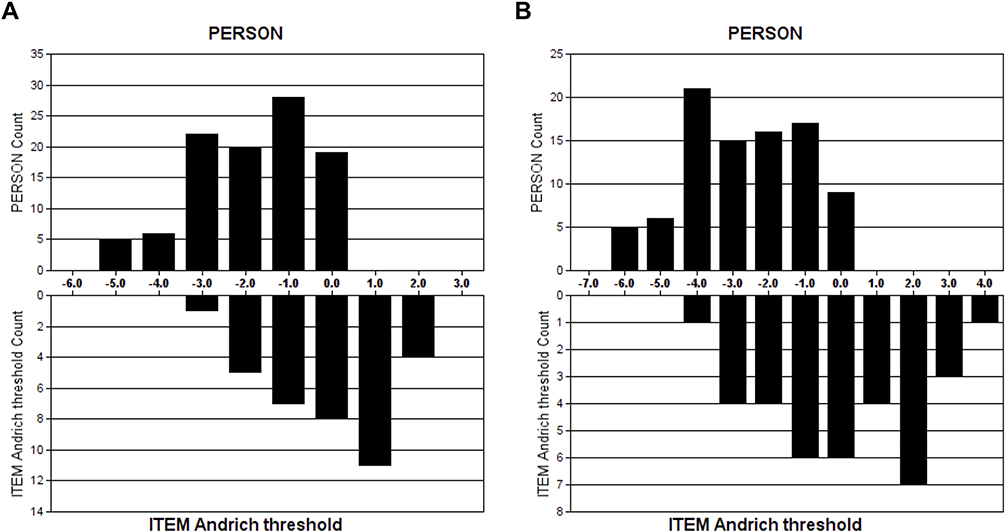 |
Figure 3 Item–person threshold map. (A) All cases (n = 100), (B) Misfitting cases removed (n = 89). Persons with lesser disturbed body perception and items easier to endorse are located on the left side of the logit scale (ie < 0 logits); Persons with higher disturbed body perception and items of greater difficulty to endorse are located to the right of the logit scale (ie > 0 logits). Item endorsability mean is set at 0 logits by default. |
Unidimensionality
Table 3-part A summarizes the fit statistics for the nine items for all cases (n = 100). Three items (Item 7, 8 and 9) demonstrated slightly excessive positive infit or outfit statistics, and no items demonstrated excessive negative infit and outfit statistics. Analysis of the item characteristic curves suggested the misfit was due to respondents with lower scores overall scoring these items high. PCA of residuals indicated that the unexplained variance of the first contrast was 1.9 eigenvalue units, suggesting there is no meaningful deviation from unidimensionality.
The average residual correlation for our data was 0.16. By adding 0.20, we set 0.36 as the critical value for a violation of local independence. Assessment of local dependence identified negative correlations between items 4 and 9 (r = −0.42). This suggested that the responses to these items were dependent.
Person Fit
Analysis of person fit identified 11 participants (11%) with excessive outfit statistics (> 2.0 logits). No statistically significant difference was demonstrated between those who fit versus those who did not fit the Rasch model for: age (p = 0.17), gender (p = 0.74), pain intensity at rest (p = 0.68), pain intensity with motion (p = 0.09), pain duration (p = 0.68) or disability (p = 0.71). For the total score of the FreNAQ-J, misfitting persons reported significantly higher scores compared with fitting persons (p = 0.02), but no statistically significant difference was detected in each item of the FreNAQ-J: item 1 (p = 0.23), item 2 (p = 0.98), item 3 (p = 0.24), item 4 (p = 0.37), item 5 (p = 0.59), item 6 (p = 0.57), item 7 (p = 0.06), item 8 (p = 0.49) and item 9 (p = 0.70).
Internal Consistency
The person reliability was 0.75 and the Cronbach’s alpha was 0.81, suggesting the FreNAQ-J has good internal consistency and is suitable for group use.
Differential Item Functioning (DIF)
Table 4 shows the DIF results for the FreNAQ-J items. No items displayed substantial DIF across five subgroups: age (18 to 60 years, n = 36; > 60 years, n = 64), pain intensity at rest (≤ 50mm, n = 82, > 50mm, n = 18), pain duration (3 to 12 months, n = 58; > 12 months, n = 42), disability (NDI score ≤22, n = 53; >22, n = 47) and FreNAQ-J score (FreNAQ-J score ≤ 6, n = 51; > 6, n = 49). Conversely, statistically significant DIF was detected between genders for Item 3 (I need to focus all my attention on my neck to make it move the way I want it to) and between those with lesser and greater pain intensity with motion for Item 5 (When performing everyday tasks, I am not sure exactly what position my neck is in). For Item 3, the DIF contrast (1.05 logits, p = 0.001) suggested that this item was more difficult to endorse for females (n = 65) than males (n = 35). For item 5, the DIF contrast (0.64 logits, p = 0.008) suggested that this item was more difficult for people who experienced mild to severe pain with motion (> 50mm, n = 41) than those with low to mild pain with motion (≤ 50mm, n = 59).
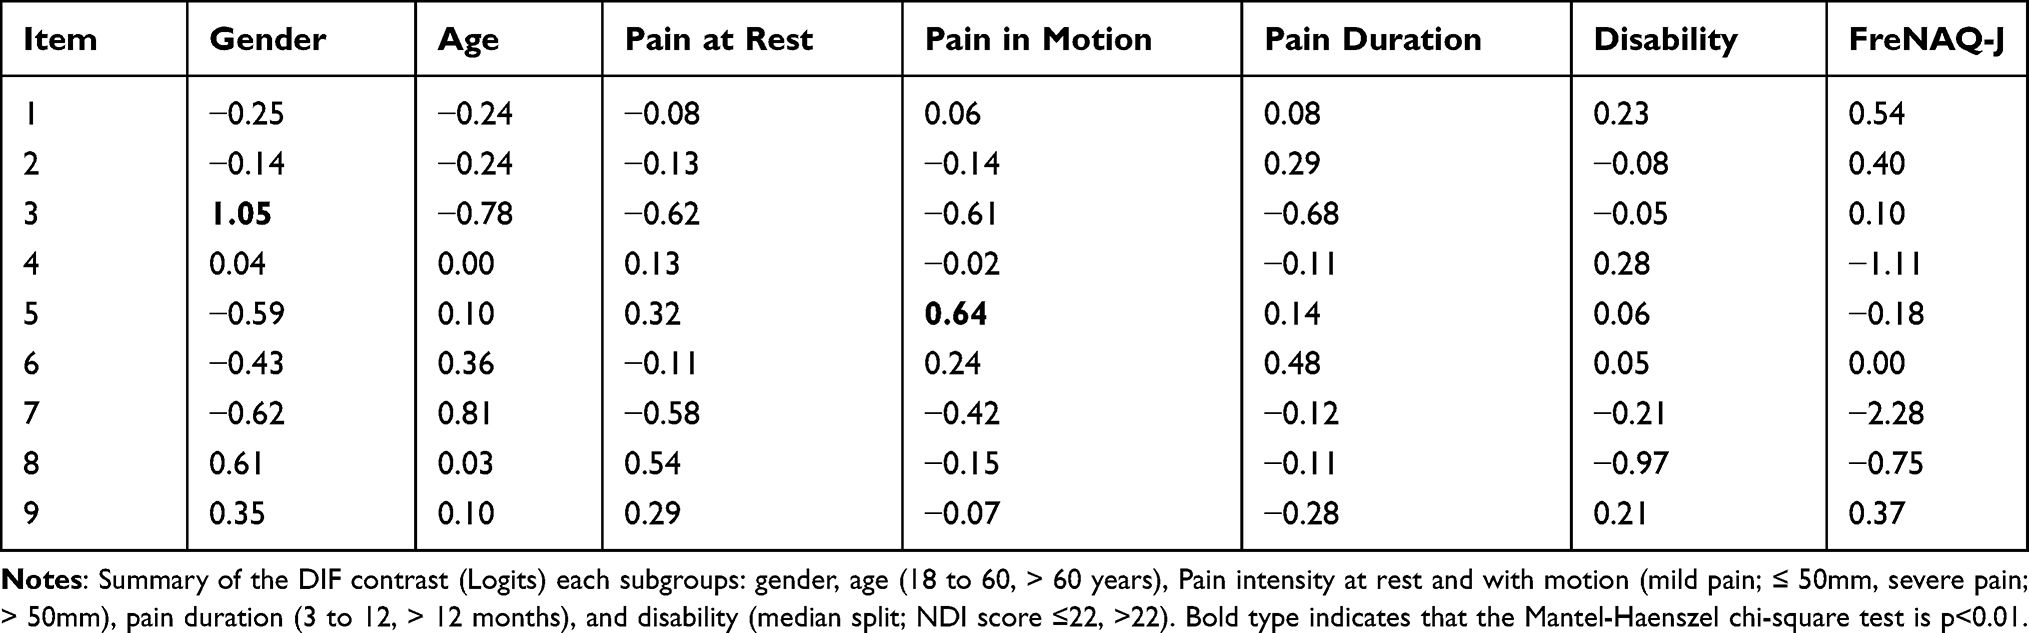 |
Table 4 Differential Item Functioning for the FreNAQ-J Items (n = 100) |
Test–Retest Reliability
Forty-three participants provided data at two weeks for the reliability assessment. There was excellent agreement between test and retest total scores, with an ICC3,1 of 0.81 (95% CI = 0.67 to 0.89).
Construct Validity
The FreNAQ-J was significantly correlated with, NDI (rho = 0.35), pain intensity with motion (rho = 0.36), TSK (rho = 0.28) and PCS (rho = 0.48; p < 0.008 for all), but not pain intensity at rest (rho = 0.23; p = 0.02) (Table 5).
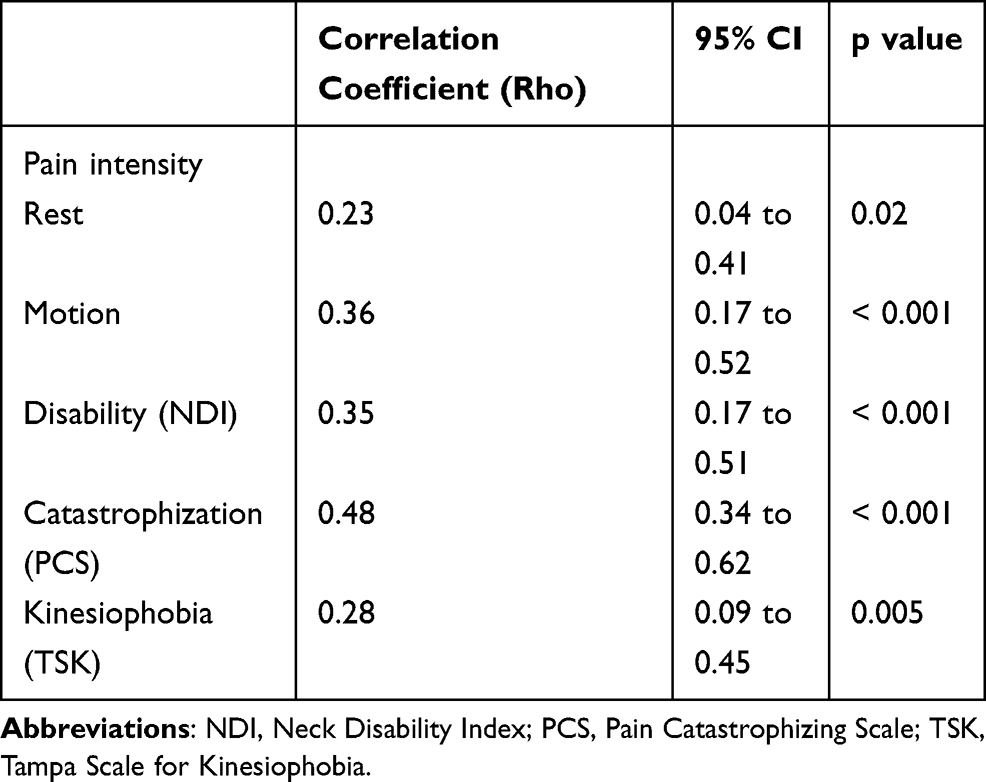 |
Table 5 Correlations Between the Total Score of the FreNAQ-J and Clinical Variables (n = 100) |
Re-Analysis After Excluding Misfit Participants
In response to the results of the person fit analysis, we removed misfitting cases from the data set and conducted a re-analysis. Figure 2B showed the relationship between FreNAQ-J items and person logit ratings for removed misfitting cases. The average person endorsability was −2.63 logits (SD = 1.69, range = −6.41 to 0.06), compared with default item endorsability average of 0 logits (SD = 0.99, range = −1.94 to 1.49). It shows that targeting worsened when removing misfitting cases. The percentages of category utilization were 47% (0 = Never), 32% (1 = Rarely), 14% (2 = Occasionally), 5% (3 = Often), and 1% (4 = Always). Each category has a distinct peak suggesting the categories are not disordered, that is, the step calibrations are ordered as expected (Figure 3B). In item fit statistics showed items 7 (Infit MNSQ = 1.13, Outfit MNSQ = 0.70) and 8 (Infit MNSQ = 1.36, Outfit MNSQ = 1.07) fit the Rasch model, but the positive misfit of item 9 remained (Infit MNSQ = 1.52, Outfit MNSQ = 1.56) (Table 3-part B). This indicates that the item characteristics of items 7 and 8 can be improved when the misfit case was removed compared to when all cases are included in the analysis. PCA of residuals continued to show unidimensionality (the eigenvalue of first contrast = 1.9). The average residual correlation was 0.17 and so the critical value was set to 0.37. None of the items obtained residual correlations exceeding the critical value. Internal consistency was still good with a person reliability value of 0.80 and Cronbach’s alpha of 0.85.
Discussion
The purpose of this study was to develop a Japanese version of a self-perception questionnaire specific to the neck for individuals with CNP and evaluate the validity and reliability of the scale using the Rasch analysis. Consistent with previous studies in other conditions,20,26 people with CNP endorsed the scale items with greater frequency than healthy controls. Perceptual impairments, while subtle, thus appear to be a feature of this condition. Interestingly, people with CNP in this study appear to report perceptual impairments with less frequency than those completing the Turkish version of the FreNAQ (FreNAQ-T).27 Since the demographic (age, gender, culture) and clinical status (pain, disability) of the participants are clearly different across the two studies, it is not possible to determine from the present study whether these results reflect differences between populations or are due to a function of the FreNAQ-J items. In regards to measurement, the FreNAQ-J was shown to have good internal consistency and test–retest reliability. That the data fit the Rasch model suggests the scale can be validly summed to provide a single measure of perceptual disturbance. While perceptual impairments are not frequently observed in many people with CNP, only five people (5%) scored zero and none had a full score, suggesting that the influence of the floor and ceiling effects are minimal. As noted in previous iterations of the scale, the FreNAQ-J items were shown to be relatively difficult to endorse suggesting it is better suited to assessing those with comparatively more frequent episodes of perceptual disturbance – which fits with its intended clinical purpose.
The results of the DTF demonstrated that people with CNP used the FreNAQ-J similarly to the way people with chronic low back pain used the FreBAQ-J,22 suggesting that there are similarities between the two disorders. The FreBAQ-J was developed around a theoretical construct of perceptual impairment,22 therefore the FreNAQ-J may cover the same linguistic representation of perceptual impairment. It should be noted, however, these comparisons are qualitative and not quantitative.
Rating categories complied with the set criteria for category functioning, and step measures endorsed monotonically from easy to hard across category responses as was seen for the FreBAQ-J,22 supporting proper category order. However, it should be noted that an indistinct threshold was observed between categories 3 “often” and 4 “always”. Such an issue can, at times, be due to respondents misunderstanding the category labels, an issue previously observed between categories 1 “rarely” and 2 “occasionally” in the FreBAQ21 and FreBAQ-J.22 In the case of this study, the difference in meaning between categories 3 “often” and 4 “always” are more obvious so it is unlikely to reflect a misinterpretation. This issue more likely reflects the data distribution because the two higher-end categories had lower endorsability (3, often = 6%; 4, Always = 2%). Nonetheless, the scale behaved in an expected manner, with persons with more frequent perceptual impairments scoring higher on each item, suggesting changes to the category structure of the scale are not necessary. Retaining the original category structure also has the advantage of enabling comparisons to be made with data already reported and ongoing studies that may use the scale. For these reasons, we decided to retain the categorical structure of the FreNAQ-J.
The internal consistency of the FreNAQ-J was good (Cronbach’s alpha of 0.81) and aligned with previous investigations of the FreBAQ-J (Cronbach’s alpha of 0.80)22 and was better than the FreNAQ-T (Cronbach’s alpha of 0.70).27 A person reliability of 0.75 indicates acceptable reliability, and suggests that it is suitable for group use.51 Also, the test–retest reliability of the FreNAQ-J was 0.81 (95% CI 0.67 to 0.89) and aligned with that of the FreBAQ-J in patients with low back pain 0.81 (95% CI 0.67 to 0.89), indicating the FreNAQ-J has excellent test–retest reliability. Based on these results, it is suggested that the FreNAQ-J has adequate psychometric properties for use in evaluating distorted body perception of patients with CNP in the Japanese population.
We observed that misfit in items 7, 8 and 9 of the FreNAQ-J indicating the participant’s response pattern departed from the expected value calculated from the Rasch probability model. Item 7 (My neck feels like it is enlarged (swollen)) was the most difficult to endorse for the CNP patients. There may be potential for misinterpretation of this question as the term swollen might be construed as acutely injured rather than being perceived as enlarged. A likely contribution to the misfitting of item 7 (My neck feels like it is enlarged (swollen)) and item 8 (My neck feels like it has shrunk) is that these two items are mutually exclusive, so unlike the other items in the scale participants may reasonably only endorse one of these two items. Item 9 (My neck feels lopsided (asymmetrical)) was the easiest to endorse, replicating previous findings for the FreBAQ21 and the FreBAQ-J.22
Overall, the sample used the FreNAQ-J as expected with only 11% of respondents displaying misfit. These misfitting individuals had significantly higher scores on the FreNAQ-J than the better fitting individuals but we found no obvious pattern in the response strings. Misfitting cases with haphazard responses (no obvious patterns) add to noise which is unhelpful in scale evaluation. Typically, removing them should improve fit. In fact, infit of both items 7 and 8 improves in reanalysis after excluding misfit persons. Furthermore, the local dependency observed between items 4 and 9 was also improved by excluding misfit persons. These results may support that some participants misinterpret these questions. To further examine the misfit of these participants to the Rasch model, we re-analyzed the data excluding misfitting cases. Re-analysis excluding the misfit participants revealed that some of them were affecting the issues in misfit items. In particular, this re-analysis appears to influence items 7 and 8, the conflicting ones. That their fit was improved with misfitting people removed highlights that some people do use the less common of the two items. Furthermore, worsened targeting in the re-analysis suggests that higher misfit participants report higher the FreNAQ-J scores than fit participants. In other words, these findings indicate that person who misfit were likely to have a relatively severe perceptual impairment who responded unexpectedly to either of these two items. Despite the three misfit items (Item 7, 8, and 9), the FreNAQ-J showed acceptable psychometric properties, including good internal consistency, excellent test–retest reliability, and unidimensionality. Therefore, it should be carefully considered whether these three items are eliminated from the neck pain version of the questionnaire, and further studies are necessary to determine the extent of the issue in CNP.
The results of DIF suggested that Item 3 (I need to focus all my attention on my neck to make it move the way I want it to) was significantly more difficult to endorse for women, and Item 5 (When performing everyday tasks, I am not sure exactly what position my neck is in) was significantly more difficult to endorse for participants with high levels of pain with motion. Interestingly, these statistically significant biases have not been observed in the FreBAQ21 or the FreBAQ-J.22 Therefore, there is a possibility that this may be a latent factor specific to the Japanese CNP population, but the present study could not investigate why such bias occurs as the sample size is relatively small. A second study with more participants is needed to provide a clear conclusion.
The FreNAQ-J total score was positively associated with pain intensity with motion (rho = 0.36), disability (rho = 0.35), catastrophizing (rho = 0.48) and kinesiophobia (rho = 0.28). Previous studies have suggested that body perception disturbance is associated with poor outcome and psychological factors in people with complex regional pain syndrome,68 and CLBP.69,70 The relationships demonstrated between body perception disturbance and clinical status in people with CNP supports the proposition of perception of the state of the body being important in the emergence of pain with motion and pain related disability.
There are a few limitations in this study. Firstly, the sample size was relatively small. Previous studies suggest that small sample size (n < 100) impacts on category disorder, targeting, and misfitting items.35 In this study, disordered category function, item misfit (7, 8, 9) and non-targeting might be influenced by the sample size. Further validation on a larger sample is needed, hence, the data presented here should be regarded as preliminary. Second, the FreNAQ-J showed an unexpectedly low score overall. That people with CNP score lower on this measure of perceptual dysfunction that other pain conditions could just be specific to this sample or may reflect the need to re-evaluate the scale items and perhaps consider additions to the scale that better capture perceptual dysfunction for the neck. Related to this, we did not conduct any pre-testing for cross-cultural adaptation (feedback on the comprehensibility, relevance, and time burden of the questions), a similar undertaking in the future might identify additional items that better capture perceptual dysfunction specific to the neck. Finally, future studies will need to follow up patient responses to FreNAQ-J items to better understand causal relationships between perceptual dysfunction and CNP.
The FreNAQ-J had acceptable internal consistency, unidimensionality, construct validity and good test–retest reliability, despite disadvantages such as disordered category function, misfit item, and non-targeting. Whether it proves to be a clinically useful tool requires further evaluation. The present study provides valuable new information to allow for further exploration of body perception dysfunction in people with CNP.
Conclusion
We developed the FreNAQ-J by modifying the FreBAQ-J. The FreNAQ-J fits the Rasch measurement model well and is suitable for use in people with CNP. The FreNAQ-J demonstrated discriminative validity and altered body perception was significantly related to clinical status in people with CNP and may be worth evaluating when managing people with CNP.
Data Sharing Statement
The datasets used and analyzed during the current study are available from the corresponding author.
Ethics Approval and Informed Consent
Ethics approval was obtained from the institutional ethics committee of Konan Women’s University. Written informed consent was obtained from all subjects prior to the study.
Acknowledgments
We thank Hirofumi Yamashita, Satoko Yono, Shohei Nakamura, Madoka Akinaga, Yuriko Nakazaki, Hitomi Miyachi, Akiko Kogi, and Yukiko Koyanagi for assistance with data collection. We would like to express my gratitude to Dr. Hidefumi Morinaga for allowing us to recruit patients who will cooperate with the experiment.
Author Contributions
All authors made a significant contribution to the work reported, whether that is in the conception, study design, execution, acquisition of data, analysis and interpretation, or in all these areas; took part in drafting, revising or critically reviewing the article; gave final approval of the version to be published; have agreed on the journal to which the article has been submitted; and agree to be accountable for all aspects of the work.
Disclosure
The authors report no conflicts of interest in this work.
References
1. Cohen SP. Epidemiology, diagnosis, and treatment of neck pain. Mayo Clinic Proc. 2015;90(2):284–299. doi:10.1016/j.mayocp.2014.09.008
2. Nomura S, Sakamoto H, Glenn S, et al. Population health and regional variations of disease burden in Japan, 1990-2015: a systematic subnational analysis for the Global Burden of Disease Study 2015. Lancet. 2017;390(10101):1521–1538.
3. Dimitriadis Z, Kapreli E, Strimpakos N, et al. Do psychological states associate with pain and disability in chronic neck pain patients? J Back Musculoskelet Rehabil. 2015;28(4):797–802.
4. Hogg-Johnson S, van der Velde G, Carroll LJ, et al. The burden and determinants of neck pain in the general population. J Manipulative Physiol Ther. 2009;32(2):S46–S60.
5. Flor H, Braun C, Elbert T, et al. Extensive reorganization of primary somatosensory cortex in chronic back pain patients. Neurosci Lett. 1997;224(1):5–8.
6. Vartiainen N, Kirveskari E, Kallio-Laine K, et al. Cortical reorganization in primary somatosensory cortex in patients with unilateral chronic pain. J Pain. 2009;10(8):854–859.
7. Harris AJ. Cortical origin of pathological pain. Lancet. 1999;354(9188):1464–1466.
8. Hotz-Boendermaker S, Marcar VL, Meier ML, et al. Reorganization in secondary somatosensory cortex in chronic low back pain patients. Spine (Phila Pa 1976). 2016;41(11):E667–E673.
9. Catley MJ, O’Connell NE, Berryman C, et al. Is tactile acuity altered in people with chronic pain? A systematic review and meta-analysis. J Pain. 2014;15(10):985–1000.
10. Moseley GL, Flor H. Targeting cortical representations in the treatment of chronic pain: a review. Neurorehabil Neural Repair. 2012;26(6):646–652.
11. Flor H, Denke C, Schaefer M, et al. Effect of sensory discrimination training on cortical reorganisation and phantom limb pain. Lancet. 2001;357(9270):1763–1764.
12. Harvie DS, Kelly J, Buckman H, et al. Tactile acuity testing at the neck: a comparison of methods. Musculoskeletal Sci Pract. 2017;32:23–30.
13. Friston K. The free-energy principle: a unified brain theory? Nat Rev Neurosci. 2010;11(2):127–138.
14. Van den Bergh BRH, van den Heuvel MI, Lahti M, et al. Prenatal developmental origins of behavior and mental health: the influence of maternal stress in pregnancy. Neurosci Biobehav Rev. 2017;S0149–7634(16):30734–30735. doi:10.1016/j.neubiorev.2017.07.003
15. Wiech K. Deconstructing the sensation of pain: the influence of cognitive processes on pain perception. Science. 2016;354(6312):584–587.
16. Lauche R, Cramer H, Haller H, et al. My back has shrunk: the influence of traditional cupping on body image in patients with chronic non-specific neck pain. Forsch Komplementarmed. 2012;19(2):68–74.
17. Moreira C, Bassi AR, Brandão MP, et al. Do patients with chronic pain have distorted body image and tactile dysfunction? Eur J Physiother. 2017;19(4):215–221.
18. Stanton TR, Leake HB, Chalmers KJ, et al. Evidence of impaired proprioception in chronic, idiopathic neck pain: systematic review and meta-analysis. Phys Ther. 2016;96(6):876–887.
19. Treleaven J. Sensorimotor disturbances in neck disorders affecting postural stability, head and eye movement control–Part 2: case studies. Man Ther. 2008;13(3):266–275.
20. Wand BM, James M, Abbaszadeh S, et al. Assessing self-perception in patients with chronic low back pain: development of a back-specific body-perception questionnaire. J Back Musculoskelet Rehabil. 2014;27(4):463–473.
21. Wand BM, Catley MJ, Rabey MI, et al. Disrupted self-perception in people with chronic low back pain. Further evaluation of the Fremantle Back Awareness Questionnaire. J Pain. 2016;17(9):1001–1012.
22. Nishigami T, Mibu A, Tanaka K, et al. Validation of the Japanese Version of the Fremantle Back Awareness Questionnaire in Patients with Low Back Pain. Pain Pract. 2018;18(2):170–179.
23. Janssens L, Goossens N, Wand BM, et al. The development of the Dutch version of the Fremantle Back Awareness Questionnaire. Musculoskelet Sci Pract. 2017;32:84–91.
24. Ehrenbrusthoff K, Ryan CG, Grüneberg C, et al. The translation, validity and reliability of the German version of the Fremantle Back Awareness Questionnaire. PLoS One. 2018;13(10):e0205244.
25. Erol E, Yildiz A, Yildiz R, et al. Reliability and validity of the turkish version of the Fremantle back awareness questionnaire. Spine (Phila Pa 1976). 2019;44(9):E549–E554.
26. Nishigami T, Mibu A, Tanaka K, et al. Development and psychometric properties of knee-specific body-perception questionnaire in people with knee osteoarthritis: the Fremantle Knee Awareness Questionnaire. PLoS One. 2017;12(6):e0179225.
27. Onan D, Gokmen D, Ulger O. The fremantle neck awareness questionnaire in chronic neck pain patients: turkish version, validity and reliability study. Spine (Phila Pa 1976). 2020;45(3):E163–E169.
28. Azimi P, Shahzadi S, Azhari S, et al. A validation study of the Iranian version of STarT Back Screening Tool (SBST) in lumbar central canal stenosis patients. J Orthop Sci. 2014;19(2):213–217.
29. Hill JC, Afolabi EK, Lewis M, et al. Does a modified STarT Back Tool predict outcome with a broader group of musculoskeletal patients than back pain? A secondary analysis of cohort data. BMJ Open. 2016;6(10):e012445.
30. Butera KA, Lentz TA, Beneciuk JM, et al. Preliminary evaluation of a Modified STarT back screening tool across different musculoskeletal pain conditions. Phys Ther. 2016;96(8):1251–1261.
31. Bier JD, Ostelo RWJG, Koes BW, et al. Validity and reproducibility of the modified STarT Back Tool (Dutch version) for patients with neck pain in primary care. Musculoskelet Sci Pract. 2017;31:22–29.
32. George SZ, Stryker SE. Fear-avoidance beliefs and clinical outcomes for patients seeking outpatient physical therapy for musculoskeletal pain conditions. J Orthop Sport Phys Ther. 2011;41(4):249–259.
33. Mintken PE, Cleland JA, Whitman JM, et al. Psychometric properties of the fear-avoidance beliefs questionnaire and tampa scale of Kinesiophobia in patients with shoulder pain. Arch Phys Med Rehabil. 2010;91(7):1128–1136.
34. Askary-Ashtiani A, Ebrahimi-Takamejani I, Torkaman G, et al. Reliability and validity of the persian versions of the fear avoidance beliefs questionnaire and tampa scale of kinesiophobia in patients with neck pain. Spine (Phila Pa 1976). 2014;39(18):E1095–E1102.
35. Chen WH, Lenderking W, Jin Y, et al. Is Rasch model analysis applicable in small sample size pilot studies for assessing item characteristics? An example using PROMIS pain behavior item bank data. Qual Life Res. 2014;23(2):485–493.
36. Boonstra AM, Preuper HR, Reneman MF, et al. Reliability and validity of the visual analogue scale for disability in patients with chronic musculoskeletal pain. Int J Rehabil Res. 2008;31(2):165–169.
37. Carlsson AM. Assessment of chronic pain. I. Aspects of the reliability and validity of the visual analogue scale. Pain. 1983;16(1):87–101.
38. Sullivan M, Bishop S, Pivik J. The pain catastrophizing scale: development and validation. Psychol Assess. 1995;7(4):524–532.
39. Matsuoka H, Sakano Y. Assessment of cognitive aspect of pain: development, reliability, and validation of Japanese version of Pain Catastrophizing Scale. Jpn J Psychosom Med. 2007;47(2):95–102.
40. Vlaeyen JW, Kole-Snijders AM, Boeren RG, et al. Fear of movement/(re)injury in chronic low back pain and its relation to behavioral performance. Pain. 1995;62(3):363–372.
41. Kikuchi N, Matsudaira K, Sawada T, et al. Psychometric properties of the Japanese version of the Tampa Scale for Kinesiophobia (TSK-J) in patients with whiplash neck injury pain and/or low back pain. J Orthop Sci. 2015;20(6):985–992.
42. Vernon H. The Neck Disability Index: patient assessment and outcome monitoring in whiplash. J Musculoskelet Pain. 1996;4(4):95–104.
43. Nakamaru K, Vernon H, Aizawa J, et al. Crosscultural adaptation, reliability, and validity of the Japanese version of the neck disability index. Spine (Phila Pa 1976). 2012;37(21):E1343–E1347.
44. Kanda Y. Investigation of the freely-available easy-to-use software “EZR” (Easy R) for medical statistics. Bone Marrow Transplant. 2013;48(3):452–458.
45. Rasch G. Probabilistic Models for Some Intelligence and Attainment Tests. Chicago, IL: University of Chicago; 1960.
46. Smith EV
47. Wright BD, Linacre JM. Reasonable mean-square fit values. Rasch Meas Transac. 1994;8:370.
48. Chien TW, Hsu SY, Tai C, et al. Using Rasch analysis to validate the revised PSQI to assess sleep disorders in Taiwan’s hi-tech workers. Community Ment Health J. 2008;44(6):417–425.
49. Smith EV. Detecting and evaluating the impact of multidimensionality using item fit statistics and principal component analysis of residuals. J Appl Meas. 2002;3(2):205–231.
50. Raîche G. Critical eigenvalue sizes in standardized residual principal components analysis. Rasch Measurement Trans. 2005;19(1):1012.
51. Tennant A, Conaghan PG. The Rasch measurement model in rheumatology: what is it and why use it? When should it be applied, and what should one look for in a Rasch paper? Arthritis Care Res (Hoboken). 2007;57(8):1358–1362.
52. Christensen KB, Makransky G, Horton M. Critical values for Yen’s Q3: identification of local dependence in the Rasch model using residual correlations. Appl Psychol Meas. 2017;41(3):178–194.
53. Fox CM, Jones JA. Uses of Rasch modeling in counseling psychology research. J Couns Psychol. 1998;45(1):30.
54. Curtis DD. Misfits: people and their problems. What Might It All Mean? Int Educ J. 2001;2(4):91–99.
55. Cronbach LJ, Shavelson RJ. My current thoughts on coefficient alpha and successor procedures. Educ Psychol Meas. 2004;64(3):391–418.
56. Taber KS. The use of Cronbach’s alpha when developing and reporting research instruments in science education. Res Sci Educ. 2018;48(6):1273–1296.
57. Linacre JM, User’s A. Guide to WINSTEPS. Chicago: MESA Press; 2005.
58. United Nations. Department of Economic and Social Affairs, Population Division. World Population Prospects: The 2017 Revision. 2017;21.
59. Page B, Paterson D, Young D, et al. Pain from primary inguinal hernia and the effect of repair on pain. Br J Surg. 2002;89(10):1315–1318.
60. Veal FC, Bereznicki LR, Thompson AJ, et al. Subacute pain as a predictor of long-term pain following orthopedic surgery: an Australian prospective 12 month observational cohort study. Medicine (Baltimore). 2015;94(36):e1498.
61. Preis MA, Vögtle E, Dreyer N, et al. Long-term outcomes of a multimodal day-clinic treatment for chronic pain under the conditions of Routine Care. Pain Res Manage. 2018;9472104.
62. Chou R, Turner JA, Devine EB, et al. The effectiveness and risks of long-term opioid therapy for chronic pain: a systematic review for a National Institutes of Health Pathways to Prevention Workshop. Ann Intern Med. 2015;162(4):276–286.
63. Mantel N, Haenszel W. Statistical aspects of the analysis of data from retrospective studies of disease. J Natl Cancer Inst. 1959;22(4):719–748.
64. Hungi N. Employing the Rasch Model to Detect Biased Items. Applied Rasch Measurement: A Book of Exemplars. Dordrecht: Springer; 2005.
65. Bartko JJ. The Intraclass correlation coefficient as a measure of reliability. Psychol Rep. 1966;19(1):3–11.
66. Koo TK, Li MY. Cracking the Code: providing insight into the fundamentals of research and evidence-based practice a guideline of selecting and reporting intraclass correlation coefficients for reliability research. J Chiropr Med. 2016;15(2):155–163.
67. Akoglu H. User’s guide to correlation coefficients. Turkish J Emerg Med. 2018;18(3):91–93.
68. Birklein F, Schlereth T. Complex regional pain syndrome—significant progress in understanding. Pain. 2015;156(Suppl 1):S94–S103.
69. Lotze M, Moseley GL. Role of distorted body image in pain. Curr Rheumatol Rep. 2007;9(6):488–496.
70. Nishigami T, Mibu A, Osumi M, et al. Are tactile acuity and clinical symptoms related to differences in perceived body image in patients with chronic nonspecific lower back pain? Man Ther. 2015;20(1):63–67.
 © 2021 The Author(s). This work is published and licensed by Dove Medical Press Limited. The full terms of this license are available at https://www.dovepress.com/terms.php and incorporate the Creative Commons Attribution - Non Commercial (unported, v3.0) License.
By accessing the work you hereby accept the Terms. Non-commercial uses of the work are permitted without any further permission from Dove Medical Press Limited, provided the work is properly attributed. For permission for commercial use of this work, please see paragraphs 4.2 and 5 of our Terms.
© 2021 The Author(s). This work is published and licensed by Dove Medical Press Limited. The full terms of this license are available at https://www.dovepress.com/terms.php and incorporate the Creative Commons Attribution - Non Commercial (unported, v3.0) License.
By accessing the work you hereby accept the Terms. Non-commercial uses of the work are permitted without any further permission from Dove Medical Press Limited, provided the work is properly attributed. For permission for commercial use of this work, please see paragraphs 4.2 and 5 of our Terms.