")
Back to Journals » International Journal of Women's Health » Volume 14
Development and Psychometric Testing of a New Short-Form of the Premenstrual Symptoms Questionnaire (PSQ-S)
Authors Takeda T , Yoshimi K , Kai S, Inoue F
Received 2 April 2022
Accepted for publication 7 July 2022
Published 14 July 2022 Volume 2022:14 Pages 899—911
DOI https://doi.org/10.2147/IJWH.S369151
Checked for plagiarism Yes
Review by Single anonymous peer review
Peer reviewer comments 2
Editor who approved publication: Professor Elie Al-Chaer
Takashi Takeda, Kana Yoshimi, Sayaka Kai, Fumi Inoue
Research Institute of Traditional Asian Medicine, Kindai University, Osaka-Sayama, Japan
Correspondence: Takashi Takeda, Research Institute of Traditional Asian Medicine, Kindai University, Osaka-Sayama, Japan, Tel +81-72-366-0221 (Ext. 3393), Fax +81-72-366-6661, Email [email protected]
Purpose: The Premenstrual Symptoms Questionnaire (PSQ) is a patient-reported outcome measurement tool for premenstrual symptoms. Although the PSQ is a very useful tool with 14 items to screen for a wide variety of premenstrual symptoms, not everyone will respond to all the questions. Fewer questions would be less burdensome on the respondents. We aimed to develop and analyze the psychometric properties of a short-form of the PSQ (PSQ-S).
Patients and Methods: The study participants were from an earlier study with a sample of 1388 female students. We reanalyzed data collected from 922 students with regular menstrual cycles who completed the PSQ, premenstrual dysphoric disorder (PMDD) scale, Somatic Symptom Scale-8 (SSS-8), and numerical rating scale (NRS) for menstrual pain. First, we selected nine items for the PSQ-S based on the results of the corrected item-total correlation analysis. The PSQ-S was then analyzed for reliability and validity using the classical test theory. Moreover, item response theory was applied to test the psychometric properties of the PSQ-S.
Results: Cronbach’s α for the PSQ-S score was 0.93. Principal component factor analysis revealed a one-factor model. Confirmatory factor analysis showed that the one-factor model was a good fit. The PSQ-S total score was strongly correlated with the PSQ total score, PMDD scale score, and SSS-8 score (r=0.978, 0.854, and 0.648, respectively) and moderately correlated with the NRS (r=0.437). Item response theory analyses showed that the constructs and items of the PSQ-S had satisfactory discrimination, difficulty parameters, item information curves, and test information curves. Receiver operating characteristic curve analysis revealed a cut-off score of ≥ 22 for suspected premenstrual disorders based on the total PSQ-S score.
Conclusion: The PSQ-S, consisting of nine items from the PSQ, had sufficient reliability and validity and could be a convenient assessment tool for premenstrual symptoms in routine clinical practice.
Keywords: menstruation, premenstrual disorders, validity testing, item response theory
Introduction
Premenstrual symptoms are characterized by a variety of psycho-physical symptoms that occur before menstruation and have a significant impact on the quality of life of women.1 Two pathological conditions of premenstrual symptoms are premenstrual syndrome (PMS), in the field of obstetrics and gynecology, and premenstrual dysphoric disorder (PMDD), in the field of psychiatry.2,3 PMDD is PMS but with particularly severe psychiatric symptoms. Additionally, the concept of premenstrual disorders (PMDs), which considers PMS and PMDD as a continuum, has recently been proposed.4 Past reports have indicated that the frequency of PMS is 20% to 30%5,6 and the frequency of PMDD is 1.2% to 6.4%,6–8 indicating that PMDs impair the quality of life of many women of reproductive age. Thus, the impact of PMDs on women’s health is sufficiently large that research on PMDs is warranted.
The pathophysiology of PMDs remains unclear, but the involvement of hormonal changes, brain monoamines such as GABA and serotonin, and poor lifestyle has been proposed.9–12 Moreover, no biomarkers have been identified for diagnosis; instead, a daily diary such as the Calendar of Premenstrual Experience13 and the Daily Record of Severity of Problems (DRSP),14 in which premenstrual symptoms are described, is the gold standard for accurate diagnosis. We have also translated and used the Japanese version of the DRSP (DRSP-J) in clinical trials,15,16 but the daily description is burdensome for participants and may be difficult to use in large-scale epidemiological studies.
The Premenstrual Symptoms Screening Tool (PSST),17 consisting of 17 items, is widely used to screen for PMDs.18–20 In Japan, the PMDD scale, a validated and reliable screening tool, is available and is essentially a Japanese version of the PSST.21 _ENREF_15 We have also developed a separate screening tool, the Premenstrual Symptoms Questionnaire (PSQ), which consists of 14 items and has been used in several epidemiological studies.12,22,23 Our previous study confirmed the reliability and validity of the PSQ and its high concordance and correlation with the PMDD scale.24 The PSQ was correlated with somatic symptoms as assessed by the Somatic Symptom Scale-8 (SSS-8) and also with the intensity of menstrual pain as assessed by the numerical rating scale (NRS).
To date, many patient-reported outcome measurement (PROM) tools have been used, and short versions have also been developed. For example, the MOS 36-Item Short-Form Health Survey (SF-36) is widely used in health assessment scales,25 and its shorter version, the SF-12, has also been developed.26 While the shortened version has the advantage of reducing the burden on participants and improving the response rate, concerns exist regarding the deviation of the evaluation goals from the original version. Traditionally, classical test theory (CTT) has been used to analyze the psychometric characteristics of PROMs, but it is not always sufficient. As a complementary CTT, item response theory (IRT) has recently been used, allowing a more detailed examination of individual survey items.27
We have used the 14-item PSQ in epidemiological studies, and although it is simpler than the 17-item PSST and PMDD scales, it was still often found to yield non-responses or incomplete responses, which is not acceptable at present. The aim of this study was to develop a short version of the PSQ (PSQ-S) and assess the psychometric properties of this form using CTT and IRT.
Materials and Methods
Settings and Participants
This study used a subset of previously published data, the 2019 Japan Northeast Adolescent Cohort, in which PSQ reliability validation was conducted.24 This involved a school-based survey that was conducted in December 2019 on all 1388 Japanese female students from two public high schools in Sendai. All data were collected anonymously. A total of 1190 students responded to the questionnaire, including 995 students with regular menstrual cycles (25–38 days), within three months. Of these, we included 922 students who completed all items on the PSQ, PMDD scale, SSS-8, and NRS (Figure 1).
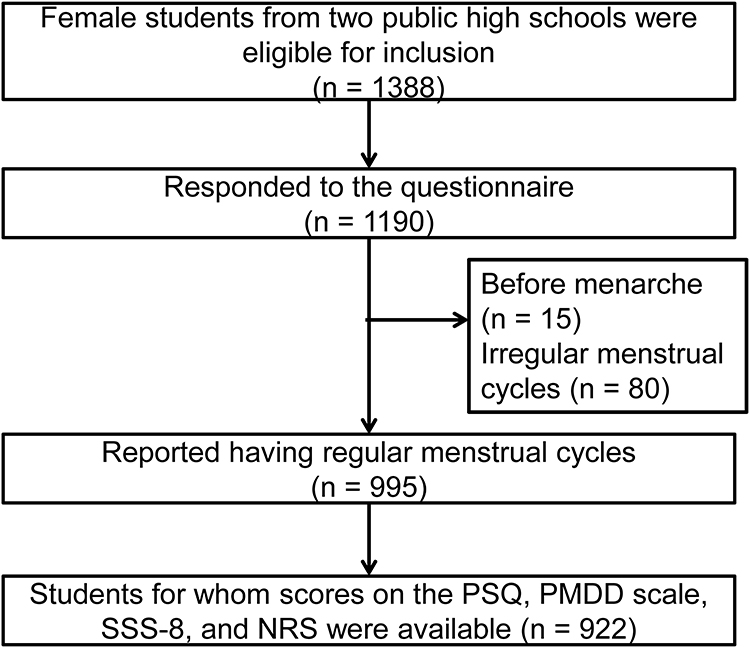 |
Figure 1 Flow chart of the study. Abbreviations: PSQ, Premenstrual Symptoms Questionnaire; PMDD, premenstrual dysphoric disorder; SSS-8, Somatic Symptom Scale-8; NRS, numerical rating scale. |
Questionnaire
The Premenstrual Symptoms Questionnaire and the Premenstrual Dysphoric Disorder Scale
The PSQ consists of 11 items corresponding to symptoms listed in the Diagnostic and Statistical Manual of Mental Disorders (DSM)-5 criteria for PMDD and three items measuring the functional impairment of social and life activities as used in the DRSP-J. Of the 14 items in the PSQ, A1–A11 correspond to premenstrual symptoms, and B1–B3 represent the degree of social disability based on these 11 items. We further divided the students into three groups based on their premenstrual symptoms, according to the criteria reported by Steiner et al: PMDD, moderate-to-severe PMS, and no/mild PMS.17,22 Using this criterion, we reanalyzed the original data set and classified PMS severity into three levels as shown in Table 1. As in our previous study, moderate-to-severe PMS and PMDD were grouped together as the PMDs group.24
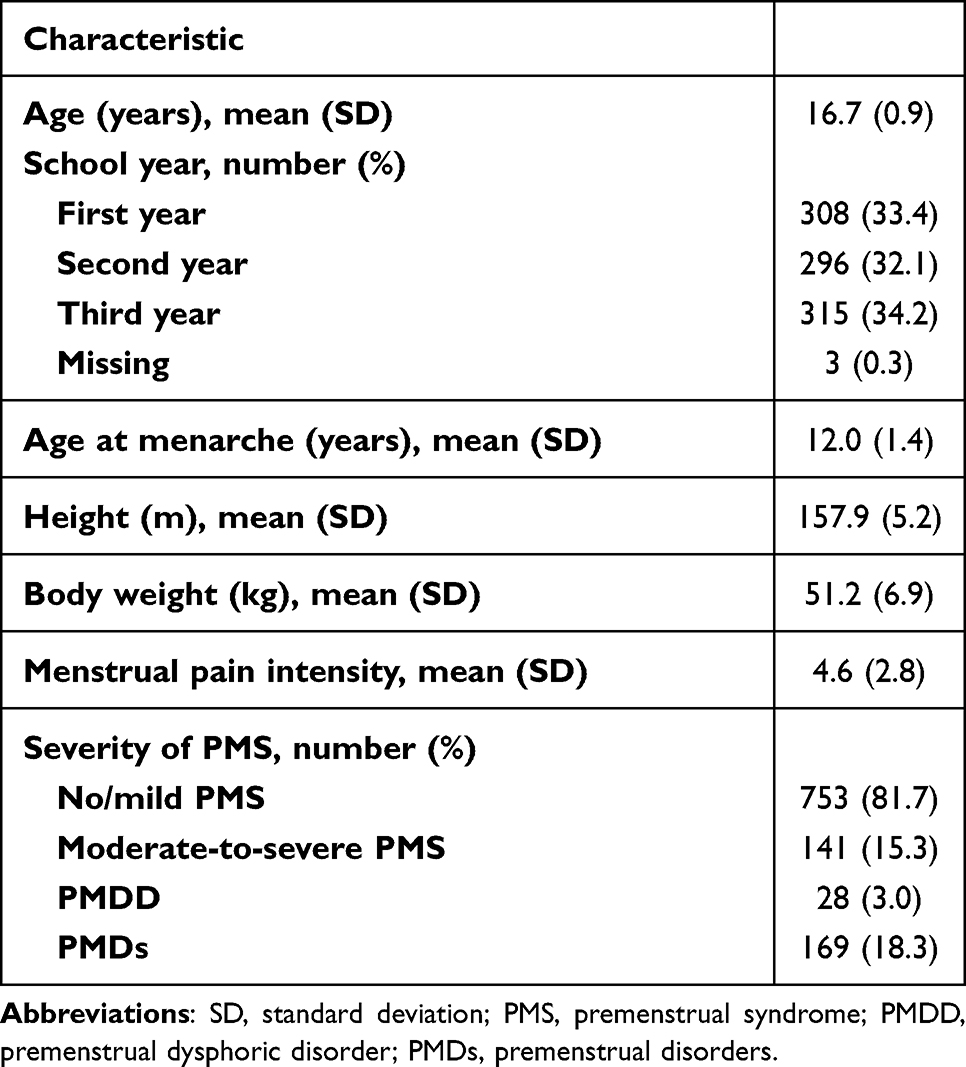 |
Table 1 Characteristics of the Study Participants (n = 922) |
The PMDD scale consists of 12 symptoms listed in the DSM-5 criteria for PMDD, with “Insomnia or hypersomnia” divided into “Insomnia” and “Hypersomnia” as separate symptoms out of the 11 items listed in the DSM-5. The PMDD scale also includes five items on functional impairment, which are the same as those used in the PSST.12
The severity of premenstrual symptoms and the interference of these symptoms in activities were rated as 1: not at all, 2: mild, 3: moderate, and 4: severe for both the PSQ and PMDD scales. The PSQ score was calculated as the sum of 14 items (ranging from 14 to 56). The PMDD scale score was calculated in the same way, using the sum of 17 items (ranging from 17 to 68). Cronbach’s alpha of the PSQ in the previous study24 and this study were 0.930 and 0.929, respectively, and that of the PMDD scale was 0.932 in this study.
Menstrual Pain Intensity
Menstrual pain intensity was evaluated using an NRS. The NRS requires study participants to rate the severity of their menstrual pain over the past three months on a scale of 0 (no pain) to 10 (the strongest pain imaginable) on average.
Somatic Symptom Scale-8
The Japanese version of the SSS-8 is highly reliable and validated.28 The SSS-8 consists of eight items: (1) gastrointestinal disorders, (2) back pain, (3) arm, leg, or joint pain, (4) headache, (5) chest pain and shortness of breath, (6) dizziness, (7) fatigue and low energy, and (8) sleep disturbance, each with a 5-point response format (0–4), resulting in a score ranging from 0 to 32. Our previous study showed a high correlation between the SSS-8 and PSQ total scores.24 Cronbach’s alpha of the SSS-8 was 0.869 in this study.
Study Variables
For each participant, we extracted information from the original data set about age, school year, body weight, height, age at menarche, PSQ, PMDD scale, SSS-8, and NRS.
Statistical Analysis
Measures of central tendency and proportions were used to summarize participant characteristics. For item reduction, corrected item-total correlation (CITC) and Cronbach’s α if the item was deleted (CAID) were applied. We selected nine items from the original PSQ to develop the PSQ-S. The internal consistency reliability of the PSQ-S was assessed using Cronbach’s α. The factor structure of the PSQ-S was examined using principal component analysis (PCA). The eigenvalue >1.0 and scree plot criteria were used to determine the number of factors to be extracted. The PCA showed a one-factor model; therefore, we performed confirmatory factor analysis (CFA) with a one-factor structure. Model fit was evaluated using the following fit indices: the chi-square/degree of freedom (χ2/df) test, goodness-of-fit index (GFI), adjusted GFI (AGFI), Tucker–Lewis index (TLI), comparative fit index (CFI), root mean square residual error of approximation (RMSEA), standardized root mean square residual (SRMR), and Akaike’s information criterion (AIC). We also performed a CFA on the original PSQ. In this analysis, we employed a one-factor model based on the results of the previous study.24 Model fit was evaluated using the same fit indices as for the PSQ-S.
χ2/df values <5 indicate a good fit.29 GFI and AGFI values >0.90 indicate a good fit.30 TLI and CFI values close to 0.95 indicate a relatively good fit.31 RMSEA values <0.08 and SRMR values <0.09 suggest a good fit.30 The AIC is used to compare the goodness of fit of the model; a smaller AIC indicates a better alignment between the goodness of fit and parsimony.
Correlations were analyzed using Spearman’s rank correlation coefficient. To supplement CTT, we added an analysis using the IRT model. The advantages of IRT are that it assesses the quality of items and measures the accuracy at different levels of the latent trait (ie, severity of premenstrual symptoms in this study). For IRT analysis, the graded response model (GRM) was used.32 The IRT is assumed to be unifactorial, and we confirmed the one-dimensionality of the PSQ-S using the PCA. Discrimination parameters, difficulty parameters, item characteristic curves (ICCs), and item information curves (IICs) were analyzed to examine item properties. The item information of all items was combined to create a test information function and a test information curve (TIC). For discrimination, parameter (a) values <0.65 are low, 0.65–1.34 are moderate, and >1.34 are high.33 For difficulty, parameter (also known as threshold parameter) (b) values typically range from −3 to +3.34 The difficulty parameter for each item indicates the level of latent characteristics (in this study, the severity of premenstrual symptoms) required to select a particular response category with a probability of 50% or greater. The diagnostic performance of the PSQ-S for PMD classification by the PSQ was examined using receiver operating characteristic curve (ROC) analysis. The area under the curve (AUC) was calculated. AUC values ≥0.9 are considered excellent.35 The cut-off score was determined using the Youden index.
All statistical analyses, except for the CFA and IRT analyses, were performed using JMP Pro 16.0.0 (SAS, Cary, NC, USA). The CFA analysis was performed using IBM SPSS version 26 (IBM Corp., Armonk, NY, USA), and the IRT analysis was performed using Easy Estimation 2.1.5.36 Statistical significance was set at P < 0.05 (two-tailed tests).
Results
Participant Characteristics
The characteristics of the study population are shown in Table 1. The severity of PMS was classified according to the PSQ criteria.
PSQ-S Development and Internal Consistency
To develop the PSQ-S, we applied CITC and CAID analyses (Table 2). We selected nine of the 14 items from the original PSQ in the order of decreasing CITC value. As a result, items with CITC values <0.6 were deleted. The included items were depressed mood, anxiety or tension, tearfulness, anger or irritability, decreased interest, difficulty concentrating, fatigue or lack of energy, feeling overwhelmed, work efficiency, and productivity. We defined the application of these nine items as the PSQ-S. The CITC values of the selected items were generally >0.7. Cronbach’s α was 0.93, and the PSQ-S and PSQ had good internal consistency. We confirmed that all the CAID data in the PSQ-S were <0.93; therefore, we confirmed that no further manipulations would improve internal consistency.
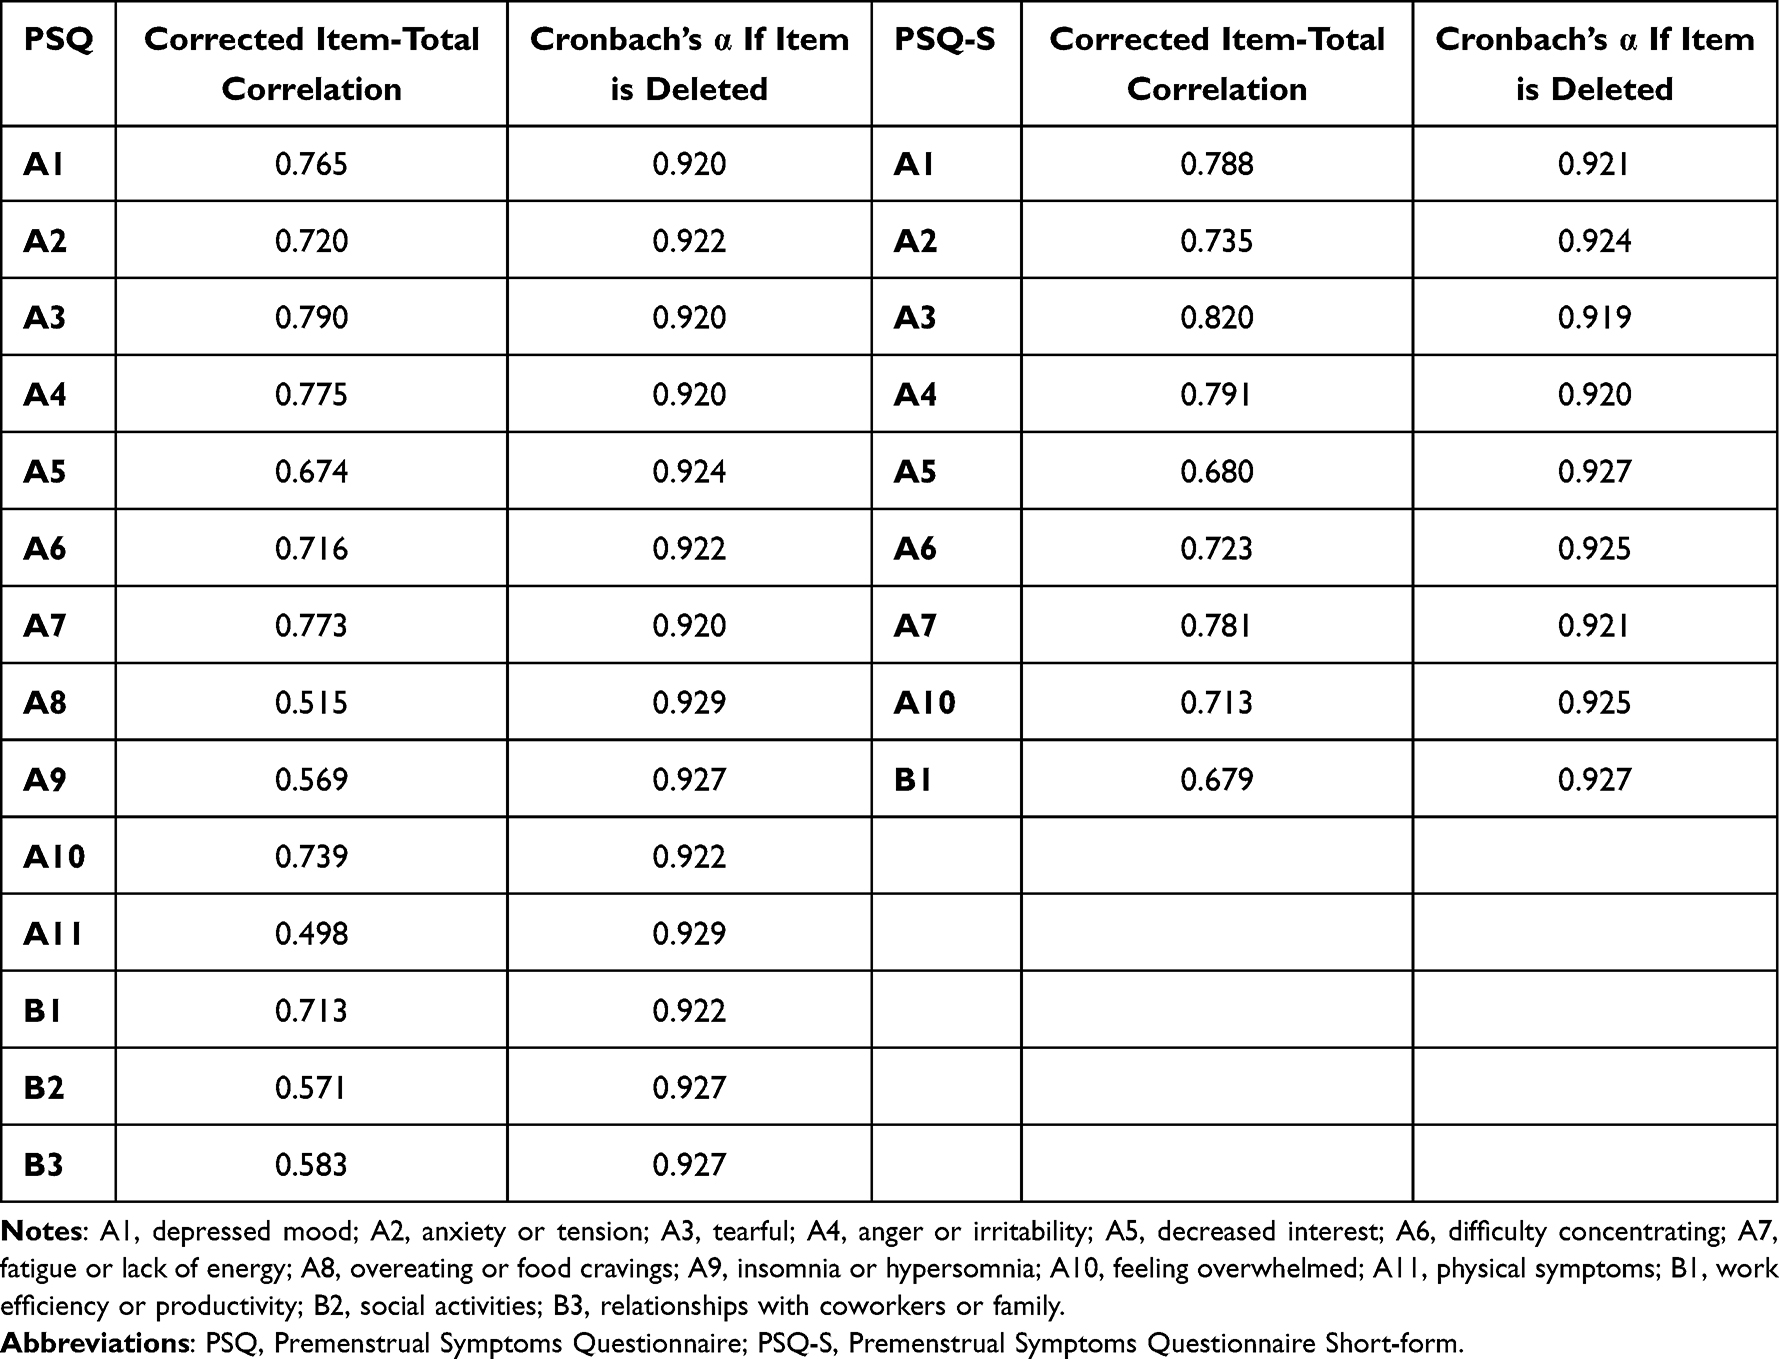 |
Table 2 Corrected Item-Total Correlation and Cronbach’S α if Item is Deleted for the PSQ and PSQ-S |
PSQ-S Factor Structure
Next, we performed PCA to explore the factor structure of the PSQ-S. The eigenvalue >1.0 criterium showed one factor, and the scree plot also identified one factor (Figure 2).
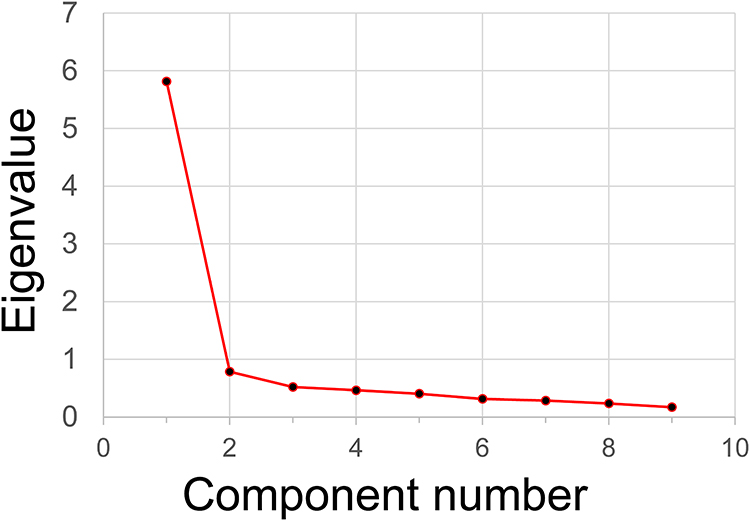 |
Figure 2 Scree plot for the PSQ-S. Abbreviation: PSQ-S, Premenstrual Symptoms Questionnaire Short-form. |
To further analyze the factorial validity of the PSQ-S, we performed CFA (Figure 3A). CFA for the original PSQ was also performed for comparison with the findings for the PSQ-S (Figure 3B). As shown in Table 3, the one-factor model showed a good fit for several indicators. These values showed a similar or better fit than the measurements in the one-factor model of the PSQ.
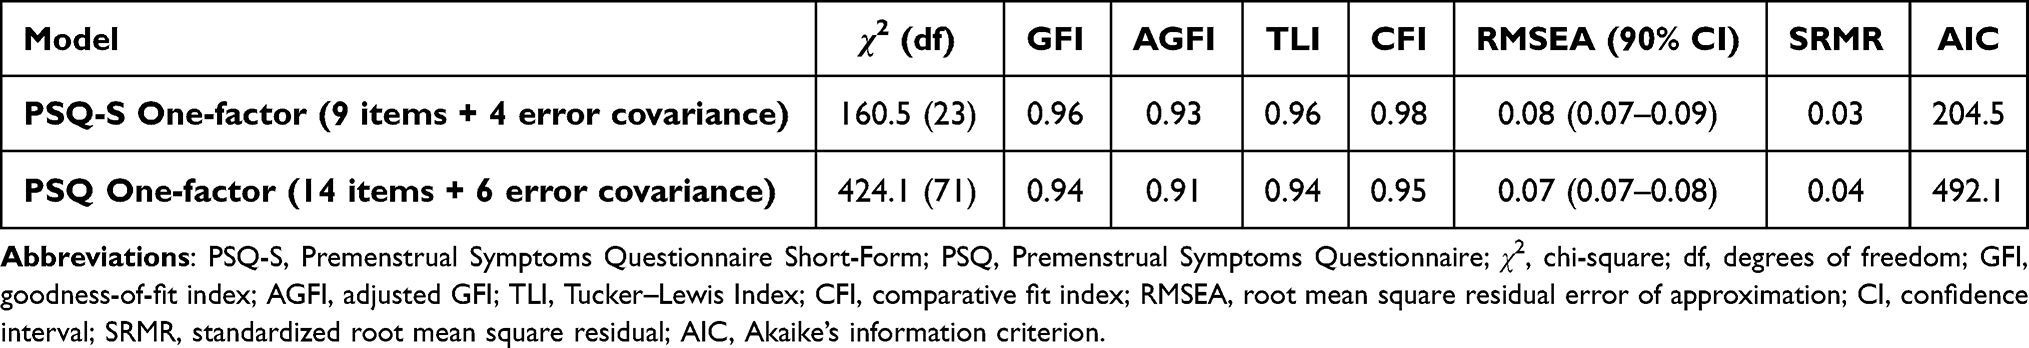 |
Table 3 Goodness-of-Fit Summary of the PSQ-S and the PSQ |
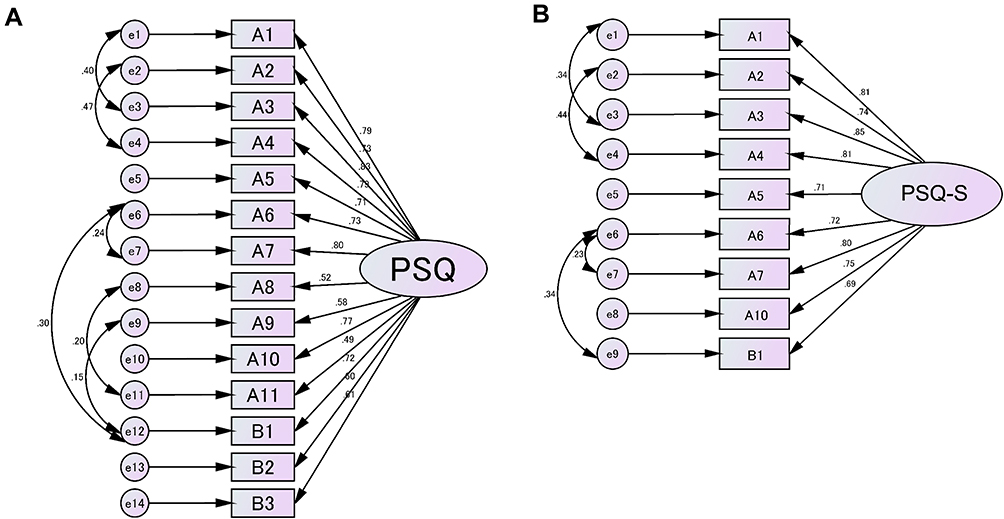 |
Figure 3 One-factor model of the PSQ-S (A) and the PSQ (B) and standardized parameter estimates. Abbreviations: PSQ-S, Premenstrual Symptoms Questionnaire Short-form; PSQ, Premenstrual Symptoms Questionnaire; A1, depressed mood; A2, anxiety or tension; A3, tearful; A4, anger or irritability; A5, decreased interest; A6, difficulty concentrating; A7, fatigue or lack of energy; A8, overeating or food cravings; A9, insomnia or hypersomnia; A10, feeling overwhelmed; A11, physical symptoms such as tender breasts, feeling of bloating, headache, joint or muscle pain, or weight gain; B1, work efficiency or productivity; B2, social activities; B3, relationships with coworkers or family. |
Correlation Between PSQ-S and PSQ, PMDD, SSS, and Menstrual Pain
Next, we analyzed the consistency of premenstrual symptom assessment between the PSQ-S and PSQ. The PSQ-S total score was very highly correlated with the PSQ total score (Spearman’s r = 0.978, P < 0.0001) (Table 4). We further compared the correlation coefficients of the PSQ-S with those of the PMDD, SSS-8, and NRS. The PSQ-S total score was correlated with the PMDD scale total score (r = 0.854), the SSS-8 total score (r = 0.648), and the NRS (r = 0.437). The PSQ-S was found to correlate almost equally with the PSQ for these parameters.
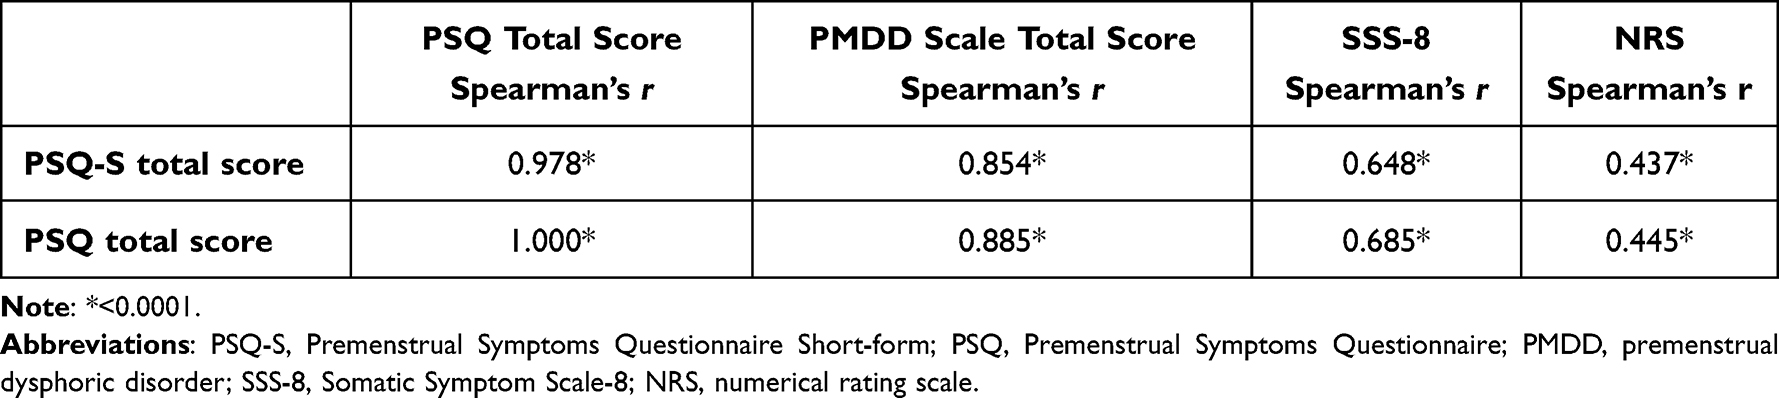 |
Table 4 Correlation Coefficients for the PSQ-S, the PSQ, the PMDD Scale, the SSS-8, and the NRS |
Assessing the Psychometric Properties of the PSQ-S Using CTT and IRT
We further applied IRT analysis to complement CTT analysis. Table 5 shows the parameterization of the PSQ and the PSQ-S based on the GRM. The discrimination and difficulty parameters are also listed. The items deleted from the PSQ (A8, A9, A11, B2, and B3) had the lowest discrimination parameters among the 14 items. This means that removing these items according to CTT is beneficial according to the IRT analysis. The discrimination parameters of the PSQ-S ranged from 2.13 to 4.26, demonstrating very high discrimination levels. The difficulty parameters ranged from −0.75 to 0.39 for the first parameter, from 0.38 to 1.25 for the second parameter, and from 1.37 to 2.30 for the third parameter. All difficulty parameters in the PSQ-S were incrementally positive.
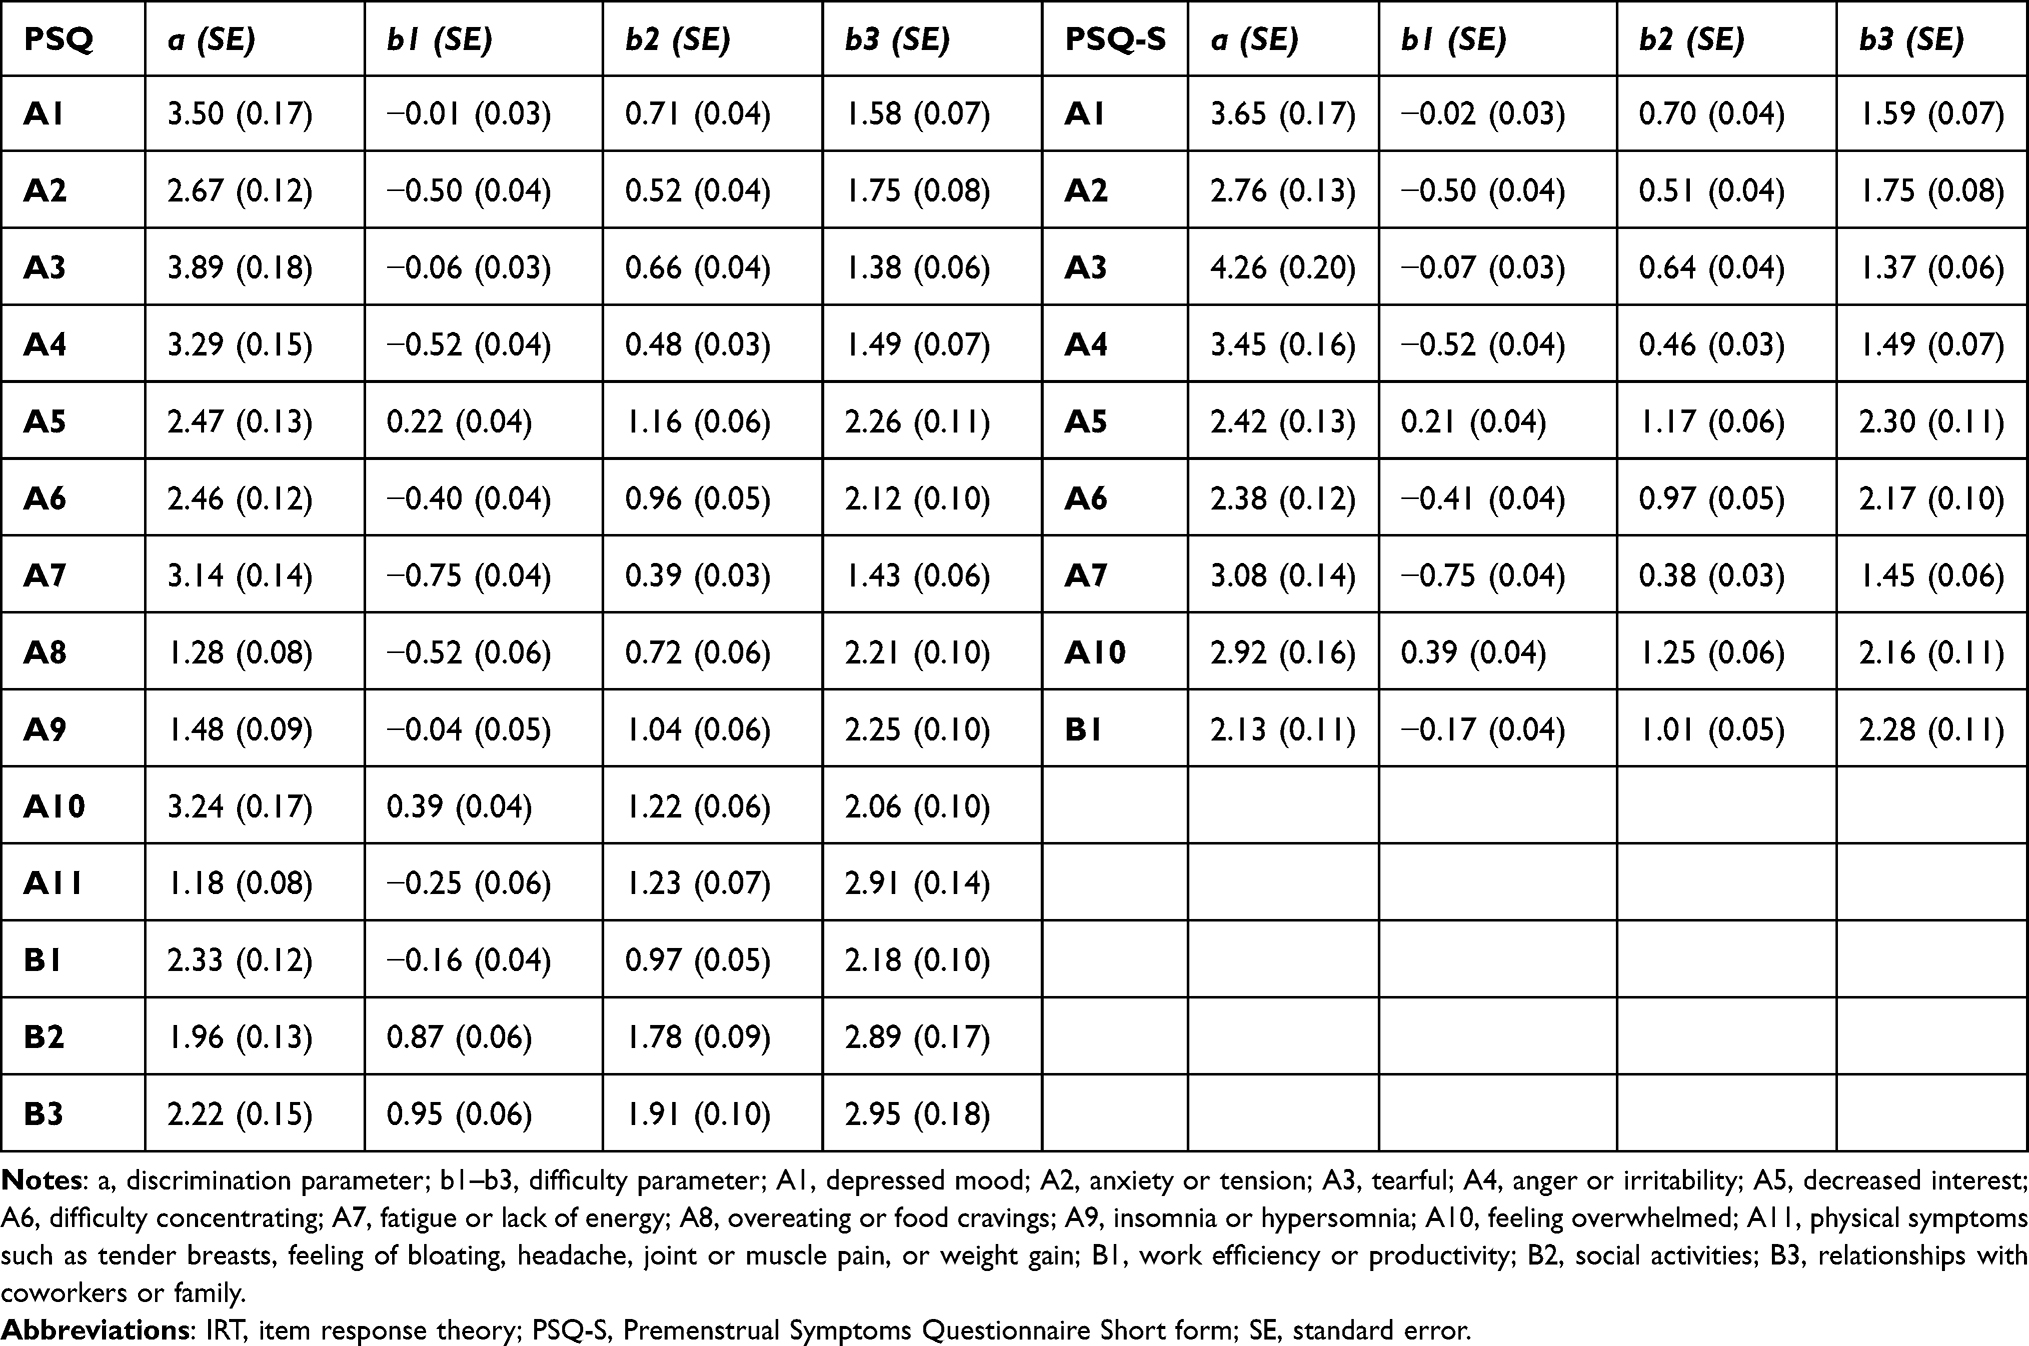 |
Table 5 IRT Parameter of the PSQ and the PSQ-S |
Figure 4 shows the ICCs of each item. All items appeared to be monotonic in shape, which means that for each item on the PSQ-S, a rating of 4 indicated a high degree of discrimination. Furthermore, the respondents provided all four answers; thus, none of the variables were dichotomous.
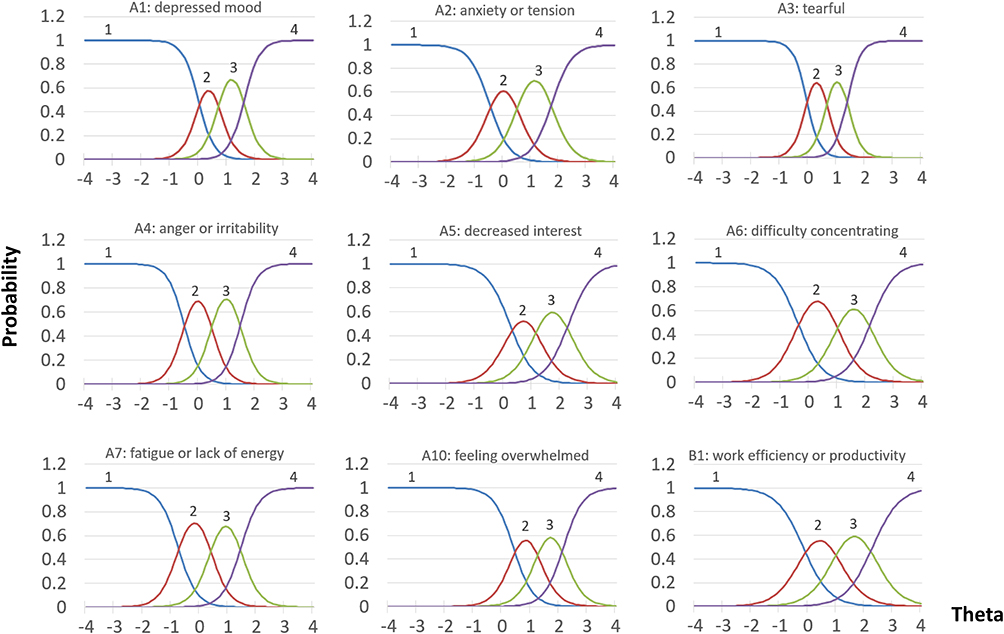 |
Figure 4 Item characteristic curves for the PSQ-S. Theta at the horizontal axis indicates the trait level (severity of premenstrual symptoms). The vertical axis shows the probability for an answer in each of the PSQ-S questionnaire items. Four curves (from 1 to 4) indicate each possible response: curve 1, not at all; curve 2, mild; curve 3, moderate; curve 4, severe. Curve 1, the leftmost curve, shows the probability that each individual would choose 1 out of 4 ratings at different trait levels. The curve shows that the lower the trait level, the higher the probability of choosing 1. Curve 4, the rightmost curve, shows the probability that each individual would choose 4 out of 4 ratings at different trait levels. The curve shows that the higher the trait level, the higher the probability of choosing 4. Curves 2 and 3 between them are unimodal, indicating that at a certain range of trait levels, 2 or 3 is chosen. Abbreviation: PSQ-S, Premenstrual Symptoms Questionnaire Short-form. Notes: A1, depressed mood; A2, anxiety or tension; A3, tearful; A4, anger or irritability; A5, decreased interest; A6, difficulty concentrating; A7, fatigue or lack of energy; A10, feeling overwhelmed; B1, work efficiency or productivity. |
Figure 5 shows the IIC for each item. Item A3 (tearful) showed a peaked information curve and provided a large amount of information within a narrow range of trait values. Contrarily, item B1 (work efficiency or productivity) showed a flat-shaped information curve and provided a low amount of information across a wide range of trait values.
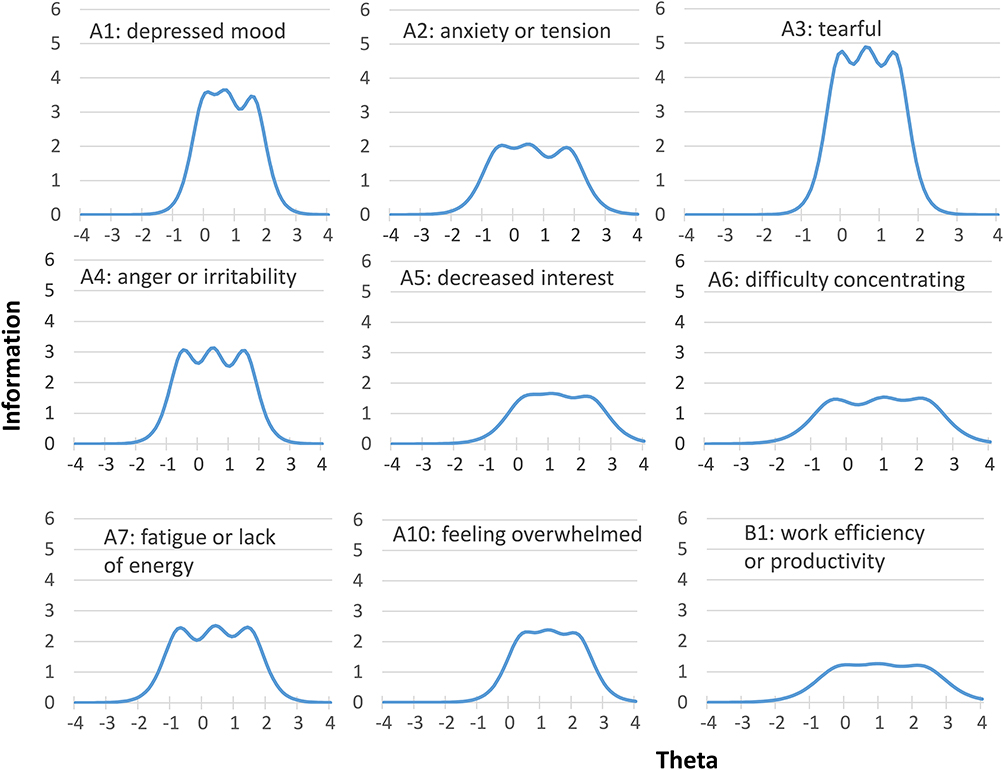 |
Figure 5 Item information curves for the PSQ-S. Theta at the horizontal axis indicates the trait level (severity of premenstrual symptoms). The vertical axis shows the amount of information for an answer in each of the PSQ-S questionnaire items. The higher the curve, the greater the amount of information in a narrower range of trait levels and, consequently, the more highly discriminating the item is. On the other hand, items with low discrimination power show a flat curve across a wide range of trait levels, which means that they are less informative. Abbreviation: PSQ-S, Premenstrual Symptoms Questionnaire Short-form. Notes: A1, depressed mood; A2, anxiety or tension; A3, tearful; A4, anger or irritability; A5, decreased interest; A6, difficulty concentrating; A7, fatigue or lack of energy; A10, feeling overwhelmed; B1, work efficiency or productivity. |
Next, we analyzed the TIC for the PSQ and PSQ-S (Figure 6). The TIC and standard error (SE) are shown. Both the PSQ and PSQ-S were maximally informative for subjects with above-average premenstrual symptoms, judging from the maximum TIC and minimum SE. The maximum information contents of the PSQ and PSQ-S were 25.8 and 22.6, respectively. While the original PSQ had 14 questions, the PSQ-S reduced the number of questions to nine, a reduction to 64.3%, while retaining 87.5% of the total information. Furthermore, in the TIC pattern, the PSQ and PSQ-S had similar shapes.
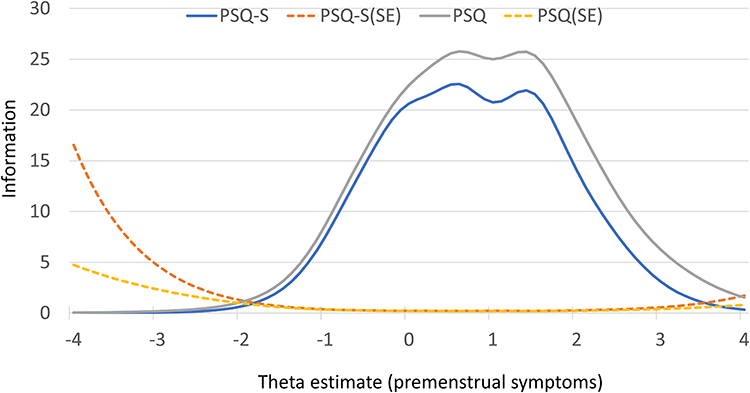 |
Figure 6 Test information curve and standard error of measurement for the PSQ and PSQ-S. Theta at the horizontal axis indicates the trait level (severity of premenstrual symptoms). The vertical axis shows the amount of summative test information for the PSQ and the PSQ-S. Abbreviations: PSQ, Premenstrual Symptoms Questionnaire; PSQ-S, Premenstrual Symptoms Questionnaire Short-form; SE, standard error. |
Predictive Performance of PSQ-S for PMDs Classification
We further analyzed the ROC curve to compare the No/Mild PMS group with the PMDs group (Table 6). The AUC for the PSQ-S total score was 0.960, indicating excellent discrimination. The PSQ-S total score ranges from 9 to 36. The cut-off score was determined to be 22 points, with a balanced ratio of sensitivity and specificity.
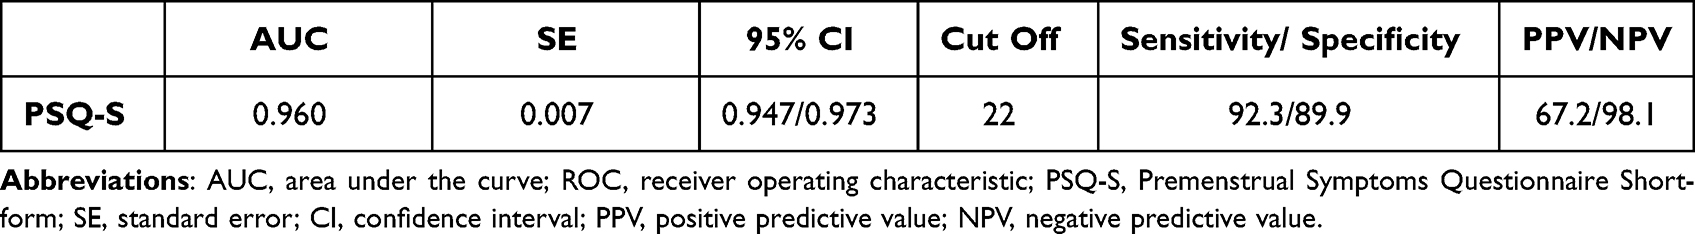 |
Table 6 AUC of the ROC Analysis for the PSQ-S |
Discussion
The aim of this study was to develop a short version of the PSQ and assess the psychometric properties of this form using CTT and IRT. In this study, we developed an abbreviated version of the PSQ and found the PSQ-S to be both valid and reliable. Moreover, a clinically useful cut-off point of the PSQ-S total score for PMDs was determined using ROC analysis.
A previous report showed that the PSQ fits one-factor and two-factor models well in CFA.24 For the PSQ-S, a one-factor model showed a good fit for several indicators. Typically, AIC is used to compare the goodness-of-fit of a model. A smaller AIC indicates better adjustment between the goodness-of-fit and parsimony. Comparing the AIC value in the one-factor model of the PSQ (492.1) with the AIC value of the PSQ-S in the present study (204.5), the PSQ-S was shown to fit the one-factor model better than the original PSQ.24
Regarding CTT, the PSQ-S showed almost the same ability as the PSQ in all aspects of reliability, structural validity, and concurrent validity. Although the PSQ-S showed slightly lower correlations with the PMDD scale total score, the SSS-8 total score, and the NRS than the PSQ, the correlations of the PSQ and PSQ-S with these scales were almost equal. The PSQ-S consists of eight items related to premenstrual symptoms and one item related to social impairment. The items related to premenstrual symptoms do not include physical symptoms; however, this is because the PSQ was originally developed based on the diagnostic criteria for PMDD in the DSM, which emphasizes psychiatric symptoms over physical symptoms. In assessing the medical condition of PMDs, it is considered less important to assess physical symptoms, and it would not be a problem if items assessing physical symptoms were missing from the PSQ-S.
The IRT is considered a modern theory of measurement, has been used for the characterization of various measures, and complements the traditional CTT.37 One advantage of IRT over CTT is that IRT is test- and sample-independent.27 By supplementing CTT with IRT, more meaningful parameter inferences could be made. A detailed psychometric review of IRT revealed the following points. The five items removed from the PSQ based on CTT were the five lowest-ranking items in the evaluation according to the discrimination parameter in IRT. The discrimination parameter for each item in the PSQ-S was >2.13, indicating that all items contributed to the test information. The ICC for each item showed that all items performed well in the IRT analysis. Based on these results, we determined that there was no need to revise the items selected for the PSQ-S. While preparing this manuscript, an IRT analysis of the PSST was reported.38 According to this report, “fatigue/lack of energy”, “depressed mood”, “feeling overwhelmed or out of control”, “concentration”, and “decreased interest” were the best discrimination parameters, and these items had the highest information value. Given that all these items were selected for the PSQ-S, it is clear that the results of the PSST analysis are consistent with our current results.
The IRT analysis indicated that both the PSQ and PSQ-S were maximally informative in subjects with above-average premenstrual symptoms. In the clinical setting, healthcare providers should not be interested in premenstrual symptoms that are less severe than average, and these PSQ and PSQ-S characteristics should not be a problem in clinical practice for screening premenstrual symptoms. The clinical use of a validated test such as the PSQ and PSQ-S is beneficial in that it reduces the number of false positives and false negatives. In the PSST and PSQ, severity can be classified into three groups depending on the severity of symptoms, degree of social impairment, and number and type of impaired items: no symptoms/mild PMS, moderate-to-severe PMS, and PMDD. However, this operation is complex and requires some degree of proficiency. In the present study, ROC analysis was used to determine a cut-off value for discriminating suspected cases of PMDs, which further improves the convenience of PMD screening.
Despite the development of the PSQ-S and its recognition of adequate psychometrical validity, which is a strengths of the current study, there are also limitations. First, the study was limited to high-school students aged 15–19 years. Our previous study revealed that the onset of PMDs occurs from early adolescence;39 PMDs in adolescents are known to be as or more prevalent than in adults.40,41 We believe that future studies in adults are warranted as adolescents are in the middle of their developmental stages and are considered a special population. Second, the study only included Japanese students. Japanese adolescents are under considerable stress due to the long hours of study required for entrance exams to demanding schools, a peculiarity that makes them different from students in other countries. Finally, the PSQ-S was less informative in subjects with weaker-than-average premenstrual symptoms. While this may not pose a problem for using the PSQ-S as a screening tool for PMDs, it may be problematic in cohort studies or studies that examine trends in treatment effects. Future studies should analyze longitudinal measurement properties.
Conclusion
This study demonstrated favorable psychometric properties of the PSQ-S, a shortened version of the PSQ, in Japanese adolescents. The use of the shortened version is expected to reduce the burden of testing and to be further utilized as a screening tool for PMDs in clinical and epidemiological studies. Owing to the simplicity of the PSQ-S, its routine use is recommended in clinical practice.
Data Sharing Statement
The data obtained in this study are available from the corresponding author upon request.
Ethics Approval and Informed Consent
This study was conducted in accordance with the principles of the Declaration of Helsinki. The trial protocol was approved by the Ethics Committee of Kindai University (approval number: 31-149). The participating students provided informed consent prior to completing the survey. The ethics committee approved a waiver of parental informed consent because the students’ intention to participate could be confirmed, and the data were anonymized and contained no identifiable personal information about the respondents. The decision not to obtain parental informed consent was in accordance with the Ethical Guidelines for Medical and Health Research Involving Human Subjects enforced by Japan’s Ministry of Education, Culture, Sports, Science and Technology and Japan’s Ministry of Health, Labour and Welfare.
Author Contributions
All authors made substantial contributions to the conception and design, acquisition of data, or analysis and interpretation of the data; took part in drafting the article or revising it critically for important intellectual content; agreed to submit to the current journal; gave final approval of the version to be published; and agreed to be accountable for all aspects of the work.
Funding
No funding was received for the publication of this study.
Disclosure
Prof. Dr. Takashi Takeda reports personal fees from Tsumura Co., Ltd., personal fees from Otsuka Pharmaceutical Co., Ltd., personal fees from Bayer Pharma Co., Ltd., outside the submitted work. The authors report no other conflicts of interest in this work.
References
1. Yonkers KA, Simoni MK. Premenstrual disorders. Am J Obstet Gynecol. 2018;218(1):68–74. doi:10.1016/j.ajog.2017.05.045
2. Green LJ, O’Brien PM, Panay N, Craig M. Management of premenstrual syndrome: green-top guideline no. 48. BJOG. 2017;124(3):e73–e105. doi:10.1111/1471-0528.14260
3. American Psychiatric Association. Diagnostic and Statistical Manual of Mental Disorders.
4. O’Brien PM, Backstrom T, Brown C, et al. Towards a consensus on diagnostic criteria, measurement and trial design of the premenstrual disorders: the ISPMD Montreal consensus. Arch Womens Ment Health. 2011;14(1):13–21. doi:10.1007/s00737-010-0201-3
5. Borenstein JE, Dean BB, Leifke E, Korner P, Yonkers KA. Differences in symptom scores and health outcomes in premenstrual syndrome. J Womens Health. 2007;16(8):1139–1144. doi:10.1089/jwh.2006.0230
6. Qiao M, Zhang H, Liu H, et al. Prevalence of premenstrual syndrome and premenstrual dysphoric disorder in a population-based sample in China. Eur J Obstet Gynecol Reprod Biol. 2012;162(1):83–86. doi:10.1016/j.ejogrb.2012.01.017
7. Cohen LS, Soares CN, Otto MW, Sweeney BH, Liberman RF, Harlow BL. Prevalence and predictors of premenstrual dysphoric disorder (PMDD) in older premenopausal women: the Harvard study of moods and cycles. J Affect Disorders. 2002;70(2):125–132. doi:10.1016/S0165-0327(01)00458-X
8. Gehlert S, Song I, Chang C-H, Hartlage S. The prevalence of premenstrual dysphoric disorder in a randomly selected group of urban and rural women. Psychol Med. 2009;39(1):129–136. doi:10.1017/S003329170800322X
9. Hantsoo L, Epperson CN. Allopregnanolone in premenstrual dysphoric disorder (PMDD): evidence for dysregulated sensitivity to GABA-A receptor modulating neuroactive steroids across the menstrual cycle. Neurobiol Stress. 2020;12:100213. doi:10.1016/j.ynstr.2020.100213
10. Grady-Weliky TA. Clinical practice. Premenstrual dysphoric disorder. N Engl J Med. 2003;348(5):433–438. doi:10.1056/NEJMcp012067
11. Bixo M, Ekberg K, Poromaa IS, et al. Treatment of premenstrual dysphoric disorder with the GABA (A) receptor modulating steroid antagonist sepranolone (UC1010)-A randomized controlled trial. Psychoneuroendocrinology. 2017;80:46–55. doi:10.1016/j.psyneuen.2017.02.031
12. Yoshimi K, Shiina M, Takeda T. Lifestyle factors associated with premenstrual syndrome: a cross-sectional study of Japanese high school students. J Pediatr Adolesc Gynecol. 2019;32(6):590–595. doi:10.1016/j.jpag.2019.09.001
13. Mortola JF, Girton L, Beck L, Yen SS. Diagnosis of premenstrual syndrome by a simple, prospective, and reliable instrument: the calendar of premenstrual experiences. Obstet Gynecol. 1990;76(2):302–307.
14. Endicott J, Nee J, Harrison W. Daily record of severity of problems (DRSP): reliability and validity. Arch Womens Ment Health. 2006;9(1):41–49. doi:10.1007/s00737-005-0103-y
15. Takeda T, Kai S, Yoshimi K. Psychometric testing of the Japanese version of the daily record of severity of problems among Japanese women. Int J Womens Health. 2021;13:361–367. doi:10.2147/IJWH.S301260
16. Takeda T, Chiba Y. Evaluation of a natural S-equol supplement in treating premenstrual symptoms and the effect of the gut microbiota: an open-label pilot study. Neuropsychopharmacol Rep. 2022;42:127–134. doi:10.1002/npr2.12234
17. Steiner M, Macdougall M, Brown E. The premenstrual symptoms screening tool (PSST) for clinicians. Arch Womens Ment Health. 2003;6(3):203–209. doi:10.1007/s00737-003-0018-4
18. Hariri FZ, Moghaddam-Banaem L, Siah Bazi S, Saki Malehi A, Montazeri A. The Iranian version of the premenstrual symptoms screening tool (PSST): a validation study. Arch Womens Ment Health. 2013;16(6):531–537. doi:10.1007/s00737-013-0375-6
19. Pacitti F, Iorio C, Riccobono G, Iannitelli A, Pompili A. Assessment of premenstrual symptoms: validation of the Italian version of the premenstrual symptoms screening Tool. Riv Psichiatr. 2021;56(5):246–253. doi:10.1708/3681.36672
20. Mahfoud Z, Emam R, Anchassi D, et al. Premenstrual dysphoric disorder in Arab women: validation and cultural adaptation of the Arabic version of the premenstrual screening tool. Women Health. 2019;59(6):631–645. doi:10.1080/03630242.2018.1539433
21. Miyaoka Y, Akimoto Y, Ueda K, et al. Fulfillment of the premenstrual dysphoric disorder criteria confirmed using a self-rating questionnaire among Japanese women with depressive disorders. Biopsychosoc Med. 2011;5:5. doi:10.1186/1751-0759-5-5
22. Takeda T, Tasaka K, Sakata M, Murata Y. Prevalence of premenstrual syndrome and premenstrual dysphoric disorder in Japanese women. Arch Womens Ment Health. 2006;9(4):209–212. doi:10.1007/s00737-006-0137-9
23. Takeda T, Koga S, Yaegashi N. Prevalence of premenstrual syndrome and premenstrual dysphoric disorder in Japanese high school students. Arch Womens Ment Health. 2010;13(6):535–537. doi:10.1007/s00737-010-0181-3
24. Takeda T, Yoshimi K, Yamada K. Psychometric testing of the premenstrual symptoms questionnaire and the association between perceived injustice and premenstrual symptoms: a cross-sectional study among Japanese high school students. Int J Womens Health. 2020;12:755–763. doi:10.2147/IJWH.S269392
25. Ware JJE, Sherbourne CD. The MOS 36-item short-form health survey (SF-36). I. Conceptual framework and item selection. Med Care. 1992;30:473–483. doi:10.1097/00005650-199206000-00002
26. Ware JJE, Kosinski M, Keller SD. A 12-item short-form health survey: construction of scales and preliminary tests of reliability and validity. Med Care. 1996;34:220–233. doi:10.1097/00005650-199603000-00003
27. Jabrayilov R, Emons WHM, Sijtsma K. Comparison of classical test theory and item response theory in individual change assessment. Appl Psychol Meas. 2016;40(8):559–572. doi:10.1177/0146621616664046
28. Matsudaira K, Oka H, Kawaguchi M, et al. Development of a Japanese version of the somatic symptom scale-8: psychometric validity and internal consistency. Gen Hosp Psychiatry. 2017;45:7–11. doi:10.1016/j.genhosppsych.2016.12.002
29. Marsh HW, Hocevar D. Application of confirmatory factor analysis to the study of self-concept: first- and higher order factor models and their invariance across groups. Psychol Bull. 1985;97(3):562–582. doi:10.1037/0033-2909.97.3.562
30. Hooper DCJ, Mullen MR. Structural equation modelling: guidelines for determining model fit. Electron J Bus Res Methods. 2008;6(1):53–60.
31. Hu L-T, Bentler PM. Cutoff criteria for fit indexes in covariance structure analysis: conventional criteria versus new alternatives. Struct Equ Model. 1999;6(1):1–55. doi:10.1080/10705519909540118
32. Samejima F. Estimation of latent ability using a response pattern of graded scores. Psychometrika Monogr Suppl. 1969;34:100.
33. Baker FB. The Basics of Item Response Theory.
34. Toland MD. Practical guide to conducting an item response theory analysis. J Early Adolesc. 2014;34(1):120–151. doi:10.1177/0272431613511332
35. Youngstrom EA. A primer on receiver operating characteristic analysis and diagnostic efficiency statistics for pediatric psychology: we are ready to ROC. J Pediatr Psychol. 2014;39(2):204–221. doi:10.1093/jpepsy/jst062
36. Kumagai R. Development of IRT analysis programs for beginners: easyEstimation series. Jpn J Res Test. 2009;5(1):107–118.
37. Neal DJ, Corbin WR, Fromme K. Measurement of alcohol-related consequences among high school and college students: application of item response models to the rutgers alcohol problem index. Psychol Assess. 2006;18(4):402–414. doi:10.1037/1040-3590.18.4.402
38. Sliwerski A, Koszalkowska K. The influence of depression on biased diagnosis of premenstrual syndrome and premenstrual dysphoric disorder by the PSST inventory. Life. 2021;11:1278. doi:10.3390/life11111278
39. Yoshimi K, Matsumura N, Takeda T. When and how do adolescent girls in Japan become aware of premenstrual symptoms from menarche? A cross-sectional study among senior high school students. BMJ Open. 2021;11(8):e045215–e045215. doi:10.1136/bmjopen-2020-045215
40. Steiner M, Peer M, Palova E, Freeman EW, Macdougall M, Soares CN. The premenstrual symptoms screening tool revised for adolescents (PSST-A): prevalence of severe PMS and premenstrual dysphoric disorder in adolescents. Arch Womens Ment Health. 2011;14(1):77–81. doi:10.1007/s00737-010-0202-2
41. Kitamura M, Takeda T, Koga S, Nagase S, Yaegashi N. Relationship between premenstrual symptoms and dysmenorrhea in Japanese high school students. Arch Womens Ment Health. 2012;15(2):131–133. doi:10.1007/s00737-012-0266-2
 © 2022 The Author(s). This work is published and licensed by Dove Medical Press Limited. The full terms of this license are available at https://www.dovepress.com/terms.php and incorporate the Creative Commons Attribution - Non Commercial (unported, v3.0) License.
By accessing the work you hereby accept the Terms. Non-commercial uses of the work are permitted without any further permission from Dove Medical Press Limited, provided the work is properly attributed. For permission for commercial use of this work, please see paragraphs 4.2 and 5 of our Terms.
© 2022 The Author(s). This work is published and licensed by Dove Medical Press Limited. The full terms of this license are available at https://www.dovepress.com/terms.php and incorporate the Creative Commons Attribution - Non Commercial (unported, v3.0) License.
By accessing the work you hereby accept the Terms. Non-commercial uses of the work are permitted without any further permission from Dove Medical Press Limited, provided the work is properly attributed. For permission for commercial use of this work, please see paragraphs 4.2 and 5 of our Terms.