")
Back to Journals » Journal of Pain Research » Volume 10
Development and performance of a diagnostic/prognostic scoring system for breakthrough pain
Authors Samolsky Dekel BG , Palma M , Sorella MC , Gori A, Vasarri A , Melotti RM
Received 30 October 2016
Accepted for publication 2 May 2017
Published 31 May 2017 Volume 2017:10 Pages 1327—1335
DOI https://doi.org/10.2147/JPR.S126132
Checked for plagiarism Yes
Review by Single anonymous peer review
Peer reviewer comments 3
Editor who approved publication: Dr Michael Schatman
Boaz Gedaliahu Samolsky Dekel,1–3 Marco Palma,4 Maria Cristina Sorella,1–3 Alberto Gori,3 Alessio Vasarri,3 Rita Maria Melotti1–3
1Department of Medicine and Surgery Sciences, University of Bologna, 2Department of Emergency-Urgency, Bologna’s University Teaching Hospital, Policlinic S. Orsola-Malpighi, 3University of Bologna, Post Graduate School of Anaesthesia and Intensive Care, 4Collegio Superiore, Istituto di Studi Superiori – ISS, University of Bologna, Bologna, Italy
Objectives: Variable prevalence and treatment of breakthrough pain (BTP) in different clinical contexts are partially due to the lack of reliable/validated diagnostic tools with prognostic capability. We report the statistical basis and performance analysis of a novel BTP scoring system based on the naïve Bayes classifier (NBC) approach and an 11-item IQ-BTP validated questionnaire. This system aims at classifying potential BTP presence in three likelihood classes: “High,” “Intermediate,” and “Low.”
Methods: Out of a training set of n=120 mixed chronic pain patients, predictors associated with the BTP likelihood variables (Pearson’s χ2 and/or Fisher’s exact test) were employed for the NBC planning. Adjusting the binary classification to a three–likelihood classes case enabled the building of a scoring algorithm and to retrieve the score of each predictor’s answer options and the Patient’s Global Score (PGS). The latter medians were used to establish the NBC thresholds, needed to evaluate the scoring system performance (leave-one-out cross-validation).
Results: Medians of PGS in the “High,” “Intermediate,” and “Low” likelihood classes were 3.44, 1.53, and −2.84, respectively. Leading predictors for the model (based on score differences) were flair frequency (∆S=1.31), duration (∆S=5.25), and predictability (∆S=1.17). Percentages of correct classification were 63.6% for the “High” and of 100.0% for either the “Intermediate” and “Low” likelihood classes; overall accuracy of the scoring system was 90.9%.
Conclusion: The NBC-based BTP scoring system showed satisfactory performance in classifying potential BTP in three likelihood classes. The reliability, flexibility, and simplicity of this statistical approach may have significant relevance for BTP epidemiology and management. These results need further impact studies to generalize our findings.
Keywords: naïve Bayes classifier, breakthrough pain, multiclass scoring-system
Introduction
Breakthrough pain (BTP) refers to a transitory exacerbation of pain experienced by a chronic pain (CP) patient who has relatively stable and adequately controlled baseline pain.1 Its prevalence, among CP cancer and noncancer patients, may reach 93% and 74%, respectively.2–8 BTP was reported as an independent predictor for poor pain outcomes, and to have negative impact on patients’ quality of life with physical, psychological, and economic burdens for patients and caregivers.4,7,9–11
BTP recognition is essential for adequate pain management. Common pain assessment tools are insufficient for BTP identification,1,12–14 and the adequacy of those used to assess cancer BTP (BTcP) were challenged as there are no widely accepted definition, classification system or well-validated, consistently used and standardized diagnostic tool for BTcP.13 Including BTP in prognosis research may represent a novel approach for BTP recognition and treatment.
The need for quantitative support for caregivers to make therapeutic decisions is growing. The benefit of scoring and classification systems resides in that a unique number or clinical condition class can combine information and predictors arising from different inputs.
In a modern approach for scoring system development, the numeric scores are estimated using frequency counts from a training set. This approach is based on the Bayes’ rule that allows formalizing a priori suppositions and combining them with the available observations; using a simplifying (naïve) assumption makes the problem linear and reduces the classifier complexity. The naïve Bayesian approach, with respect to the nonlinear alternatives, is simpler to implement even for nonstatisticians; it is also flexible and often outperforms more sophisticated classification methods showing good performance in terms of classification accuracy.15 For these reasons it is increasingly used for designing scoring systems to support clinical decision making in many fields.16–22
We report the theoretical background and the steps followed for the development of a scoring system for a BTP diagnostic/prognostic tool based on the naïve Bayes classifier (NBC) approach and the 11-item IQ-BTP validated questionnaire. The tool aims at classifying the potential presence of BTP in three prognostic/likelihood classes: High, Intermediate, and Low. A concise description of the NBC, the adopted classification technique, and the adjustments needed for a multiclass situation will be followed by the analysis of the scoring system performance using data from a training set.
Methods
Naïve Bayes classifier and scoring systems
The NBC is based on the Bayes’ theorem. The latter states that, given the events C1, C2,…Ck, which are compatible with an event E (with P(E) ≠ 0, where P is the probability of event E to occur), the probability of event Ct in the case that event E occurred (i.e., the conditional probability P(Ct|E) is described in Equation (1):
|
|
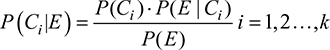
The value P(Ci) is called “prior probability”; P(E|Ci) is the likelihood that allows updating the initial probability assignment into the new term P(Ci|E), called “posterior probability.” In the NBC framework, it is assumed that the predictors for a given class ωi are independent, that is, the value observed on a predictor does not influence the value observed on the others. This “naive” assumption drastically simplifies the computation of the conditional probabilities for each class, which are thus computed individually for each variable. Moreover, the development of the classifier becomes even simpler when the computation of the conditional probabilities is based on binary or discrete predictors. Indeed, a predictor Ej with K levels is characterized by a K-dimensional vector for each class ωi with all the likelihood terms for each level, that is, 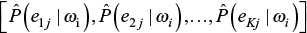 .21,22 Each vector’s component is estimated using the predictor frequencies obtained from the training set, applying the “Laplace correction” adjustment. The latter is introduced in order to avoid 0 or 1 values or prior probabilities for different classes. The resulting formula (2) computes the conditional probabilities:
|
|
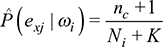
where nc represents the count of statistical units belonging to the ith class for which the predictor Ej takes value equal to ex, Ni is the amplitude of the ith class, and K is the number of levels of Ej. Given the q-dimensional vector e = (E1, E2, …, Eq, the new Bayes’ theorem formulation for the classifier in (1) is described in Equation (3):
|
|
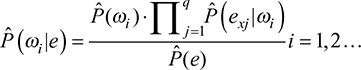
where Pˆ indicates the estimated probabilities; q is the number of variables chosen and exj is the xth level for the variable Ej.
The classification rule is extracted directly from the posterior probabilities obtained using Equation (3). Given the observed variables, if the likelihood of class w1 is greater or equal to the likelihood of class w2 then their ratio is not <1 and it is more plausible that the statistical unit under study belongs to w1; therefore, this unit is assigned to w1. This decision rule for NBC is described in Equation (4) as a simplified version adopted from the literature.21
|
|
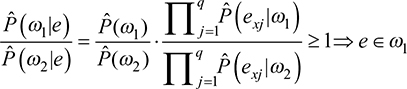
The classification rule can be rewritten in logarithmic form; instead of getting products, a sum of q addends is obtained. This sum returns substantially a score from empirical observation. Once a threshold (in logarithmic form) is fixed, the score is compared to it and the unit is assigned to the best class, as in Equation (5):
|
|
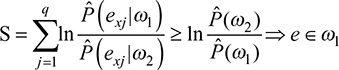
Equation 5 returns the sum S of the logarithms of the likelihood ratios for each predictor in each class, to be compared with the logarithm of the ratio for the prior probabilities estimated for each class. If S is greater or equal to the right-hand side of the inequality, the unit is assigned to the class w1, otherwise to class w2.
For a multiclass (>2) situation the scoring system must be adjusted: while in the binary situation the classification is based on a ratio and discriminates two classes, in a three-classes situation the discrimination problem may be split into three binary subproblems. An easier and reliable strategy is to consider High and Low, as w1 and w2, aiming at discriminating mostly the two extreme classes.
IQ-BTP questionnaire and data description
We developed, following the literature1,14,23–25 and based on our experience, an operational case definition of BTP, which enabled a set of hypotheses for formal validation of an 11-item BTP questionnaire (for details see Samolsky Dekel et al26). Accordingly, a patient with BTP should report, 1) congruent clinical “prerequisite elements” that denote the potential presence of BTP; 2) appropriate “discriminate characteristics” of flares’ frequency and duration; and 3) any of the flares’ “clinical descriptive elements.” Table 1 reports these elements’ definitions, scoring, and interpretation, which are the basis of the validated IQ-BTP questionnaire. As we were interested in the prognostic features of our questionnaire, we have assumed that patients who potentially experience BTP are those who possess all the “prerequisite elements.” In these patients, the likelihood for the presence of BTP is “High,” when both the defined clinical discriminates (frequency and duration) are present; “Intermediate,” if only one of the “clinical discriminates” is present; and “Low,” if none of the “clinical discriminates” are present. In this study these likelihood classes will be referred to as BTP outcome variables.
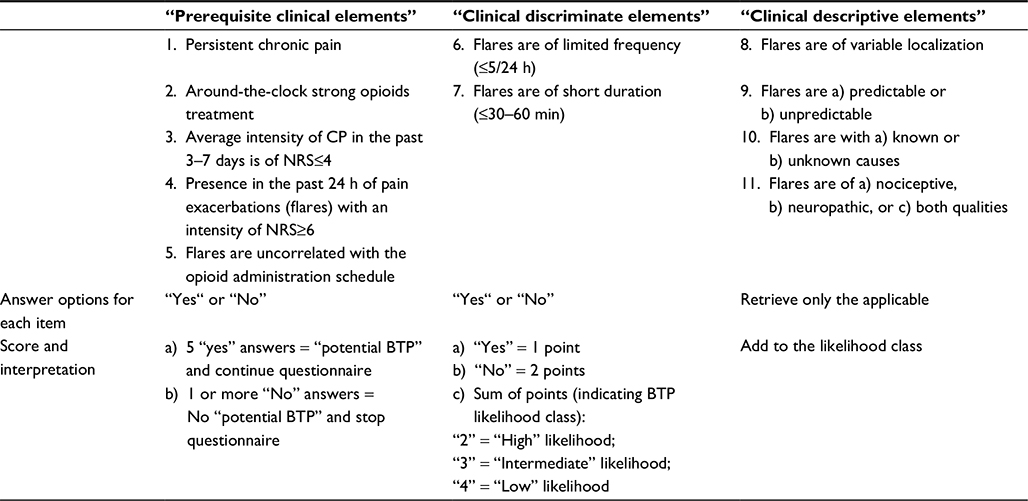 | Table 1 Essentials of the IQ-BTP item definitions, scoring, and interpretation Notes: Definitions’ numbering in the table matches the item numbers in the IQ-BTP questionnaire. The questionnaire scoring system is such that patients potentially suffering from BTP should answer “Yes” to each of the first five items (prerequisite elements) of the IQ-BTP; for each of the two clinical discriminate items (items 6 and 7 of the IQ-BTP), a “Yes” answer scores “1” point and a “No” answer scores “2” points. Thus, the sum of the scores of the two discriminate items can be “2”, “3” or “4” indicating, respectively, High, Intermediate, or Low likelihood for BTP. Abbreviations: BTP, breakthrough pain; CP, chronic pain; NRS, Numerical Rating Scale. |
For the purposes of this report we used a training set of n=120 mixed cancer/noncancer patients, >18 years of age, with moderate/severe CP and treated around the clock (ATC) with strong opioids. This sample was also used for the validation of the IQ-BTP questionnaire. As described elsewhere,26 the validation study was approved by the Ethics Committee of the Bologna’s Teaching Hospital (Italy), conducted according to the Helsinki declaration and the International Association for the Study of Pain’s guidelines for pain research in humans. All participants were personally informed by the investigators on the study’s aims and structure and that participation was voluntary, anonymous, and would not affect their care; hence, an informed consent was obtained.
Scoring system analysis procedure
- Extract, from the training set, the sub-dataset for the scoring system analysis:
Select the independent variable predictors (Table 2, excluding items 1–5) that show statistically significant relationship with the BTP outcome variables by using contingency tables and the Pearson’s χ2 (or, in the case of expected counts <5, the Fisher’s exact test for discrete variables). Items 1–5 are excluded as, by definition, all the patients potentially experiencing BTP must have answered “Yes” to these items and thus they have no further discrimination value and represent no contribution for the classification purposes.
Cell frequencies: assign cases with potential BTP (i.e., those with “Yes” answers to items 1–5) to each selected predictor as function of the BTP outcome variable (see Table 2, items 6–10).
- Build the scores set by computing the “individual-score” for each selected predictor’s answer level:
Compute the conditional probabilities by applying Equation 2 (see Methods naïve Bayes classifier and scoring systems section), considering the BTP outcome variable “High” as w1 and “Low” as w2; hence, retrieve the “individual-score” as the natural logarithm of the ratio of these conditional probabilities (an explicatory example is given in Box 1).
Repeat the previous step, within each predictor, for either “Yes” or “No” answers to obtain, respectively, their “individual score.” Establish each predictor’s score difference and compare this difference between different predictors: the larger the difference the more relevant is the weight of the single predictor for assigning a patient to a single BTP outcome class.
- Compute the Patient’s Global Score (PGS). According to the patient’s actual answer (“Yes”/“No”) for a selected predictor, retrieve the congruent “individual-score” from the scores set (see the previous step). The PGS is, for each patient, the sum of all the congruent “individual-scores” of the considered predictors. It is also possible to consider the distribution of PGS within each BTP outcome class and to evaluate, using Kruskal–Wallis test, whether the differences between the medians are significant (in the latter case, a post hoc test for multiple comparison like the Nemenyi– Damico–Wolfe–Dunn (NDWD) test is applicable).27
- Set the thresholds and evaluate the classification performances. The thresholds among contiguous classes can be derived either by using the decision rule in Equation (5) or by using a post hoc analysis on each outcome score. The evaluation of the system’s performance can be done with the cross-validation approach. The model is fitted on a set of observations (training set) and used to predict a response on another independent dataset (test set). Then a confusion matrix is built: its rows represent the predicted classes and its columns the observed classes in the sample as defined by the BTP outcome variable; patients correctly classified appear within the main diagonal cells. For each class, percentage of correct classification is the product of 100 times the ratio between the number of patients correctly classified (main diagonal cell) and the actual size of the class (marginal row cell). The weighted average of the correct classification percentages is the classifier’s overall accuracy. The latter is computed either by the ratio between the sum of the elements of the main diagonal and the marginal row’s total; or, by first computing the sum of the products of each class correct-classification-percentage and its marginal row frequency, and hence dividing this sum by the total of the marginal row. Accuracy of 100% yields the best performance while ≤33.3% the worst (i.e., random distribution of cases).22
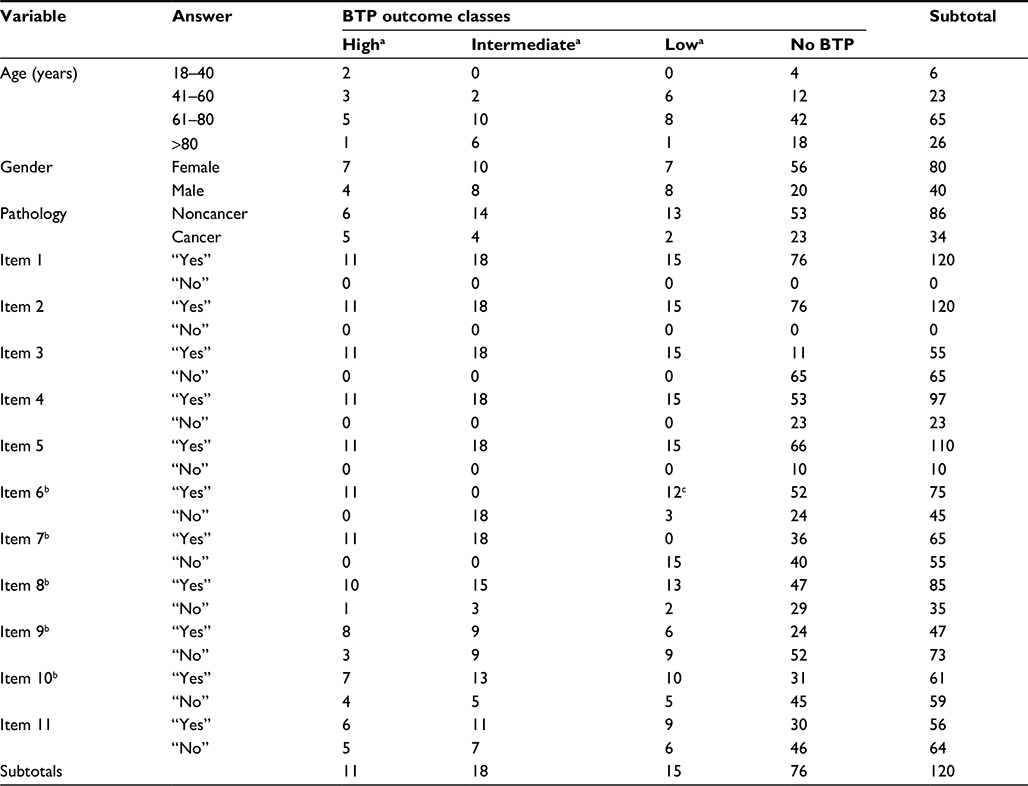 | Table 2 Distribution of patients within each independent variable as function of the BTP outcome variable Notes: Given the inclusion criteria, items 1 and 2 do not include the “No” answer. Data for Item 9 were used in the example in Box 1. aCases with potential BTP (n=44) included in the scoring system analysis. bIndependent variables that showed statistically significant relationship with the BTP outcome variables and thus included in the scoring system analysis. cCases with clinically ambiguous answer yet fitting “Low” BTP outcome class criteria. Abbreviation: BTP, breakthrough pain |
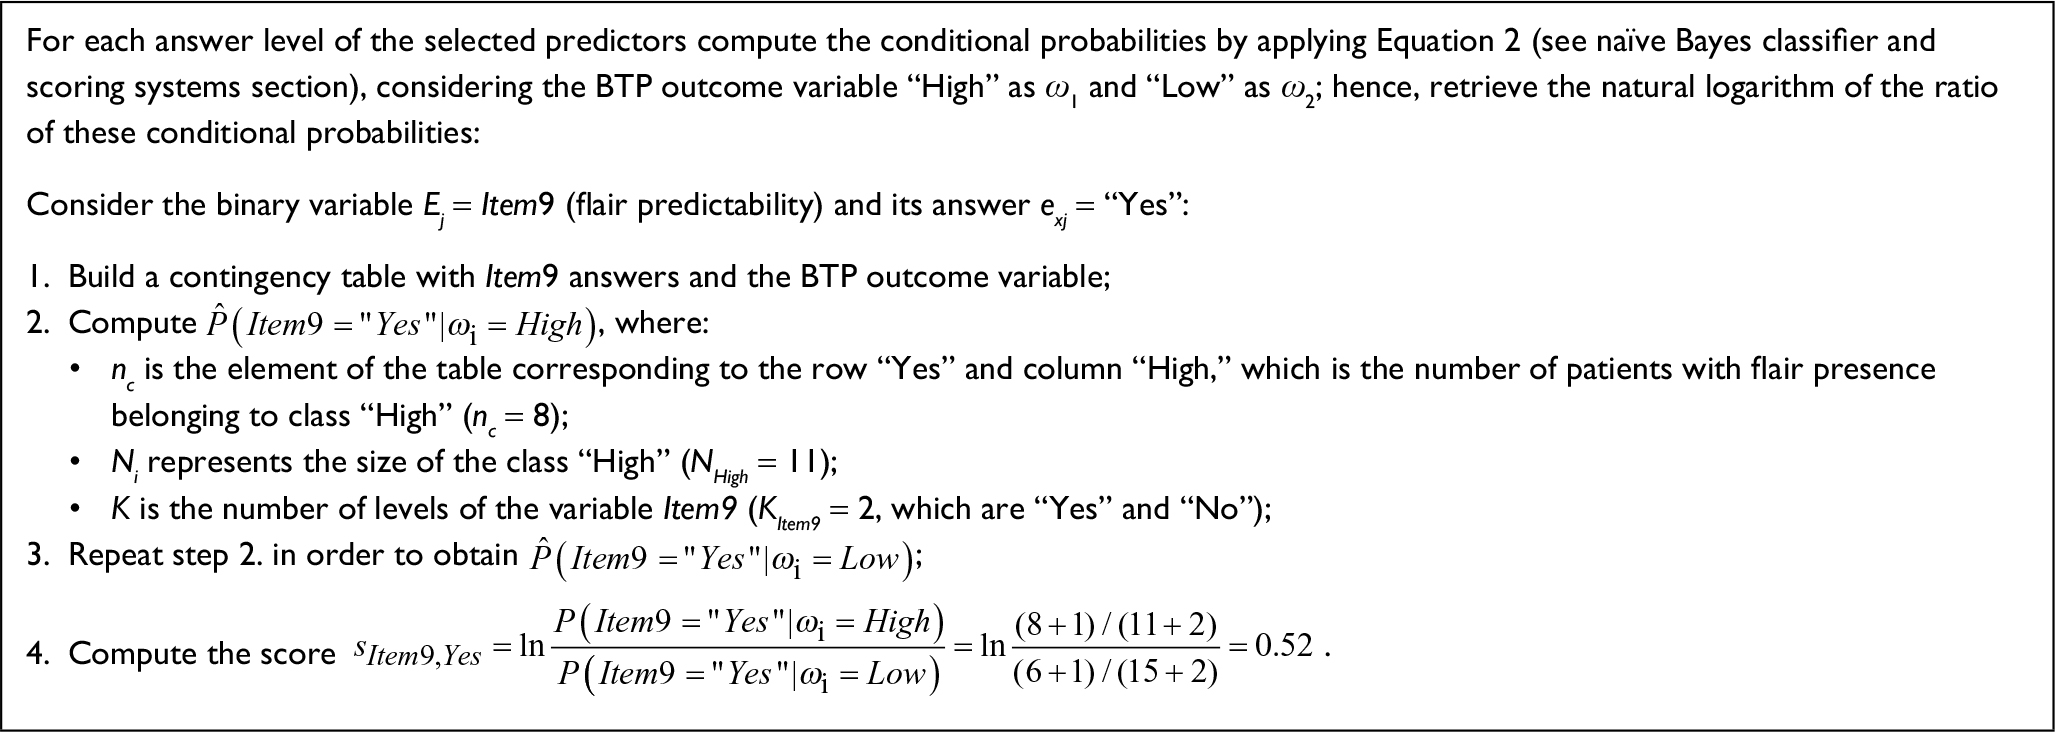 | Box 1 Example of the “individual score” computation |
All the calculations and plots in this study were elaborated with the open source environment R-Core-Team.28
Results
The analysis of the scoring system was based on n=44 subjects with potential BTP extracted from a training set of n=120 mixed CP patients. Table 2 reports the distribution and proportions of essential demographics and independent variables in the training set; it also reports the distribution of patients in each independent variable as function of the BTP outcome classes. Overall potential BTP cases distribution in the “High,” “Intermediate,” and “Low” likelihood classes were 11, 18, and 15, respectively.
Table 3 reports the results of the association analysis between the predictors and the BTP outcome variable. Only IQ-BTP items 6–10 showed significant association with the BTP outcome variables and thus were used to compute the scores set. Table 4 reports the scores obtained by applying the scoring algorithm for each answer level of the selected predictors. Based on these scores, the leading score differences were shown by the predictors’ flair frequency (∆S=1.31), duration (∆S=5.25), and predictability (∆S=1.17).
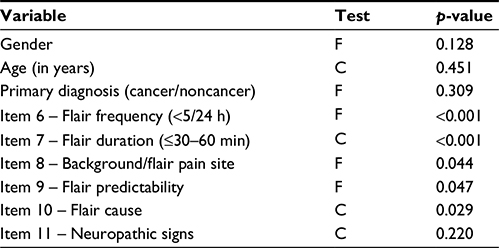 | Table 3 Association analysis between the BTP outcome variable and the whole set of predictors Notes: Only the variables with statistically significant association (p<0.05) were used for the naïve Bayes classifier. C, approximated c2 test; F, Fisher’s exact test. Abbreviation: BTP, breakthrough pain. |
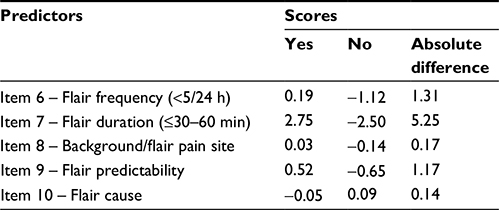 | Table 4 Scores set of the selected predictors’ answer options |
After retrieving each patient’s PGS, the medians of the PGS within each BTP outcome class were calculated. Medians of PGS were 3.44 (range 2.41–3.58) in the “High,” 1.53 (range 0.79–2.13) in the “Intermediate,” and −2.84 (range −4.29 to −1.81) in the “Low” likelihood classes. Figure 1 is a Box and Whiskers plot of the PGS distribution in the BTP outcome classes showing the PGS medians and interquartile range. The three medians significantly differed (Kruskal–Wallis χ2=38.07, df=2, p<0.00001; and post hoc multiple comparison analysis using NDWD test: High-Intermediate p=0.0089, Intermediate-Low p=0.0007, and High-Low p<0.00001). On the basis of the conditional distribution of PGSs, a patient is assigned to the “Low” likelihood class if his/her PGS<0; to “Intermediate” if 0<PGS<2.2 and to “High” if PGS>2.2.
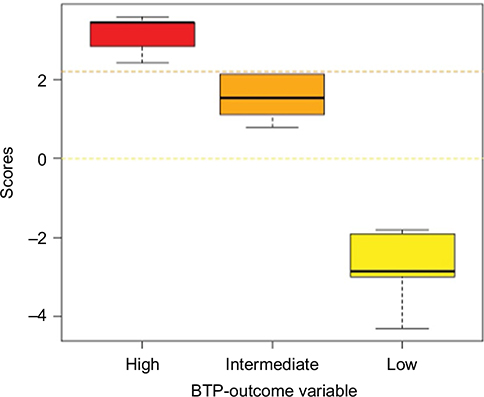 | Figure 1 Box and Whiskers plot of the estimated patient’s global score distribution Abbreviation: BTP, breakthrough pain. |
The decision rule defined by the aforementioned thresholds allowed the building of a Confusion matrix. In the latter, frequencies for each class were obtained both from the scoring system prediction and from the observed data as reported in Table 2. Table 5 is the Confusion matrix of these frequencies which resulted from leave-one-out cross-validation. Proportions of correct classification were 63.6% for the “High” and of 100.0% for either the “Intermediate” or “Low” likelihood classes. The overall accuracy of the classifier (i.e., the weighted average) was 90.9%.
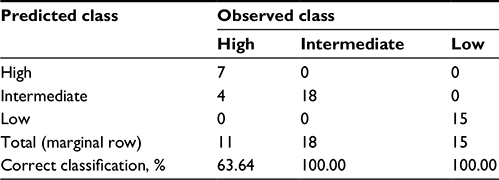 | Table 5 Confusion matrix and percentage of correct classification (leave-one-out cross-validation) |
Discussion
The NBC was implemented to build a prognostic scoring system for estimating the likelihood (High, Intermediate, or Low) of BTP in CP patients. The developed scoring system was defined by descriptive tables obtained by frequency counts from a training set of n=120 CP patients to whom the 11-item IQ-BTP validated questionnaire was administered. Adjusting a binary scoring problem to a three-likelihood classes case enabled the building of a scoring algorithm and to retrieve the scores of each predictor’s answer options and the PGS. The latter medians were used to establish the NBC thresholds and to evaluate the scoring system performance. Overall correct classification percentage was 90.9% (i.e., roughly nine of every ten patients were correctly assigned to their class).
Clinical prognosis refers to the risk of future outcomes in people with a given disease or health condition; caregivers, patients, funders, and policy makers require reliable evidence about health condition outcomes for decisions making.29 Prognosis research seeks to recognize and ameliorate outcomes in patients with a given health condition and to provide crucial evidence for translating findings from clinical research to clinical practice. Prognostic models use prognostic factors to predict the risk of clinical outcomes in individual patients and provide accurate predictions that inform stakeholders, support clinical research, and allow taking congruent clinical decisions.30
Predictive models to foresee outcomes in patients with a given health condition are increasingly used as they allow retrieving and quantifying diagnostic/prognostic information. In clinical practice, scoring system models are particularly appealing; their practicability allows coagulating information and predictors from different inputs and prompt congruent clinical decision making.
Different quantitative approaches apply for patient-outcomes’ estimation.31–34 One study35 critically reviewed such approaches for developing predictive models of patients’ morbidity after heart surgery: Bayesian scoring models were shown to achieve performances equivalent to those of pure logistic regression but significantly better than logistic regression–derived scoring systems.36 However, scoring systems’ reliability, despite their practicality, may be undermined as they are difficult to update with new data and to fit onto different clinical contexts.21 The NBC overcomes this issue as the scoring system is completely defined by descriptive tables that are easily calculated and updated using data acquired in different contexts.21 It was reported that NBCs may outperform more complex classification methods and show good average performance in terms of classification accuracy, especially over data sets with loosely correlated features.15 Moreover, the strength of the NBC approach is that it requires no gold standards (often unavailable) and is based on the predictors’ independence assumption, which makes the likelihood computation easier. These aspects made the NBC popular especially for text classification and antispam filtering, and recently for decision making in clinical practice.37,38
In the present study, we derived the scoring system directly from an NBC using discrete predictors and frequency counts from a training set. As in the literature21 this approach was straightforward and efficacious as the NBC identified the parameters required for accurate classification using limited training data.
Scoring systems with binary classification are frequent, and in the present study we developed a three-level classification. This approach was dictated by our operational case definition of BTP: among patients who potentially experience BTP, the likelihood for the BTP presence is “High,” when both the defined clinical discriminates (frequency and duration) are present; “Intermediate,” if only one is present; and “Low,” if none of them are present. In agreement with our operational case definition, scores computation of each predictor’s answer level in the scoring algorithm showed that the leading predictors for patients’ assignment in the three-level classification were flair frequency, duration, and predictability. Statistically, in a binary situation, the classification using scoring system is based on a ratio; in a three-level situation the discrimination issue (scores and threshold computation) may be split into three binary subproblems (High vs Intermediate, Intermediate vs Low, High vs Low). This solution, however, may be time-consuming and the results may not be easily interpretable. For these reasons we have considered in this study only the classes, High and Low, as w1 and w2, with the aim of focusing primarily on the discrimination between the two extreme classes. While the applied strategy gave satisfactory results, other strategies, such as a two-stage approach or an ordinal classification, may be investigated.
Percentages of correct classification (i.e., performances of the scoring system) were relatively high, showing satisfactory discrimination power of the suggested scoring system. In particular, all patients belonging to the “Intermediate” and “Low” classes were correctly classified; few patients in the “High” class were misclassified in the “Intermediate” class, showing that the two classes have close scores. No patients in the “High” class were misclassified as “Low” or vice versa. Overall, the scoring system showed to be successful in avoiding “heavy mistakes.”
The scoring system performance was evaluated with the leave-one-out cross-validation. The latter is particularly useful in biomedical trials with relatively small samples as it allows all cases to be used efficiently for the training process of the model as well as for testing its predictive performance. Essentially it gives a reliable estimate of the prediction error with less bias than other cross-validation methods and it allows good control of model generalization capacity using all available data for training. Some authors recommend also to evaluate the model generalizability on a test set of data not used in the training process;35 this is currently being done in an ongoing impact study.
BTP requires correct identification and appropriate management. Considering BTP prognostic likelihood may be more useful for formulating clinical issues than for pursuing diagnosis. Based on risk/likelihood features, prognostic information can influence clinical decisions, patient outcome, and cost-effectiveness of care. The prognostic concepts of potential BTP and of the “High”, “Intermediate,” and “Low” likelihood for the BTP presence may be estimated by the IQ-BTP questionnaire and its scoring system. It is reasonable to speculate that for potential BTP of “High” likelihood, the correct treatment would be Rapid-Onset-Opioids (e.g., transmucosal fentanyl citrate); “Intermediate” or “Low” likelihood imposes careful evaluation of the opportunity to use Short-Acting-Opioids (e.g., oral morphine sulfate) or to ameliorate the ATC opioid regimen, respectively.
Study limitations
In this study an ad hoc solution was adopted to solve the issue of extending the binary scoring system methodology to the three-classes situation. While our solution enabled the definition of the discrimination thresholds, other strategies based on different statistical procedures may be investigated.
The generalizability of the reported scoring system may be questioned as the study’s training set belonged only to one CP center. Nevertheless, results demonstrate that the NBC approach produces a simple and trustworthy scoring system that is easily updated and customized for other contexts. Easy, precise customization and updating ensure the model’s performance, reliability, and acceptance by caregivers. Further, the scoring system is now undergoing a multicenter, national-wide impact study as a testing phase.
Conclusion
The NBC-based BTP scoring system showed satisfactory performance in classifying potential BTP in three likelihood classes. The reliability, flexibility, and simplicity of this statistical approach may have significant relevance for BTP epidemiology and management. These results need further impact studies to generalize our findings.
Disclosure
The authors report no conflicts of interest in this work.
References
Haugen DF, Hjermstad MJ, Hagen N, Caraceni A, Kaasa S, (EPCRC) EPCRC. Assessment and classification of cancer breakthrough pain: a systematic literature review. Pain. 2010;149(3):476–482. | ||
Zeppetella G, O’Doherty CA, Collins S. Prevalence and characteristics of breakthrough pain in cancer patients admitted to a hospice. J Pain Symptom Manage. 2000;20(2):87–92. | ||
Swanwick M, Haworth M, Lennard RF. The prevalence of episodic pain in cancer: a survey of hospice patients on admission. Palliat Med. 2001;15(1):9–18. | ||
Portenoy RK, Payne D, Jacobsen P. Breakthrough pain: characteristics and impact in patients with cancer pain. Pain. 1999;81(1–2):129–134. | ||
Petzke F, Radbruch L, Zech D, Loick G, Grond S. Temporal presentation of chronic cancer pain: transitory pains on admission to a multidisciplinary pain clinic. J Pain Symptom Manage. 1999;17(6):391–401. | ||
Gomez-Batiste X, Madrid F, Moreno F, et al. Breakthrough cancer pain: prevalence and characteristics in patients in Catalonia, Spain. J Pain Symptom Manage. 2002;24(1):45–52. | ||
Fortner BV, Okon TA, Portenoy RK. A survey of pain-related hospitalizations, emergency department visits, and physician office visits reported by cancer patients with and without history of breakthrough pain. J Pain. 2002;3(1):38–44. | ||
Fine PG, Busch MA. Characterization of breakthrough pain by hospice patients and their caregivers. J Pain Symptom Manage. 1998;16(3):179–183. | ||
Mercadante S, Maddaloni S, Roccella S, Salvaggio L. Predictive factors in advanced cancer pain treated only by analgesics. Pain. 1992;50(2):151–155. | ||
Caraceni A, Martini C, Zecca E, et al. Breakthrough pain characteristics and syndromes in patients with cancer pain. An international survey. Palliat Med. 2004;18(3):177–183. | ||
Burton B, Zeppetella G. Assessing the impact of breakthrough cancer pain. Br J Nurs. 2011;20(10):S14, S16–S19. | ||
Holen JC, Hjermstad MJ, Loge JH, et al. Pain assessment tools: is the content appropriate for use in palliative care? J Pain Symptom Manage. 2006;32(6):567–580. | ||
Hagen NA, Stiles C, Nekolaichuk C, et al. The alberta breakthrough pain assessment tool for cancer patients: a validation study using a delphi process and patient think-aloud interviews. J Pain Symptom Manage. 2008;35(2):136–152. | ||
Davies AN. Cancer-related breakthrough pain. Br J Hosp Med (Lond). 2006;67(6):414–416. | ||
Langley P, Sage S. Induction of selective Bayesian classifiers. Proc Tenth Int Conf Uncertain Artif Intell. 1994;(1990):399–406. | ||
Kuzniewicz MW, Vasilevskis EE, Lane R, et al. Variation in ICU risk-adjusted mortality: impact of methods of assessment and potential confounders. Chest. 2008;133(6):1319–1327. | ||
Murphy-Filkins R, Teres D, Lemeshow S, Hosmer DW. Effect of changing patient mix on the performance of an intensive care unit severity-of-illness model: how to distinguish a general from a specialty intensive care unit. Crit Care Med. 1996;24(12):1968–1973. | ||
Higgins TL. Quantifying risk and benchmarking performance in the adult intensive care unit. J Intensive Care Med. 2007;22(3):141–156. | ||
Higgins TL, Estafanous FG, Loop FD, et al. ICU admission score for predicting morbidity and mortality risk after coronary artery bypass grafting. Ann Thorac Surg. 1997;64(4):1050–1058. | ||
Teasdale G, Jennett B. Assessment of coma and impaired consciousness. A practical scale. Lancet. 1974;304(7872):81–84. | ||
Barbini P, Cevenini G, Furini S, Barbini E. A naive approach for deriving scoring systems to support clinical decision making. J Eval Clin Pract. 2014;20(1):1–6. | ||
Cevenini G, Barbini E, Massai MR, Barbini P. A naive Bayes classifier for planning transfusion requirements in heart surgery. J Eval Clin Pr. 2013;19(1):25–29. | ||
Mercadante S, Marchetti P, Cuomo A, Mammucari M, Caraceni A. Breakthrough pain and its treatment: critical review and recommendations of IOPS (Italian Oncologic Pain Survey) expert group. Support Care Cancer. 2016;24(2):961–968. | ||
Portenoy RK, Hagen NA. Breakthrough pain: definition, prevalence and characteristics. Pain. 1990;41(3):273–281. | ||
Davies AN, Dickman A, Reid C, Stevens AM, Zeppetella G. The management of cancer-related breakthrough pain: recommendations of a task group of the Science Committee of the Association for Palliative Medicine of Great Britain and Ireland. Eur J Pain. 2009;13(4):331–338. | ||
Samolsky Dekel BG, Remondini F, Gori A, Vasarri A, Di Nino GF, Melotti RM. Development, validation and psychometric properties of a diagnostic/prognostic tool for breakthrough pain in mixed chronic-pain patients. Clin Neurol Neurosurg. 2016. 141:23–29. | ||
Hollander M, Wolfe DA, Chicken E. Nonparametric Statistical Methods. Vol 2. Hoboken, NJ: John Wiley & Sons, Inc; 2014. | ||
R Core team. R Core Team. R A Language and Environment for Statistical Computing R Foundation for Statistical Computing, Vienna, Austria; Available from: https://www.R-project.org/ 2015;55:275–286. | ||
Hemingway H, Croft P, Perel P, et al. Prognosis research strategy (PROGRESS) 1: a framework for researching clinical outcomes. BMJ. 2013;346:e5595. | ||
Steyerberg EW, Moons KG, van der Windt DA, et al. Prognosis research strategy (PROGRESS) series 3: prognostic model research. PLoS Med. 2013;10(2):e1001381. | ||
Shahian DM, Blackstone EH, Edwards FH, et al. Cardiac surgery risk models: a position article. Ann Thorac Surg. 2004;78(5):1868–1877. | ||
Jaimes F, Farbiarz J, Alvarez D, Martinez C. Comparison between logistic regression and neural networks to predict death in patients with suspected sepsis in the emergency room. Crit Care. 2005;9(2):R150–R156. | ||
Dreiseitl S, Ohno-Machado L. Logistic regression and artificial neural network classification models: a methodology review. J Biomed Inform. 2002;35(5–6):352–359. | ||
den Boer S, de Keizer NF, de Jonge E. Performance of prognostic models in critically ill cancer patients – a review. Crit Care. 2005;9(4):R458–R463. | ||
Barbini E, Cevenini G, Scolletta S, Biagioli B, Giomarelli P, Barbini P. A comparative analysis of predictive models of morbidity in intensive care unit after cardiac surgery – part I: model planning. BMC Med Inf Decis Mak. 2007;7:35. | ||
Biagioli B, Scolletta S, Cevenini G, Barbini E, Giomarelli P, Barbini P. A multivariate Bayesian model for assessing morbidity after coronary artery surgery. Crit Care. 2006;10(3):R94. | ||
Caruana R, Niculescu-Mizil A. An empirical comparison of supervised learning algorithms. In: Proceedings of the 23rd International Conference on Machine Learning. Pittsburgh, PA: ACM New York, NY, USA; 161–168, 2006. | ||
AY Ng, Jordan M. On generative vs discriminative classifiers: a comparison of logistic regression and naive bayes. Proc Adv Neural Inf Process. 2002;28(3):169–187. |
 © 2017 The Author(s). This work is published and licensed by Dove Medical Press Limited. The full terms of this license are available at https://www.dovepress.com/terms.php and incorporate the Creative Commons Attribution - Non Commercial (unported, v3.0) License.
By accessing the work you hereby accept the Terms. Non-commercial uses of the work are permitted without any further permission from Dove Medical Press Limited, provided the work is properly attributed. For permission for commercial use of this work, please see paragraphs 4.2 and 5 of our Terms.
© 2017 The Author(s). This work is published and licensed by Dove Medical Press Limited. The full terms of this license are available at https://www.dovepress.com/terms.php and incorporate the Creative Commons Attribution - Non Commercial (unported, v3.0) License.
By accessing the work you hereby accept the Terms. Non-commercial uses of the work are permitted without any further permission from Dove Medical Press Limited, provided the work is properly attributed. For permission for commercial use of this work, please see paragraphs 4.2 and 5 of our Terms.