")
Back to Journals » International Journal of Nanomedicine » Volume 10 » Issue 1
Development and optimization of a self-microemulsifying drug delivery system for atorvastatin calcium by using D-optimal mixture design
Authors Yeom DW, Song YS, Kim SR, Lee SG, Kang MH, Lee S, Choi YW
Received 25 February 2015
Accepted for publication 16 April 2015
Published 5 June 2015 Volume 2015:10(1) Pages 3865—3878
DOI https://doi.org/10.2147/IJN.S83520
Checked for plagiarism Yes
Review by Single anonymous peer review
Peer reviewer comments 2
Editor who approved publication: Dr Thomas Webster
Dong Woo Yeom,1 Ye Seul Song,1 Sung Rae Kim,1 Sang Gon Lee,1 Min Hyung Kang,1 Sangkil Lee,2 Young Wook Choi1
1College of Pharmacy, Chung-Ang University, Seoul, 2College of Pharmacy, Keimyung University, Daegu, Republic of Korea
Abstract: In this study, we developed and optimized a self-microemulsifying drug delivery system (SMEDDS) formulation for improving the dissolution and oral absorption of atorvastatin calcium (ATV), a poorly water-soluble drug. Solubility and emulsification tests were performed to select a suitable combination of oil, surfactant, and cosurfactant. A d-optimal mixture design was used to optimize the concentration of components used in the SMEDDS formulation for achieving excellent physicochemical characteristics, such as small droplet size and high dissolution. The optimized ATV-loaded SMEDDS formulation containing 7.16% Capmul MCM (oil), 48.25% Tween 20 (surfactant), and 44.59% Tetraglycol (cosurfactant) significantly enhanced the dissolution rate of ATV in different types of medium, including simulated intestinal fluid, simulated gastric fluid, and distilled water, compared with ATV suspension. Good agreement was observed between predicted and experimental values for mean droplet size and percentage of the drug released in 15 minutes. Further, pharmacokinetic studies in rats showed that the optimized SMEDDS formulation considerably enhanced the oral absorption of ATV, with 3.4-fold and 4.3-fold increases in the area under the concentration-time curve and time taken to reach peak plasma concentration, respectively, when compared with the ATV suspension. Thus, we successfully developed an optimized ATV-loaded SMEDDS formulation by using the d-optimal mixture design, that could potentially be used for improving the oral absorption of poorly water-soluble drugs.
Keywords: atorvastatin, SMEDDS, d-optimal mixture design, optimization, dissolution, bioavailability
Introduction
Atorvastatin calcium (ATV), a selective inhibitor of 3-hydroxy-3-methylglutaryl coenzyme A reductase, is used in patients with hyperlipidemia to decrease plasma levels of cholesterol and low-density lipoprotein by increasing the number of low-density lipoprotein receptors and subsequently accelerating the uptake and degradation of low-density lipoprotein cholesterol.1 ATV is insoluble in aqueous solution at pH ≤4 and is only slightly soluble in water and phosphate buffer at pH 7.4, indicating pH-dependent solubility.2 ATV shows high intestinal permeability at relevant pH.3 After oral administration, absolute bioavailability of ATV is approximately 14%.4 This is because of its low solubility, presystemic clearance in the gastrointestinal mucosa, and/or extensive first-pass metabolism in the liver.4 To enhance the solubility and oral absorption of ATV, various approaches have been investigated, including nanosuspensions, polymeric nanoparticles, polymorphs, solid dispersions, cyclodextrin complexes, micronization, and microemulsion formulations.5–11
The self-microemulsifying drug delivery system (SMEDDS) is one of the most practical systems to overcome low solubility and poor oral absorption of water-insoluble drugs.12,13 SMEDDS formulations contain anhydrous isotropic combinations of oil, surfactant, and cosurfactant, which form fine oil-in-water (o/w) emulsions after dilution in aqueous medium and gentle agitation in the gastrointestinal tract.14 Spontaneous formation of a microemulsion delivers the drug in a solubilized form; further, small droplet size allows rapid dissolution of the drug and provides a large surface area for its absorption, enhancing its permeation across the intestinal membrane.15 In addition, the drug solubilized in oil droplets is carried by lymphatic transport through the intestine to avoid first-pass metabolism in the liver.16
Development of a SMEDDS formulation is time-consuming, labor-intensive, and expensive, and involves an empirical design based on trial and error.17 Optimal SMEDDS formulations can be obtained using a statistical optimization tool based on response surface methodology and experimental designs such as central composite, Box–Behnken, factorial, and mixture designs.18–20 Statistical optimization allows simultaneous estimation of the main effects and interaction of all variables of a SMEDDS formulation. The D-optimal mixture design, a subtype of mixture design, is one of the most popular response surface methodologies for optimizing formulation of a SMEDDS.21 The D-optimal mixture design minimizes the variance associated with evaluation of coefficients in a model and produces the best possible subset by considering the criteria for maximizing information matrix determinants.22 The central composite, Box–Behnken, and factorial designs do not consider the total system of SMEDDS formulation, while the D-optimal mixture design considers the total system of SMEDDS as 100%.
In the present study, to improve the solubility and oral absorption of ATV, we developed an optimized SMEDDS formulation by using the D-optimal mixture design with a smaller number of trials and statistical optimization based on response surface methodology. Further, in vitro dissolution and in vivo oral bioavailability of ATV in the optimized SMEDDS formulation were compared with those of ATV in aqueous ATV suspension.
Materials and methods
Materials
ATV was supplied by Zhejiang Neo-Dankong Pharmaceutical Co Ltd (Taizhou, People’s Republic of China). Capryol 90, Labrafil M 1944 CS, Labrafil M 2125 CS, Lauroglycol 90, Labrafac PG, Labrasol, and Transcutol P were supplied by Gattefosse (Saint Priest, France). Capmul MCM was supplied by Abitec Co (Janesville, WI, USA). Isopropyl myristate was provided by Kanto Chemical Co Inc (Tokyo, Japan). Miglyol 840 was provided by Interlees Ltd (Seongnam, Korea), and Cremophor EL was supplied by BASF (Ludwigshafen, Germany). Tween 20, Tween 80, Brij 30, Tetraglycol, acetic acid, and ammonium acetate were purchased from Sigma-Aldrich (St Louis, MO, USA). Polyethylene glycol 400 was purchased from Duksan Pure Chemical Co Ltd (Ansan, South Korea), and high-performance liquid chromatography (HPLC)-grade acetonitrile and methanol were purchased from JT Baker (Phillipsburg, NJ, USA). All other chemicals used were of analytical grade.
Animals
All animal experiments were performed in accordance with the National Institute of Health guidelines on principles of laboratory animal care (National Institute of Health publication 85-23, revised 1996) and were approved by the Institutional Animal Care and Use Committee of Chung-Ang University, Seoul, Korea. Male Sprague-Dawley rats (weight 200–250 g, age 7–9 weeks) were purchased from Orient Bio (Kyungki-Do, Korea). The rats were fasted for approximately 12–18 hours with free access to water.
Solubility study
The solubility of ATV in various excipients was determined using the equilibrium method. Briefly, an excess amount of ATV was added to 1 mL of various excipients selected. Test tubes containing the mixtures were sealed and kept in ambient conditions with intermittent shaking (Cute Mixer CM-1000; Eyela, Tokyo, Japan) for 48 hours to achieve equilibrium. The mixtures were then centrifuged (Micro 17TR; Hanil Science, Incheon, Korea) at 16,000× g for 10 minutes to remove the excess ATV. The supernatant was filtered through a 0.45 μm polyvinylidene difluoride membrane (SmartPor; Woongki Science, Seoul, Korea), and the concentration of ATV in the filtrate was measured using HPLC after appropriate dilution with methanol.
HPLC analysis of ATV
Concentration of ATV was determined using HPLC. The HPLC system included a pump (W2690/5; Waters Corporation, Milford, MA, USA), ultraviolet detector (W2489; Waters Corporation), data station (Empower 3; Waters Corporation), and chromatographic Kromasil 100-5C18 column (150×4.6 mm, 5 μm; Akzo Nobel, Sickla Industriväg, Sweden) that was maintained at a flow rate of 1.0 mL per minute at 25°C. Isocratic mobile phase included acetonitrile and 0.1 M ammonium acetate buffer (pH 4.0; 50:50 [v/v]). The pH was adjusted using glacial acetic acid. Finally, 10 μL of each sample was injected into the column, and ATV concentration was measured under ultraviolet detection at 270 nm.
Emulsification study
The self-emulsification capacity of various surfactants was evaluated to select the best surfactant and cosurfactant.23 Concentration of oil in the SMEDDS formulation was set as 10% on the basis of the requisites for a spontaneous self-microemulsifying system (type IIIb system) that produces very fine dispersions and induces rapid formation of small oil droplets compared with other systems.24 In this study, various surfactants and cosurfactants were mixed (surfactant:cosurfactant ratio 1:1 [v/v]) and vortexed to obtain homogenous mixtures. Oil phase was added, and the mixtures were vortexed gently. In the presence or absence of ATV, self-emulsification efficiency was evaluated based on droplet size, and transmittance and was graded as excellent (grade A), good (grade B), fair (grade C), or poor (grade D).
Determination of droplet size
A photon correlation spectrometer (Zetasizer Nano ZS; Malvern Instruments, Malvern, UK) was used to determine the size of the emulsion droplets. To determine the effect of the pH of the dilution medium, the robustness of the SMEDDS was assessed by diluting 10 μL of the SMEDDS formulation with 10 mL of aqueous medium of distilled water, simulated gastric fluid (SGF, pH 1.2), or simulated intestinal fluid (SIF, pH 6.8) and gently stirring the mixture to obtain a homogenous dispersion. The samples were loaded into a cuvette placed in a thermostatic chamber, and light scattering was monitored at a 90° angle at 25°C. SGF was prepared by dissolving 2 g of sodium chloride in 7 mL of hydrochloric acid and diluting with water to 1,000 mL. SIF was prepared by mixing 250 mL of 0.2 M potassium phosphate monobasic solution and 118 mL of 0.2 M sodium hydroxide solution and diluting with water to 1,000 mL.
Transmittance
Transmittance of the SMEDDS formulation was measured by calculating the percentage transmittance at 650 nm using a FlexStation 3 microplate reader (Molecular Devices, Sunnyvale, CA, USA), with distilled water as the blank. To measure the transmittance, 100 μL of the SMEDDS formulation was diluted with 10 mL of distilled water.
Construction of phase diagram
The boundaries of the microemulsion domains were determined using a pseudo-ternary phase diagram. Based on the results of solubility and emulsification tests, Capmul MCM, Tween 20, and Tetraglycol were selected as the oil, surfactant, and cosurfactant, respectively. Each component indicated the apex of a triangle. A series of blank SMEDDS formulations was prepared for each of the three components by using varying concentrations of Capmul MCM, Tween 20, and Tetraglycol. For any mixture, the total concentrations of the three components always added up to 100%.
Efficiency of microemulsion formation was assessed by adding 10 μL of each mixture to 10 mL of distilled water and gently stirring with a magnetic stirrer. Droplet size of the microemulsion was determined using photon correlation spectrometry to objectively confirm the apparent spontaneity of the microemulsion.
Preparation of the SMEDDS formulation
A blank SMEDDS formulation was prepared by mixing oil, surfactant, and cosurfactant, and the mixture was vortexed to obtain a clear homogenous solution. The ATV-loaded SMEDDS formulation was prepared by adding 10.5 mg of ATV to 100 μL of the blank SMEDDS formulation.
Optimization of ATV-loaded SMEDDS formulations using D-optimal mixture design
The D-optimal mixture design was used to optimize the composition of the SMEDDS formulation. The experiment was designed using the three components as independent variables. Based on the solubility study and pseudo-ternary phase diagram, concentrations of Capmul MCM (oil; X1), Tween 20 (surfactant; X2), and Tetraglycol (cosurfactant; X3) were set within ranges of 5%–20%, 20%–60%, and 30%–70%, respectively. For any experiment, the concentrations of X1, X2, and X3 added up to 100%. Mean droplet size (Y1) and percentage of drug released in 15 minutes (Y2) were evaluated to determine the optimal SMEDDS formulation with excellent physiochemical characteristics. Design-Expert Software version 7 (Stat-Ease Inc, Minneapolis, MN, USA) was used for developing and evaluating the experimental design. The base design allowed 16 experiments to fit a cubic model, to check for lack of fit, and to estimate experimental error in the responses (Y1 and Y2).
Transmission electron microscopy
The morphology of the emulsion droplet for the optimized ATV-loaded SMEDDS formulation was observed using a transmission electron microscope (JEM 1010, JEOL Ltd, Tokyo, Japan) with an acceleration voltage of 80 kV. The optimized SMEDDS formulation was diluted with water (1:1,000). One drop of the sample was directly deposited on a copper mesh and dried at 25°C.
In vitro dissolution test
Dissolution tests were performed using the USP apparatus II (paddle) method with Vision® Classic 6™ Dissolution Tester and Vision® heater (Hanson Research, Chatsworth, CA, USA) at 37°C±0.5°C. Revolution speed of the paddle and volume of the dissolution medium were set at 75 rpm and 900 mL, respectively, according to US Food and Drug Administration guidelines. SGF, distilled water, and SIF were used as the dissolution media. As soon as the paddles were rotated, approximately 10 mg of ATV was introduced into the dissolution medium. Samples (5 mL) were obtained at predetermined sampling points (5, 15, 30, 60, 90, and 120 minutes) and filtered through a 0.45 μm polyvinylidene difluoride membrane. Next, 0.5 mL of the filtrate was diluted twofold with methanol, and the amount of ATV dissolved in each sample was determined using HPLC.
In vivo oral absorption study
After fasting the rats for approximately 12–18 hours, test samples of ATV were administered via oral gavage at a dose of 25 mg/kg. The rats were randomly divided into two groups containing five animals each. Raw ATV powder was suspended in 1 mL of 0.5% (w/v) aqueous sodium carboxymethyl cellulose immediately before administration. The optimized ATV-loaded SMEDDS formulation was accurately weighed and diluted with 1 mL water. Next, approximately 0.3 mL blood samples were collected from the retro-orbital plexus into heparinized tubes at predetermined time points (0.33, 0.66, 1, 1.5, 2, 4, 6, and 12 hours) and centrifuged at 16,000× g for 15 minutes. Plasma samples were stored at −80°C until analysis by liquid chromatography-tandem mass spectrometry (LC-MS/MS).
Whole plasma samples (50 μL) were mixed with 100 μL of 10 mM sodium acetate (pH 5), 1.5 mL of methyl tert-butyl ether, and 15 μL of internal standard solution (500 ng/mL ezetimibe in 50% methanol) and vortexed for 20 minutes. After centrifugation at 16,000× g for 10 minutes, 1.2 mL of the supernatant was carefully transferred to a test tube and evaporated to dryness under nitrogen. The dried residue was reconstituted in 400 μL of 50% methanol, and the mixture was vortexed and centrifuged at 16,000× g for 5 minutes. Finally, 100 μL of the supernatant were transferred to autosampling vials for introduction into the LC-MS/MS system.
Determination of ATV in plasma samples by LC-MS/MS
Liquid chromatographic separation was performed using an Agilent 1260 autosampler (Agilent Technologies Inc, Santa Clara, CA, USA). The temperature of the autosampler was maintained at 5°C, and 1 μL components of each reconstituted sample were separated using a Kromasil 100-5C18 column at 45°C. Isocratic mobile phase containing 10 mM ammonium formate (pH 4.0) and acetonitrile (30:70, [v/v]) was used at a flow rate of 0.35 mL per minute. Components eluted from the column were delivered into an API 5500 triple quadrupole mass spectrometer (Applied Biosystems/MDS SCIEX, Foster City, CA, USA) with electrospray ionization in negative ion mode for ion production. The ion spray voltage was set at −4.5 kV and the source temperature was set at 550°C. Multiple reaction monitoring was performed using nitrogen as the collision gas. The analytes were detected by monitoring the transitions 557.1 → 278.1 and 408.1 → 270.9 m/z, with collision energies of −56 V and −22 V for ATV and the internal standard, respectively. Other mass spectrometer conditions were as follows: nebulizer gas (gas 1) at 50°C and heater gas (gas 2) at 60°C. For quantifying ATV in the plasma samples, each peak area of ATV was divided by that of the internal standard and the ratio was compared with a calibration curve obtained using ATV standard solution in the same manner.
Pharmacokinetic assessment
Data analysis was performed using the BA Calc 2007 pharmacokinetic analysis program (Ministry of Food and Drug Safety [formerly Korea Food and Drug Administration], Chungcheongbuk-do, Korea). Area under the curve (AUC) from 0 to 12 hours was calculated using the program’s linear trapezoidal rule. Maximum plasma concentration and time needed to reach the maximum plasma concentration were determined directly from the concentration-time data. Mean residence time was calculated using the formula AUMC/AUC, where AUMC is the area under the moment curve for C (plasma concentration) × t (time) versus t plotted from 0 to 12 hours. Relative bioavailability was calculated by dividing the AUCs of the test samples with those of ATV suspension.
Statistical analysis
All data are expressed as the mean ± standard deviation. Statistical significance was determined using the Student’s t-test, with P<0.05 considered to be statistically significant. Design-Expert software was used to determine the simultaneously assigned statistical values of all the responses.
Results and discussion
Solubility of ATV in selected excipients
Because solubilization of the active components in a SMEDDS formulation is very important for developing nanodispersion systems, components showing high solubility for ATV should be selected. Solubility of ATV in various excipients is presented in Table 1. Capmul MCM showed significantly higher solubility for ATV (79.06 mg/mL) than other oils (0.1–3.33 mg/mL). Solubility of ATV in the oil component of SMEDDS is important because oils are apt to solubilize hydrophobic drugs. Therefore, Capmul MCM was selected as the oil phase for developing the SMEDDS formulation. Among the surfactants screened, Labrasol and Tween 20 showed good solubility for ATV. Among the cosurfactants screened, Transcutol P and Tetraglycol showed the highest solubility for ATV. The selected surfactant and cosurfactant rapidly form oil/water droplets and inhibit intestinal efflux mediated by P-glycoprotein or multidrug resistance-associated protein.25,26 Selection of surfactant and cosurfactant was further confirmed by their emulsification efficiency.
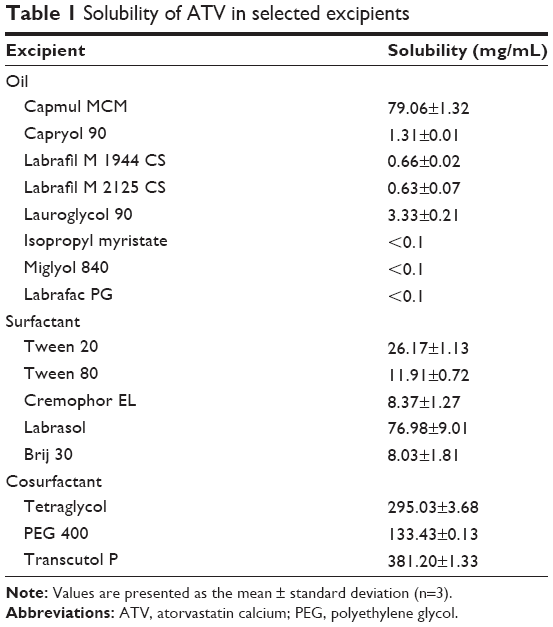 | Table 1 Solubility of ATV in selected excipients |
Emulsification study
To determine the capacity for self-emulsification, grading standards were introduced, as shown in Table 2. Droplet size and transmittance were used to assess self-emulsification of the surfactant in terms of dispersibility and final appearance. SMEDDS formulations form transparent microemulsions with a particle size of <100 nm, whereas self-emulsifying drug delivery system formulations typically form emulsions with particle sizes between 100 and 300 nm.20,27 A transmittance value of >80% indicates good microemulsification, while a value in the range of 50%–80% indicates large droplet size and thus decreased microemulsification.28
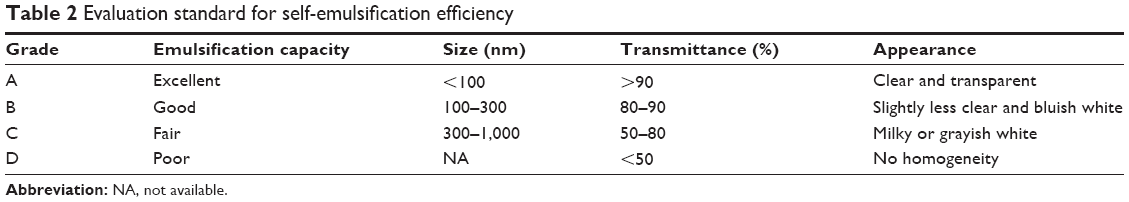 | Table 2 Evaluation standard for self-emulsification efficiency |
Table 3 lists the results of emulsification studies for the various surfactant and cosurfactant combinations. Compared with Labrasol, Tween 20 showed a better ability to emulsify the oil selected. This is consistent with previous reports.13 Cui et al29 showed that Labrasol had a good ability to emulsify ethyl oleate but had poor ability to emulsify Maisine 35-1 and Gelucire 44/14. This may be because the emulsification efficiency of the surfactant depends on its hydrophilic-lipophilic balance, structure, and chain length, as well as the chemical structure of the oil investigated.30,31 The hydrophilic-lipophilic balance value for Tween 20 (monoesters of fatty acids) is 16.7 while that of Labrasol (caprylocaproyl polyoxyl-8 glycerides) is 14. Surfactants with high hydrophilic-lipophilic balance values have better emulsification ability because of their hydrophilicity, which allows rapid and facile dispersion of oils in the aqueous phase, resulting in production of fine oil/water emulsions.14 Surfactants with short hydrophobic chains can emulsify a smaller volume of oil when compared with surfactants with long hydrophobic chains.
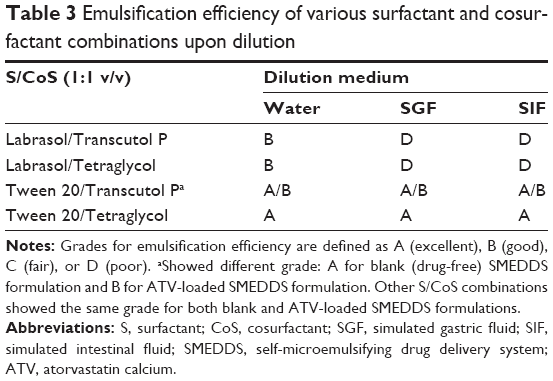 | Table 3 Emulsification efficiency of various surfactant and cosurfactant combinations upon dilution |
In the case of the cosurfactants, the emulsification efficiency of Tetraglycol was higher than that of Transcutol P, especially in combination with Tween 20. In the blank SMEDDS formulation, the Tween 20/Transcutol P system showed small droplets and high transmittance (grade A). However, when ATV was dissolved in the same SMEDDS formulation, the self-emulsification efficiency decreased (grade B). This occurred because of an increase in droplet size and/or precipitation of a small quantity of the drug. In contrast, the SMEDDS formulation with the Tween 20/Tetraglycol combination maintained its high self-emulsification efficiency (grade A) in both ATV-free and ATV-loaded conditions. Tetraglycol is less hydrophobic than Transcutol P, with log P-values of Tetraglycol and Transcutol P being −1.34 and −0.43, respectively. Cosurfactants with higher hydrophilicity have a faster and better ability to emulsify an oil-surfactant mixture that is in contact with water.28 Although the solubility of ATV in Transcutol P was higher than that in Tetraglycol, the emulsification study showed that the SMEDDS formulation containing the Tween 20/Tetraglycol combination had better solubilizing capacity. Therefore, Tetraglycol was selected as the cosurfactant for further investigation.
Pseudo-ternary phase diagram
A pseudo-ternary phase diagram was constructed using Capmul MCM (oil), Tween 20 (surfactant), and Tetraglycol (cosurfactant) in the drug-free condition to determine the appropriate ratio of the components in the SMEDDS formulation. As shown in Figure 1, the SMEDDS regions (dark gray area) were developed using a volume ratio of 5%–20% oil and 10%–80% surfactant/cosurfactant, which produced a transparent homogenous dispersion. The light gray area represents the self-emulsifying drug delivery system region with a less clear and/or bluish white appearance. Although all the formulations showed good self-emulsifying capacity within 1 minute, the SMEDDS region was used for further study because it showed the highest self-emulsifying capacity. When the concentration of oil exceeded 50% of the formulation, unstable emulsions were formed.
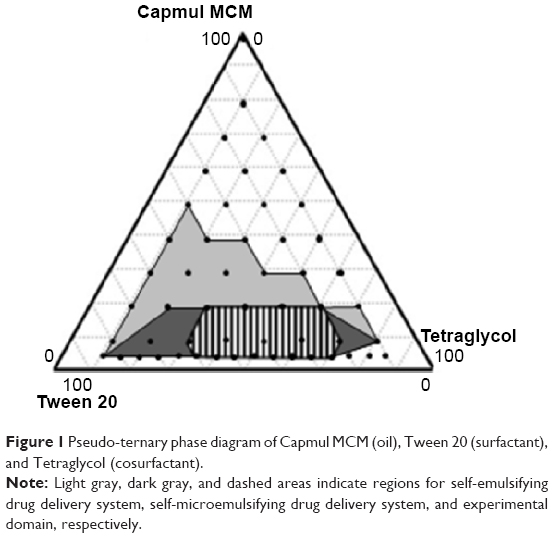 | Figure 1 Pseudo-ternary phase diagram of Capmul MCM (oil), Tween 20 (surfactant), and Tetraglycol (cosurfactant). |
Next, the SMEDDS formulation was optimized for efficient loading of ATV. Further experiments were performed by adding 10.5 mg of ATV to 100 μL of the selected SMEDDS system. Some formulations with a low surfactant/cosurfactant ratio resulted in precipitation or aggregation of ATV (data not shown). After excluding these marginal regions of too low or high surfactant/cosurfactant volume ratio, the experimental domain was finally decided as the dashed area in Figure 1.
Statistical analysis using the D-optimal mixture design
The D-optimal mixture design was used to optimize the SMEDDS formulation. Capmul MCM (X1), Tween 20 (X2), and Tetraglycol (X3) were chosen as the independent variables, as listed in Table 4. The mean droplet size (Y1) and percentage of drug released in 15 minutes (Y2) were chosen as response variables because they were considered as critical factors for self-microemulsification to improve oral absorption of poorly water-soluble drugs. A small droplet size allows better drug absorption because it provides an increased surface area for absorption and allows faster drug release. Dissolution is a rate-limiting step for the oral absorption of poorly water-soluble drugs, especially drugs belonging to class II of the Biopharmaceutics Classification System, including ATV.32 Further, to increase efficiency and decrease labor intensiveness, a dissolution period of 15 minutes was adopted to determine the relationship between independent variables and dissolution.19
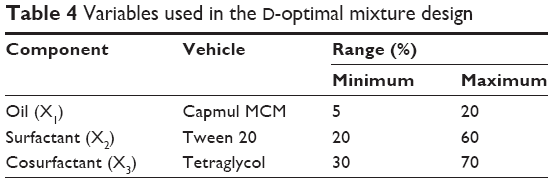 | Table 4 Variables used in the D-optimal mixture design |
As shown in Table 5, the droplet size (Y1) ranged from 10.57 nm to 51.64 nm and cumulative percentage of the drug released in 15 minutes (Y2) ranged from 83.89% to 89.06% for the 16 experimental runs. All responses were simultaneously fitted to linear, quadratic, special cubic, and cubic models by using the Design-Expert software. The cubic model was suggested as the fitting mathematical model for both Y1 and Y2 by comparing several statistical parameters, such as sequential P-value, lack of fit P-value, standard deviation, squared correlation coefficient (R2), and adjusted R2 values (Table 6). The sequential P-values for Y1 and Y2 were 0.0103 and 0.0001, respectively. A sequential P-value of <0.05 indicates that the model terms are significant. The lack of fit P-value is another good statistical parameter for proving better fitness of the model and for evaluating the difference between residual error and pure error from the replicated design points. The lack of fit P-values of the responses Y1 and Y2 were 0.1262 and 0.8724, respectively. A lack of fit P-value of >0.1 indicates adequacy of the model fit. Multiple regression analyses of the responses for the cubic model were expressed in R2, adjusted R2, and adequate precision. R2 values denote the total variation explained by the model. R2 values for the responses Y1 and Y2 were approximately 97% and 99%, respectively. Adjusted R2 values reflect the influence of increasing and decreasing the number of model terms. The adjusted R2 values for the responses Y1 and Y2 were 93% and 97%, respectively. Similar values of R2 and adjusted R2 are desirable for a good model fit.33 In this experiment, all the responses were reasonably close to unity, indicating that the fit was sufficient. Adequate precision was in the range of the predicted response relative to its signal-to-noise ratio. Adequate precision ratios for the responses Y1 and Y2 were 15.337 and 30.757, respectively, indicating an adequate signal because a ratio of >4 is desirable for routing the design space.
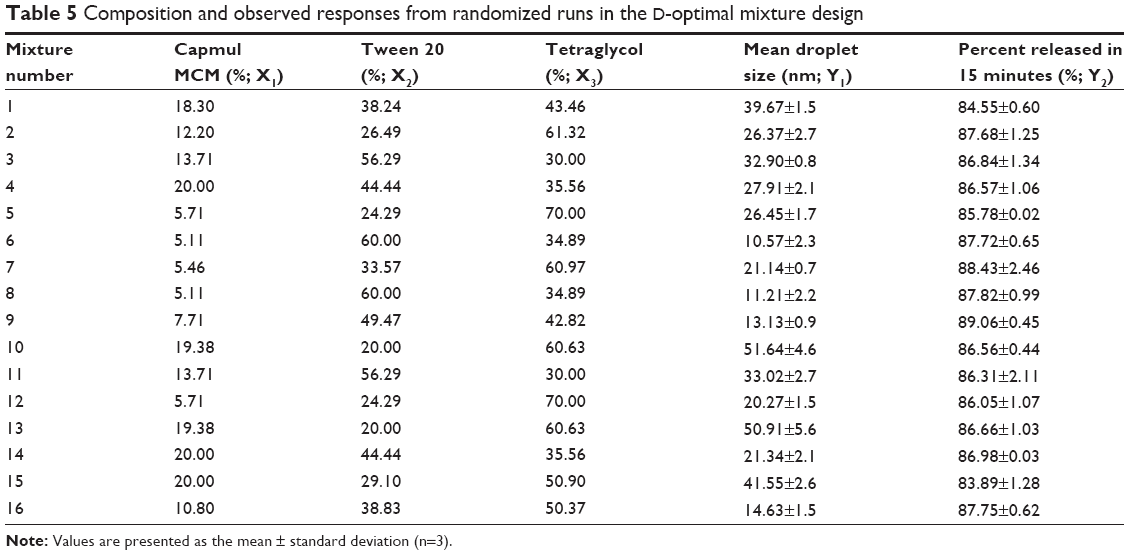 | Table 5 Composition and observed responses from randomized runs in the D-optimal mixture design |
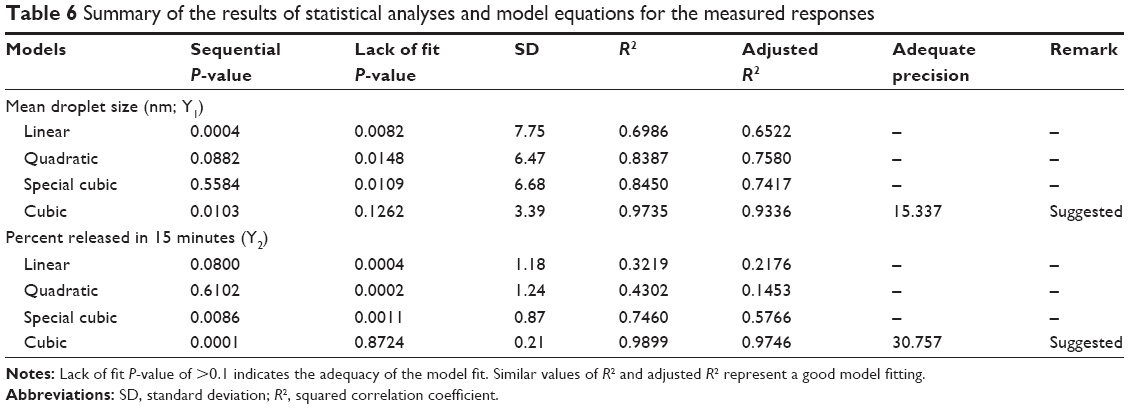 | Table 6 Summary of the results of statistical analyses and model equations for the measured responses |
Design-Expert software was used to confirm the adequacy of the selected model and to produce normal plots of residuals and externally studentized residuals. As shown in Figure 2A, the normal probability plots for residuals formed a straight line because the underlying error allotment was normal, indicating that normality assumptions were suitable for the suggested cubic model. Residuals piled in the middle of the straight line, suggesting that the results of the experimental runs were distributed normally. Figure 2B can be used to estimate the externally studentized residuals for values above 3 or below −3. Outlier data were not obtained for this range. Structureless distributions with noticeable pattern showed that the test did not rely on time and constant variance.
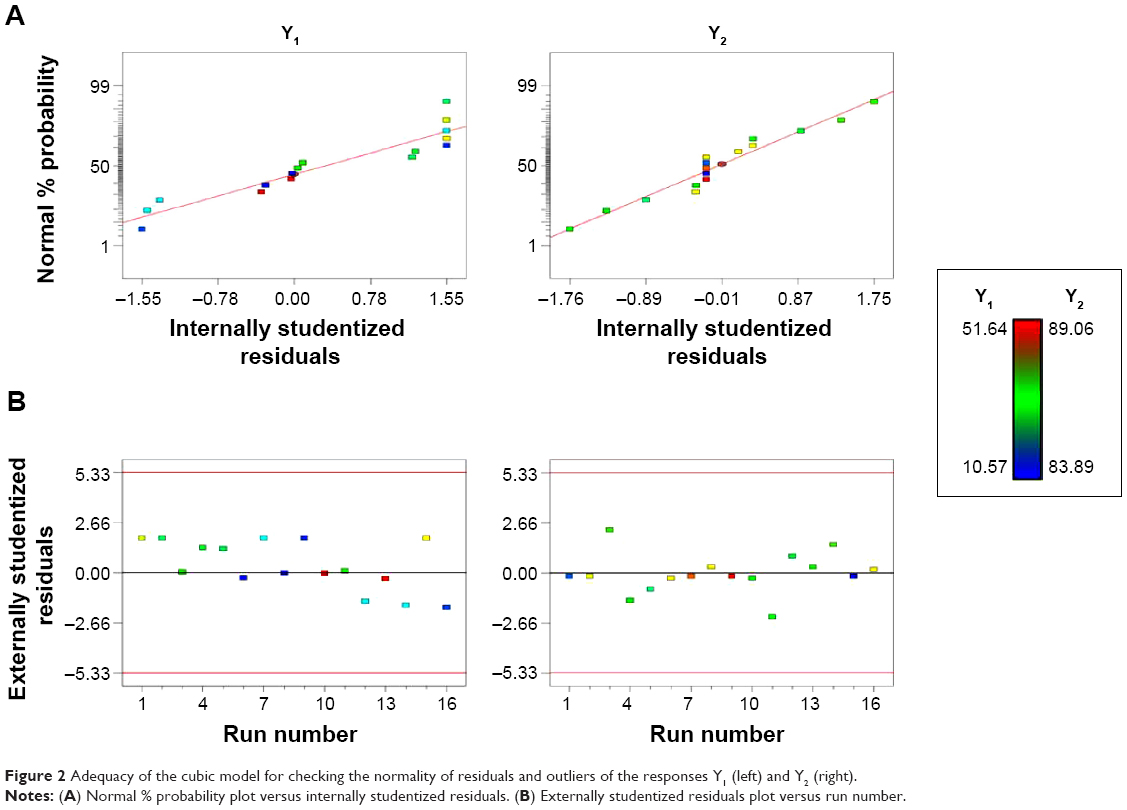 | Figure 2 Adequacy of the cubic model for checking the normality of residuals and outliers of the responses Y1 (left) and Y2 (right). |
Influence of independent variables on droplet size
Results of analysis of variance for droplet size (Y1) are shown in Table 7. The following cubic polynomial equation was constructed based on the results of analysis of variance to validate the relationship between the independent variables and droplet size (Y1).
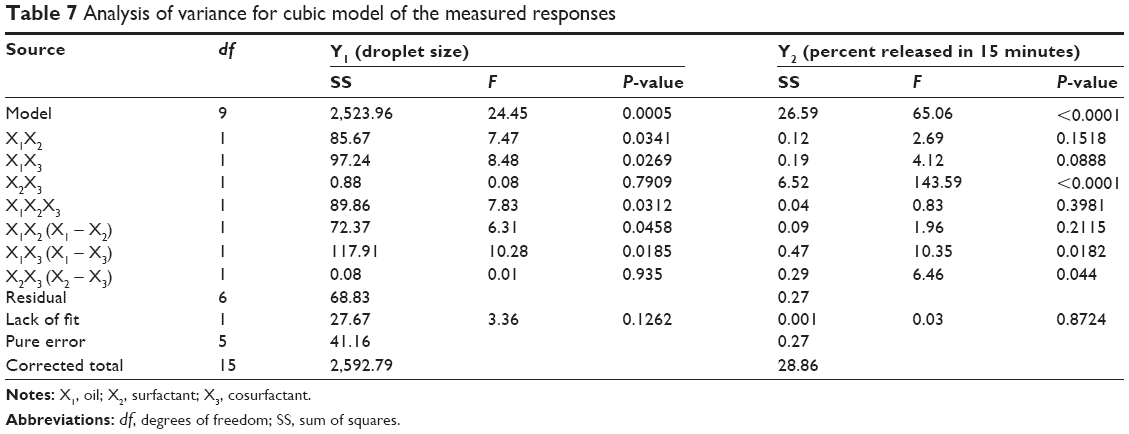 | Table 7 Aanalysis of variance for cubic model of the measured responses |
Y1 = −3,087.50 X1 +10.34 X2 +32.32 X3 +5,529.66 X1X2 +5,825.13 X1X3 −8.72 X2X3 −5,706.54 X1X2X3 +2,519.73 X1X2 (X1 − X2) +3,189.22 X1X3 (X1 − X3) −4.11 X2X3 (X2 − X3) |
|
This relationship was exemplified by a three-dimensional response surface plot (Figure 3A, left panel). The plot was used to extrapolate data on droplet size within the limits of the experimental design.
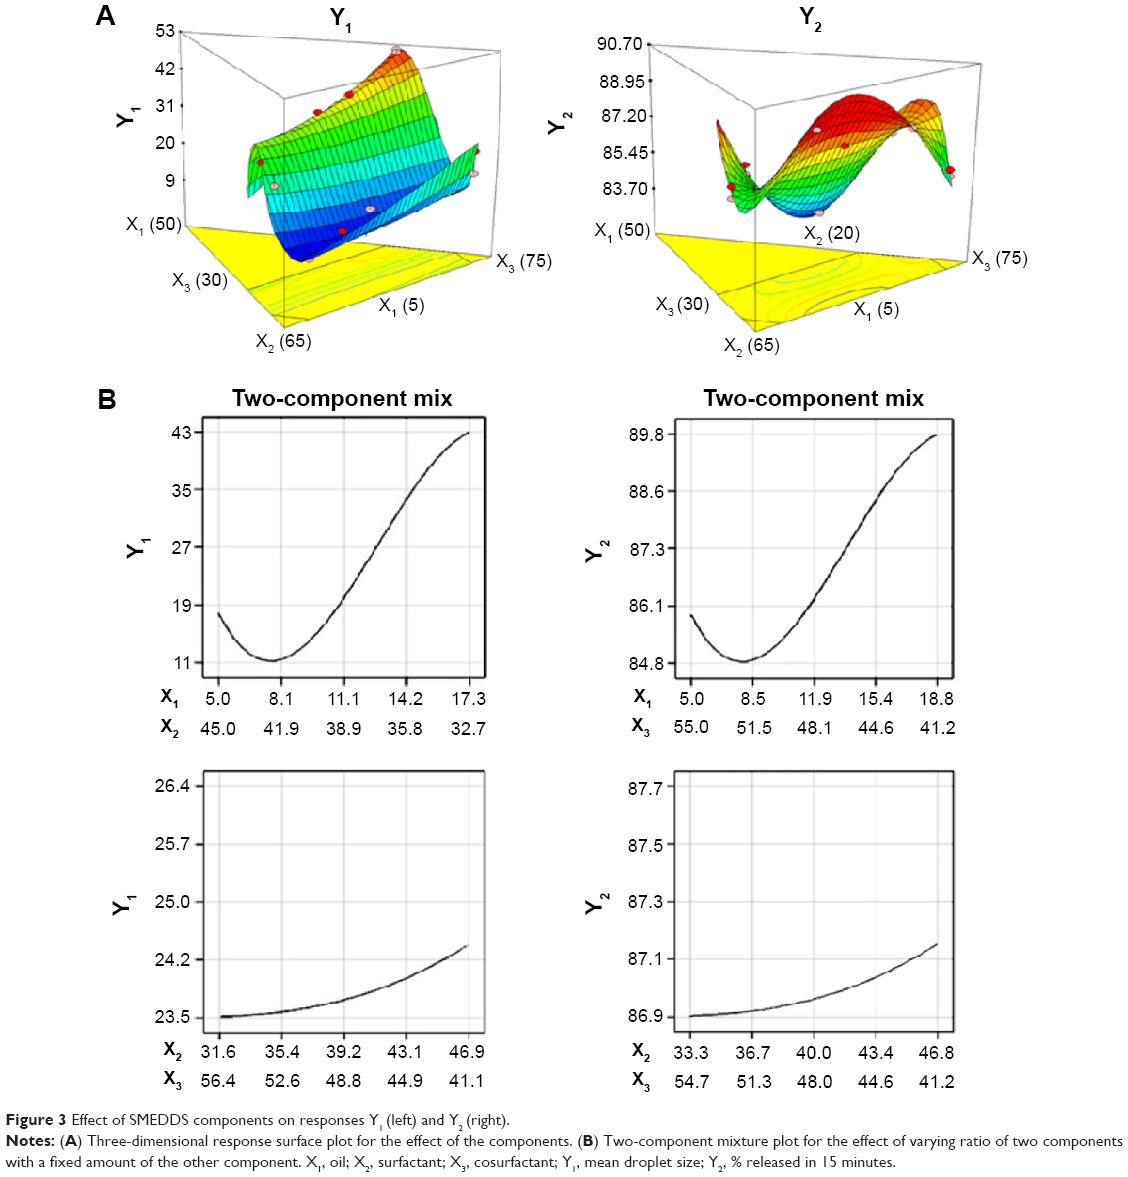 | Figure 3 Effect of SMEDDS components on responses Y1 (left) and Y2 (right). |
The magnitude of coefficients indicates its contribution to the response. The coefficients of X1 and interaction terms with X1 had a significantly high magnitude, indicating that X1 was a critical factor for determining droplet size. A P-value of <0.05 for X1X2, X1X3, X1X2X3, X1X2 (X1 − X2), and X1X3 (X1 − X3) indicated that X1 had a significant effect on Y1. Although some coefficients of X1 were negative, other coefficients such as X1X2, X1X3, X1X2X3, X1X2 (X1 − X2), and X1X3 (X1 − X3) were positive, indicating that X1 had a significant positive effect on Y1. In other words, droplet size was decreased with a decrease in oil content. This suggested that a smaller ratio of oil in the SMEDDS formulation obtained using the D-optimal mixture design resulted in a higher ratio of surfactant and cosurfactant and increased water penetration of the oil droplets, resulting in the disruption of the oil-water interface and eventually decreasing the droplet size.34
Figure 3B (left panel) shows a two-component mixture plot highlighting the effects of varying the ratio of X1 and X2 with a fixed amount of X3. Droplet size increased from 11 nm to 43 nm as X1 increased and X2 decreased. X2 significantly interacted with X1 (P-value of <0.05 for X1X2 and X1X2 [X1 − X2]). This may be because of the reduction in interfacial free energy and better stabilization of the droplets by the strong localization of the surfactant molecules at the oil-water interface.19 Meanwhile, changing the ratio of X2 and X3 while keeping X1 constant had a negligible effect on droplet size (Figure 3B, left panel). Droplet size was constant in the range of 23.5–24.4 nm, with 88% surfactant mixture, regardless of the ratio of surfactant and cosurfactant. This confirmed that the oil content had a significant effect on droplet size.
Influence of independent variables on drug release
The results of analysis of variance for the cumulative percentage of drug released in 15 minutes (Y2) are listed in Table 7. All components of the SMEDDS formulation affected Y2. The relationship between the independent variables is schematically illustrated in a three-dimensional response surface plot (Figure 3A, right panel). On the basis of these results, the following equation was obtained for the cumulative percentage of drug released in 15 minutes (Y2).
Y2 =217.78 X1 +85.07 X2 +83.41 X3 −209.01 X1X2 −255.45 X1X3 +23.73 X2X3 +116.69 X1X2X3 −88.27 X1X2 (X1 − X2) −201.40 X1X3 (X1 − X3) +7.72 X2X3 (X2 − X3) | (2) |
Equation 2 showed that the magnitude of the coefficient was in the order X1 >> X2 ≥ X3 and that X1 was the most significant component of the SMEDDS formulation that affected Y2. This may be because X1 (oil) could solubilize the required dose of the lipophilic drug. Although the coefficients of X1 had a positive effect on Y2, coefficients such as X1X2, X1X3, X1X2 (X1 − X2), and X1X3 (X1 − X3) had a negative effect on Y2, suggesting an inverse relationship between X1 and other parameters.
The two-component mixture plot (Figure 3B, right panel) showed that the dissolution rate decreased from 89.8% to 84.8% as X1 increased and X3 decreased. X3 showed a significant interaction with X1 (P-value <0.05 for X1X3 [X1 − X3] and <0.1 for X1X3). A higher ratio of X3 improved the solubility of ATV and reduced the risk of precipitation because the solubility of ATV in the cosurfactant was significantly higher than that in either oil or the surfactant. As shown in Figure 3B (right panel), the dissolution rate was constant in the range of 86.9%–87.1% for the mixture containing 12% X1 and 88% X2 + X3, regardless of the ratio of X2 and X3. This confirmed that the solubilizing capacity of the cosurfactant enhanced the dissolution of ATV, which is supported by an earlier report that high solubilization could offer high thermodynamic activity of the drug.35
Optimization of SMEDDS formulation using desirability function
The independent variables were simultaneously optimized for all the responses by using the desirability function. Y1 was set to be minimized and Y2 was set to be maximized. After obtaining the polynomial equations for the associations between the responses and independent variables, the optimization was carried out for Y1 and Y2. Figure 4A shows the overlay plot for the effect of different variables on the two responses. The optimized percentages of X1, X2, and X3 were 7.16%, 48.25%, and 44.59%, respectively, with the corresponding desirability value of 0.894. The optimized independent variables and the predicted responses are given in Table 8. The predicted and experimental values were compared using percentage prediction error to determine the accuracy of prediction. Although the percentage prediction error associated with Y1 was slightly high, the experimental values for both Y1 and Y2 were very similar to the predicted values, indicating that the D-optimal mixture design for optimizing the SMEDDS formulation was accurate and reliable. Meanwhile, the transmission electron microscopy analysis for the optimized SMEDDS showed that the emulsion droplets were spherical in the nanometer range, as shown in Figure 4B.
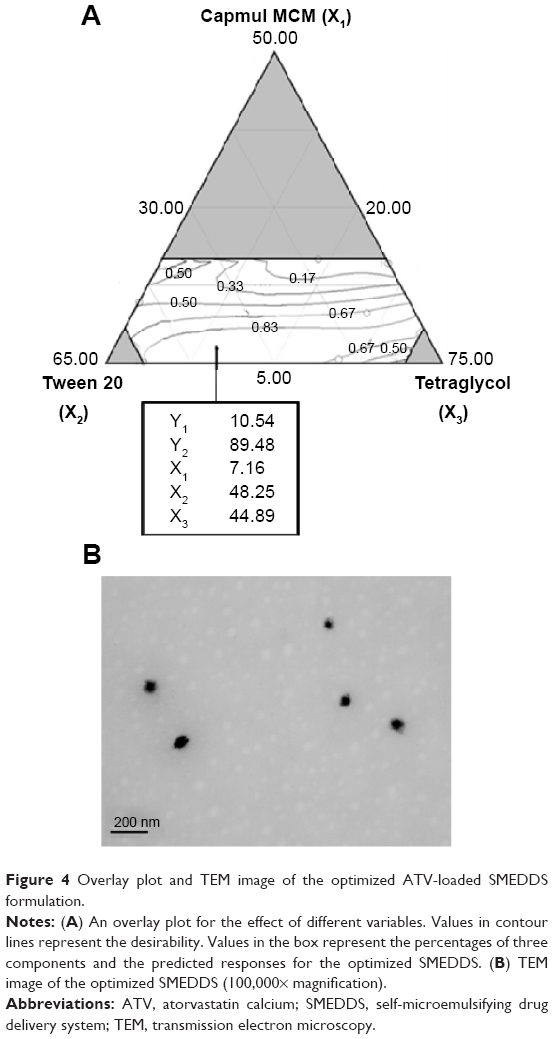 | Figure 4 Overlay plot and TEM image of the optimized ATV-loaded SMEDDS formulation. |
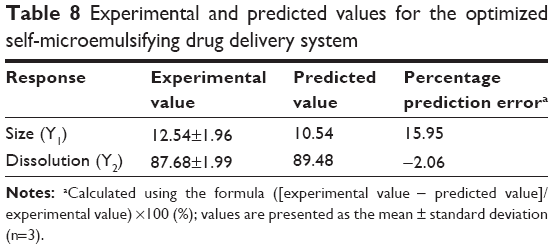 | Table 8 Experimental and predicted values for the optimized self-microemulsifying drug delivery system |
In vitro dissolution profiles
Dissolution profiles of the optimized ATV-loaded SMEDDS formulation and raw ATV powder were determined in the media of SGF, SIF, and distilled water (Figure 5). During the 2-hour experimental period, the raw ATV powder showed very low dissolution of <10% in SGF and approximately 80% and 60% dissolution in SIF and distilled water, respectively. To verify the pH-dependent characteristics of ATV dissolution, the equilibrium solubility of ATV in the various types of medium was measured separately as follows (mg/mL): SIF, 2.49±0.23; distilled water, 1.39±0.55; and SGF, 0.05±0.04. Because ATV is an acidic drug, its dissolution might be higher at alkaline pH.36 The optimized SMEDDS formulation dramatically improved the dissolution of ATV within 5 minutes in all the media tested, with >90% dissolution in SIF and distilled water and approximately 40% dissolution in SGF. Thus, the optimized SMEDDS formulation increased the dissolution of ATV by 12.3-fold, 2.6-fold, and 1.7-fold in SGF, distilled water, and SIF, respectively, compared with the raw ATV powder. These results indicate that the optimized SMEDDS formulation not only provided an increased surface area by producing nanosized particles, but also increased the solubilization of ATV, thus enhancing its dissolution.
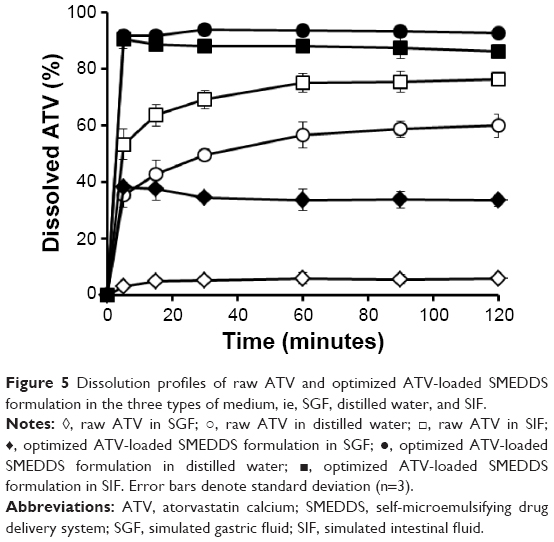 | Figure 5 Dissolution profiles of raw ATV and optimized ATV-loaded SMEDDS formulation in the three types of medium, ie, SGF, distilled water, and SIF. |
In vivo oral absorption and pharmacokinetic behavior
The pharmacokinetic behavior of ATV was investigated after oral administration of the optimized ATV-loaded SMEDDS formulation and the ATV suspension in rats. Plasma levels of ATV were measured and plotted against time (Figure 6). For the period of 0–4 hours, plasma concentrations of ATV in rats receiving the optimized SMEDDS formulation were significantly higher than those in rats receiving the ATV suspension. This initial high increment might be due to the rapid dissolution induced by the optimized SMEDDS formulation. The pharmacokinetic parameters are listed in Table 9. Time needed to reach the maximum plasma concentration values were identical for both the ATV suspension and the optimized SMEDDS formulation. However, the optimized SMEDDS formulation showed significantly higher maximum plasma concentration and AUC values (4.3-fold and 3.4-fold higher values, respectively; P<0.05) than the ATV suspension. This enhancement could be attributed to the improvement in solubility and dissolution rate of ATV by the optimized SMEDDS formulation, which sequentially increased membrane fluidity and assisted in diffusion of the drug through the biological membrane.37 Moreover, mean residence time of the optimized SMEDDS formulation was significantly shorter (P<0.05) than that of the ATV suspension. The approximately 1.2-hour difference in mean residence time reflects the dissolution time required for the ATV suspension before absorption in the gastrointestinal tract. This behavior is closely related to the limited dissolution of raw ATV in SGF. As discussed earlier, dissolution of ATV from the SMEDDS formulation was fast and reached a peak level instantly. The relative bioavailability of ATV in the optimized ATV-loaded SMEDDS formulation was significantly higher than that of ATV in a similar ATV-loaded SMEDDS formulation reported in the literature.11,38 The ATV-loaded SMEDDS formulations increased the oral bioavailability of ATV from 150% to 213% when compared with the commercial tablet or suspension. In addition, the total amount of the optimized SMEDDS formulation was significantly lower (100 μL) than that of similar ATV-loaded SMEDDS formulations reported (200–1,000 μL). Therefore, we conclude that the optimized SMEDDS formulation developed in this study was effective in enhancing the oral absorption of ATV and in reducing the volume of administration.
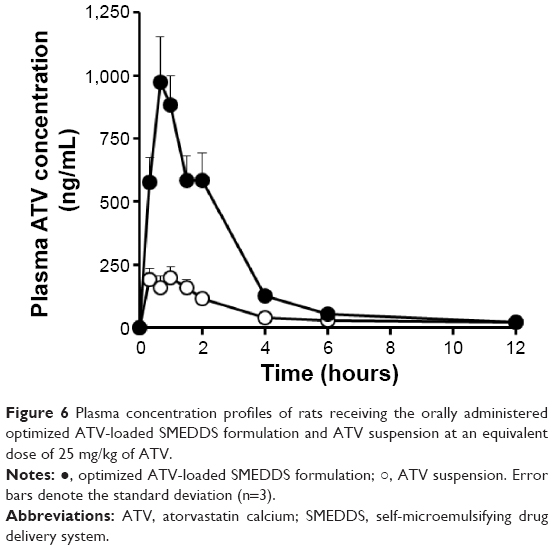 | Figure 6 Plasma concentration profiles of rats receiving the orally administered optimized ATV-loaded SMEDDS formulation and ATV suspension at an equivalent dose of 25 mg/kg of ATV. |
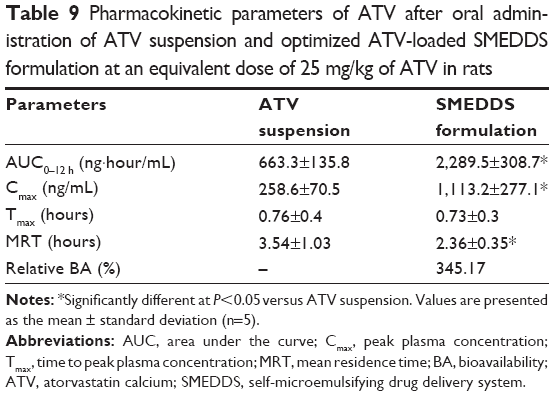 | Table 9 Pharmacokinetic parameters of ATV after oral administration of ATV suspension and optimized ATV-loaded SMEDDS formulation at an equivalent dose of 25 mg/kg of ATV in rats |
Conclusion
In this study, we successfully developed an optimized ATV-loaded SMEDDS formulation by using the D-optimal mixture design, a statistical optimization tool based on response surface methodology. The optimized ATV-loaded SMEDDS formulation included 7.16% Capmul MCM (oil; X1), 48.25% Tween 20 (surfactant; X2), and 44.59% Tetraglycol (cosurfactant; X3) and showed excellent in vitro dissolution and in vivo oral bioavailability in rats when compared with the ATV suspension. Good agreement was observed between model prediction and experimental values of mean droplet size (Y1) and percentage of drug released in 15 minutes (Y2). Thus, the optimized ATV-loaded SMEDDS formulation could be potentially used for improving the oral absorption of poorly water-soluble drugs.
Acknowledgment
This research was supported by the Basic Science Research Program through the National Research Foundation of Korea funded by the Ministry of Education, Science, and Technology (2011-0009876).
Disclosure
The authors report no conflicts of interest in this work.
References
He J, Gu D, Reynolds K, et al. Serum total and lipoprotein cholesterol levels and awareness, treatment, and control of hypercholesterolemia in China. Circulation. 2004;110(4):405–411. | ||
Vaculikova E, Grunwaldova V, Kral V, Dohnal J, Jampilek J. Preparation of candesartan and atorvastatin nanoparticles by solvent evaporation. Molecules. 2012;17(11):13221–13234. | ||
Wu X, Whitfield LR, Stewart BH. Atorvastatin transport in the Caco-2 cell model: contributions of P-glycoprotein and the proton-monocarboxylic acid co-transporter. Pharm Res. 2000;17(2):209–215. | ||
Lennernäs H. Clinical pharmacokinetics of atorvastatin. Clin Pharmacokinet. 2003;42(13):1141–1160. | ||
Arunkumar N, Deecaraman M, Rani C, Mohanraj KP, Venkates Kumar K. Preparation and solid state characterization of atorvastatin nanosuspensions for enhanced solubility and dissolution. Int J Pharm Tech Res. 2009;1(4):1725–1730. | ||
Anwar M, Warsi MH, Mallick N, et al. Enhanced bioavailability of nano-sized chitosan–atorvastatin conjugate after oral administration to rats. Eur J Pharm Sci. 2011;44(3):241–249. | ||
Ayalon A, Levinger M, Roytblat S, Niddam V, Lifshitz R, Aronhime J. Polymorphic form of atorvastatin calcium. United States Patent US 7,411,075. August 8, 2008. | ||
Choudhary A, Rana AC, Aggarwal G, Kumar V, Zakir F. Development and characterization of an atorvastatin solid dispersion formulation using skimmed milk for improved oral bioavailability. Acta Pharm Sin B. 2012;2(4):421–428. | ||
Palem CR, Patel S, Pokharkar VB. Solubility and stability enhancement of atorvastatin by cyclodextrin complexation. PDA J Pharm Sci Technol. 2009;63(3):217–225. | ||
Zhang HX, Wang JX, Zhang ZB, Le Y, Shen ZG, Chen JF. Micronization of atorvastatin calcium by antisolvent precipitation process. Int J Pharm. 2009;374(1):106–113. | ||
Jin SK, Cho WK, Park HJ, et al. Development of self-microemulsifying drug delivery system for enhancing the bioavailability of atorvastatin. J Pharm Invest. 2011;41(2):103–109. | ||
Song WH, Park JH, Yeom DW, et al. Enhanced dissolution of celecoxib by supersaturating self-emulsifying drug delivery system (S-SEDDS) formulation. Arch Pharm Res. 2013;36(1):69–78. | ||
Bandivadeka MM, Pancholi SS, Kaul-Ghanekar R, Choudhari A, Koppikar S. Self-microemulsifying smaller molecular volume oil (Capmul MCM) using non-ionic surfactants: a delivery system for poorly water-soluble drug. Drug Dev Ind Pharm. 2012;38(7):883–892. | ||
Constantinides PP. Lipid microemulsions for improving drug dissolution and oral absorption: physical and biopharmaceutical aspects. Pharm Res. 1995;12(11):1561–1572. | ||
Song WH, Yeom DW, Lee DH, et al. In situ intestinal permeability and in vivo oral bioavailability of celecoxib in supersaturating self-emulsifying drug delivery system. Arch Pharm Res. 2014;37(5): 626–635. | ||
Porter CJ, Charman WN. In vitro assessment of oral lipid based formulations. Adv Drug Deliv Rev. 2001;50 Suppl 1:S127–S147. | ||
Thi TD, Van Speybroeck M, Barillaro V, et al. Formulate-ability of ten compounds with different physicochemical profiles in SMEDDS. Eur J Pharm Sci. 2009;38(5):479–488. | ||
Liu Y, Zhang P, Feng N, Zhang X, Wu S, Zhao J. Optimization and in situ intestinal absorption of self-microemulsifying drug delivery system of oridonin. Int J Pharm. 2009;365(1):136–142. | ||
Marasini N, Yan YD, Poudel BK, Choi HG, Yong CS, Kim JO. Development and optimization of self-nanoemulsifying drug delivery system with enhanced bioavailability by Box-Behnken design and desirability function. J Pharm Sci. 2012;101(12):4584–4596. | ||
Holm R, Jensen IH, Sonnergaard J. Optimization of self-microemulsifying drug delivery systems (SMEDDS) using a D-optimal design and the desirability function. Drug Dev Ind Pharm. 2006;32(9):1025–1032. | ||
Mukherjee T, Plakogiannis FM. Development and oral bioavailability assessment of a supersaturated self-microemulsifying drug delivery system (SMEDDS) of albendazole. J Pharm Pharmacol. 2010;62(9):1112–1120. | ||
Mura P, Furlanetto S, Cirri M, Maestrelli F, Marras AM, Pinzauti S. Optimization of glibenclamide tablet composition through the combined use of differential scanning calorimetry and D-optimal mixture experimental design. J Pharm Biomed Anal. 2005;37(1):65–71. | ||
Borhade V, Nair H, Hegde D. Design and evaluation of self-microemulsifying drug delivery system (SMEDDS) of tacrolimus. AAPS Pharm Sci Tech. 2008;9(1):13–21. | ||
Pouton CW. Lipid formulations for oral administration of drugs: non-emulsifying, self-emulsifying and ‘self-microemulsifying’drug delivery systems. Eur J Pharm Sci. 2000;11 Suppl 2:S93–S98. | ||
Jannin V, Musakhanian J, Marchaud D. Approaches for the development of solid and semi-solid lipid-based formulations. Adv Drug Deliv Rev. 2008;60(6):734–746. | ||
Li L, Yi T, Lam CW. Interactions between human multidrug resistance related protein (MRP2; ABCC2) and excipients commonly used in self-emulsifying drug delivery systems (SEDDS). Int J Pharm. 2013;447(1):192–198. | ||
Dixit AR, Rajput SJ, Patel SG. Preparation and bioavailability assessment of SMEDDS containing valsartan. AAPS Pharm Sci Tech. 2010; 11(1):314–321. | ||
Gupta S, Chavhan S, Sawant KK. Self-nanoemulsifying drug delivery system for adefovir dipivoxil: design, characterization, in vitro and ex vivo evaluation. Colloids Surf A Physicochem Eng Asp. 2011;392(1):145–155. | ||
Cui SX, Nie SF, Li L, Wang CG, Pan WS, Sun JP. Preparation and evaluation of self-microemulsifying drug delivery system containing vinpocetine. Drug Dev Ind Pharm. 2009;35(5):603–611. | ||
Malcolmson C, Satra C, Kantaria S, Sidhu A, Lawrence MJ. Effect of the nature of oil on the incorporation of testosterone propionate into nonionic oil-in-water microemulsions. J Pharm Sci. 1998;87(1):109–116. | ||
Warisnoicharoen W, Lansley AB, Lawrence MJ. Nonionic oil in-water microemulsions: the effect of oil type on phase behaviour. Int J Pharm. 2000;198(1):7–27. | ||
Dressman JB, Reppas C. In vitro-in vivo correlations for lipophilic, poorly water soluble drugs. Eur J Pharm Sci. 2000;11 Suppl 2:S73–S80. | ||
Atikler U, Demir H, Tokatli F, Tihminlioğlu F, Balköse D, Ülkü S. Optimisation of the effect of colemanite as a new synergistic agent in an intumescent system. Polym Degrad Stab. 2006;91(7):1563–1570. | ||
Balakrishnan P, Lee BJ, Oh DH, et al. Enhanced oral bioavailability of coenzyme Q10 by self-emulsifying drug delivery systems. Int J Pharm. 2009;374(1):66–72. | ||
Akhter S, Jain GK, Ahmad FJ, et al. Investigation of nanoemulsion system for transdermal delivery of domperidone: ex-vivo and in vivo studies. Curr Nanosci. 2008;4(4):381–390. | ||
Attama AA, Nkemnele MO. In vitro evaluation of drug release from self micro-emulsifying drug delivery systems using a biodegradable homolipid from Capra hircus. Int J Pharm. 2005;304(1):4–10. | ||
Grove M, Müllertz A, Pedersen GP, Nielsen JL. Bioavailability of seocalcitol: III. Administration of lipid-based formulations to minipigs in the fasted and fed state. Eur J Pharm Sci. 2007;31(1):8–15. | ||
Shen H, Zhong M. Preparation and evaluation of self-microemulsifying drug delivery systems (SMEDDS) containing atorvastatin. J Pharm Pharmacol. 2006;58(9):1183–1191. |
 © 2015 The Author(s). This work is published and licensed by Dove Medical Press Limited. The full terms of this license are available at https://www.dovepress.com/terms.php and incorporate the Creative Commons Attribution - Non Commercial (unported, v3.0) License.
By accessing the work you hereby accept the Terms. Non-commercial uses of the work are permitted without any further permission from Dove Medical Press Limited, provided the work is properly attributed. For permission for commercial use of this work, please see paragraphs 4.2 and 5 of our Terms.
© 2015 The Author(s). This work is published and licensed by Dove Medical Press Limited. The full terms of this license are available at https://www.dovepress.com/terms.php and incorporate the Creative Commons Attribution - Non Commercial (unported, v3.0) License.
By accessing the work you hereby accept the Terms. Non-commercial uses of the work are permitted without any further permission from Dove Medical Press Limited, provided the work is properly attributed. For permission for commercial use of this work, please see paragraphs 4.2 and 5 of our Terms.