")
Back to Journals » Risk Management and Healthcare Policy » Volume 14
Development and Evaluation of Nutrition Screening Tool in Patients with Hepatitis B-Related Cirrhosis: A Cross-Sectional Study
Authors Chen S, Li H, Lin X, Hu S, Zhang Z
Received 31 December 2020
Accepted for publication 29 March 2021
Published 6 May 2021 Volume 2021:14 Pages 1823—1831
DOI https://doi.org/10.2147/RMHP.S299428
Checked for plagiarism Yes
Review by Single anonymous peer review
Peer reviewer comments 3
Editor who approved publication: Professor Marco Carotenuto
Suzhen Chen,1 Hong Li,2 Xiuru Lin,3 Shanshan Hu,1 Zhixin Zhang1
1Department of Hepatology, Mengchao Hepatobiliary Hospital of Fujian Medical University, Fuzhou, Fujian Province, People’s Republic of China; 2School of Nursing, Fujian Medical University, Fuzhou, People’s Republic of China; 3Nursing Department, Mengchao Hepatobiliary Hospital of Fujian Medical University, Fuzhou, Fujian Province, People’s Republic of China
Correspondence: Hong Li
School of Nursing, Fujian Medical University, Fuzhou, People’s Republic of China
Email [email protected]
Aim: Malnutrition is common in cirrhotic patients; however, there is no gold standard for nutritional assessment for this population. The aim of this study was to develop a novel nutritional screening tool based on objective indicators for cirrhotic patients chronically infected with hepatitis B virus (HBV).
Methods: This was a cross-sectional study. Patients with hepatitis B-related cirrhosis were recruited. Malnutrition was diagnosed by the presence of any of the following conditions: Nutrition Risk Screening 2002 score greater than 3 points, Subjective Global Assessment grade B or C, and body mass index (BMI) < 18.5 kg/m2. Nomogram model and decision tree model were developed, and the area under the receiver operating characteristic curve (AUROC) was compared.
Results: Among the 231 studied cases, 92 (39%) were malnourished. Malnourished patients had significantly lower serum albumin, BMI and hand grip strength levels, but higher serum creatinine level and Child–Pugh grade. Two models were developed based on these variables. The nomogram model had a sensitivity of 0.696, a specificity of 0.820 and an accuracy of 0.813. The AUROC of nomogram model was 0.813 (95% CI: 0.758– 0.869, p < 0.001). For the decision tree model, the sensitivity, specificity and accuracy are 0.761, 0.885 and 0.886, respectively, with an AUROC of 0.886 (95% CI: 0842– 0.930, p < 0.001). The difference in AUROC between these two models was not statistically significant (p < 0.001).
Conclusion: The nomogram model and decision tree model developed in this study may aid assessing nutritional status for cirrhotic patients with HBV.
Keywords: cirrhosis, nutrition, screen, nomogram, decision tree
Introduction
Hepatitis B virus (HBV) infection is a common cause of chronic liver disease. Patients with chronic hepatitis B may develop liver fibrosis, cirrhosis, or hepatocellular carcinoma (HCC), which may eventually lead to high mortality.1 Protein calorie malnutrition is frequently observed in patients with HBV-related cirrhosis.2 Previous studies have shown that early nutritional intervention can improve the survival rate in cirrhotic patients.3,4 Therefore, identifying patients with high risks of malnutrition is of great significance in the management of cirrhosis.5
The most widely used tools for nutritional assessment are Subjective Global Assessment (SGA), Nutrition Risk Screening 2002 (NRS 2002), and body mass index (BMI).6 SGA is a method proposed by Detsky et al in 19877 and has been recommended by guidelines for nutritional assessment in hospital settings.8 The compositions of SGA include weight change, diet change, gastrointestinal symptoms, functional status and physical examination (such as edema or loss of subcutaneous fat). The NRS is a semi-quantitative method including three compositions: BMI, the changes in weight in the past 3 months and the changes in food intake.9 Although SGA and NRS are two different tools, there are some overlaps in the questionnaire. Both of them have been shown to correlate with the outcome of hospitalized patients.10
However, all of the three tools are not developed based on cirrhotic population thus may have some defects when used in such population. For example, the BMI level is inaccurate when cirrhotic patients have ascites. The NRS 2002 requires the exact weight in the last 3 months and this may easily lead to memory bias. The SGA is complicated and not user-friendly. A simple and objective tool is needed for cirrhotic patients for assessment of malnutrition risk. The aim of this study is to develop a novel nutritional screening tool based on objective indicators for HBV-related cirrhotic patients.
Participants and Methods
Participants
This is a cross-sectional study. The convenience sampling method was used to recruit participants with HBV-related cirrhosis in Mengchao Hepatobiliary Hospital of Fujian Medical University from April 2019 to January 2020. The inclusion criteria were as follows: 1) age ≥18 years; 2) agreed to participate in this study. The exclusion criteria were as follows: 1) with missing data in key variables; 2) with other liver diseases such as alcoholic hepatitis, hepatitis C, autoimmune hepatitis, hepatocellular carcinoma (HCC) and acute on chronic liver failure.
The following are the criteria for diagnosis of liver diseases. Chronic HBV infection was defined by HBsAg positivity for more than 6 months. Cirrhosis was diagnosed by the typical changes in radiology or histology or the presence of clinical symptoms such as ascites, variceal bleeding, and hepatic encephalopathy.1 Alcoholic liver disease was diagnosed by alcohol consumption for more than 40g/day in female or 60g/day in male.11 Hepatitis C was diagnosed based on the positivity of serum HCV antibody. The diagnosis of HCC was based on current diagnostic definitions,12,13 briefly, “rapid wash in and out” manifestations in enhanced imaging or histology-proved malignancy in liver tissue. Liver failure was defined based on the APASL guideline for acute on chronic liver failure:14 INR >1.5 and bilirubin >10 upper limit units, and with hepatic encephalopathy within 4 weeks. The diagnosis of autoimmune hepatitis was based on the diagnostic scoring system proposed in 1999.15
Sample Size Calculation
Sample size estimation is based on the following formula:  , where the
  = 1.96 and p is the incidence of malnutrition in cirrhotic population which is about 50% as reported by literature.16,17 The allowable error is 0.07. The required sample size is
 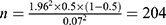 . When the drop-out rate of 10% was taken into consideration, the final estimated sample size is 225 cases.
Data Collection and Measurements
The following variables were collected from all participants: age, sex, history of smoking and alcohol intake, medical history of diabetes and hypertension, Child–Pugh score, cirrhotic complications (ascites, variceal bleeding, hepatic encephalopathy, spontaneous bacterial peritonitis, portal hypertension, hepatorenal syndrome), BMI (weight in kilograms divided by height in meters squared), triceps skinfold thickness (TSF), mid-arm circumference (MAC), hand grip strength, hemoglobin, lymphocyte count, bilirubin, albumin, preprotein, cholesterol, creatinine, cholinesterase, prothrombin time (PT), international normalised ratio (INR).
Height, weight, MAC and TSF were measured within 24 hours after admission. Each measurement was repeated 3 times by two independent investigators and the mean of each variable was used for final analysis. The laboratory indicators were collected within 72 hours after admission.
As there is no gold standard for malnutrition for cirrhotic patients, in this study, three criteria were used to identify cases with malnutrition: NRS 2002 (>3), SGA (B or C), and BMI (<18.5kg/m2).3 Patients with the presence of any of the above conditions were defined as malnutrition.
Statistical Analysis
R software was used for statistical analysis (http://www.r-project.org/). Continuous data with normal distribution were compared using Student t-test and the rests were compared using Mann–Whitney rank sum test. Categorical data were analyzed using the Fisher exact test or chi-square test. Univariate and multivariate logistic regressions were used to select the risk factors of malnutrition for models. Nomogram and decision tree models were developed for predicting malnutrition. Receiver operating characteristic (ROC) curve was used to evaluate the performance of models. The area under the ROC curve (AUROC) was compared by the Z test. All tests were two-sided (α =0.05) and a p value <0.05 was considered as statistically significant.
Ethics
This study was approved by the Ethics Committee of Mengchao Hepatobiliary Hospital of Fujian Medical University (approval number: 2019-024-01) and was incompliance with the Declaration of Helsinki. All participants were informed about the purpose of the study and signed the informed consent.
Patient and Public Involvement
Patients or the public were not involved in the design, or conduct, or reporting, or dissemination plans of our research.
Results
Baseline Characteristics of Study Patients
A total of 647 patients with HBV-related cirrhosis were hospitalized during study period. Among them, 54 cases were excluded for alcoholic liver disease, 197 for HCC, 60 for liver failure, 6 for hepatitis C, and 27 for refusing to participate. Among the rest of 328 patients, 46 patients were found to have cancer or liver failure during hospitalization and 24 patients did not have complete data and were then excluded. A total of 231 cases were eligible for final analysis (Figure 1). The average age of this cohort is 55.32 ± 11.43 years old and 74% of them were male. Forty-five percent of them were Child–Pugh grade A. The BMI level was 23.12 ± 3.44 kg/m2.
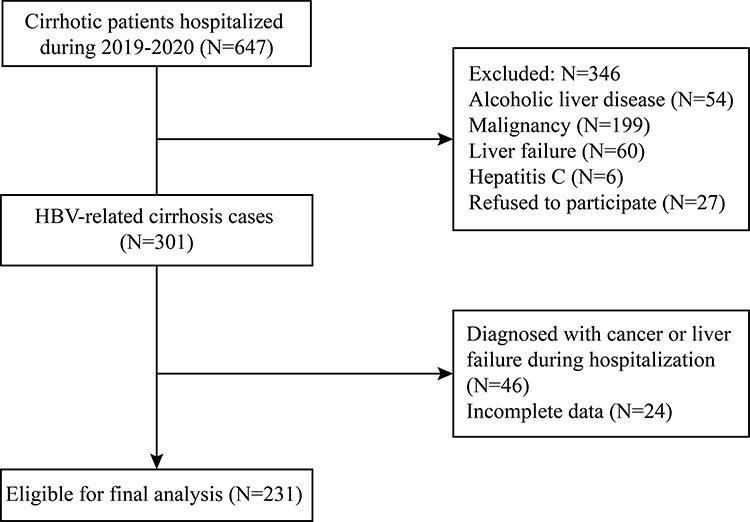 |
Figure 1 Flow chart of case selection. |
Comparison Between Malnourished and Nourished Patients
Among 231 cases, 92 (39%) cases were malnourished. The baseline characteristics of malnourished patients identified by different nutritional assessment tools are displayed in Supplementary Table 1. The comparison between malnourished and nourished group was shown in Table 1. Compared with nourished patients, malnourished patients were older (58.67 ± 11.81 vs 53.11 ± 10.65, p<0.001), had lower BMI level (21.89 ± 3.71 vs 23.94 ± 2.98, p<0.001) and more likely to be decompensated cirrhosis (Child–Pugh grade B-C, 71% vs 44%, p<0.001). The hemoglobin and albumin level were lower while the creatinine was higher in the malnourished group. The presence of liver-specific complications, including the ascites, variceal bleeding, hepatic encephalopathy, spontaneous bacterial peritonitis, portal hypertension, and the hepatorenal syndrome were similar between the two groups. The comparison of the nutrition-specific index showed that, the malnourished group had lower MAC (25.43 ± 3.42 vs 27.29 ± 3.60, p<0.001), lower TSF level (18.57 ± 7.98 vs 21.01 ± 10.05, p=0.042) and lower hand grip strength level (26.25 ± 16.18 vs 40.24 ± 20.04, p=0.237). All patients were followed up for at least one year. The 1-year mortality of malnourished patients was 16% while only 6% in nourished group (p=0.009).
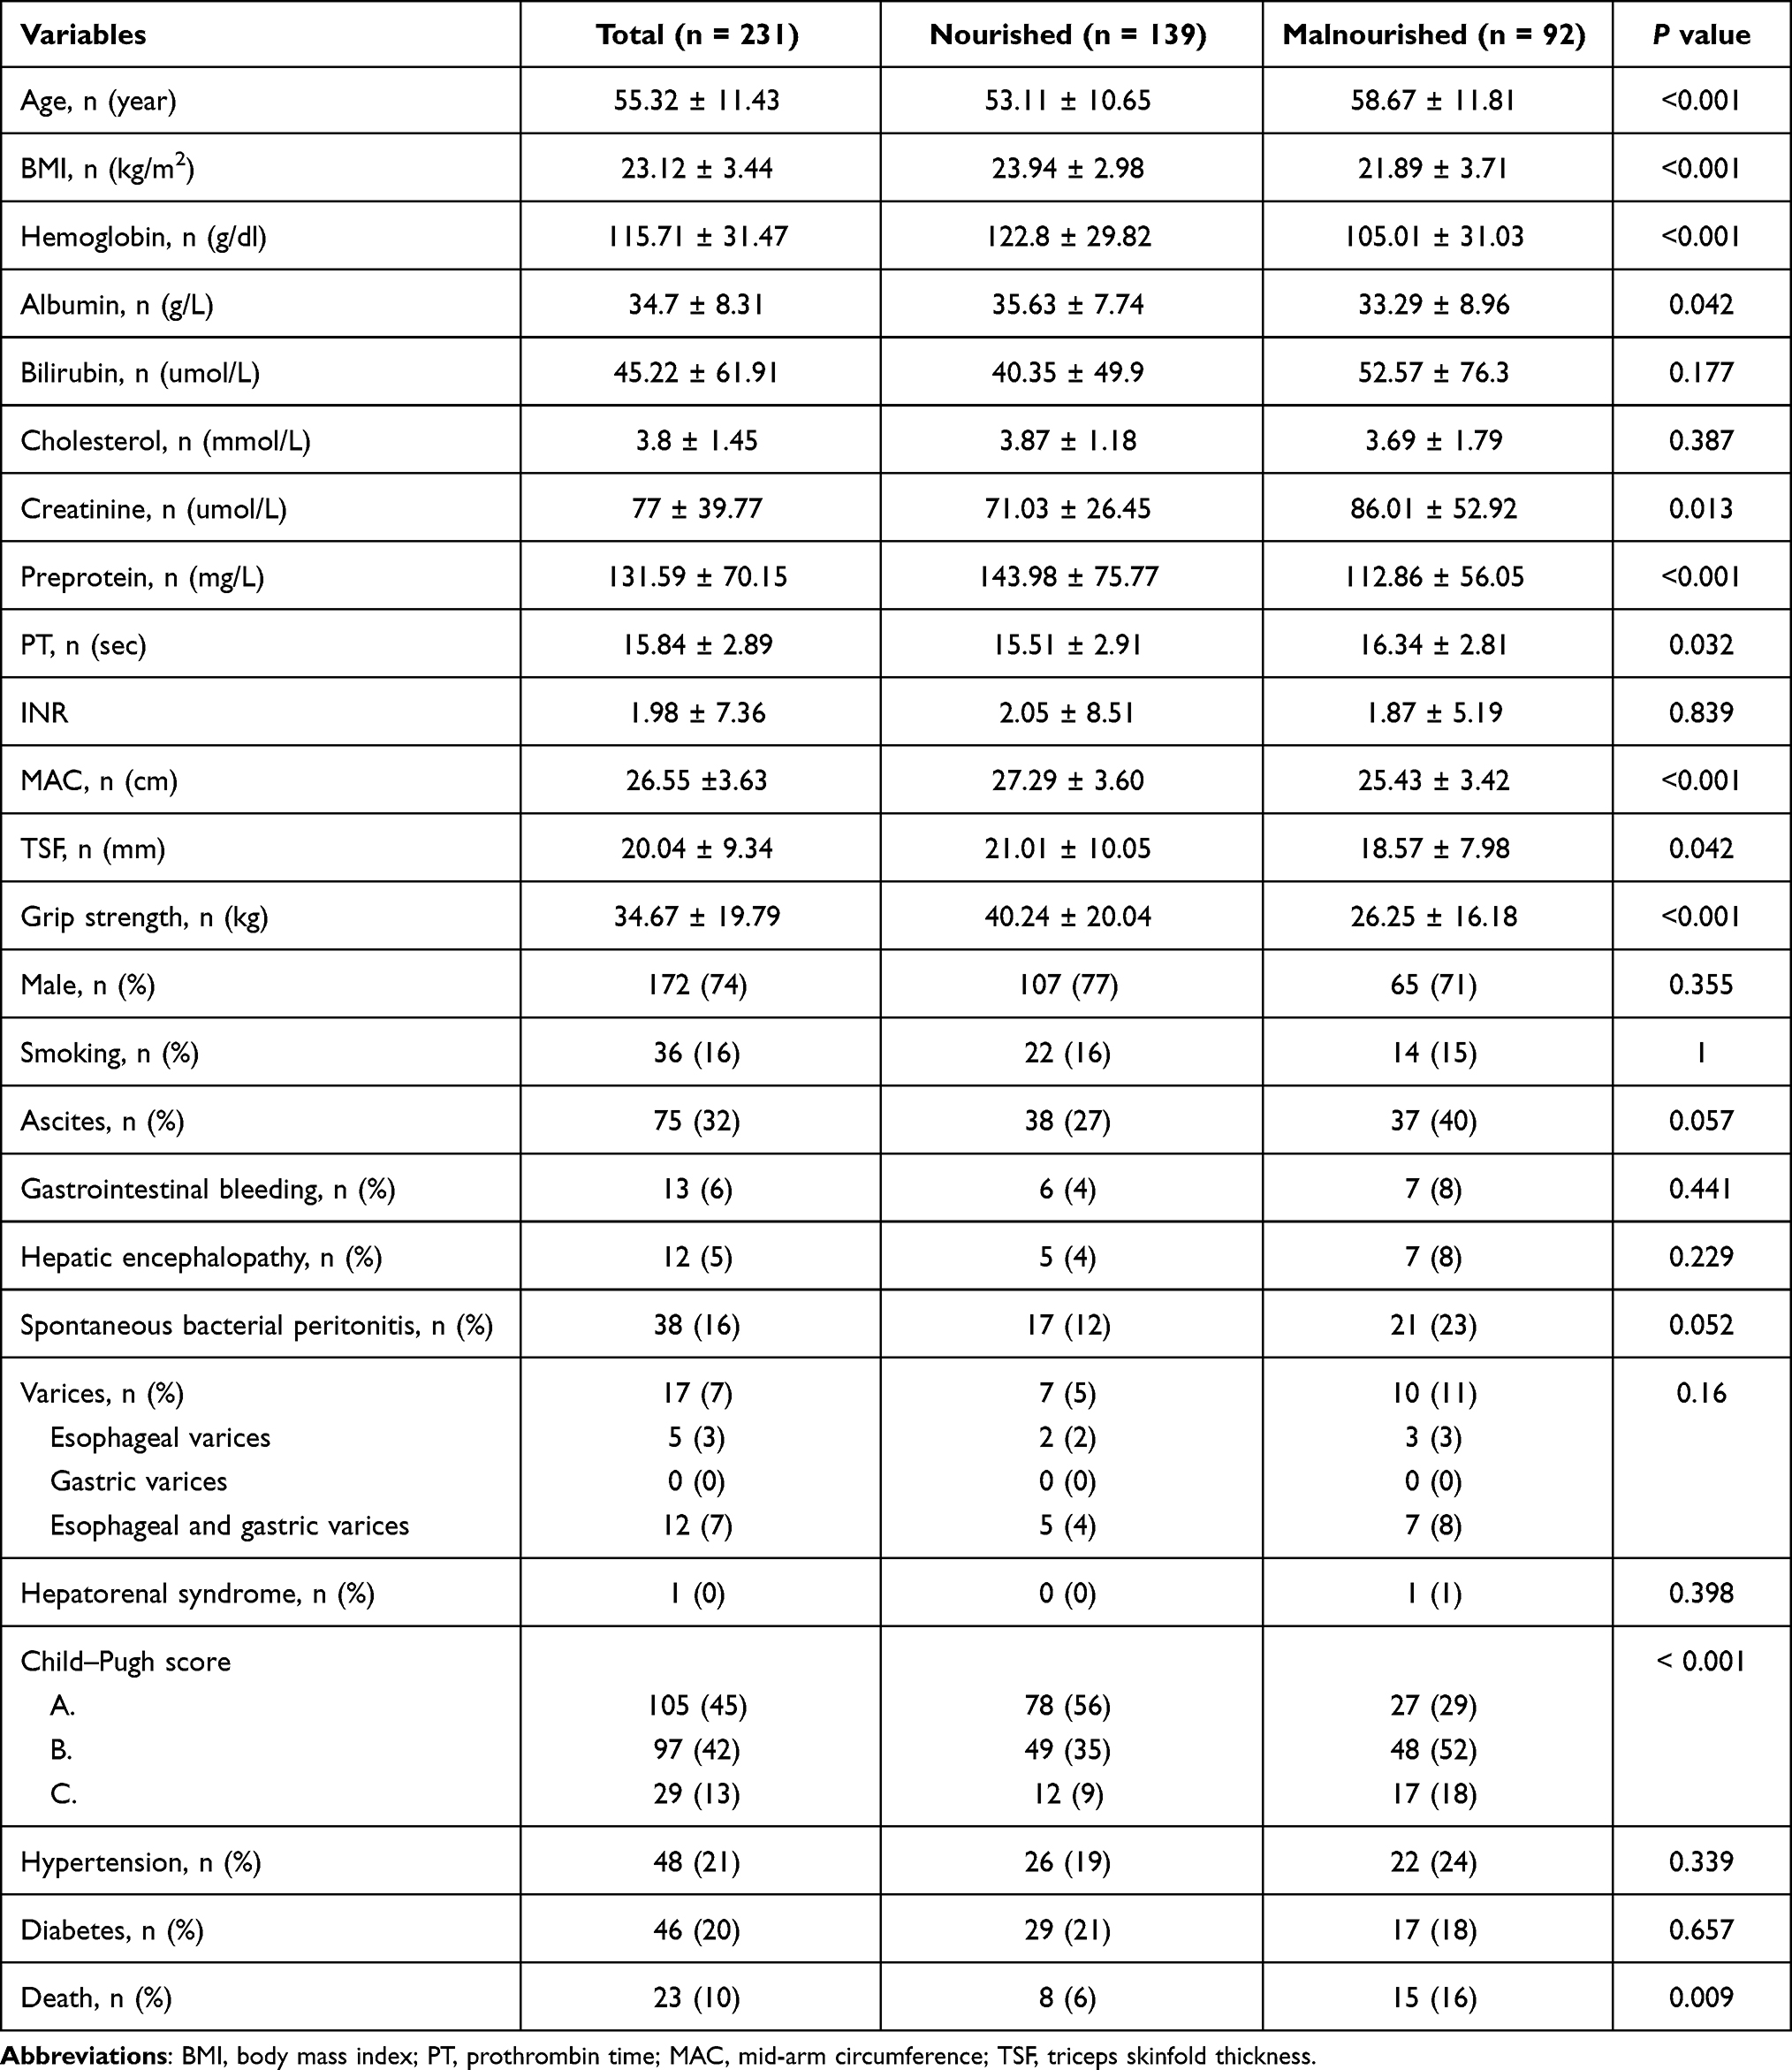 |
Table 1 Baseline Characteristics of Study Patients |
Univariate and Multivariate Analysis for the Risk Factors of Malnutrition
Univariate analysis showed that age, BMI, hemoglobin, preprotein, albumin, creatinine, cholinesterase, PT, TSF, MAC, Child–Pugh grade were associated with malnutrition in patients with HBV-related cirrhosis. All variables with a p value <0.05 in univariate regression were included in multivariate analysis. The results showed that BMI (OR=0.76, 95% CI: 0.68–0.85), creatinine (OR=1.02, 95% CI: 1.01–1.03), Child–Pugh grade C (OR=4.97, 95% CI: 1.84–14.11) and hand grip strength (OR=0.96, 95% CI: 0.94–0.98) were independent risk factors for malnutrition in patients with HBV-related cirrhosis (Supplementary Table 2).
Nomogram Model
The four independent factors selected by multivariate regression were used to construct a nomogram model. Values and the points of each variable are illustrated on the top of nomogram plot (Figure 2). The risk of malnutrition is plotted on the bottom. Draw a vertical line from the values of each prediction indicators to the corresponding point on the top and add up the points of four indicators to get a total point. Then, draw a vertical line from the total points to the risk axis to get the corresponding risk, which is the probability of malnutrition for this individual. For example, if a patient is with a BMI of 18.55 kg/m2, a hand grip strength of 18.55 kg, a creatinine level of 45 umol/L and Child–Pugh grade C, the points of each variable are 66, 45, 11 and 20, respectively, and the total point is 142. The corresponding risk for 142 points is 0.86, indicating this patient has an 86% probability to have malnutrition and nutritional support is required for this patient. The bootstrap calibration curve showed that the evaluation probability and the actual value were close to each other, indicating the nomogram model is accurate (Figure 3).
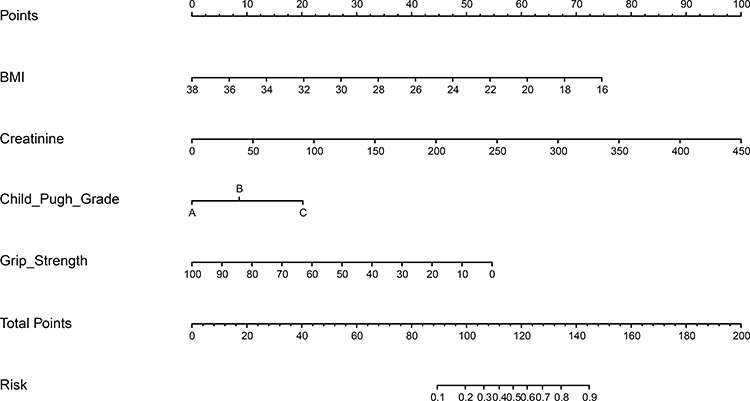 |
Figure 2 The nomogram for nutritional screening in patients with hepatitis B-related cirrhosis. |
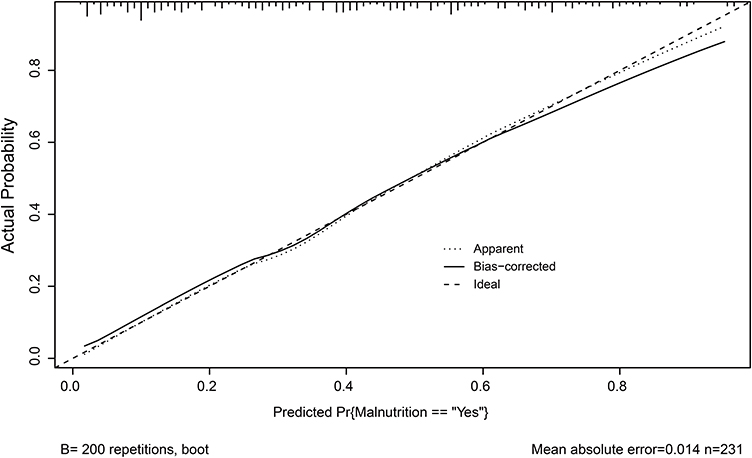 |
Figure 3 Calibration curve of malnutrition nomogram model. The evaluation accuracy is satisfactory if the solid line (performance) is close to the dotted line (models). |
Decision Tree Model
The Gini index was used to select the optimal feature and the CART generation algorithm was used to develop the decision tree model. The classification tree included four compositions which were displayed in the order of importance: BMI, albumin, creatinine and hand grip strength (Figure 4). From the root node to the leaf nodes, patients can be divided into eight subgroups through different branches. Using the different paths of decision tree, each patient can be easily classified as malnutrition or normal nutrition.
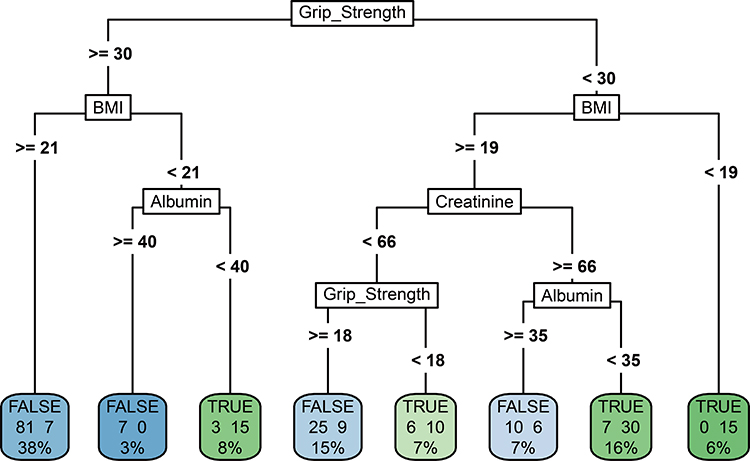 |
Figure 4 Decision tree for nutritional screening in patients with hepatitis B-related cirrhosis. The blue box indicates lower malnutrition risk and green one indicates higher malnutrition risk. |
Performance of Nomogram and Decision Tree Model
The ROC curves of the nomogram model and decision tree model are shown in Figure 5. The best cutoff point for nomogram model was 0.476. The sensitivity, specificity and accuracy were 0.696, 0.820 and 0.813, respectively. The AUROC of nomogram model was 0.813 (95% CI: 0.758–0.869, P<0.001). For the decision tree model, the sensitivity, specificity and accuracy were 0.761, 0.885 and 0.886, respectively, with an AUROC of 0.886 (95% CI: 0842–0.930, P <0.001). The difference in AUROC between nomogram model and decision tree model was insignificant (p>0.05).
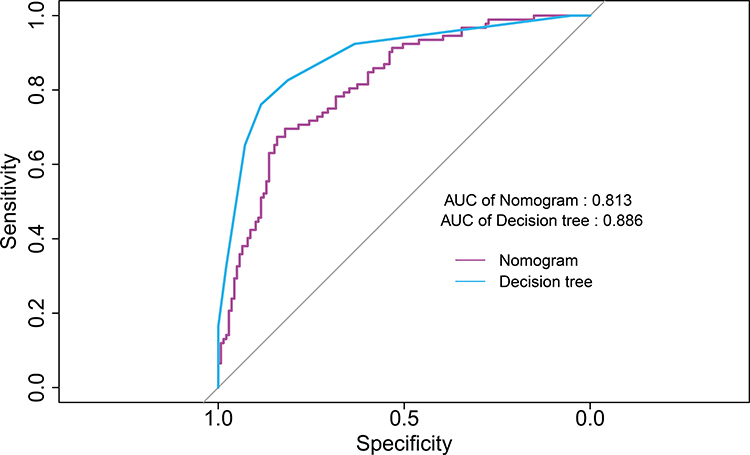 |
Figure 5 ROC curves of nomogram model and decision tree model. |
Discussion
The liver-specific nutritional assessment tool is scarce. In this study, nomogram model and decision tree model were independently developed for detecting malnutrition in HBV-cirrhotic patients. These two models only include widely available biochemical and anthropometric parameters thus are objective and user-friendly.
Two models consisted of different indicators, among which three indicators were identical (BMI, hand grip strength and serum creatinine). The hand grip strength has been considered to be a sign of the loss of skeletal muscle mass and is more sensitive than MAC.18 Previous studies show that hand grip strength is not only related to nutritional level but also an important predictor for malnutrition and an independent predictor of cirrhotic complications.19,20 The BMI is considered as a simple indicator for malnutrition.21 Although the albumin was only included in the decision tree model, it was one of the variables for the calculation of Child–Pugh score, which was the component of nomogram model. Taken together, the variables in the two models mainly reflect the protein synthesis and degradation, as well as the muscle mass. Compared with NRS 2002 and SGA, these models with objective parameters for protein-energy malnutrition can provide more reliable results. Moreover, we visualized the models as nomogram and decision tree, making them convenient and user-friendly.
The performance of these two models was satisfactory as both of them had an AUROC greater than 0.81. The decision-tree model seemed to perform better with higher AUROC and accuracy. However, the nomogram had its own advantage because it provided an individualized probability for each patient and was useful in clinical practice. Combining these two models, physicians can better distinguish patients at high malnutrition risk.
Bioelectrical impedance analysis (BIA) is a useful bedside technique to assess malnutrition in cirrhotic patients. Compared with other tools, it can be performed in hospital rooms if portable and the result is coming out quickly.22,23 BIA was not examined in this study as the equipment was not available in our department, thus the comparison between newly developed models and BIA was not able to perform in current study. Several studies have shown it significantly correlates with the outcomes in cirrhotic patients.22–24 Moreover, a study showed its prognostic accuracy is not influenced by ascites.25 Nevertheless, the nomogram and decision tree models in this study would be useful at least in primary hospitals where medical resources are limited.
There are several limitations of this study. First of all, it is a cross-sectional study performed in a single medical center. The study population only included HBV-related cirrhosis. The nutritional status of alcoholic cirrhosis or other cause could be different from HBV-cirrhosis.26 Thus, the generalization of the conclusion in other cause of liver disease should be careful. Second, there is no gold standard for the diagnosis of malnutrition for HBV-cirrhotic population. Using single tool may lead to the underestimation of malnutrition, that is the reason why we used three tools for diagnosis. As a trade-off, this will inevitably lead to overestimation of malnutrition. Third, we did not validate the models in external dataset, thus more studies are needed to verify the result.
Conclusions
Low BMI, high creatinine, high Child–Pugh score, and low hand grip strength are independent risk factors for malnutrition in HBV-related cirrhosis. The nomogram model and decision tree model developed in this study may aid in identifying patients at high risk of malnutrition in clinical practice.
Acknowledgments
Thanks to the following member from Department of Hepatology, Mengchao Hepatobiliary Hospital of Fujian Medical University, for their contribution in data collection: Shouyun Xie, Xijin Lin, Huayin Lin.
Author Contributions
All authors made a significant contribution to the work reported, whether that is in the conception, study design, execution, acquisition of data, analysis and interpretation, or in all these areas; took part in drafting, revising or critically reviewing the article; gave final approval of the version to be published; have agreed on the journal to which the article has been submitted; and agree to be accountable for all aspects of the work.
Funding
No funding was obtained for this study.
Disclosure
The authors report no conflicts of interest in this work.
References
1. Tang LSY, Covert E, Wilson E, Kottilil S. Chronic hepatitis B infection: a review. JAMA. 2018;319(17):1802–1813. doi:10.1001/jama.2018.3795
2. EASL Clinical Practice. Guidelines on nutrition in chronic liver disease. J Hepatol. 2019;70(1):172–193.
3. Jie B, Jiang ZM, Nolan MT, et al. Impact of nutritional support on clinical outcome in patients at nutritional risk: a multicenter, prospective cohort study in Baltimore and Beijing teaching hospitals. Nutrition. 2010;26(11–12):1088–1093. doi:10.1016/j.nut.2009.08.027
4. Maharshi S, Sharma BC, Srivastava S. Malnutrition in cirrhosis increases morbidity and mortality. J Gastroenterol Hepatol. 2015;30(10):1507–1513. doi:10.1111/jgh.12999
5. Tandon P, Raman M, Mourtzakis M, Merli M. A practical approach to nutritional screening and assessment in cirrhosis. Hepatology. 2017;65(3):1044–1057. doi:10.1002/hep.29003
6. Eglseer D, Halfens RJ, Lohrmann C. Is the presence of a validated malnutrition screening tool associated with better nutritional care in hospitalized patients? Nutrition. 2017;37:104–111. doi:10.1016/j.nut.2016.12.016
7. Detsky AS, McLaughlin JR, Baker JP, et al. What is subjective global assessment of nutritional status? J Parenter Enteral Nutr. 1987;11(1):8–13. doi:10.1177/014860718701100108
8. Kondrup J, Allison SP, Elia M, Vellas B, Plauth M. ESPEN guidelines for nutrition screening 2002. Clin Nutr. 2003;22(4):415–421. doi:10.1016/S0261-5614(03)00098-0
9. Kondrup J, Rasmussen HH, Hamberg O, Stanga Z. Nutritional risk screening (NRS 2002): a new method based on an analysis of controlled clinical trials. Clin Nutr. 2003;22(3):321–336. doi:10.1016/S0261-5614(02)00214-5
10. Raslan M, Gonzalez MC, Torrinhas RS, Ravacci GR, Pereira JC, Waitzberg DL. Complementarity of Subjective Global Assessment (SGA) and Nutritional Risk Screening 2002 (NRS 2002) for predicting poor clinical outcomes in hospitalized patients. Clin Nutr. 2011;30(1):49–53. doi:10.1016/j.clnu.2010.07.002
11. Crabb DW, Bataller R, Chalasani NP, et al. Standard definitions and common data elements for Clinical Trials in patients with alcoholic hepatitis: recommendation from the NIAAA Alcoholic Hepatitis Consortia. Gastroenterology. 2016;150(4):785–790. doi:10.1053/j.gastro.2016.02.042
12. Zhou J, Sun HC, Wang Z, et al. Guidelines for diagnosis and treatment of primary liver cancer in China (2017 Edition). Liver Cancer. 2018;7(3):235–260. doi:10.1159/000488035
13. EASL Clinical Practice. Guidelines: management of hepatocellular carcinoma. J Hepatol. 2018;69(1):182–236.
14. Sarin SK, Kedarisetty CK, Abbas Z, et al. Acute-on-chronic liver failure: consensus recommendations of the Asian Pacific Association for the Study of the Liver (APASL) 2014. Hepatol Int. 2014;8(4):453–471. doi:10.1007/s12072-014-9580-2
15. Alvarez F, Berg PA, Bianchi FB, et al. International Autoimmune Hepatitis Group Report: review of criteria for diagnosis of autoimmune hepatitis. J Hepatol. 1999;31(5):929–938. doi:10.1016/S0168-8278(99)80297-9
16. Figueiredo FA, Dickson ER, Pasha TM, et al. Utility of standard nutritional parameters in detecting body cell mass depletion in patients with end-stage liver disease. Liver Transpl. 2000;6(5):575–581. doi:10.1053/jlts.2000.9736
17. Huisman EJ, Trip EJ, Siersema PD, van Hoek B, van Erpecum KJ. Protein energy malnutrition predicts complications in liver cirrhosis. Eur J Gastroenterol Hepatol. 2011;23(11):982–989. doi:10.1097/MEG.0b013e32834aa4bb
18. Moctezuma-Velázquez C, García-Juárez I, Soto-Solís R, Hernández-Cortés J, Torre A. Nutritional assessment and treatment of patients with liver cirrhosis. Nutrition. 2013;29(11–12):1279–1285. doi:10.1016/j.nut.2013.03.017
19. Purnak T, Yilmaz Y. Liver disease and malnutrition. Best Pract Res Clin Gastroenterol. 2013;27(4):619–629. doi:10.1016/j.bpg.2013.06.018
20. Sinclair M, Chapman B, Hoermann R, et al. Handgrip strength adds more prognostic value to the model for end-stage liver disease score than imaging-based measures of muscle mass in men with cirrhosis. Liver Transpl. 2019;25(10):1480–1487. doi:10.1002/lt.25598
21. Zhang Z, Pereira SL, Luo M, Matheson EM. Evaluation of blood biomarkers associated with risk of malnutrition in older adults: a systematic review and meta-analysis. Nutrients. 2017;9(8):829. doi:10.3390/nu9080829
22. Cichoż-Lach H, Michalak A. A comprehensive review of bioelectrical impedance analysis and other methods in the assessment of nutritional status in patients with liver cirrhosis. Gastroenterol Res Pract. 2017;2017:6765856. doi:10.1155/2017/6765856
23. Lee Y, Kwon O, Shin CS, Lee SM. Use of bioelectrical impedance analysis for the assessment of nutritional status in critically ill patients. Clin Nutr Res. 2015;4(1):32–40. doi:10.7762/cnr.2015.4.1.32
24. Belarmino G, Gonzalez MC, Torrinhas RS, et al. Phase angle obtained by bioelectrical impedance analysis independently predicts mortality in patients with cirrhosis. World J Hepatol. 2017;9(7):401–408. doi:10.4254/wjh.v9.i7.401
25. Ruiz-Margáin A, Xie JJ, Román-Calleja BM, et al. Phase angle from bioelectrical impedance for the assessment of sarcopenia in cirrhosis with or without ascites. Clin Gastroenterol Hepatol. 2020. doi:10.1016/j.cgh.2020.08.066
26. Panagaria N, Varma K, Nijhawan S, Mathur A, Rai RR. Comparison of nutritional status between patients with alcoholic and non-alcoholic liver cirrhosis. Trop Gastroenterol. 2006;27(2):75–79.
 © 2021 The Author(s). This work is published and licensed by Dove Medical Press Limited. The full terms of this license are available at https://www.dovepress.com/terms.php and incorporate the Creative Commons Attribution - Non Commercial (unported, v3.0) License.
By accessing the work you hereby accept the Terms. Non-commercial uses of the work are permitted without any further permission from Dove Medical Press Limited, provided the work is properly attributed. For permission for commercial use of this work, please see paragraphs 4.2 and 5 of our Terms.
© 2021 The Author(s). This work is published and licensed by Dove Medical Press Limited. The full terms of this license are available at https://www.dovepress.com/terms.php and incorporate the Creative Commons Attribution - Non Commercial (unported, v3.0) License.
By accessing the work you hereby accept the Terms. Non-commercial uses of the work are permitted without any further permission from Dove Medical Press Limited, provided the work is properly attributed. For permission for commercial use of this work, please see paragraphs 4.2 and 5 of our Terms.