")
Back to Journals » International Journal of General Medicine » Volume 15
Developing and Validating an Autophagy Gene-Set-Based Prognostic Signature in Hepatocellular Carcinoma Patients
Authors Zhang J , Zhao J, Wei S, Huang P, Tu X , Su G, Gan Y, Gong W, Xiang B
Received 13 October 2022
Accepted for publication 17 November 2022
Published 28 November 2022 Volume 2022:15 Pages 8399—8415
DOI https://doi.org/10.2147/IJGM.S388592
Checked for plagiarism Yes
Review by Single anonymous peer review
Peer reviewer comments 2
Editor who approved publication: Dr Scott Fraser
Jie Zhang,1,* Jingfei Zhao,1,* Shuichun Wei,2 Peipei Huang,2 Xinyue Tu,2 Guimin Su,2 Yu Gan,2 Wenfeng Gong,1 Bangde Xiang1
1Department of Hepatobiliary Surgery, Guangxi Medical University Cancer Hospital, Nanning, 530021, People’s Republic of China; 2College of Basic Medicine, Guangxi Medical University, Nanning, 530021, People’s Republic of China
*These authors contributed equally to this work
Correspondence: Bangde Xiang; Wenfeng Gong, Email [email protected]; [email protected]
Background: Hepatocellular carcinoma (HCC), a major type of cancer affecting the lives of people across the world, is one of many diseases whose advancement is thought to be influenced by autophagy dysfunction. Here, the prognostic significance of autophagy in HCC will be investigated.
Methods: The Cancer Genome Atlas (TCGA) database was employed in this work to identify 62 differentially-expressed Autophagy-Related Genes (ARGs) in HCC patients. Functional enrichment studies revealed that autophagy played a tumor-promoting role in the advancement of HCC. Based on RNA sequencing of 116 tumor samples and 114 paracancerous tissue samples acquired from HCC patients at the Guangxi Medical University Cancer Hospital, 866 differentially expressed prognosis-related genes were identified. Using lasso regression analysis, two ARGs (BIRC5 and BAK1) linked to prognosis were discovered after intersecting the differential genes derived from the prognosis-related groups. A risk score based on ARGs was developed using a Cox proportional hazards regression model. RNA sequencing data were used to construct this model. Finally, the TCGA and The Human Protein Atlas Databases (THPA) were used to validate the clinical data of 116 HCC patients.
Results: Elevated expression level of the BAK1 and BIRC5 genes is linked to poor prognosis. The two ARGs were used to calculate the risk score as follows: (0.0253*BAK1) + (0.0051*BIRC5). Risk score served as the independent prognostic factor as per the multivariate analysis. TCGA, THPA, and data from the Guangxi Medical University Cancer Hospital were used to confirm the predictive validity of risk scores for the prognosis of HCC patients.
Conclusion: This study offers molecular insights regarding the involvement of autophagy in HCC patients, along with a probable prognostic signature for determining the outcome (prognosis) of HCC patients.
Keywords: hepatocellular carcinoma, risk score, The Cancer Genome Atlas, autophagy-related genes, RNA sequencing
Introduction
The primary catabolic mechanism used by eukaryotic cells to self-degrade faulty, damaged, or undesired intracellular components is known as autophagy or type II programmed cell death (PCD).1,2 To maintain the quality of intracellular organelles, autophagy is necessary. Autophagy is also essential for maintaining homeostasis, physiologic levels, and the stability of cellular remodeling.3 The development of numerous illnesses, including cancers, has been linked to elevated autophagy levels.4–8 The key autophagy mechanisms in cancer, however, are still being investigated and are not fully understood. Given the complicated role that autophagy plays in cancer, further research is needed to better elucidate how autophagy interacts with tumors and the molecular mechanisms underlying them to find new ways to treat cancer.8–11
Hepatocellular carcinoma (HCC) is the second most prevalent cancer affecting people across the globe and 6th most leading cause of cancer-linked mortality in males.12 The optimal method of treating HCC is surgical resection.13,14 After hepatectomy, patients still showed a less than 50% five-year OS rate.15 A new mechanism in the therapeutic management of HCC was recently revealed by numerous studies that suggested autophagy might be a crucial mechanism for the formation and progression of HCC.5,16 IFN-γ attenuates the growth of human liver cancer cells by causing autophagy via the IRF-1 signaling pathway, as reported by Li et al.17 IFN-γ also shows a growth-inhibitory impact on cell death in human liver malignant cells. Additionally, a few reports18–20 suggested that inhibiting autophagy could improve anti-tumor immunity. Therefore, investigating autophagy-related molecular indicators has great potential in accurately assessing the progression of HCC and could be used as a crucial strategy for combating HCC.
In this study, the relationship between the clinical data derived from 116 HCC patients downloaded from The Cancer Genome Atlas (TCGA) database, Guangxi Medical University Cancer Hospital, and expression profiles of Autophagy-Related Genes (ARGs) were investigated. The risk score was then established as an independent indicator for determining the overall survival (OS) rate and anticipating the prognosis of HCC patients, depending on the ARGs. All findings in the study have been confirmed by preliminary findings acquired from the immunohistochemistry tests and data derived from The Human Protein Atlas Database (THPA, http://www.proteinatlas.org). It was concluded that the findings in this study offer a comprehensive biomarker technique that could help in anticipating the prognosis of patients affected by HCC and monitoring autophagy.
Materials and Methods
Acquisition of the Public Data
Several ARGs were acquired from The Human Autophagy Database (HADb, http://www.autophagy.lu/index.html), which is a dataset containing the ARGs. The clinical data and RNA-sequencing (RNA-seq) data of ARGs from the HCC dataset were downloaded and retrieved from the TCGA cohort.
Tissue Samples and the Clinical Follow-Up Data
For the purpose of analyzing the data acquired from public databases, the HCC tissue and the adjoining non-tumor samples from the patients treated in the Department of Hepatobiliary Surgery of Guangxi Medical University Cancer Hospital from July 2017 to July 2019 were subjected to RNA sequencing and immunohistochemistry. All patients included in the study signed a written consent form. The study was examined and certified by the Ethics Committee of the Guangxi Medical University Cancer Hospital (LW2021056) and performed according to the Declaration of Helsinki.
The HCC patients, fulfilling the defined criteria, were included in this study: (1) Those who had undergone a radical hepatocarcinoma resection; (2) Those who were diagnosed with HCC, depending on their postoperative pathology; (3) Those did not receive anticancer therapy before surgery; and (4) Those did not have any other malignancies. For one month following surgery, every patient was monitored in the hospital. Thereafter, follow-up was conducted every three months for the next 2 years, if the patients did not experience recurrence or death. Physical tests, serum liver function tests, a serum alpha-fetoprotein analysis, abdominal ultrasonography, and computed tomography/magnetic resonance imaging (CT-MRI) were all included in the follow-up assessments. The OS rate was defined as the period between the final day of surgery and the last follow-up, which was in July 2021, or until a tumor recurrence was detected.
RNA-Sequencing
TRIzol reagent (Invitrogen, CA, USA) was utilized for extracting the total RNA samples from HCC and adjoining non-tumor tissue samples following the instructions in the kit set. RNA purification, reverse transcription, library development, and gene sequencing were carried out by WuXi NextCODE (Shanghai, China). Salmon was used for the purpose of mapping the clean reads from RNA-Seq samples, in comparison to the Hg19 reference genome.
Differentially Expressed ARGs Enrichment Analysis
The Limma tool in the R package was employed for the purpose of calculating the differential expression of ARGs in the HCC and non-tumor tissue samples. If the genes showed a minimum of 2-fold change, which corresponds to the adjusted P-value <0.05, the differentially expressed ARGs were considered significant. Then, some Gene functional enrichment analyses, such as Kyoto Encyclopedia of Genes (KEGG) and Gene Ontology (GO) analyses, were carried out to identify the significant biological characteristics of these genes. The enriched GO and KEGG themes were discovered using the Database for Annotation, Visualization, and Integrated Discovery software (DAVID, https:// david.ncifcrf.gov), which is a prominent functional annotation tool. To display enrichment terms and present high-dimensional data, the R-GO plot package was used.
Construction of Risk Score Using the ARGs
The expression patterns of ARGs that were retrieved from the TCGA cohort were normalized using [log2 (count+1)]. The ARGs of expression profiles that were substantially linked to the OS of the HCC patients were chosen as per the univariate Cox analyses. After that, a multivariate Cox analysis was conducted to assess these survival-related genes and eliminate any gene that would not be a reliable predictor of prognosis. Differential gene analysis was conducted using 116 tumor tissue samples and 114 paracancerous samples, acquired from the RNA-sequencing database of Guangxi Medical University Cancer Hospital. The differential genes related to prognosis were then extracted. The prognostic-related genes of the two cohorts were intersected, and the final modeled genes were determined by lasso regression analysis. The risk score method was based on the linear combination of the relative gene expression levels of the genes multiplied by regression coefficients, which reflected the relative weights of the genes in multiple Cox regression analyses. To categorize HCC patients into the low- and high-risk categories, the median risk score value was employed as the risk cut-off. The Kaplan-Meier (KM) technique was employed for plotting the OS curves, and the Log rank test was utilized used to determine the differences (variations) in the OS rates between both risk groups.
Model Validation
The RNA sequencing data of HCC were acquired from TCGA (https://portal.gdc.cancer.gov), and all samples with missing clinicopathological data were removed. Finally, the data from 168 HCC tissue samples were obtained and normalized using the R software-based limma package. Internal validation of the model was performed on data from these 168 patients.
Validation of Protein Expression
The THPA database was employed to verify whether the overexpression of risk genes affected OS rates among patients suffering from HCC. At the same time, the effect of high expression of risk genes on prognosis in HCC samples was demonstrated using Guangxi Medical University Cancer Hospital’s Immunohistochemistry (IHC) samples.
Immunohistochemistry
HCC specimens and corresponding non-tumor tissue samples were fixed using the 10% formalin (w/v) solution, then embedded in molten paraffin, and sectioned into thin slices (roughly 4 µm thickness). These specimens were then deparaffinized using xylene at the optimal temperature of 37°C, washed in a graduated ethanol series, and then incubated in a citrate buffer solution (10 mmol/L and pH 6.0) for antigen retrieval. To inhibit endogenous peroxidase activity, these thin tissue slices were rinsed using Phosphate-Buffered Saline (PBS), treated using 0.3% H2O2 at RT for 10 min, and re-washed with PBS. These sections were incubated with anti-BIRC5 antibodies (1:200, 10508-1-AP, Proteintech, Chicago, USA) for 60 mins at 37°C, and rinsed with PBS. Thereafter, the thin slices were treated with MaxVisionTM/horseradish peroxidase for 30 mins at RT, rinsed with PBS, and stained using diaminobenzidine and hematoxylin stains. These sections were dehydrated using a graduated ethanol series, dried, and then sealed with neutral gum. As a positive control, retinal tissue samples were processed. Furthermore, the HCC tissue samples that were incubated in PBS without antibodies were used as the negative control.
A two-component score21 was used to semi-quantify IHC staining. Firstly, the staining intensity was assigned a score of 0 (uncolored), 1 (light yellow), 2 (yellow), or 3 (dark yellow). Secondly, a score was assigned based on how many stained cells out of the total observed cells were present: 1 denoted the value less than 25%, the point of 2 was given when the values ranged from 26 to 50%, the point of 3 was given when the values ranged from 51 to 75%, and 4 points denoted the value more than 75%. A total score that ranged between 0 and 12 points was calculated by multiplying the two scores.
Statistical Analysis
Statistical tests and plots were performed with the help of the R software, ver. 4.0.2 (https://www.r-project.org/). The survival (ver. 3.2–13) and survminer software (ver. 0.4.9) were used to select the most appropriate cut-off value, and the R-survival ROC software (ver. 1.0.3) was utilized to yield the ROC curve. The Student’s t-test, Chi-square test, or Fisher’s exact test were utilized for the purpose of determining the significant differences between both groups. The KM approach was employed to assess OS and RFS, and the Log rank test was implemented to compare the curves in R software. The values showing differences with P-value <0.05 or above were considered significant.
Results
Identification of Prognostic ARGs
Clinical and RNA-Seq data for 50 non-tumor and 374 HCC tissue samples were acquired from the TCGA database. These included 343 HCC patients having gene expression and possessing clinical follow-up data. 232 ARGs with their expression values were retrieved. After applying the FDR < 0.05 and |log2(Fold Change) |>1 criteria, 58 upregulated and 4 downregulated ARGs were identified (Figure 1). Among them, 25 genes were seen to be linked to the prognosis of HCC patients (FKBP1A, SQSTM1, HDAC1, GNAI3, BIRC5, PRKCD, ATG101, ERO1A, ATG7, ATIC, ATG9A, HSPA8, EIF2S1, RUBCN, SH3GLB1, RHEB, SPNS1, CAPN10, BAK1, ATG3, NPC1, GAPDH, CHMP4B, RAC1, and RAB7A). Altogether, the RNA-seq and clinical follow-up information obtained from 116 HCC and 114 paracancerous samples were obtained from the Guangxi Medical University Cancer Hospital. According to gene expression, 3285 differential genes were selected; 866 were prognosis-related genes. The prognosis-related genes of the two cohorts were intersected, and finally, five prognosis-related genes (BIRC5, CHMP4B, BAK1, NPC1, GAPDH) were obtained. Two prognosis-related genes (BIRC5 and BAK1) were identified by lasso regression analysis, and the risk coefficients of the two genes (BIRC5 and BAK1) were determined with the help of the Cox regression analysis to develop a risk score model.
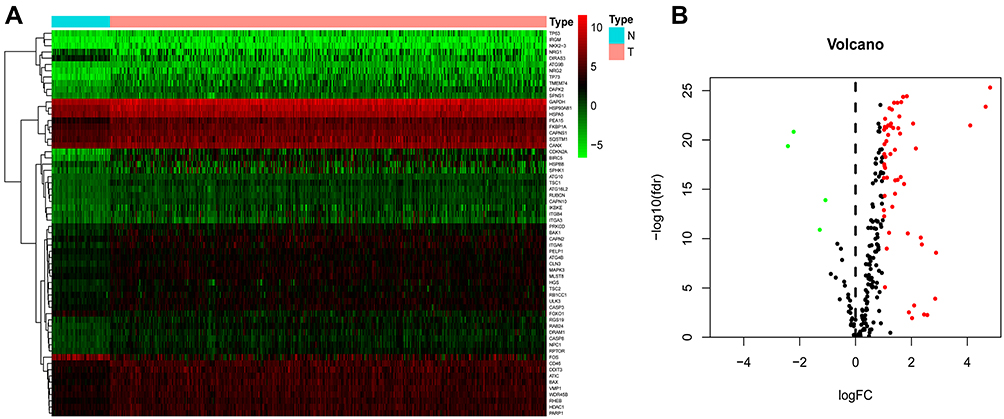 |
Figure 1 Differentially expressed autophagy-related genes (ARGs) were identified in the HCC and healthy liver tissues. (A) Hierarchical clustering of differentially-expressed ARG levels. The 50 columns on the left represent the sequencing results of samples of normal liver tissues, while the 374 columns on the right represent the sequencing results of samples of HCC tissues. The 62 genes on the far left correspond to the red and green spots in the volcano plot. (B) Volcano plot depicting the expression profiles of 232 TCGA-derived ARGs. Red denotes high gene expression, whereas green represents low expression. Black denotes no difference in the expression of the genes between the HCC and healthy liver tissues. The greater the absolute value of logFC, the more significant the difference is in gene expression represented by red or green dots. Abbreviations: TCGA, The Cancer Genome Atlas; FC, fold change; FDR, false discovery rate. |
Functional Annotation of the Differentially-Expressed ARGs
The biological value of 62 differentially-expressed ARGs was shown by functional enrichment analysis. The top-three enriched GO terms for biological processes identified by DAVID were autophagy, processes employing autophagic mechanisms, and macro-autophagy. The top-three enriched GO keywords for cellular components were vacuolar membrane, phagophore assembly site, and autophagosome. Genes were seen to be predominantly abundant in kinase regulatory activity, protein kinase regulatory activity, and cysteine-type endopeptidase activity based on molecular function. Figure 2 shows the summary of the schematic analysis of the data. Most cancer pathways had a Z-score of less than zero for enriched pathways, which suggests a decrease (Figure 2A). A bubble plot was generated to display enriched GO terms (Figure 2B). Additionally, the KEGG enrichment analysis revealed that the differentially-expressed ARGs were strongly linked to apoptosis, autophagy-animal, human papillomavirus infection, longevity regulating pathway, platinum drug resistance, etc. (Figure 2C).
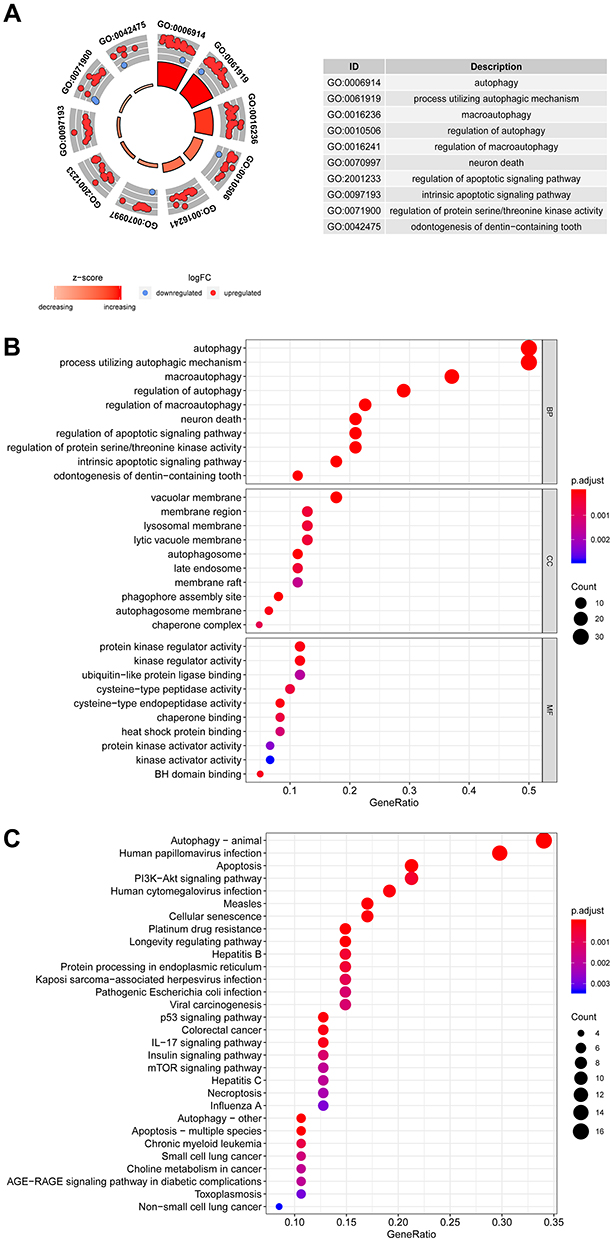 |
Figure 2 Kyoto Encyclopedia of Genes and Genomes (KEGG) and Gene Ontology (GO) analyses of the Differentially Expressed-ARGs. (A) The outer circle represents a scatter plot for every term included in the logFC of assigned genes. The red circles indicate the up-regulated genes, whereas the blue circles represent the down-regulated genes. Z-score shows whether the biological processes (BP) showed a higher probability of decreasing (negative value) or increasing (positive value). (B) The bubble plot of the enriched GO terms. The size of the circle denotes the count of the related genes, whereas their color indicates the p-value of the altered pathway correlation. The increasing intensity of the red color showed a decreasing p-value. (C) Each circle corresponds to a pathway that could participate in the autophagy regulation of HCC. The size of the circle denotes the count of the related genes, whereas their color indicates the p-value of the altered pathway correlation. The increasing intensity of the red color showed a decreasing p-value. Abbreviations: CC, cellular components; MF, molecular function; BP, biological process. |
Designing and Definition of the Risk Score
A risk score was estimated using the following formula: Risk score = (0.0253*BAK1) + (0.0051*BIRC5). This risk-scoring formula was employed to calculate the risk scores of 116 patients in the training dataset. The highest risk value of the patient was 6.693, the lowest risk value was 0.520, and the best cut-off was taken as the risk score (Figure 3A). Depending on the cut-off values, 36 patients were classified into the high-risk group (category), whereas 80 were categorized into the low-risk category. Of the 44 deaths, only three were included in the low-risk HCC category, whereas the rest of the 41 deaths were classified into the high-risk category (Figure 3B). BIRC5 and BAK1 were factors that increased the risk of patients’ death, while they were overexpressed in the high-risk set, and the expression of their risk factors was consistent with the positive and negative expression of the regression coefficient (Figure 3C). There were significant differences in age, hypertension, AFP, Edmonson grade, BCLC stage, MVI, portal vein thrombosis, BAK1, and BIRC5 between the low- and high-risk HCC patients (all P<0.05, Table 1).
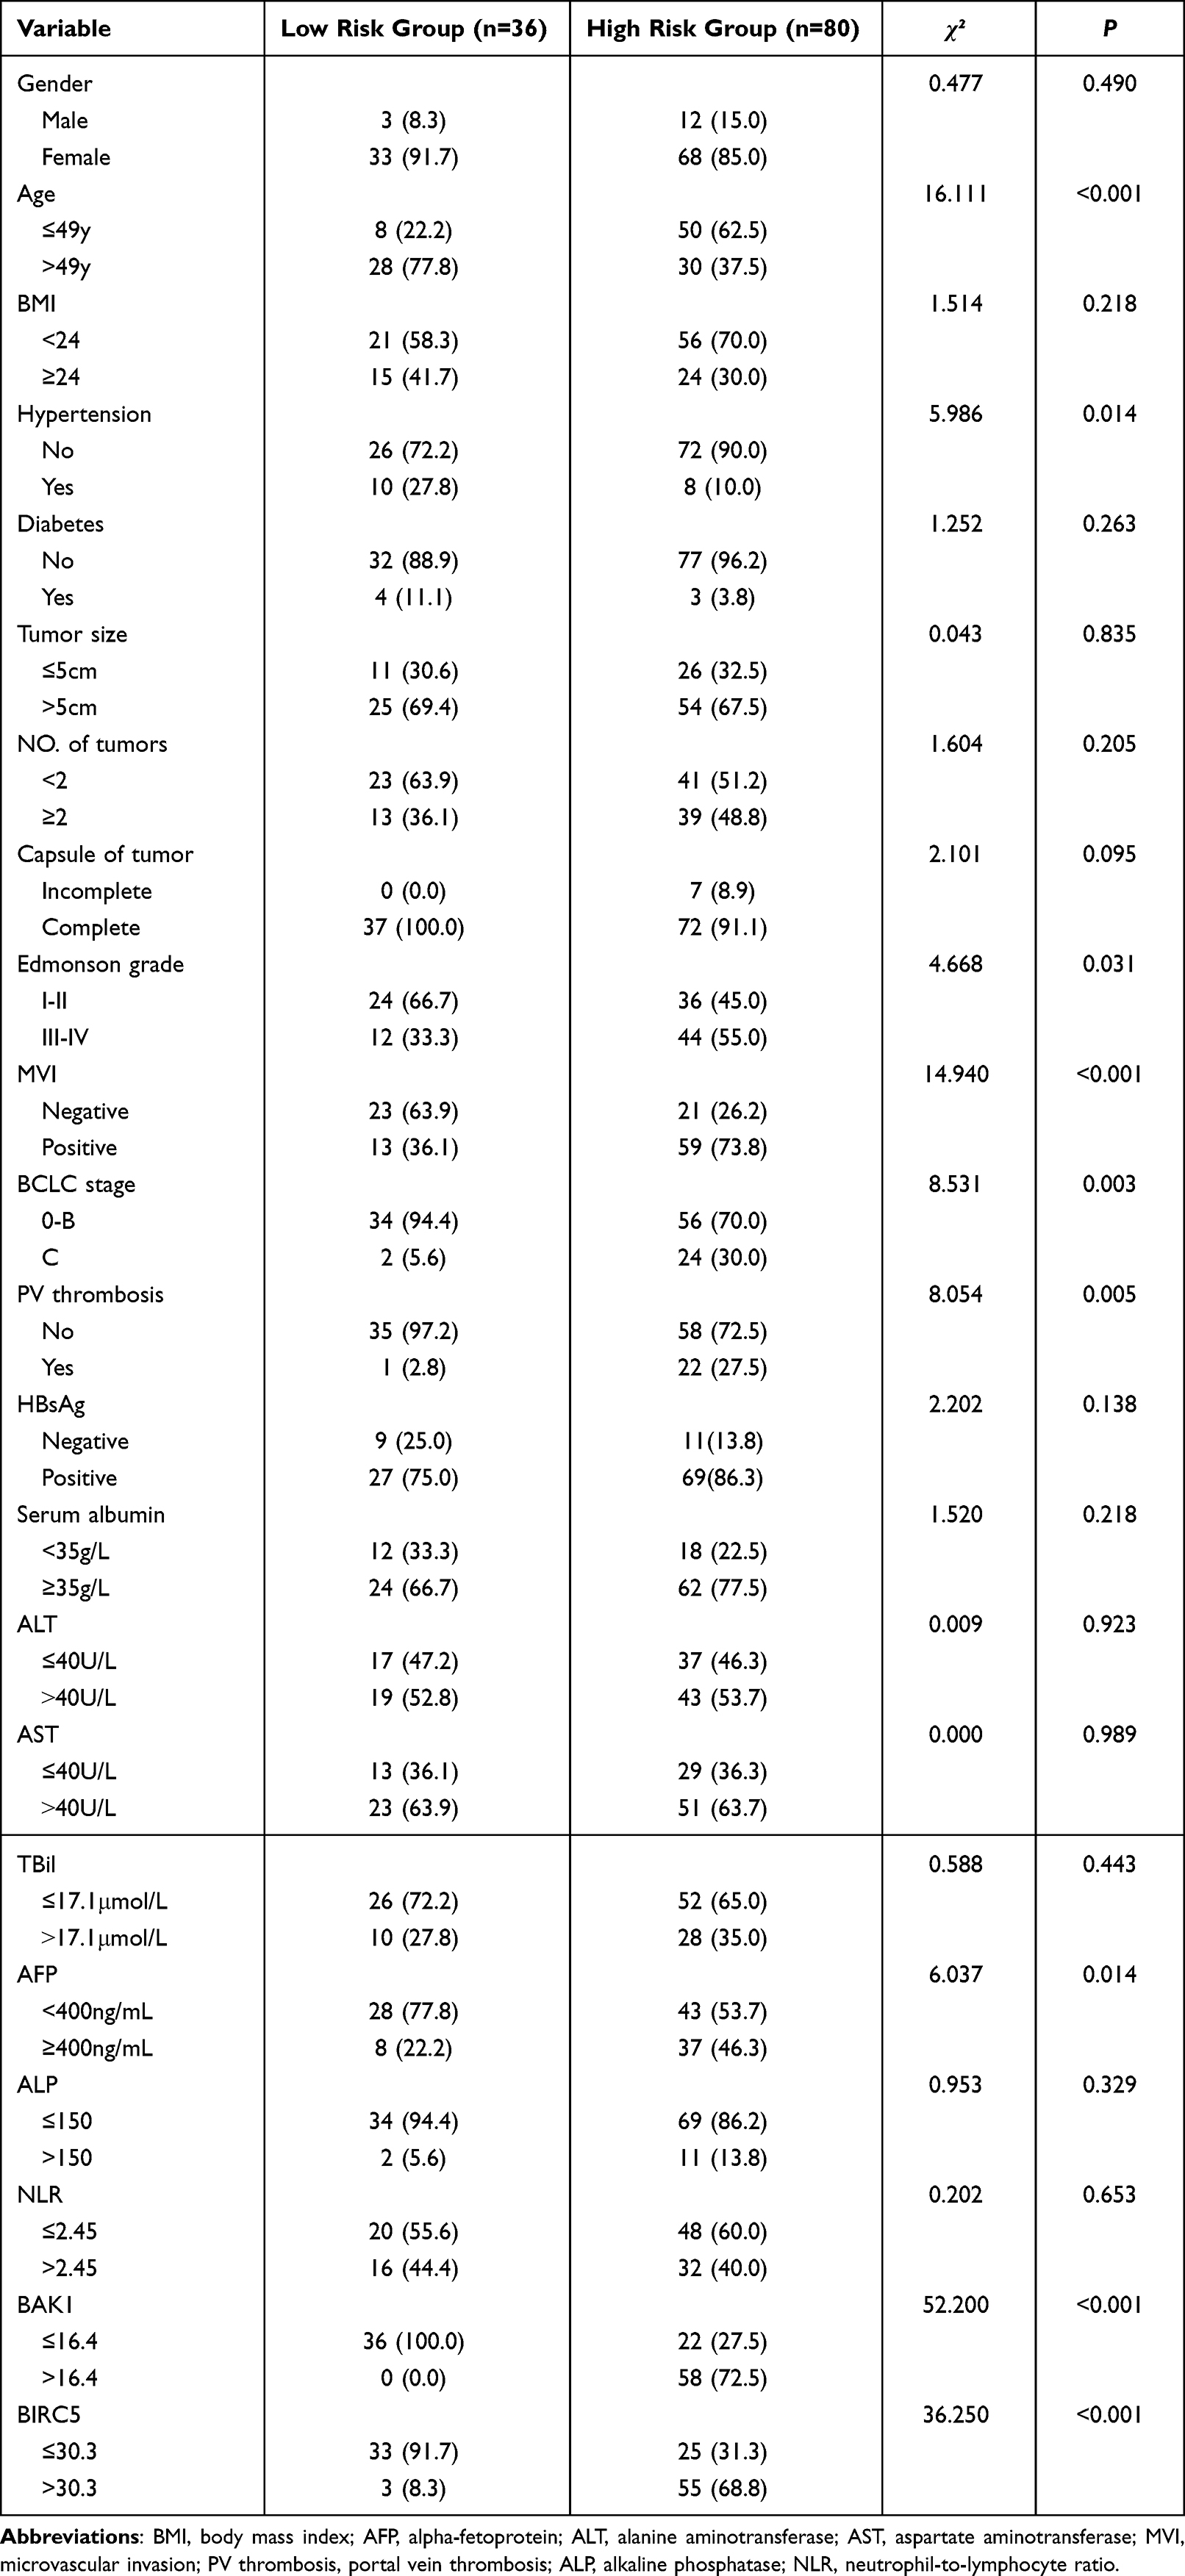 |
Table 1 Clinicopathological Data of Hepatocellular Carcinoma Patients in Low- Risk and High- Risk Groups in Training Cohort |
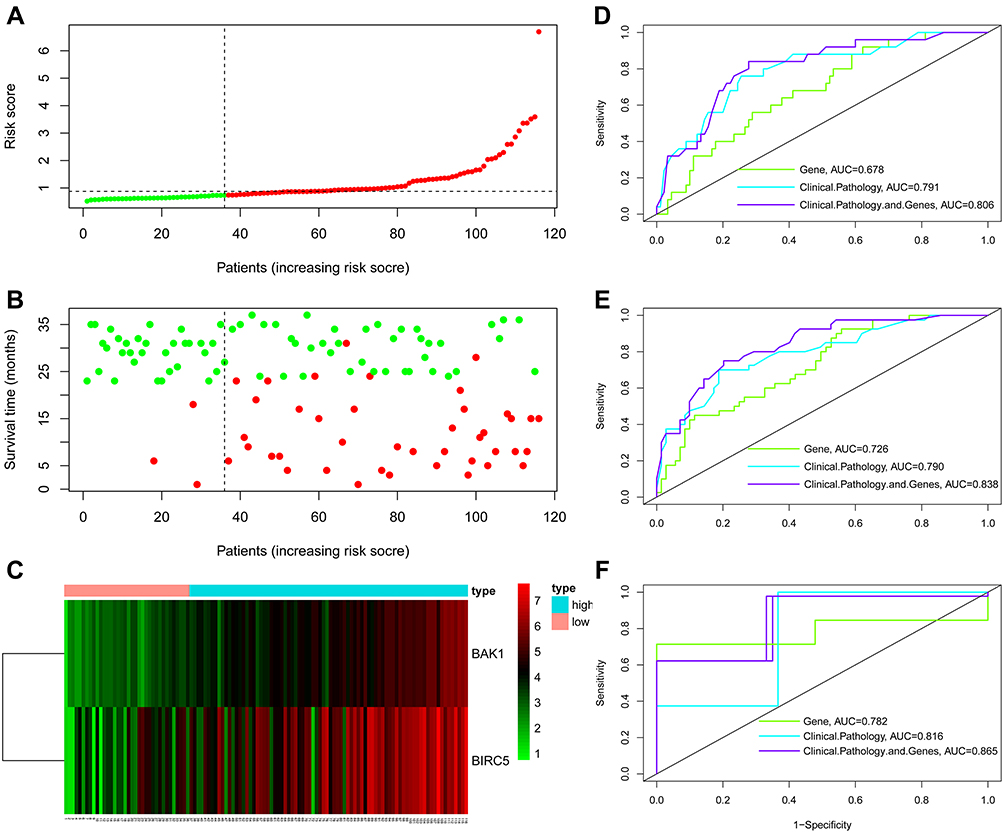 |
Figure 3 Constructing a prognostic signature depending on the clinicopathological information and expression of ARGs in 116 HCC patients. (A) The risk score distribution in the RNA-sequencing of 116 patients. (B) The OS status of 116 patients. (C) Heatmap of BAK1 and BIRC5 expression levels in tumor tissues of 116 HCC patients: red squares indicate high expression of genes in corresponding samples, and green ones indicate low expression. Patients were arranged in the same order as in (A–C). ROC curves assessed the effectiveness of risk signature in anticipating the 1- (D), 3- (E), and 5-year (F) OS rates in 116 HCC patients. |
Survival Analysis and Prognostic Factors
The KM survival analysis revealed that the 1- and 2-year OS values of the high-risk HCC patients with ARGs were 70.0% and 51.2%, respectively, which was statistically lower than those displayed by the low-risk HCC group (P<0.001, Figure 5A). After combining the clinicopathological data for modeling and survival analysis, the 1- and 2-year OS values in the high-risk set of ARGs and clinicopathological scores were 53.2% and 31.9%, respectively, which were significantly lower in comparison to those displayed by the low-risk HCC patients (P<0.001, Figure 5C).
Univariate analysis identified the following predictors of poor OS in HCC patients with hepatic resection: Age>49 years old, microvascular invasion, multi-nodular HCC, Barcelona Clinic Liver Cancer (BCLC)-C, macrovascular tumor, thrombus, AST>40 U/L, ALP>150 U/L and high expression of two ARGs (BIRC5 and BAK1). The above variables were included in multivariate analysis, and results showed that the multi-nodular HCC (HR = 2.487, 95% CI: 1.286–4.810, P = 0.007), AST>40 U/L (HR = 2.420, 95% CI: 1.114–5.257, P = 0.026) and 2 ARG scores > 0.4314 (HR = 5.773, 95% CI: 1.669–19.962) were regarded as a standalone risk factor of postoperative OS (Table 2).
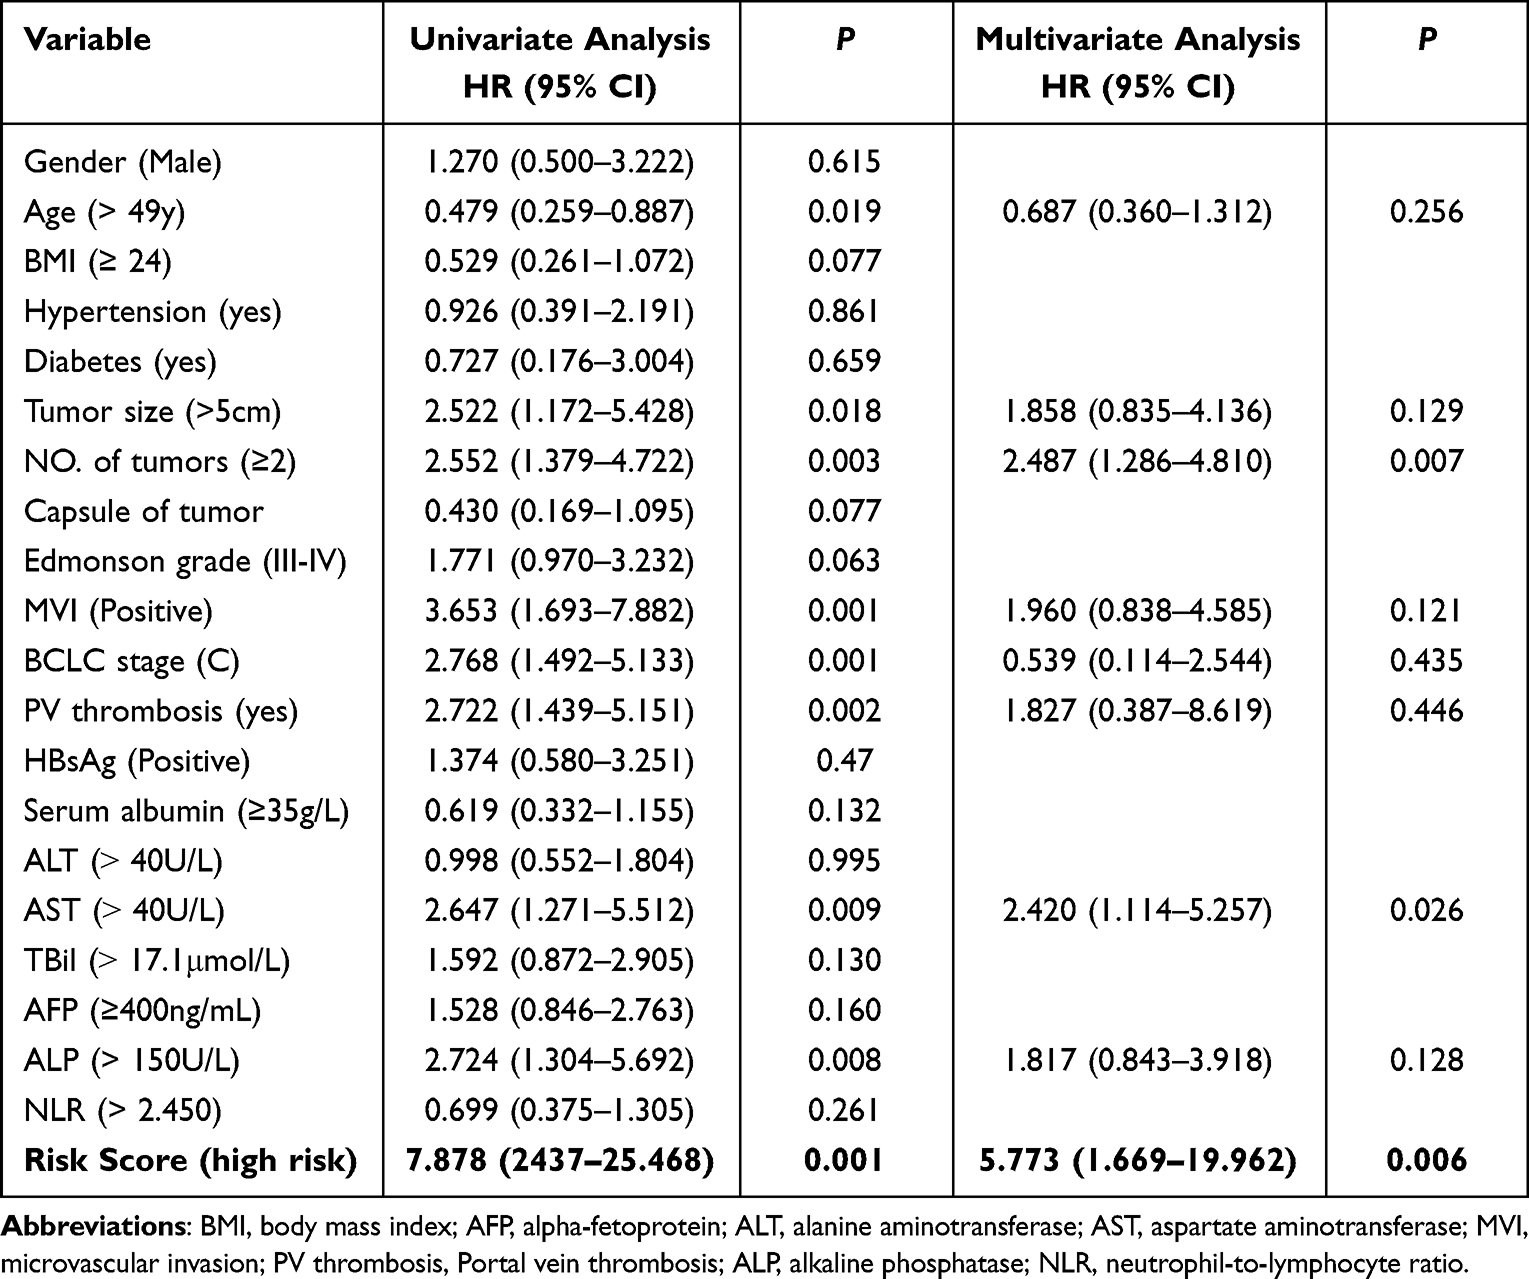 |
Table 2 Uni- and Multivariate Analysis to Identify Predictors of Overall Survival in HCC Patients of Training Cohort (n = 116) |
Furthermore, the prognostic values of the ARG scoring model, clinicopathological variable, Cox regression model, and ARG scores combined with the clinicopathological variable scoring model were performed by ROC analysis. In the ROC analysis of 1–3 years, the area under the ROC curve (AUC) of ARGs combined with clinicopathological variable scoring models were 0.806, 0.838, and 0.865, respectively, which were higher than the clinicopathological variables, Cox analysis model (0.791, 0.790, 0.816) and ARGs scores model (0.678, 0.726, 0.782). Risk scores had the highest AUCs in the 3-year ROC curves compared to 1 and 2 years (Figure 3D-F).
Model Validation
To validate the predictive accuracy of the ARGs risk score formula using different datasets, 168 samples with complete clinicopathological characteristics in the TCGA database were investigated. The survival risk scores of HCC patients in the TCGA validation dataset were estimated using the ARGs risk score formula, where 168 patients were categorized into the high- and low-risk categories (Figure 4). Both categories showed significant differences in terms of T-stage, gender, Edmonson classification, BCLC stage, AFP, BAK1, and BIRC5 gene expression (P<0.05, Table 3).
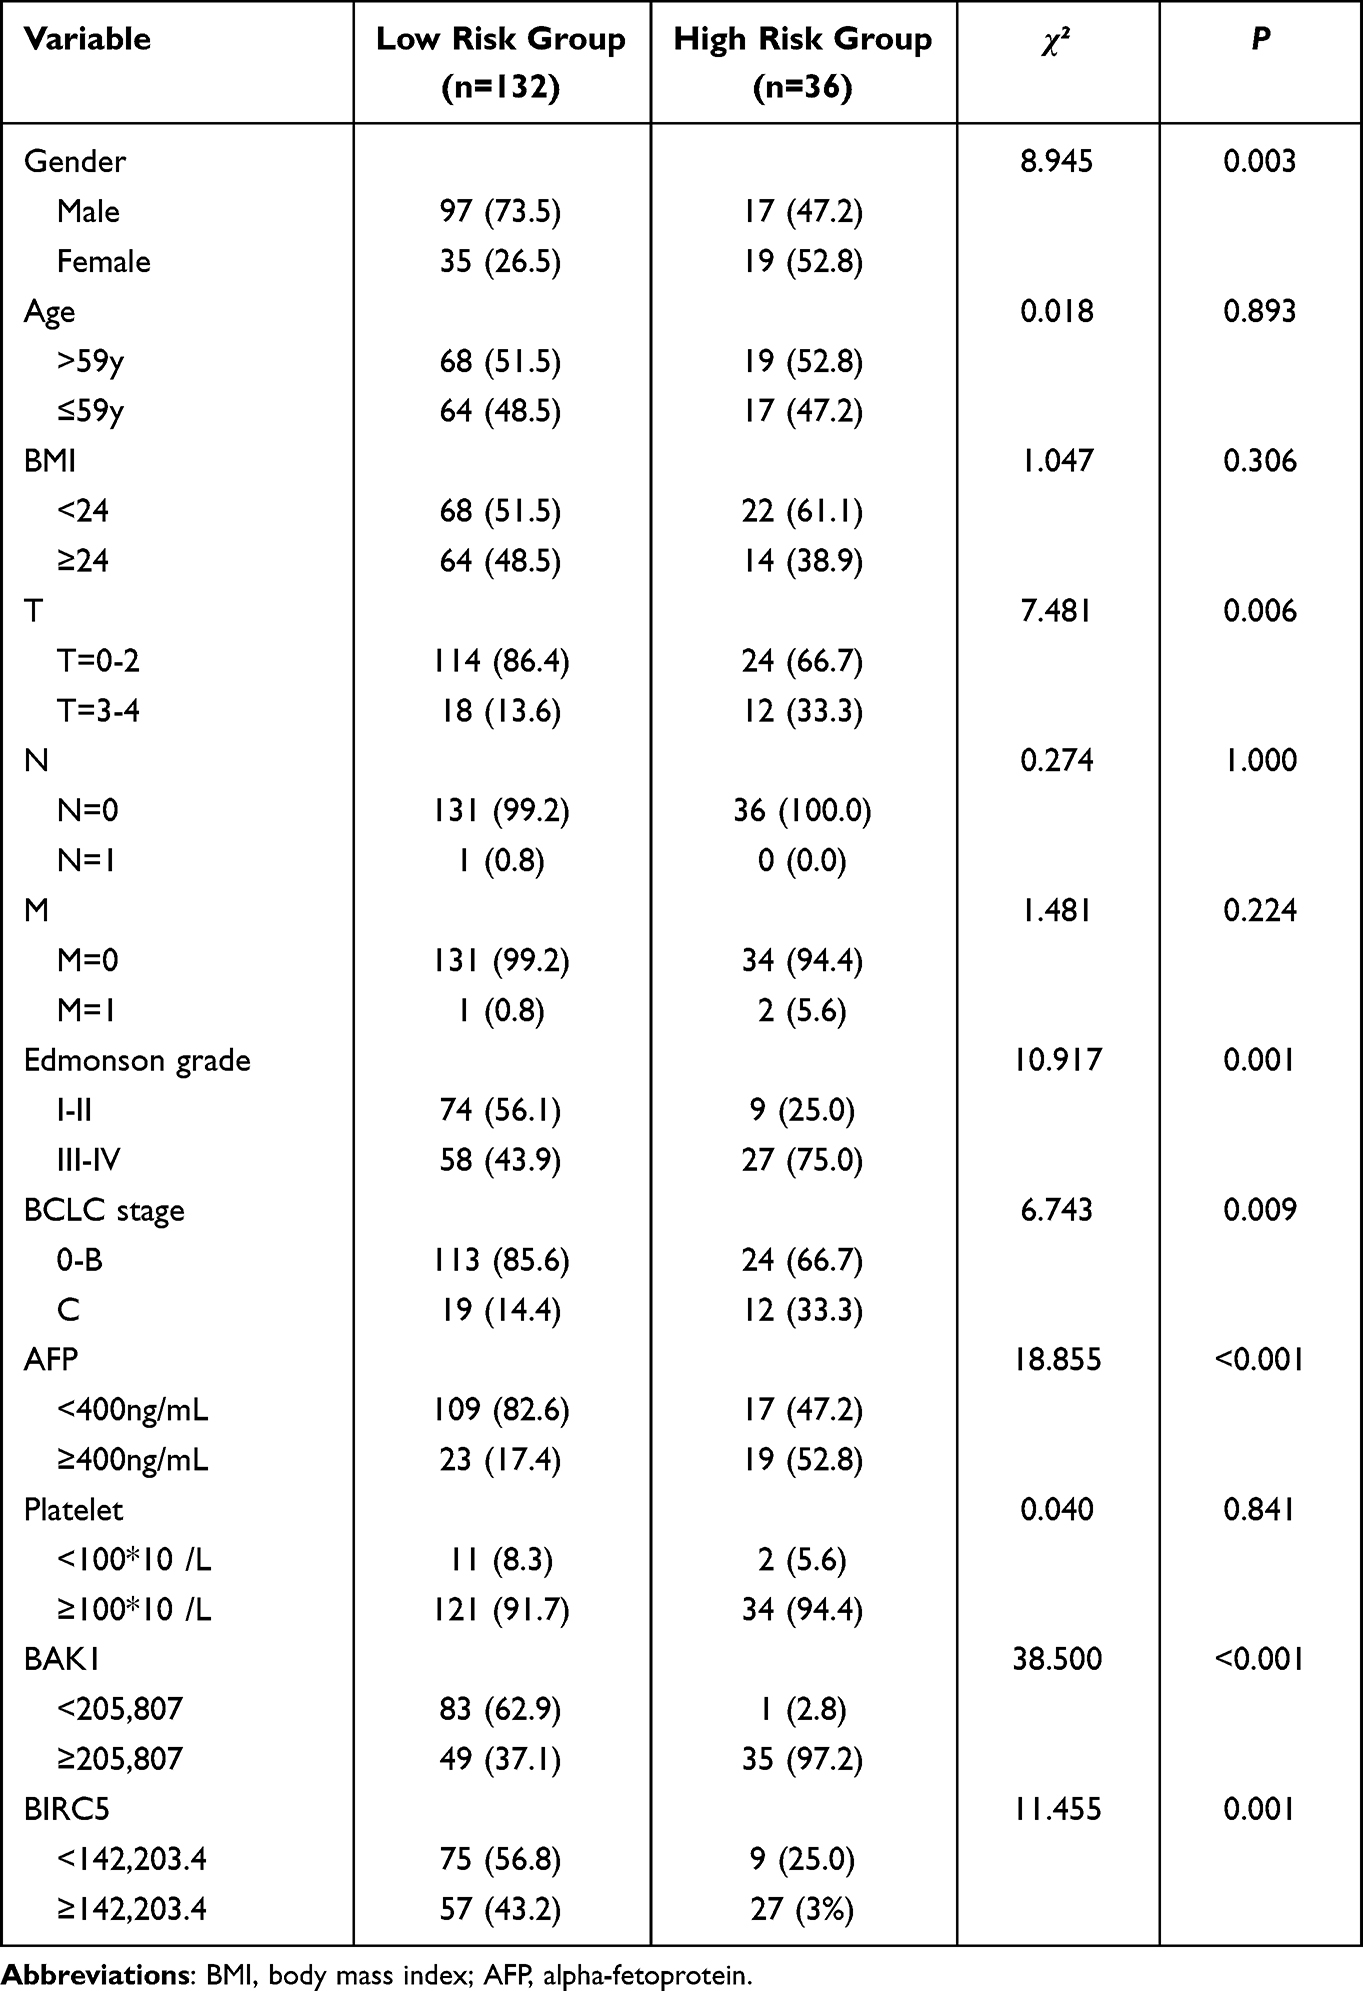 |
Table 3 Clinicopathological Data of Hepatocellular Carcinoma Patients in Low-Risk and High-Risk Groups in Validation Cohort |
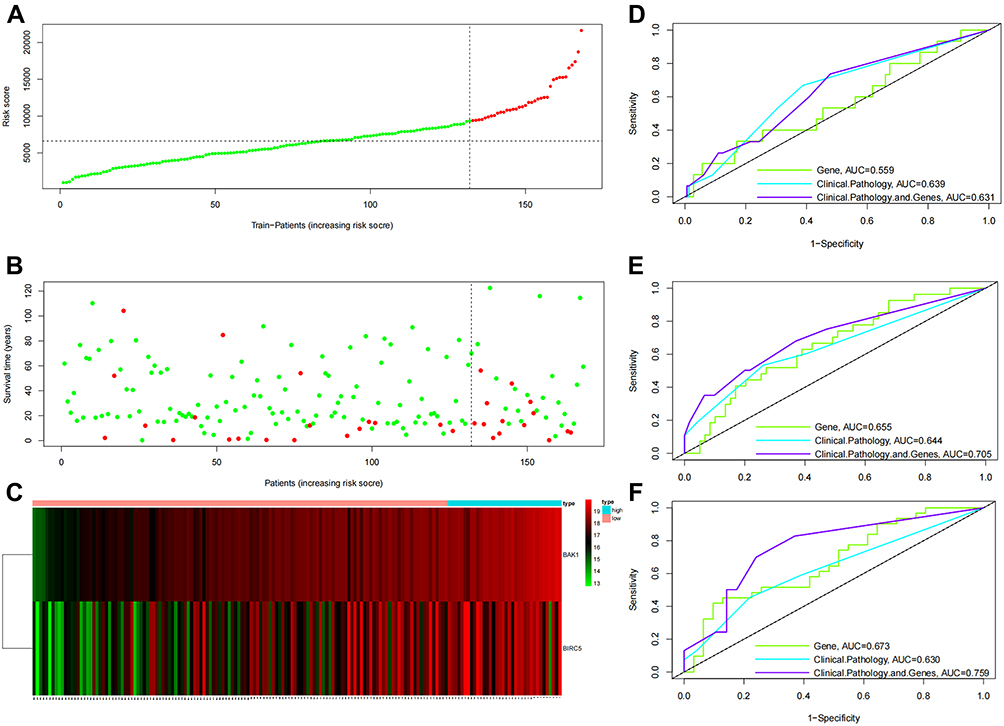 |
Figure 4 Assessing the effectiveness of risk signature in the TCGA database. (A) The distribution of risk scores of 168 patients from the TCGA cohort. (B) The patients’ survival status of 168 patients from the TCGA cohort. (C) Heatmap of BAK1 and BIRC5 expression levels in tumor tissues from the TCGA database: red squares indicate high expression of genes in corresponding samples, and green ones indicate low expression. Patients were arranged in the same order as in (A–C). ROC curves assessed the effectiveness of risk signature in anticipating 1- (D), 3- (E), and 5-year (F) OS rates in 168 samples from TCGA. |
In the validation model, Univariate analysis identified the following predictors of poor OS in HCC patients with hepatic resection: male patient, III - IV stage, M=1 (TNM staging), and high-risk ARGs. The above variables were further assessed using multivariate analysis, and the results indicated that none of the variables were independent risk factors of the postoperative OS. The P-value of risk scores in high-risk ARGs was 0.056 (Table 4).
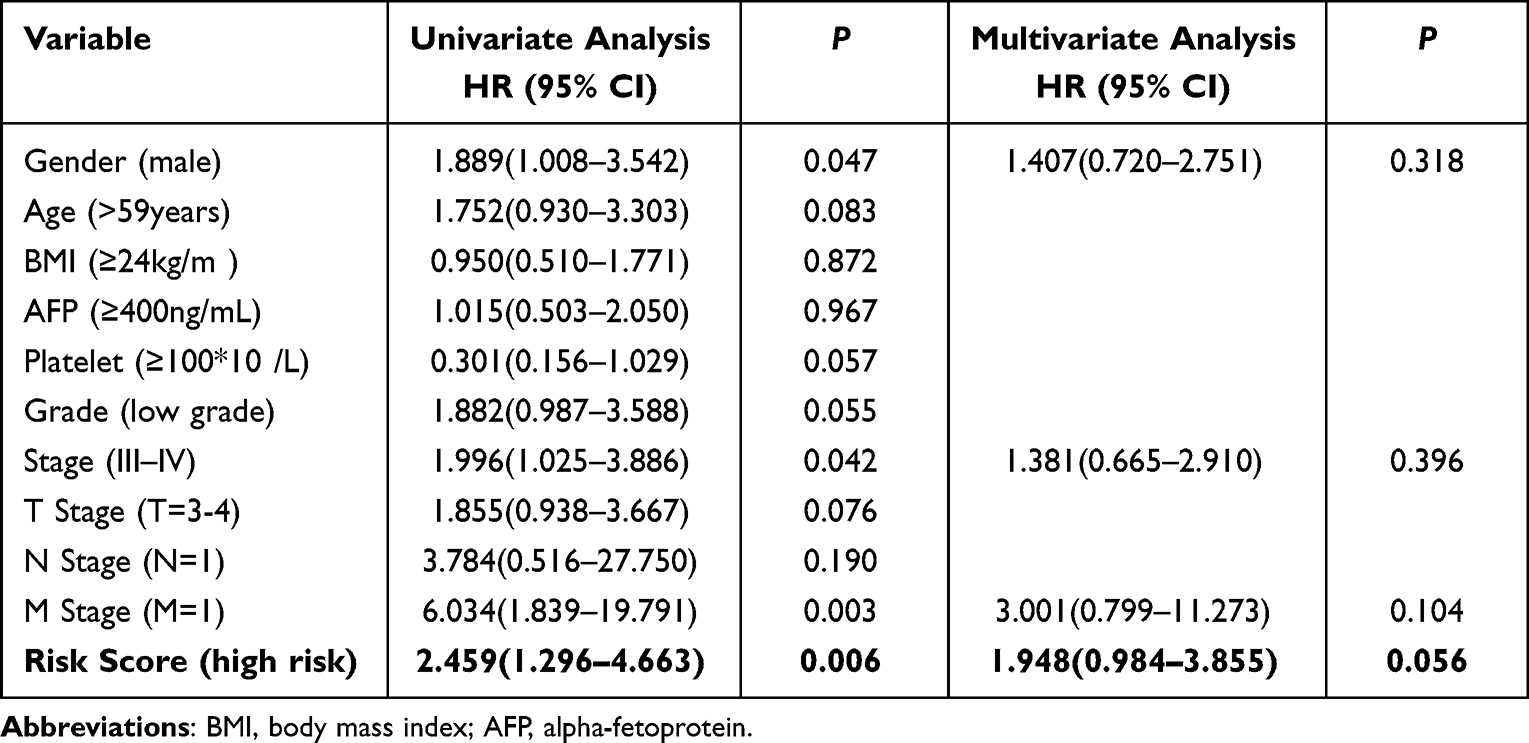 |
Table 4 Uni- and Multivariate Analysis to Identify Predictors of Overall Survival in HCC Patients of Validation Cohort (n = 168) |
The KM survival analysis results indicated that the median survival rates of HCC patients in the low- and high-risk categories were 56.2 and 104.2 months, respectively. Furthermore, the low-risk HCC patients showed 1-, 3-, and 5-year OS rates of 93.8%, 85.3%, and 66.1%, respectively, which were statistically higher compared to the high-risk HCC patients, who showed OS rates of 82.9%, 54.,0%, and 45.0%, respectively (P=0.004, Figure 5B). The clinicopathological data for modeling and survival analysis confirmed the results obtained from the training cohort. The combination of ARGs and clinicopathologic scores resulted in a higher sensitivity. Median OS rates in the validation dataset for the HCC patients in both risk categories were 88.5 and 107.6 months, respectively (P<0.001, Figure 5D). According to the analysis of ARGs (BAK1 and BIRC5) combined with clinicopathological data, the high-risk and low-risk HCC patients showed the most significant variation and highest AUC (0.631, 0.705 and 0.759 for 1-, 3-, 5-years). To illustrate the ability of the proposed model to anticipate the prognosis of HCC patients; ROC analysis was carried out using 168 TCGA samples in the ARGs scoring model, clinicopathological variable, COX regression model, and ARGs score combined with the clinicopathological variable scoring model. In the ARGs score combined with the clinicopathological variable scoring model, the AUC of the 1-, 3-, and 5-year ROC was 0.631, 0.706, and 0.759, respectively, which were observed to be higher compared to the ARGs score model (0.559, 0.655, 0.673) and clinicopathological variable COX regression model (0.639, 0.644, 0.630). Compared with 1- and 3- years, the risk score had the largest AUC = 0.759 in the 5-year ROC curve (Figure 4D-F).
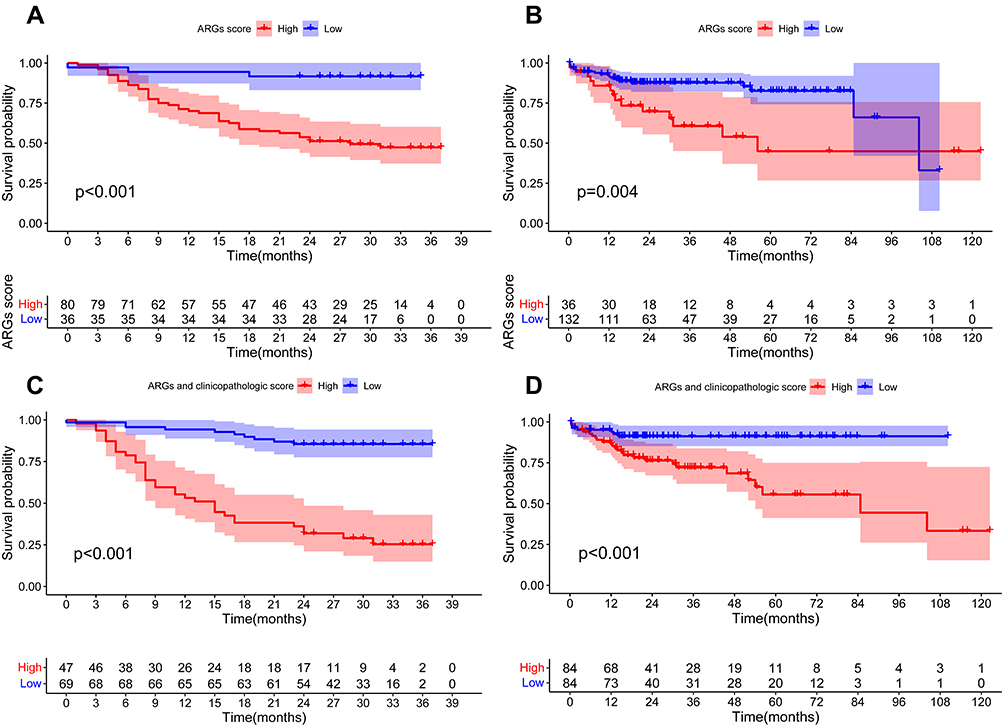 |
Figure 5 KM-OS curves revealed the prognostic value of the constructed risk signature in the training dataset (A and C) and validation dataset (B and D). Overall survival (OS) of HCC patients grouped depending on their ARG risk score (A and B) and ARGs combined with clinicopathological characteristics risk score (C and D). |
Validation of Protein Expression
The prognostic survival relationship between BIRC5, BAK1, and HCC tumor samples was validated using the THPA database. The expression levels of BIRC5 and BAK1 genes were significantly elevated in the HCC tissues. Data from the THPA database were categorized into high- and low-expression categories, depending on the BAK1 protein expression level (Figure 6A) and BIRC5 protein expression level (Figure 6C). Survival analysis of the THPA database cohort showed that BAK1 (Figure 6B) and BIRC5 (Figure 6D) high expression groups had a poor prognosis. The analysis of the training group also showed a higher BIRC5 protein expression level in the high-risk HCC patients (Figure 7A and B) compared to low-risk HCC patients (Figure 7C and D).
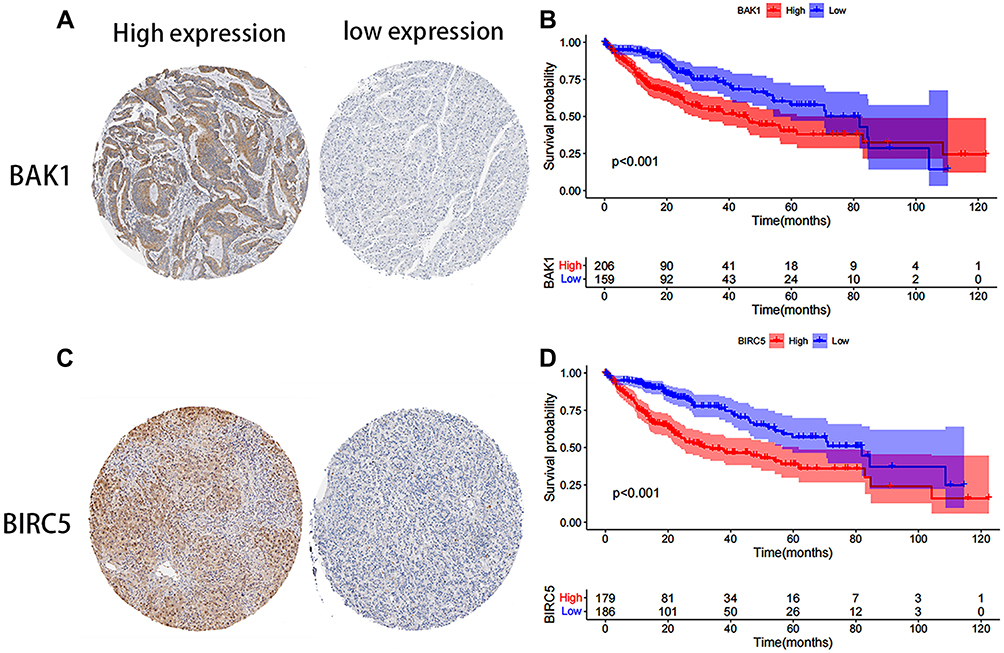 |
Figure 6 Effects of different expression levels of BAK1 and BIRC5 in the THPA database on prognosis. Immunohistochemical staining of BAK1 (A) and BIRC5 (C) with different expression levels. KM-OS curves depicting the OS rates in patients with different BAK1 (B) and BIRC5 (D) expression levels. |
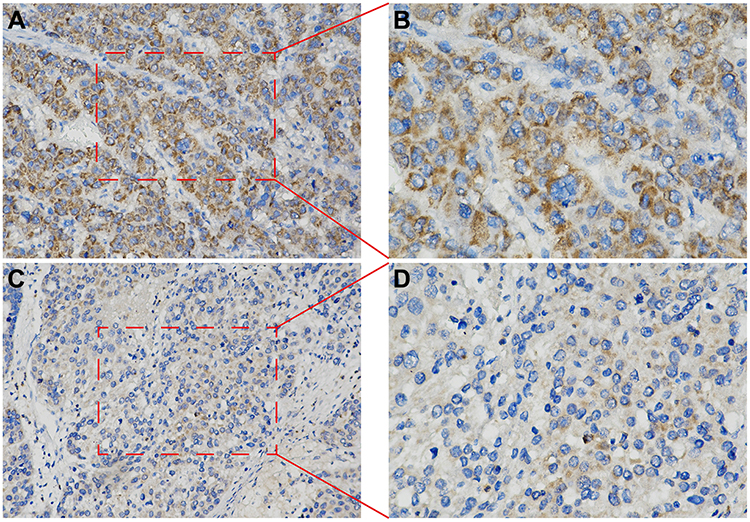 |
Figure 7 BIRC5 Expression in tumor tissue samples collected from the HCC patients in the Training cohort. (A and C) represent the successive slices at 200× magnification, whereas (B and D) present the zoom-in images of the highlighted region (400× magnification). |
Discussion
HCC is reported to be one of the deadliest cancers in the world.12 Understanding the molecular pathways underlying this disease is important because molecular targeted therapy is not very effective against HCC, and there are no reliable molecular biomarkers for HCC prediction and assessment.22–24 New avenues for HCC treatment can be determined by investigating the phenomenon of autophagy. However, many studies related to autophagy relied on a signal gene.25,26 In this study, ARGs were screened and two key prognosis-related ARGs were determined (which may provide new potential therapeutic targets) to explore the role played by the autophagy-related genes in HCC. The RNA sequencing of patient tissue specimens combined with the integrated analysis of the TCGA and THPA databases contributed to the understanding of the molecular biological mechanisms that determined the prognosis of HCC and delineated the prospective therapeutic intervention possibilities.
Due to recent developments in the high-throughput sequencing process, the extensive TCGA databases have offered useful methods for identifying gene signatures. Herein, various molecular biomarkers were explored to predict the prognosis of HCC patients and identify the expression patterns of ARGs from the TCGA cohort. Firstly, 62 ARGs showing an expression that varied between the HCC and non-tumor tissues were identified. They were analyzed using the GO and KEGG analyses and their probable involvement in the onset and advancement of HCC was determined. Remarkably, functional analysis revealed an increase in the no. of enriched genes related to the crucial KEGG pathways (such as colorectal cancer, p53, and PI3K-Akt signaling pathways). Thereafter, depending on the observed results, it was hypothesized that autophagy might be involved in the onset and progression of HCC. The multifaceted nature of autophagy in cancer is cause for concern. Beginning with the epithelial-to-mesenchymal transition, the autophagic reaction was observed to stimulate the onset and progression of existing malignancies via the mechanism of decreasing their sensitivity to the microenvironmental and cell-intrinsic cues that typically promote their cell death.27 Autophagy additionally acts as a survival mechanism in pre-existing cancers, producing metabolic energy and lowering oxidative stress to support growth and metastasis.28 However, the role played by autophagy can change based on the type of tumor.29–31
Five ARGs linked to OS were identified using univariate survival analysis, RNA sequencing data, and the TCGA database. Additionally, lasso regression analysis identified two important prognostic ARGs (BIRC5 and BAK1) to construct the risk score, which might function as a prognostic indicator for HCC patients in an independent manner.
The BIRC5 (survivin) gene belongs to the IAP gene family that encodes for negative regulatory proteins that inhibit apoptotic cell death.32 Though the BIRC5 expression is low in adult tissues, it is expressed at a high level during fetal development and in most malignancies. Many cancerous tissues, such as non-solid tumors like acute lymphoblastic leukemia, exhibit higher BIRC5 expression levels.33 However, the specific molecular mechanism that causes the poor prognosis of patients has not yet been elucidated. In the past, researchers noted that BIRC5 and BIRC4 gene expression levels were upregulated and interacted to form heterodimers in prostate cancer. These heterodimers contribute to anti-proteasome stability and inhibit caspase 3-mediated apoptosis, thereby promoting tumor growth.34 At the same time, BIRC5 interferes with the normal cell cycle, and an abnormal expression of BIRC5 is often accompanied by p53 mutations and a marked increase of ki-67. Further experimental studies showed that silencing the BIRC5 gene enhances the sensitivity of radiotherapy and chemotherapy.35,36 Zhang et al showed that the elevated expression level of BIRC5 or lowered expression level of miR-497-5p was associated with the poor OS rate in HCC patients. By targeting BIRC5, the restored expression of miR-497-5p suppressed colony formation, cell proliferation, and invasiveness.37 However, its inhibitor had the reverse effect. In another study, the researchers observed that BIRC5 was related to the epithelial-mesenchymal transition (EMT) in HCC and affected the HCC prognosis.38 BIRC5 was also regarded as a significant marker for determining the onset and progression of HCC. Thus, it could be considered a dependable prognostic predictor.38–40 The exact mechanism of Survivin’s interaction with autophagy is one of the current research hotspots, but no final conclusions have been reached. Upregulation of autophagy is widely thought to promote DNA repair in cells under genotoxic stress, but a study found that BIRC5 maintains DNA integrity through autophagy negative-modulations in both human cancer and mouse embryonic fibroblast cells under non-stressed conditions.41 Therefore, BIRC5 may be involved in the upstream regulation of autophagy by affecting DNA damage and repair functions.42 But more research is needed to confirm this conclusion.
By combining transcriptome data from the TCGA cohort with RNA-seq data of the malignant tissue samples from 116 HCC patients, it was noted that elevated BIRC5 expression level in HCC patients was linked to poor prognosis. The tissue samples from the cancer hospital at Guangxi Medical University and the data derived from the THPA database were used to corroborate these findings. BIRC5 was identified as an ARG, and the KEGG and GO pathway enrichment analyses implied that apoptosis, autophagy, cellular senescence, and the P53 signaling pathway were linked to the differential genes identified in this study. These results suggested that BIRC5 may affect cell cycle-related pathways through autophagy and other pathways, thereby changing the biological properties of HCC cells and affecting the prognosis of HCC patients. But to fully understand the pertinent pathways, more research in molecular biology is required.
A member of the BCL2 protein family was encoded by the BAK1 gene. Members of the BCL2 family cluster into oligomers or heterodimers to regulate apoptosis via multiple cellular processes. This protein causes apoptosis and is localized to the mitochondria.43 Studies have demonstrated that the downregulation of the BAK1 gene can stimulate the growth of malignant cells because the protein expressed by BAK1 is pro-apoptotic.44 Liu et al showed that BAK1 expression was downregulated in the colorectal cancer tissue samples, and it was inversely linked with miR-410 expression. Additional research in human colorectal cancer cells revealed that miR-410 controls apoptosis via the mechanism of targeting BAK1.45 Another study of the OCT4 gene in cervical carcinoma showed that miR-125b regulates BAK1 and low expression of BAK1 results in apoptosis inhibition.46 The findings in this study contradict the results of these studies. However, it is worth noting that here, BAK1 was used as a predictor of prognosis, and its high expression led to poor prognosis. However, whether the prognosis is related to dynamic changes in BAK1 needs further investigation. Therefore, the basal BAK1 expression level was regarded as the key to affecting the prognosis of HCC patients rather than its differences. This was verified in another study on the establishment of an HCC prognostic model, and the reference value of the BAK1 expression on prognosis was also verified in multiple public databases.47,48 These lines of evidence confirm the credibility of our findings.
However, this study also had some limitations. Owing to the lack of paraffinized tissue samples, BAK1 expression in tumor tissue samples acquired from HCC patients could not be verified using IHC. In one study, the researchers constructed a novel ARG-based prognostic model; however, the model developed by Luo et al predicted an AUC value of 0.828 in the 3-year OS of the training cohort.49 In this study, the 3-year OS prediction rate of the AUC in the training cohort was 0.865. Moreover, the RNA sequencing samples used in the training cohort were obtained from HCC patients admitted to the hospital, which could be verified from the tumor tissue level of modeled patients to a certain extent, which was an advantage they did not have.
Conclusions
Based on ARG expression profiles, two prognostic ARGs (BAK1, BIRC5) were identified. The genes involved in the autophagy pathways could offer potential treatment options for HCC. Moreover, a risk score model was developed for accurately anticipating the OS rate of HCC patients. However, more research is needed to evaluate the clinical application and development of the most effective, individualized, and targeted treatments.
Data Sharing Statement
The RNA-seq data and clinicopathological data used in this study can be acquired free of charge from the corresponding authors by email, and the rest of the data can be retrieved from TCGA (portal.gdc.cancer.gov/projects/TCGA-LIHC), THPA (http://www.proteinatlas.org), and HADb databases (http://www.autophagy.lu/index.html).
Acknowledgments
We thank The Cancer Genome Atlas (TCGA), the Gene Expression Omnibus (GEO), the Human Autophagy Database (HADb, http://www.autophagy.lu/index.html), the Database for Annotation, Visualization and Integrated Discovery (DAVID, http://david.ncifcrf.gov/) and the Human Protein Atlas (http://www.proteinatlas.org/) for providing the data. This research was supported by the Youth Program of Scientific Research Foundation of Guangxi Medical University Cancer Hospital (2021-08) and the National Natural Science Foundation of China (81960450).
Author Contributions
All authors made a significant contribution to the work reported, whether that is in the conception, study design, execution, acquisition of data, analysis and interpretation, or in all these areas; took part in drafting, revising or critically reviewing the article; gave final approval of the version to be published; had agreed on the journal to which the article has been submitted; and agreed to be accountable for all aspects of the work.
Disclosure
The authors declare no conflicts of interest.
References
1. Towers CG, Thorburn A. Therapeutic targeting of autophagy. EBioMedicine. 2016;14:15–23. doi:10.1016/j.ebiom.2016.10.034
2. Mizushima N, Levine B. Autophagy in human diseases. N Engl J Med. 2020;383(16):1564–1576.
3. Wang L, Ye X, Zhao T. The physiological roles of autophagy in the mammalian life cycle. Biol Rev Camb Philos Soc. 2019;94(2):503–516. doi:10.1111/brv.12464
4. Dash S, Aydin Y, Moroz K. Chaperone-Mediated Autophagy in the Liver: good or Bad? Cells. 2019;8:11. doi:10.3390/cells8111308
5. Yang S, Yang L, Li X, et al. New insights into autophagy in hepatocellular carcinoma: mechanisms and therapeutic strategies. Am J Cancer Res. 2019;9(7):1329–1353.
6. Mowers EE, Sharifi MN, Macleod KF. Autophagy in cancer metastasis. Oncogene. 2017;36(12):1619–1630. doi:10.1038/onc.2016.333
7. Onorati AV, Dyczynski M, Ojha R, Amaravadi RK. Targeting autophagy in cancer. Cancer. 2018;124(16):3307–3318. doi:10.1002/cncr.31335
8. Wang SS, Chen G, Li SH, et al. Identification and validation of an individualized autophagy-clinical prognostic index in bladder cancer patients. Onco Targets Ther. 2019;12:3695–3712. doi:10.2147/OTT.S197676
9. Pérez-Hernández M, Arias A, Martínez-García D, Pérez-Tomás R, Quesada R, Soto-Cerrato V. Targeting Autophagy for Cancer Treatment and Tumor Chemosensitization. Cancers. 2019;11(10):87. doi:10.3390/cancers11101599
10. Zhan L, Li J, Wei B. Autophagy therapeutics: preclinical basis and initial clinical studies. Cancer Chemother Pharmacol. 2018;82(6):923–934. doi:10.1007/s00280-018-3688-3
11. Oliveira SA, Campos J, Marôco J, Marziale MHP, Rocha FLR. Psychometric properties of the Work Limitations Questionnaire applied to nursing workers. Rev Lat Am Enfermagem. 2021;29:e3466. doi:10.1590/1518-8345.4771.3466
12. Sung H, Ferlay J, Siegel RL, et al. Global Cancer Statistics 2020: GLOBOCAN Estimates of Incidence and Mortality Worldwide for 36 Cancers in 185 Countries. CA Cancer J Clin. 2021;71(3):209–249. doi:10.3322/caac.21660
13. Guo Z, Zhong JH, Jiang JH, Zhang J, Xiang BD, Li LQ. Comparison of survival of patients with BCLC stage A hepatocellular carcinoma after hepatic resection or transarterial chemoembolization: a propensity score-based analysis. Ann Surg Oncol. 2014;21(9):3069–3076. doi:10.1245/s10434-014-3704-8
14. Zhong JH, Rodríguez AC, Ke Y, Wang YY, Wang L, Li LQ. Hepatic resection as a safe and effective treatment for hepatocellular carcinoma involving a single large tumor, multiple tumors, or macrovascular invasion. Medicine. 2015;94(3):e396. doi:10.1097/MD.0000000000000396
15. Asrani SK, Devarbhavi H, Eaton J, Kamath PS. Burden of liver diseases in the world. J Hepatol. 2019;70(1):151–171. doi:10.1016/j.jhep.2018.09.014
16. Yazdani HO, Huang H, Tsung A. Autophagy: dual Response in the Development of Hepatocellular Carcinoma. Cells. 2019;8(2):9536. doi:10.3390/cells8020091
17. Li P, Du Q, Cao Z, et al. Interferon-γ induces autophagy with growth inhibition and cell death in human hepatocellular carcinoma (HCC) cells through interferon- regulatory factor-1 (IRF-1). Cancer Lett. 2012;314(2):213–222. doi:10.1016/j.canlet.2011.09.031
18. Hua F, Li K, Shang S, Wang F, Hu Z. Immune Signaling and Autophagy Regulation. Adv Exp Med Biol. 2019;1206:551–593.
19. Gerada C, Ryan KM. Autophagy, the innate immune response and cancer. Mol Oncol. 2020;14(9):1913–1929. doi:10.1002/1878-0261.12774
20. Lévy J, Cacheux W, Bara MA, et al. Intestinal inhibition of Atg7 prevents tumour initiation through a microbiome-influenced immune response and suppresses tumour growth. Nat Cell Biol. 2015;17(8):1062–1073. doi:10.1038/ncb3206
21. Yang CL, Qiu X, Lin JY, et al. Potential Role and Clinical Value of PPP2CA in Hepatocellular Carcinoma. J Clin Translational Hepatol. 2021;9(5):661–671. doi:10.14218/JCTH.2020.00168
22. EASL Clinical Practice. Guidelines: management of hepatocellular carcinoma. J Hepatol. 2018;69(1):182–236.
23. Heimbach JK, Kulik LM, Finn RS, et al. AASLD guidelines for the treatment of hepatocellular carcinoma. Hepatology. 2018;67(1):358–380. doi:10.1002/hep.29086
24. Marisi G, Cucchetti A, Ulivi P, et al. Ten years of sorafenib in hepatocellular carcinoma: are there any predictive and/or prognostic markers? World j Gastroenterol. 2018;24(36):4152–4163. doi:10.3748/wjg.v24.i36.4152
25. Lin Z, Niu Y, Wan A, et al. RNA m(6) A methylation regulates sorafenib resistance in liver cancer through FOXO3-mediated autophagy. EMBO J. 2020;39(12):e103181. doi:10.15252/embj.2019103181
26. Li Q, Ni Y, Zhang L, et al. HIF-1α-induced expression of m6A reader YTHDF1 drives hypoxia-induced autophagy and malignancy of hepatocellular carcinoma by promoting ATG2A and ATG14 translation. Signal Transduction Targeted Therapy. 2021;6(1):76. doi:10.1038/s41392-020-00453-8
27. Kroemer G, Mariño G, Levine B. Autophagy and the integrated stress response. Mol Cell. 2010;40(2):280–293. doi:10.1016/j.molcel.2010.09.023
28. White E, Mehnert JM, Chan CS. Autophagy, Metabolism, and Cancer. Clin Cancer Res. 2015;21(22):5037–5046. doi:10.1158/1078-0432.CCR-15-0490
29. Li X, He S, Ma B. Autophagy and autophagy-related proteins in cancer. Mol Cancer. 2020;19(1):12. doi:10.1186/s12943-020-1138-4
30. Kudo Y, Sugimoto M, Arias E, et al. PKCλ/ι Loss Induces Autophagy, Oxidative Phosphorylation, and NRF2 to Promote Liver Cancer Progression. Cancer Cell. 2020;38(2):247–262.e211. doi:10.1016/j.ccell.2020.05.018
31. Ma Z, Lou S, Jiang Z. PHLDA2 regulates EMT and autophagy in colorectal cancer via the PI3K/AKT signaling pathway. Aging. 2020;12(9):7985–8000. doi:10.18632/aging.103117
32. Gil-Kulik P, Krzyżanowski A, Dudzińska E, et al. Potential Involvement of BIRC5 in Maintaining Pluripotency and Cell Differentiation of Human Stem Cells. Oxid Med Cell Longev. 2019;2019:8727925. doi:10.1155/2019/8727925
33. Fäldt Beding A, Larsson P, Helou K, Einbeigi Z, Parris TZ. Pan-cancer analysis identifies BIRC5 as a prognostic biomarker. BMC Cancer. 2022;22(1):322. doi:10.1186/s12885-022-09371-0
34. Hennigs JK, Minner S, Tennstedt P, et al. Subcellular Compartmentalization of Survivin is Associated with Biological Aggressiveness and Prognosis in Prostate Cancer. Sci Rep. 2020;10(1):3250. doi:10.1038/s41598-020-60064-9
35. Chang Y, Geng Q, Bao Q, Hu P. Salinomycin enhances radiotherapy sensitivity and reduces expressions of BIRC5 and NEIL2 in nasopharyngeal carcinoma. Eur Rev Med Pharmacol Sci. 2020;24(11):6409–6416. doi:10.26355/eurrev_202006_21539
36. Morrison DJ, Hogan LE, Condos G, et al. Endogenous knockdown of survivin improves chemotherapeutic response in ALL models. Leukemia. 2012;26(2):271–279. doi:10.1038/leu.2011.199
37. Zhang M, Yan X, Wen P, Bai W, Zhang Q. CircANKRD52 Promotes the Tumorigenesis of Hepatocellular Carcinoma by Sponging miR-497-5p and Upregulating BIRC5 Expression. Cell Transplant. 2021;30:9636897211008874. doi:10.1177/09636897211008874
38. Xu R, Lin L, Zhang B, et al. Identification of prognostic markers for hepatocellular carcinoma based on the epithelial- mesenchymal transition-related gene BIRC5. BMC Cancer. 2021;21(1):687. doi:10.1186/s12885-021-08390-7
39. Peng Y, Liu C, Li M, et al. Identification of a prognostic and therapeutic immune signature associated with hepatocellular carcinoma. Cancer Cell Int. 2021;21(1):98. doi:10.1186/s12935-021-01792-4
40. Shen S, Wang R, Qiu H, et al. Development of an Autophagy-Based and Stemness-Correlated Prognostic Model for Hepatocellular Carcinoma Using Bulk and Single-Cell RNA-Sequencing. Front Cell Dev Biol. 2021;9:743910. doi:10.3389/fcell.2021.743910
41. Lin TY, Chan HH, Chen SH, et al. BIRC5/Survivin is a novel ATG12-ATG5 conjugate interactor and an autophagy-induced DNA damage suppressor in human cancer and mouse embryonic fibroblast cells. Autophagy. 2020;16(7):1296–1313. doi:10.1080/15548627.2019.1671643
42. Cheng SM, Lin TY, Chang YC, Lin IW, Leung E, Cheung CHA. YM155 and BIRC5 downregulation induce genomic instability via autophagy-mediated ROS production and inhibition in DNA repair. Pharmacological Res. 2021;166:105474. doi:10.1016/j.phrs.2021.105474
43. Edlich F. BCL-2 proteins and apoptosis: recent insights and unknowns. Biochem Biophys Res Commun. 2018;500(1):26–34. doi:10.1016/j.bbrc.2017.06.190
44. Sinha D, Duijf PHG, Khanna KK. Mitotic slippage: an old tale with a new twist. Cell Cycle. 2019;18(1):7–15. doi:10.1080/15384101.2018.1559557
45. Liu C, Zhang A, Cheng L, Gao Y. miR- 410 regulates apoptosis by targeting Bak1 in human colorectal cancer cells. Mol Med Rep. 2016;14(1):467–473. doi:10.3892/mmr.2016.5271
46. Wang YD, Cai N, Wu XL, Cao HZ, Xie LL, Zheng PS. OCT4 promotes tumorigenesis and inhibits apoptosis of cervical cancer cells by miR- 125b/BAK1 pathway. Cell Death Dis. 2013;4(8):e760. doi:10.1038/cddis.2013.272
47. Yan J, Cao J, Chen Z. Mining prognostic markers of Asian hepatocellular carcinoma patients based on the apoptosis-related genes. BMC Cancer. 2021;21(1):175. doi:10.1186/s12885-021-07886-6
48. Zhu L, Yan D, Chen Y, Chen S, Chen N, Han J. The identification of autophagy-related genes in the prognosis of oral squamous cell carcinoma. Oral Dis. 2020;26(8):1659–1667. doi:10.1111/odi.13492
49. Luo Y, Liu F, Han S, et al. Autophagy- Related Gene Pairs Signature for the Prognosis of Hepatocellular Carcinoma. Front Mol Biosci. 2021;8:670241. doi:10.3389/fmolb.2021.670241
 © 2022 The Author(s). This work is published and licensed by Dove Medical Press Limited. The full terms of this license are available at https://www.dovepress.com/terms.php and incorporate the Creative Commons Attribution - Non Commercial (unported, v3.0) License.
By accessing the work you hereby accept the Terms. Non-commercial uses of the work are permitted without any further permission from Dove Medical Press Limited, provided the work is properly attributed. For permission for commercial use of this work, please see paragraphs 4.2 and 5 of our Terms.
© 2022 The Author(s). This work is published and licensed by Dove Medical Press Limited. The full terms of this license are available at https://www.dovepress.com/terms.php and incorporate the Creative Commons Attribution - Non Commercial (unported, v3.0) License.
By accessing the work you hereby accept the Terms. Non-commercial uses of the work are permitted without any further permission from Dove Medical Press Limited, provided the work is properly attributed. For permission for commercial use of this work, please see paragraphs 4.2 and 5 of our Terms.