")
Back to Journals » ClinicoEconomics and Outcomes Research » Volume 8
Determination of the most appropriate method for extrapolating overall survival data from a placebo-controlled clinical trial of lenvatinib for progressive, radioiodine-refractory differentiated thyroid cancer
Authors Tremblay G, Livings C, Crowe L, Kapetanakis V, Briggs A
Received 1 March 2016
Accepted for publication 13 April 2016
Published 30 June 2016 Volume 2016:8 Pages 323—333
DOI https://doi.org/10.2147/CEOR.S107498
Checked for plagiarism Yes
Review by Single anonymous peer review
Peer reviewer comments 3
Editor who approved publication: Professor Giorgio Colombo
Gabriel Tremblay,1 Christopher Livings,2 Lydia Crowe,2 Venediktos Kapetanakis,2 Andrew Briggs3
1Global Health Economics and Health Technology Assessment, Eisai Inc., Woodcliff Lake, NJ, USA; 2Health Economics, Decision Resources Group, Bicester, Oxfordshire, 3Health Economics and Health Technology Assessment, Institute of Health and Wellbeing, University of Glasgow, Glasgow, UK
Background: Cost-effectiveness models for the treatment of long-term conditions often require information on survival beyond the period of available data.
Objectives: This paper aims to identify a robust and reliable method for the extrapolation of overall survival (OS) in patients with radioiodine-refractory differentiated thyroid cancer receiving lenvatinib or placebo.
Methods: Data from 392 patients (lenvatinib: 261, placebo: 131) from the SELECT trial are used over a 34-month period of follow-up. A previously published criterion-based approach is employed to ascertain credible estimates of OS beyond the trial data. Parametric models with and without a treatment covariate and piecewise models are used to extrapolate OS, and a holistic approach, where a series of statistical and visual tests are considered collectively, is taken in determining the most appropriate extrapolation model.
Results: A piecewise model, in which the Kaplan–Meier survivor function is used over the trial period and an extrapolated tail is based on the Exponential distribution, is identified as the optimal model.
Conclusion: In the absence of long-term survival estimates from clinical trials, survival estimates often need to be extrapolated from the available data. The use of a systematic method based on a priori determined selection criteria provides a transparent approach and reduces the risk of bias. The extrapolated OS estimates will be used to investigate the potential long-term benefits of lenvatinib in the treatment of radioiodine-refractory differentiated thyroid cancer patients and populate future cost-effectiveness analyses.
Keywords: survival analysis, parametric extrapolation, piecewise models, decision criteria, radioiodine-refractory differentiated thyroid cancer
Introduction
The majority of patients with differentiated thyroid cancer (DTC) have a good prognosis, with estimated 10-year survival rates of 92%.1 However, an estimated 5% of patients suffer from metastatic, radioiodine-refractory (RR) DTC,1–3 which is difficult to treat,4–6 associated with a high patient burden,7,8 and has a 10-year survival rate of only 10%.1 The goal of therapy for patients with RR-DTC is to delay disease progression and prolong survival.4,9
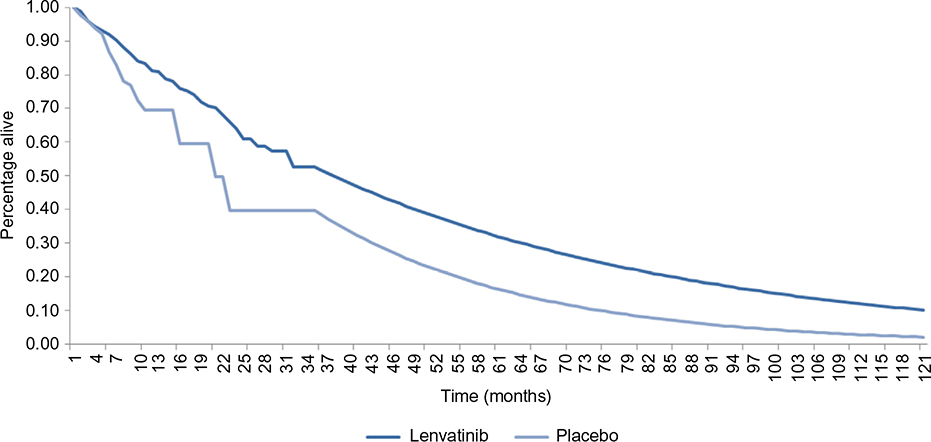
Lenvatinib is a multiple receptor tyrosine kinase inhibitor that selectively inhibits multiple angiogenic and oncogenic signaling pathways10 and is indicated for the treatment of adult patients with progressive, locally advanced, or metastatic, differentiated (papillary/follicular/Hürthle cell) RR-DTC.10 The key clinical evidence for lenvatinib is derived from a Phase III multicenter, double-blind, randomized (2:1), placebo-controlled trial (SELECT) comparing the efficacy and safety of lenvatinib and placebo in patients with progressive RR-DTC.11 The primary end point of SELECT was progression-free survival (PFS), with overall survival (OS) measured as a secondary end point. The trial was designed to allow patients randomized to the placebo group to receive optional open-label lenvatinib at the time of confirmed disease progression. Over the 34-month period of follow-up of the SELECT, lenvatinib was found to prolong PFS by almost 15 months compared with placebo (hazard ratio =0.21; 95% confidence interval [CI]: 0.14–0.31).11
While PFS is an important and significant measure of treatment success, OS is a key outcome for patients and health care providers. A high value is placed on OS by health technology assessment bodies, and it is a key component of cost-effectiveness models for long-term conditions. However, benefits in OS often prove difficult to demonstrate, particularly due to the limited duration of clinical trials, whereas PFS clinical trial data are often more complete. Although PFS at 34 months of follow-up for the placebo and lenvatinib arms in SELECT was 0% and 33%, respectively, median OS was not reached in either treatment group, meaning that >50% of patients remained alive.12 Therefore, extrapolation of OS was considered more critical than that of PFS and is the focus of this manuscript.
Increasing trial time-horizons to capture reliable OS data would be prohibitively expensive, with results often not available for many years, thus delaying patient access to potentially beneficial new treatments. A method of obtaining estimates of long-term survival is by extrapolation from the available data. In cases where treatment effects on survival extend beyond the period investigated in clinical trials, extrapolation could reveal longer term treatment benefits that would have been missed by restricting the investigation to a shorter period.13 The purpose of this analysis is to identify the most appropriate extrapolation method for SELECT OS data in order to estimate the potential long-term benefit of lenvatinib in slowly evolving RR-DTC and for potential use in future cost-effectiveness evaluations.
Methods
The following sections describe the SELECT and the derivation of OS data, including the construction of Kaplan–Meier (KM) plots for adjusting OS data for potential bias due to the crossover design of the SELECT. These methods have been described in the previous literature14 and are important to the understanding of the current approach.
Select
The SELECT was a Phase III, randomized, double-blind, placebo-controlled, multicenter, crossover trial. Patients aged 18 years or older were eligible for enrollment and were recruited from the Americas, Europe, Asia, and Australia. In total, 392 patients were randomly assigned (block randomization) in a 2:1 ratio to receive 24 mg once-daily oral lenvatinib (261 patients) or placebo (131 patients) in 28-day cycles. Trial follow-up was 34 months (cutoff point June 15, 2014). Primary and secondary analyses were conducted in the intention-to-treat population.11
OS data from the SELECT – crossover correction and production of KM plots
Due to the crossover design of SELECT, where patients randomized to placebo were eligible to receive open-label lenvatinib on confirmed disease progression,11 87.8% of placebo-treated patients switched to lenvatinib. As a consequence, although PFS data were unaffected by the crossover design of SELECT, OS survival for the placebo arm was biased, with placebo demonstrating a higher survival than what would have been observed without treatment switching due to the use of open-label lenvatinib. To adjust for this bias, a rank-preserving structural failure time (RPSFT) model was used.12,14 Table 1 shows the unadjusted and RPSFT-corrected median OS times for the lenvatinib and placebo arms of the SELECT. KM plots for both trial arms have been published by Schlumberger et al.11 In the current analysis, long-term OS is obtained by extrapolation from the RPSFT-corrected data over the trial period.
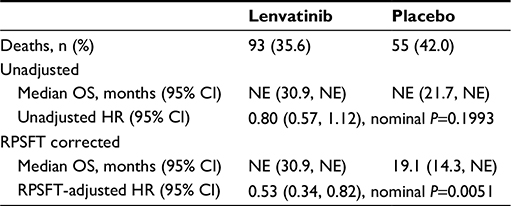 | Table 1 Summary statistics of clinical trial data from SELECT, unadjusted and RPSFT corrected at 34 months of follow-up (June 15, 2014) Abbrevations: CI, confidence interval; HR, hazard ratio; NE, not estimable; OS, overall survival; RPSFT, rank-preserving structural failure time. |
Current analysis
Time-horizon
A 120-month (10-year) time-horizon was chosen in order to mitigate inherent uncertainty in the extrapolation of 34-month OS data over a lifetime-horizon. The 10-year time-horizon was deemed both sufficient to capture meaningful differences in OS and appropriate from an economic perspective since, according to published data, only 10% of patients with RR-DCT survive at 10 years.1 The restricted mean, truncated at the 10-year time-horizon, was used to facilitate estimates of OS before and after the empirical data cutoff (at 34 months), while the extended mean was used to estimate CIs around the marginal OS difference. The uncertainty around the estimates was measured using the bootstrap method15 to evaluate the CIs. All statistical analyses were performed in STATA Version 13 (StataCorp LP, College Station, TX, USA).
Selection of most appropriate extrapolation method
A peer-reviewed, five-criterion framework for the robust extrapolation of survival data (presented by Tremblay et al13) was applied to the RPSFT-adjusted SELECT data set in order to help identify the most plausible extrapolation for OS.
Criterion 1 – proportional treatment (PT) assumption testing: the PT assumption must be supported by the log-cumulative hazard plot (which would be parallel in the case of a PT effect) and the PT global test.16
Criterion 2 – extrapolated hazard function fitting in time and between trial arms: the hazard rates should have a similar time relation pattern between the extrapolation function and the KM survivor function. The characteristic of the relation between the hazard rates of both arms should be replicated by the modeling technique selected, for example, crossing lines would advocate a separate parametric model for each arm.
Criterion 3 – minimal Akaike information criterion (AIC) and Bayesian information criterion (BIC): for parametric models, the selected model must have a low AIC/BIC to demonstrate goodness-of-fit to the clinical data.
Criterion 4 – uncertainty in the results: uncertainty in model parameters should be considered when selecting the best model, as a high uncertainty would be a sign of low robustness.
Criterion 5 – similitude of pre-extrapolation marginal gain and realism of the extrapolated marginal gain: the realism of the marginal gain should be accounted for when selecting the best model as an unrealistic marginal gain would create bias in the economic analysis.
Although these five criteria provide a systematic approach for the identification of the model that most accurately extrapolates OS, they should be used as a theoretical guide only as it is often the case that not all of these criteria can be satisfied simultaneously when applied to real data.
Five model “classes” were considered for the extrapolation of OS: PT models with a treatment covariate, accelerated failure time (AFT) models with a treatment covariate, individual models (where the extrapolation for each arm is estimated separately, ie, no treatment covariate is used), KM survival function with parametric extrapolation, and Royston and Parmar spline technique. The Exponential, Weibull, Gompertz, Log-Normal, Log-Logistic, and Gamma distributions were considered, where appropriate, in the model classes outlined earlier.
For the purposes of the current analysis, the selected extrapolation model needs to be compatible with a 10-year time-horizon. The Royston and Parmar technique is a flexible piecewise technique that uses segmental parameter partitioning.17 Although this allows for a better fit of the parametric function to the pre-34-month cutoff data, credibility for the tail extrapolation is lost. Therefore, the Royston and Parmar technique was deemed inappropriate for extrapolating data to 10 years in the current analysis. The models used in the current analysis were parametric (PT and AFT), individual (separate models for each arm of the SELECT), and piecewise (KM + extrapolated tail).
Results
Extrapolation of OS data from SELECT
Criterion 1 – PT assumption testing
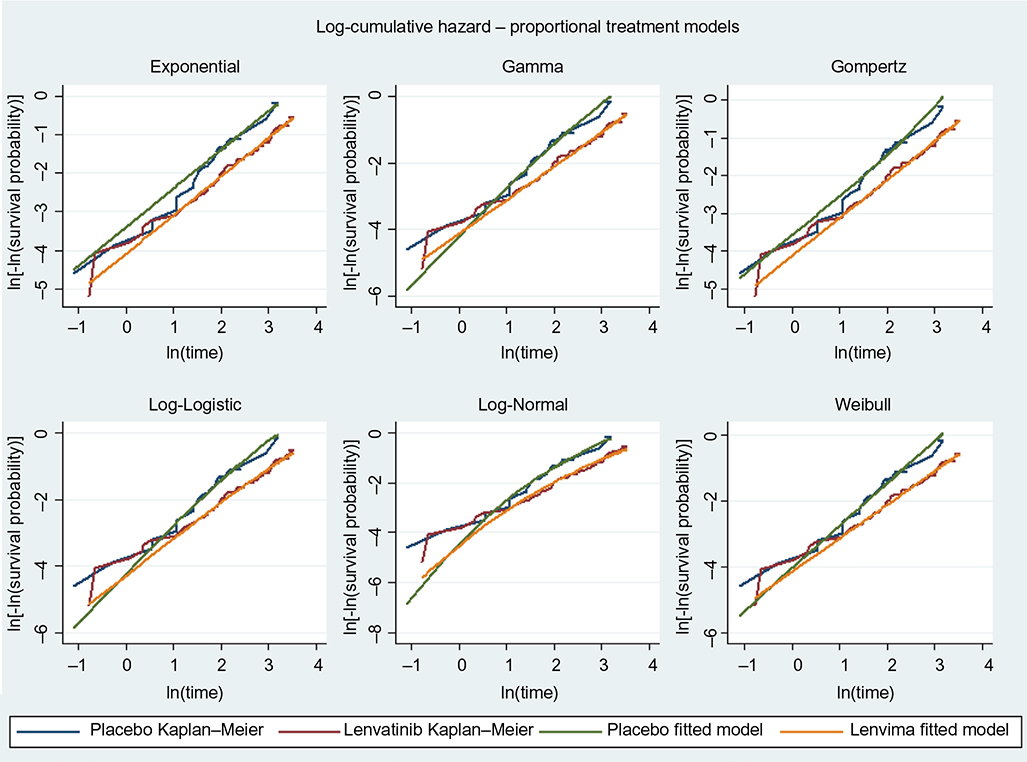
PT assumption testing (Criterion 1) was performed by visual inspection of the log-cumulative hazard plot (Figure 1) and the PT global test (Schoenfeld residual test).18 The visual inspection revealed relatively straight but not parallel log-cumulative plots. The PT global test yielded a P-value of 0.7270, which did not indicate a significant deviation from the PT assumption. Due to the contradictory nature of the global test for a PT effect and the visual inspection of the log-cumulative hazard OS plot, the validity of the PT assumption was ambiguous.
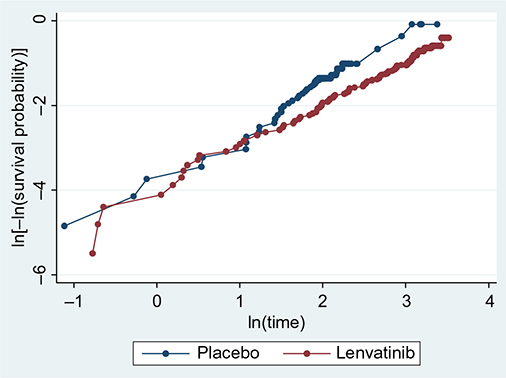 | Figure 1 Log-cumulative hazard plot for OS. Abbrevation: OS, overall survival. |
Criterion 2 – extrapolated hazard function fitting in time and between trial arms
A visual evaluation of the extrapolated hazard function fitting to the KM hazard function was performed. Inspection of the log-cumulative hazard plot (Figure 1) indicated that using fully parametric models with a treatment covariate (PT and AFT) would, by definition, not adequately capture the crossing of hazards. Fitted and observed log-cumulative hazard functions were overlaid for both the PT (Figure S1) and individual models (Figure S2). Figure S1 shows that the Weibull (PT and AFT models) and Gamma (AFT model) have similar hazard patterns to the KM of empirical data after the plots have diverged. The fitting of individual models negates the PT assumption and may therefore better reflect the change in hazard at earlier points in time. The log-cumulative hazard plots for individual models (Figure S2) indicated that the Weibull, Gamma, and the Log-Logistic distributions can be considered to have approximately similar hazard patterns to the KM of empirical data.
Criterion 3 – minimal AIC and BIC and Criterion 4 – uncertainty in the results
The difference in mean OS survival estimates between the lenvatinib and placebo arms of SELECT, summary statistics (based on the extended mean), CIs of the marginal difference, and AIC/BIC criteria are provided in Table 2 for models based on the PT assumption, individual models, and piecewise models. The different classes display similar findings in terms of ranking the best fitted models to the empirical data. The Log-Logistic, Gompertz, Gamma, and Log-Normal extrapolations are ranked third, fourth, fifth, and sixth, respectively, in each of the model classes when evaluating the AIC statistics. This result is closely matched in the BIC statistics; however, in each class, the Log-Normal extrapolation is ranked fifth and the Gamma sixth. In the case of the individual models, the Exponential extrapolation would be ranked first from the perspective of both the AIC and the BIC. This ranking is repeated in the BIC results for the PT models; however, the AIC statistics show the Weibull to be a better fit than the Exponential. The CIs do not go below 0 for any of the extrapolations in the PT and piecewise model classes. In the individual model class, both the Log-Logistic and Gamma extrapolations have lower bounds crossing 0. In each of the model classes, the Log-Normal and Log-Logistic extrapolations exhibit the highest levels of uncertainty (widest CIs).
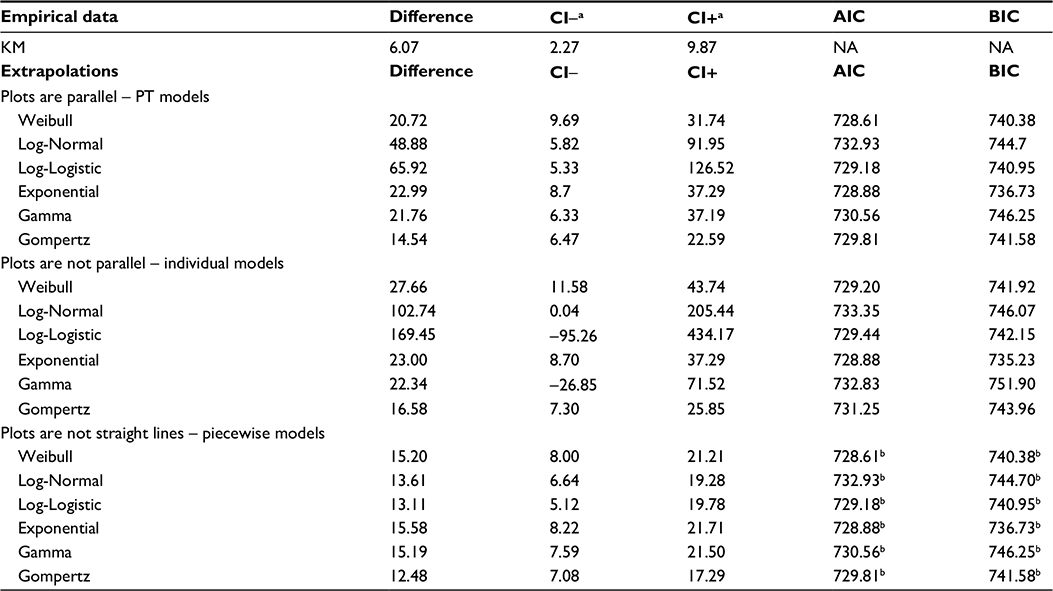 | Table 2 Difference in mean OS estimates between the lenvatinib and placebo arms and associated information criteria for each fitted model Notes: aExtended means were used for the CIs and point estimates except for piecewise models, where restricted mean at 120 months was used. bAIC/BIC – as no AIC/BIC data are available for this type of piecewise model, the AIC/BIC of the parametric function used for the tail extrapolation is presented as a proxy. Abbrevations: AIC, Akaike information criterion; BIC, Bayesian information criterion; CI, confidence interval; KM, Kaplan–Meier; NA, not applicable; OS, overall survival; PT, proportional treatment. |
Criterion 5 – similitude of pre-extrapolation marginal gain and realism of the extrapolated marginal gain
Criterion 5 is a “rule of thumb” designed to evaluate the robustness of the marginal survival gain of the extrapolation in comparison with that shown in the pre-extrapolation KM. The marginal survival gain prior or post the trial cutoff is divided by the time prior or post the trial cutoff, respectively. The resulting ratio in the post-trial period should be equal or inferior to the ratio in the pre-extrapolation period, that is, if the ratio is much higher after the cutoff, it suggests that the marginal gain is exaggerated in the post-cutoff period (resulting in a “long” and/or “thick” tail). The ratios that serve as the basis for evaluating Criterion 5 are shown in Table 3.
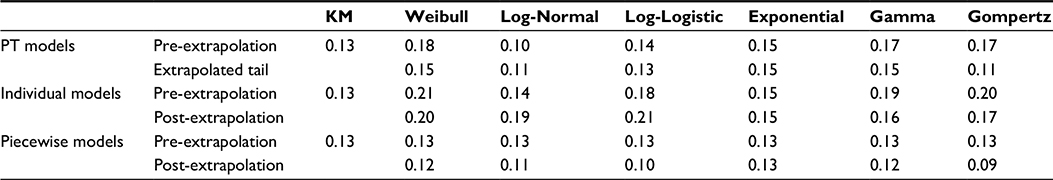 | Table 3 Evaluation of Criterion 5 – estimated rate of survival gain per month by receiving lenvatinib instead of placebo, before and after the trial cutoff Notes: The rate of survival gain in the pre-extrapolation period is defined as the difference in survival between lenvatinib and placebo at 36 months divided by the number of months in the pre-extrapolation period (ie 36 months). The rate of survival gain in the post-extrapolation period is defined as the marginal relative difference in the extrapolated period (post cut-off) divided by the number of months post-cut-off. Abbrevations: KM, Kaplan–Meier; PT, proportional treatment. |
Of the PT models, the Log-Normal, Log-Logistic, and Gompertz distributions satisfied Criterion 5 in terms of the comparison of the KM rate of survival gain against the post-extrapolation rate of survival gain. However, of these, only the Log-Normal distribution satisfied Criterion 5 in terms of comparison between the pre- and post-extrapolation rate of gain. The Weibull and Gamma distributions both satisfied Criterion 5 in terms of the comparison between pre- and post-extrapolation rate of gain; however, in both instances, the extrapolated rate of gain in the pre-extrapolation period was greater than the KM rate of survival gain.
All the individual models failed to satisfy Criterion 5 in terms of the comparison of the KM rate of survival gain against the post-extrapolation rate of survival gain. The Weibull, Exponential, Gamma, and Gompertz distributions all satisfied the criterion in terms of the comparison between pre- and postextrapolated rate of survival gain. Neither the Log-Normal nor the Log-Logistic distributions satisfied the criterion when either the KM or pre-extrapolation rate was compared against the postextrapolation rate. For both distributions, the postextrapolation rate of survival gain is noticeably higher than the KM rate of survival gain, a result indicative of both distributions being characterized by “long” tails. Using the KM survival function with extrapolated tail, all evaluated distributions satisfied Criterion 5.
The individual results for the application of each of the five criteria in the model selection framework are presented in Table 4.
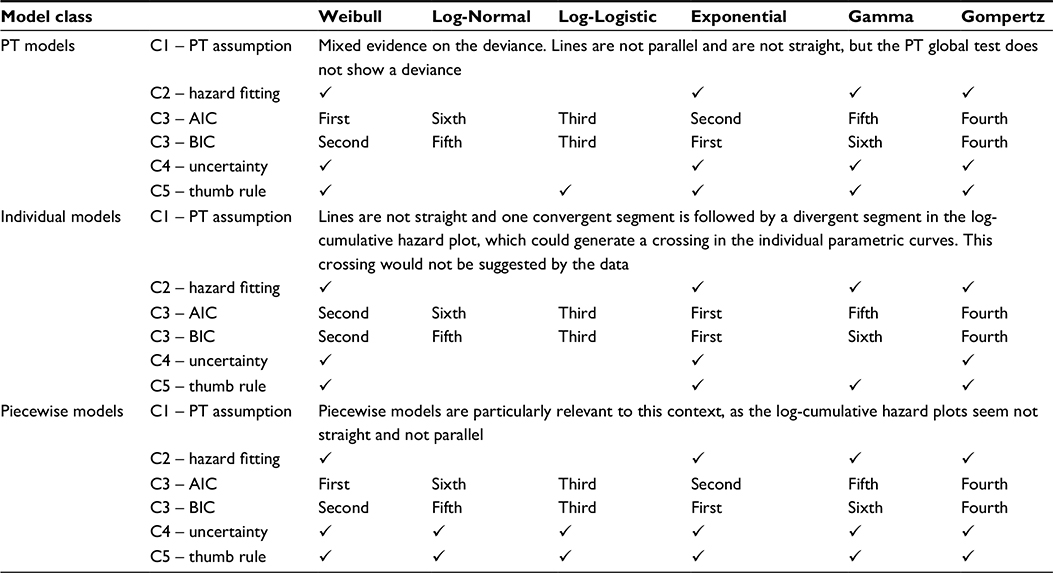 | Table 4 Evaluation of all the five criteria in the model selection framework for the extrapolation of survival data Abbrevations: AIC, Akaike information criterion; BIC, Bayesian information criterion; PT, proportional treatment. |
Extrapolation using the most appropriate model
The results indicate that a piecewise model appears to be the most appropriate for extrapolating the RPSFT-adjusted OS trial data. Deviance under the PT assumption is inconsistent, and data are unfavorable for Log-Normal and Log-Logistic distributions in all the evaluated model types.
The best fitting functional forms (in descending order of fit) were:
- Piecewise model: Exponential tail, Weibull tail, Gompertz tail, Gamma tail
- Parametric model: Exponential (PT model), Weibull (PT model), Gompertz (PT model), Gamma (AFT model)
- Individual model: Exponential, Weibull, Gompertz, Gamma
Figure 2 presents the extrapolation of the RPSFT-adjusted OS trial data, using the most appropriate model according to the results: a piecewise model: KM + an exponentially extrapolated tail.
 | Figure 2 OS extrapolation result, using a piecewise model. Abbrevation: OS, overall survival. |
Table 5 presents the summary statistics of pre- and post-cutoff OS using the restricted (120-month, 10-year) time-horizon. Of the three exponential model types (PT, individual, and KM + extrapolated tail), the KM + extrapolated tail provides the most conservative extrapolation estimate.
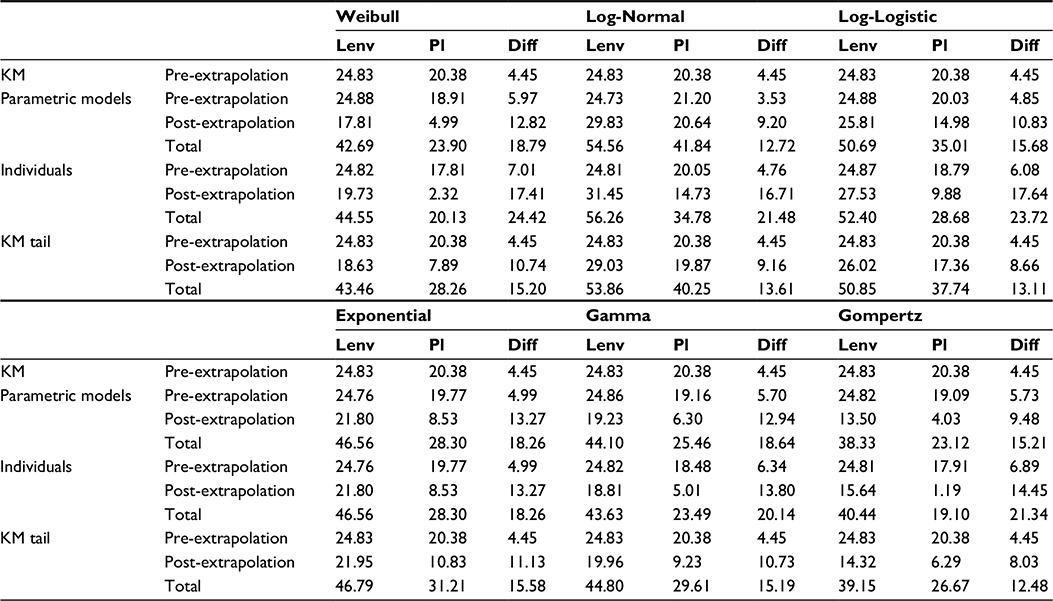 | Table 5 Summary statistics of pre- and post-cutoff OS (120-month time-horizon) – survival difference (months) Abbrevations: Diff, difference; KM, Kaplan–Meier; Lenv, lenvatinib; OS, overall survival; Pl, placebo. |
The total OS difference between lenvatinib and placebo ranged from 12.48 months to 15.58 months using the KM + extrapolated tail. The largest marginal survival gain was observed with an Exponential tail (15.58 months for lenvatinib) and the smallest with a Gompertz tail (12.48 months). The largest estimates of OS for both lenvatinib and placebo were provided by Log-Normal (53.86 and 40.25, respectively) and Log-Logistic tails (50.85 and 37.74 months, respectively). This further reinforced the judgment that distributions characterized with a long tail were unsuitable for extrapolating OS data in this context. The KM + Exponential and KM + Weibull extrapolations (the first and second best fitting forms) provided similar OS estimates with a 0.38-month difference between these extrapolations for total OS gain.
Using the KM + exponentially extrapolated tail, the benefit associated with lenvatinib, relative to placebo, was 4.45 months pre-extrapolation and estimated at 11.13 months postextrapolation – giving a total OS benefit of 15.58 months with lenvatinib treatment over the 120-month (10-year) time-horizon.
Discussion
OS is a key outcome in determining the efficacy of cancer therapies in clinical trial settings.19 An OS benefit can be difficult to demonstrate due to the limited duration of clinical trials and the potential confounding due to subsequent treatments that patients may receive.11 This was the case in the SELECT, in which ∼50% of patients remained alive at the 34-month data cutoff point, and 87.8% of patients originally randomized to receive placebo had switched over to lenvatinib following documented disease progression. The purpose of this analysis was to extrapolate OS data from the SELECT, in order to estimate the potential long-term benefits of lenvatinib for use in future cost-effectiveness evaluations. Our work is novel in that it uses a holistic approach in the selection of the most appropriate model for the long-term extrapolation of survival when a high percentage of individuals are still alive at the end of follow-up.
The extrapolation of OS data used an RPSFT model to correct for potential confounding due to crossover14 and followed a previously published, systematic method to determine the most suitable approach to extrapolate OS data.13 The use of this systematic method (involving five criteria)13 was considered a strength of this analysis. Testing of Criterion 1 regarding the PT assumption was inconclusive as the log-cumulative hazard OS plots from SELECT were relatively straight but not parallel, while the global test for a PT effect was not significant. While some researchers would not consider the evidence regarding the use of the PT assumption to be prohibitive, it is the opinion of the authors that, if using a PT assumption, proof should be presented that individual models and piecewise models (such as the KM model + extrapolated tail) are inferior. Piecewise models use the observed hazard from the clinical trial data by applying the KM survivor estimator over the trial period; thus, they can be superior to parametric models and individual models when their underlying assumptions are inappropriate. Therefore, a piecewise model (ie, KM + extrapolated tail) appeared to be a suitable alternative.
A potential limitation of this analysis is that OS for the placebo arm of the SELECT was obtained by fitting an RPSFT model. Although this approach can be used to correct for potential confounding due to the crossover design of the SELECT, a key assumption in RPSFT models is that the treatment is acting by multiplying survival time by a given factor once patients start receiving active treatment. Therefore, OS during the trial period was obtained by making use of the PT assumption; thus, rejecting the PT assumption on the grounds of the results of Criterion 1 alone may be inappropriate and inconsistent with the overall approach. If overall consistency were to be used as an additional criterion to select the most appropriate extrapolation technique, PT models should be considered as a legitimate option.
The AIC/BIC statistics support the use of the Exponential distribution in all cases, but it should be noted that the use of the AIC alone would have identified the Weibull distribution as the best fit to the empirical data under the PT assumption. Furthermore, as the AIC and BIC are not available for piecewise models, they are estimated via the fitting of the full parametric distributions, which are used as a proxy for the tail of the extrapolation. AIC and BIC only reflect a distribution’s goodness-of-fit in the presence of empirical data; they do not provide information regarding the appropriateness of the extrapolation. Log-Normal and Log-Logistic curves, irrespective of their AIC/BIC, were excluded a priori under Criterion 3, due to the high risk of a long tail. The ranking of models and distributions was confirmed under the remaining criteria (4 and 5). There is very little difference between the AIC statistics for the first three best “fitting” distributions. Consideration as to which distribution provides the best extrapolation of the data, using the AIC in isolation could lead to an analyst choosing the Log-Logistic. However, the results of Criterion 5 would suggest that the use of the Log-Logistic distribution could lead to an unrealistic marginal gain in mean survival.
The consideration of all five criteria offers a more holistic approach in the selection of the most appropriate model. The analysis determined that a piecewise model was the most suitable for extrapolation of the SELECT OS data. The framework used in the current analysis should be considered as an informed guide to model selection, rather than definitive. Had judgments been based solely on a statistical test of proportionality or the commonly used AIC, a different decision would have been made regarding the appropriate extrapolation of OS data from SELECT.
RR-DTC is a chronic condition, requiring long-term data for the robust assessment of benefits of treatment. With longer time-horizons, however, extrapolations are subject to increased uncertainties, such as the potential bias in the expectation of the survival gain. Therefore, a 10-year horizon was chosen in an attempt to balance the uncertainty inherent in any extrapolation (unacceptably high uncertainties as with a lifetime extrapolation), and the need to reflect all relevant differences in benefit (in contrast to the raw trial data alone).
The extrapolation of OS data from SELECT could be valuable in both clinical and economic analyses comparing lenvatinib with other treatments for RR-DTC in the future.
Conclusion
In order to fully capture the benefits of a therapy, it is often necessary to extrapolate survival data to a sufficient time point. The use of a transparent, systematic approach with an a priori selection process is required to facilitate the choice of an extrapolation method while reducing the risk of bias. Although it is tempting to present an extrapolation method that demonstrates the greatest marginal benefits, an appropriate approach should be conservative and fulfill the selection criteria. For the extrapolation of the RPSFT-adjusted OS data in SELECT, a piecewise model was considered the optimal, where the KM survivor function was used for the period of the trial data and the extrapolated tail was modeled using an Exponential distribution. The results presented here should not be considered definitive and should be used alongside expert clinical opinion to inform a final decision; nonetheless, they offer a valuable insight into extrapolation approaches for future comparative analyses.
Acknowledgments
This analysis and publication were funded by Eisai Inc. We thank Brigitte Moore (DRG Abacus) for help with the preparation of the manuscript.
Disclosure
GT is an employee of Eisai Inc. AB received an honorarium for his validation of the analysis. There are no other conflicts of interest in this work.
References
Durante C, Haddy N, Baudin E, et al. Long-term outcome of 444 patients with distant metastases from papillary and follicular thyroid carcinoma: benefits and limits of radioiodine therapy. J Clin Endocrinol Metab. 2006;91(8):2892–2899. | ||
Brose MS, Smit J, Capdevila J, et al. Regional approaches to the management of patients with advanced, radioactive iodine-refractory differentiated thyroid carcinoma. Expert Rev Anticancer Ther. 2012;12(9):1137–1147. | ||
Robbins RJ, Wan Q, Grewal RK, et al. Real-time prognosis for metastatic thyroid carcinoma based on 2-[18F]fluoro-2-deoxy-D-glucose-positron emission tomography scanning. J Clin Endocrinol Metab. 2006;91(2):498–505. | ||
Busaidy NL, Cabanillas ME. Differentiated thyroid cancer: management of patients with radioiodine nonresponsive disease. J Thyroid Res. 2012;2012:618985. | ||
Pittas AG, Adler M, Fazzari M, et al. Bone metastases from thyroid carcinoma: clinical characteristics and prognostic variables in one hundred forty-six patients. Thyroid. 2000;10(3):261–268. | ||
Wang W, Larson SM, Fazzari M, et al. Prognostic value of [18F]fluorodeoxyglucose positron emission tomographic scanning in patients with thyroid cancer. J Clin Endocrinol Metab. 2000;85(3):1107–1113. | ||
Goyal A, Gupta R, Mehmood S, Deo S, Mishra S, Bhatnagar S. Palliative and end of life care issues of carcinoma thyroid patient. Indian J Palliat Care. 2012;18(2):134–137. | ||
Greenblatt DY, Chen H. Palliation of advanced thyroid malignancies. Surg Oncol. 2007;16(4):237–247. | ||
Anderson RT, Linnehan JE, Tongbram V, Keating K, Wirth LJ. Clinical, safety, and economic evidence in radioactive iodine-refractory differentiated thyroid cancer: a systematic literature review. Thyroid. 2013;23(4):392–407. | ||
Eisai Ltd [webpage on the Internet]. Lenvima. Summary of Product Characteristics; 2015. Available from: https://www.medicines.org.uk/emc/medicine/30412. Accessed July 13, 2015. | ||
Schlumberger M, Tahara M, Wirth LJ, et al. Lenvatinib versus placebo in radioiodine-refractory thyroid cancer. N Engl J Med. 2015;372(7):621–630. | ||
Guo M, Sherman SI, Wirth LJ, et al. Overall survival gain with lenvatinib vs. placebo in radioactive iodine refractory differentiated thyroid cancer (RR-DTC): an updated analysis. Euro J Cancer. 2015;51(9)Suppl 3:S559. | ||
Tremblay G, Haines P, Briggs A. A criterion-based approach for the systematic and transparent extrapolation of clinical trial survival data. JHEOR. 2015;2(2):147–160. | ||
Latimer NR, Abrams KR [webpage on the Internet]. Decision Support Unit. NICE DSU Technical Support Document 16: Adjusting Survival Time Estimates in the Presence of Treatment Switching. Available from: http://www.nicedsu.org.uk/TSD16_Treatment_Switching.pdf. Accessed July 13, 2015. | ||
Efron B, Tibshirani R. An Introduction to the Bootstrap. London: Chapman & Hall/CRC; 1993. | ||
Allison PD. Event History and Survival Analysis. 2nd ed. Newbury Park,CA: Sage; 2014. | ||
Royston P, Parmar MK. Flexible parametric proportional-hazards and proportional-odds models for censored survival data, with application to prognostic modelling and estimation of treatment effects. Stat Med. 2002;21(15):2175–2197. | ||
Schoenfeld S. Partial residuals for the proportional hazards regression model. Biometrika. 1981;69(1):239–241. | ||
Driscoll JJ, Rixe O. Overall survival: still the gold standard: why overall survival remains the definitive end point in cancer clinical trials. Cancer J.2009;15(5):401–405. |
Supplementary materials
 | Figure S1 Log-cumulative hazard plots for OS comparing observed (KM) with fitted estimates obtained from PT models. Abbrevations: KM, Kaplan–Meier; OS, overall survival; PT, proportional treatment. |
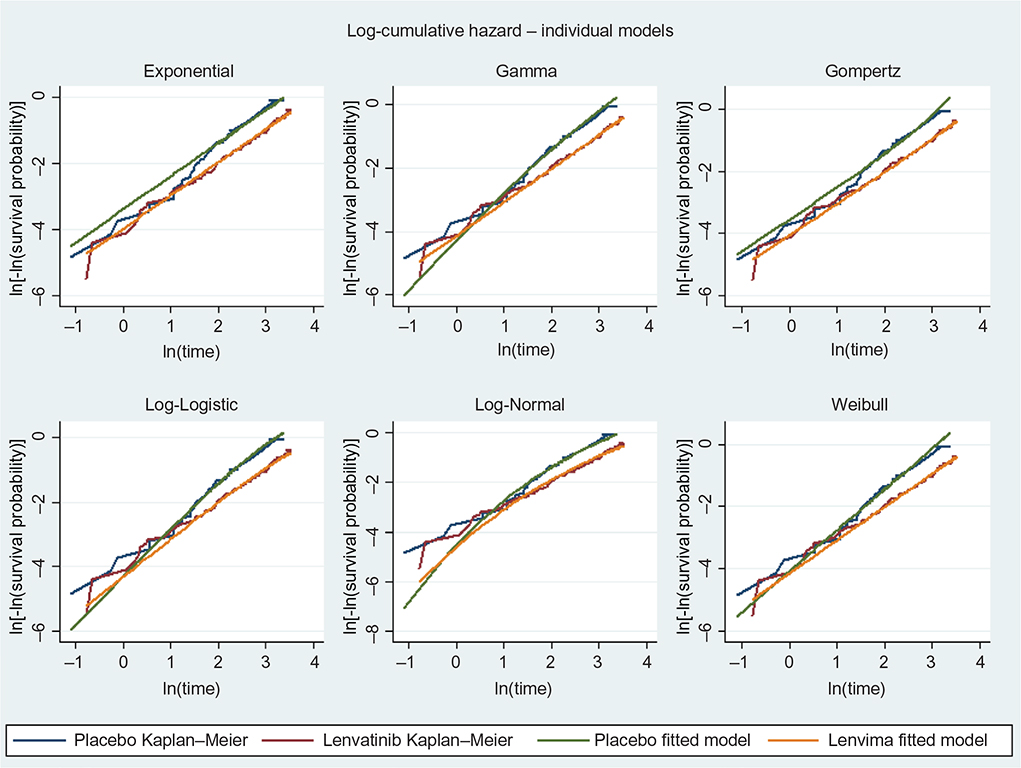 | Figure S2 Log-cumulative hazard plots for OS comparing observed (KM) with fitted estimates obtained from individual models. Abbrevations: KM, Kaplan–Meier; OS, overall survival. |
 © 2016 The Author(s). This work is published and licensed by Dove Medical Press Limited. The full terms of this license are available at https://www.dovepress.com/terms.php and incorporate the Creative Commons Attribution - Non Commercial (unported, v3.0) License.
By accessing the work you hereby accept the Terms. Non-commercial uses of the work are permitted without any further permission from Dove Medical Press Limited, provided the work is properly attributed. For permission for commercial use of this work, please see paragraphs 4.2 and 5 of our Terms.
© 2016 The Author(s). This work is published and licensed by Dove Medical Press Limited. The full terms of this license are available at https://www.dovepress.com/terms.php and incorporate the Creative Commons Attribution - Non Commercial (unported, v3.0) License.
By accessing the work you hereby accept the Terms. Non-commercial uses of the work are permitted without any further permission from Dove Medical Press Limited, provided the work is properly attributed. For permission for commercial use of this work, please see paragraphs 4.2 and 5 of our Terms.