")
Back to Journals » International Journal of General Medicine » Volume 15
Determinants of Longitudinal Measure Pulse Rate of Chronic Heart Failure Patients at Felege Hiwot Referral Hospital, Ethiopia: A Longitudinal Modeling Data Analysis
Authors Abebaw Moyehodie Y , Wale Muluneh M
Received 10 January 2022
Accepted for publication 16 March 2022
Published 29 March 2022 Volume 2022:15 Pages 3483—3496
DOI https://doi.org/10.2147/IJGM.S355377
Checked for plagiarism Yes
Review by Single anonymous peer review
Peer reviewer comments 2
Editor who approved publication: Dr Scott Fraser
Yikeber Abebaw Moyehodie, Mitiku Wale Muluneh
Department of Statistics, Debre Tabor University, Debre Tabor, Ethiopia
Correspondence: Yikeber Abebaw Moyehodie, Department of Statistics, Debre Tabor University, Debre Tabor, Ethiopia, Email [email protected]
Background: Heart rate is a significant modifiable factor in lowering mortality in heart failure patients. The heart rate, often known as the pulse rate, is the number of times the heart beats in a given amount of time. Irregular pulse rate or heart block are all measured using heart rate data. A higher heart rate has been associated with worse clinical outcomes. The main purpose of this study was to identify factors associated with the longitudinal pulse rate of congestive heart failure patients.
Methods: Hospital-based retrospective studies were conducted among 249 congestive heart failure patients who were 18 years old or older and who were on treatment follow-up from first February 2016 to thirty-one December 2017 in Felege Hiwot Referral Hospital, Bahir Dar, Ethiopia.
Results: Data were explored using descriptive statistics, individual and mean profile plots, and analyzed using linear mixed models. Out of the total 249 patients, 139 (55.8%) were females. The majority 179 (71.9%) of the CHF patients were rural residents. 65 (26.1%) patients had Hypertension, 30 (12.5%) patients had Diabetes Mellitus, 58 (23.3%) patients had Pneumonia. Thus age, LVEF, follow-up time in a month had a negative significant effect whereas NYHA class, male gender, pneumonia had a positive significant effect on the average evaluation of pulse rate of patients. The time interaction effect of NYHA Class (Time* NYHA Class), and LVEF (Time*LVEF) had a significant effect on average pulse rate evolution.
Conclusion: The variables age, LVEF, and follow-up time were negatively associated whereas, male gender, NYHA class, and presence of pneumonia were positively associated with the progression change of pulse rate of patients rate of progression of pulse rate decreases over time. Furthermore, health professionals give more attention to patients who are NYHA class IV, had low LVEF, pneumonic patients to reduce pulse rate during the follow-up time.
Keywords: pulse rate, chronic heart failure, longitudinal analysis, linear mixed model
Introduction
Heart rate (HR) is a significant modifiable factor in lowering mortality in heart failure patients.1 The heart rate, often known as the pulse rate, is the number of times the heart beats in a given amount of time. Irregular pulse rate or heart block are all measured using heart rate data.2 A higher heart rate has been associated with worse clinical outcomes, higher heart rate has been associated with worse particularly in individuals with existing cardiovascular disease.3 Elevated HR is indicative of poor outcomes.4
Chronic heart failure (CHF) is a multi-symptom illness that can develop as a result of any structural or functional cardiac problem. It’s a common clinical syndrome that develops as a result of any structural or functional cardiac disease that reduces the heart’s ability to pump blood.5 It is a chronic condition that develops over time in which one or both ventricles cannot pump sufficient blood to meet the metabolic needs of the body. In some cases, the heart cannot fill with enough blood (systolic heart failure); in other cases, the heart cannot pump blood to the rest of the body with enough force (diastolic heart failure).6
Heart failure remains a serious clinical and public health problem as the total number of patients living with heart failure is increasing. Worldwide, on average 64.3 million individuals were having heart failure. In developed countries, the prevalence of heart failure is generally estimated at 1% to 2% of the general population.7 Preventable Causes of heart failure, such as rheumatic heart disease and hypertension, disproportionately impact low-income countries. However, most heart failure patients find it difficult and problematic to receive the necessary treatment due to financial constraints.7,8
In Africa, around 3% to 7% of individuals admitted to hospitals suffer heart failure.9 CHF is one of the biggest public health challenges in Sub-Saharan Africa (SSA), and it is linked to high morbidity and mortality, high rates of recurrent hospitalization, poor quality of life, and economic productivity loss because it primarily affects young and economically active adults.8 Although evidence on frequency and incidence in the region is scarce, the known causes include hypertension, cardiomyopathies, rheumatic heart disease, as well as ischemic heart disease in rare cases.10 Most patients with CHF in SSA find it difficult to afford the basic treatment because of financial constraints. As a result, maintaining frequent follow-up visits is difficult for them, resulting in premature deaths.8 According to WHO, CHF is responsible for about 9% of all fatalities in Ethiopia.11
Despite improvements in treatment, CHF is attributed to several negative clinical outcomes and is one of the leading causes of healthcare utilization.12 CHF has a high burden of risk factors and comorbidities, which is increasing every year.7 The majority of researchers used a cross-sectional study and patient survival time following admission to a CHF clinic to perform their research on heart failure patients. However, the clinical variable pulse rate of a patient was treated as fixed in those researches. Pulse rate, on the other hand, is monitored throughout time and is not constant. For chronic heart failure patients, time-updated heart rate is more strongly related to adverse cardiovascular outcomes than baseline heart rate. Heart rate should be measured to assess CHF risk at all assessments of patients at any follow-up time. Due to the presence of correlated nature of observations in the repeated measurements, the linear mixed model takes into account change over time and can identify variability (within and between) subjects, due to this reason this study is considered longitudinal data analysis. In medical science studies, a response of interest is observed on each subject repeatedly over time, which is a longitudinal study. However, in cross-sectional studies, the response of interest is measured only once for each individual. Longitudinal studies are used for the investigation of individual changes over time.13 Having this statement of the problem and using the candidate model, we mainly aimed to identify factors that affect longitudinal measure pulse rate of chronic heart failure patients at Felege Hiwot Referral Hospital.
Materials and Methods
Study Design, Period, and Setting
This study was carried out using a retrospective cohort study design based on data obtained at the FHRH Outpatient Department during the follow-up time of 1st February 2016 to thirty-one December 2017 from Felege Hiwot Referral Hospital, Bahir-Dar, Amhara, Ethiopia. Felege Hiwot referral Hospital found in Northwest of Ethiopia. It is 578 kilometers away from Addis Ababa, the capital city of Ethiopia. It is a tertiary referral and teaching hospital with 400 beds and around 15 adult outpatient departments that serve over 7 million people in the surrounding area.
Source Population, Study Population, and Source of Data
In this study, we used a secondary source of data. The data extracted from patients’ charts, which contains epidemiological, laboratory, and clinical information of all CHF patients under follow-up including a detailed heart failure history and socio-demographic variables. The study population included patients whose age was 18 years old and above attending at least for 8 months (a minimum of two follow-up visits) for refilling their prescription, and who are initiated on treatment during the study period. The data was collected by health care service providers of CHF clinics. Ethical clearance was obtained from the ethical review committee of the Debre Tabor University.
Study Variables
The response (outcome) variables considered for this study were the longitudinal pulse rate - the number of heartbeats per minute measured every 4 months irrespective of their visit to CHF patient Clinic.
The predictor variables associated with repeated measure pulse rate among CHF patients are either socio-demographic variables or clinical variables. The predictor variables were used in this study were Gender, Residence, Age, Observation time, Etiology, New York Heart Association of CHF patients (NYHA class), left ventricle ejection fraction (LVEF), Weight, Presence of Diabetes Mellitus, Presence of Hypertension, Presence of Pneumonia, Presence of Chronic Kidney Disease, Presence of anemia.
Data Processing and Analysis
Data management had been done by SPSS, R, and SAS statistical software. SPSS version 25.0 had been used for data entering. The statistical analysis was performed using R version 4.0.3 and SAS 9.4. Descriptive statistics were used to explain the baseline characteristics. A Linear mixed model was used to examine the relationships between the dependent (longitudinal measure pulse rate) and independent variables. In univariate analysis, all significant factors were considered candidate variables for multivariable analysis. All of the findings were interpreted with a 5% level of significance and a 95% level of confidence.
Missing Data Treatment
Multiple imputations are the popular method for handling missing values of our data. It replaces each missing item with five or more acceptable values, representing a distribution of possibilities.14 The advantage of the method is that once the imputed data set has been generated, the analysis can be carried out using procedures in virtually any statistical package, which makes the analysis simple.
Ethical Considerations
The data used in this study was previously obtained by medical personnel for the goal of treating/diagnosing heart failure and initiating follow-up care. The study was conducted according to the guidelines of the Declaration of Helsinki and approved by the Ethical Approval Committee of facility of natural and computational science, Debre Tabor University, Ethiopia, with reference number RCS/121/2019, was received to use this previously gathered data.
Results
Sample Characteristics
The data consists of 249 congestive heart failure patients treated under CHF treatment follow- up in a two-year study period at Felege Hiwot Referral Hospital (FHRH), Bahir Dar, Amhara, North Western Ethiopia.
In this study, the response variable was pulse rate measured per minute of CHF patients, which were measured approximately every 4 months; at the study entry, and again at the 4, 8, 12, 16, 20, and 24-month visits. Even if the appointment of patients is every 4 months the patient may come to follow up before this appointment time when the severity of the disease increases. However, since the appointment of patients is every 4 months we used approximately every 4 months to follow up measures of pulse rate.
Three continuous baseline covariates and nine categorical covariates were included in the analysis. Table 1 shows the result of characteristics of categorical predictor variables of CHF patients. Out of the total 249 patients, 139 (55.8%) were females and the remaining 110 (44.2%) were males. The majority 179 (71.9%) of the CHF patients were rural residents. For the reason that HF is not a disease by itself patients with HF have other causes, we observe that from etiology (cause) of heart failure for patients 86 (34.5%) were by VHD, 37 (14.9%) were by HHD, 29 (11.6%) were by Cor-pulmonale, 54 (20.5%) were by Dilated Cardiomyopathy and the remaining 46 (18.5%) of patients were by unknown etiology. When we observed the New York Heart Association class of CHF patients 44 (17.7%) of them were NYHA class II, 88 (35.3%) were class III, 117 (47.0%) were class IV. Furthermore from the co-morbidities of heart failure patients, 65 (26.1%) were had Hypertension, 30 (12.5%) were with Diabetes Mellitus, 58 (23.3%) were with Pneumonia, 39 (15.7%) were with Coronary Kidney Disease and 29 (23.7%) were had Anemia (Table 1).
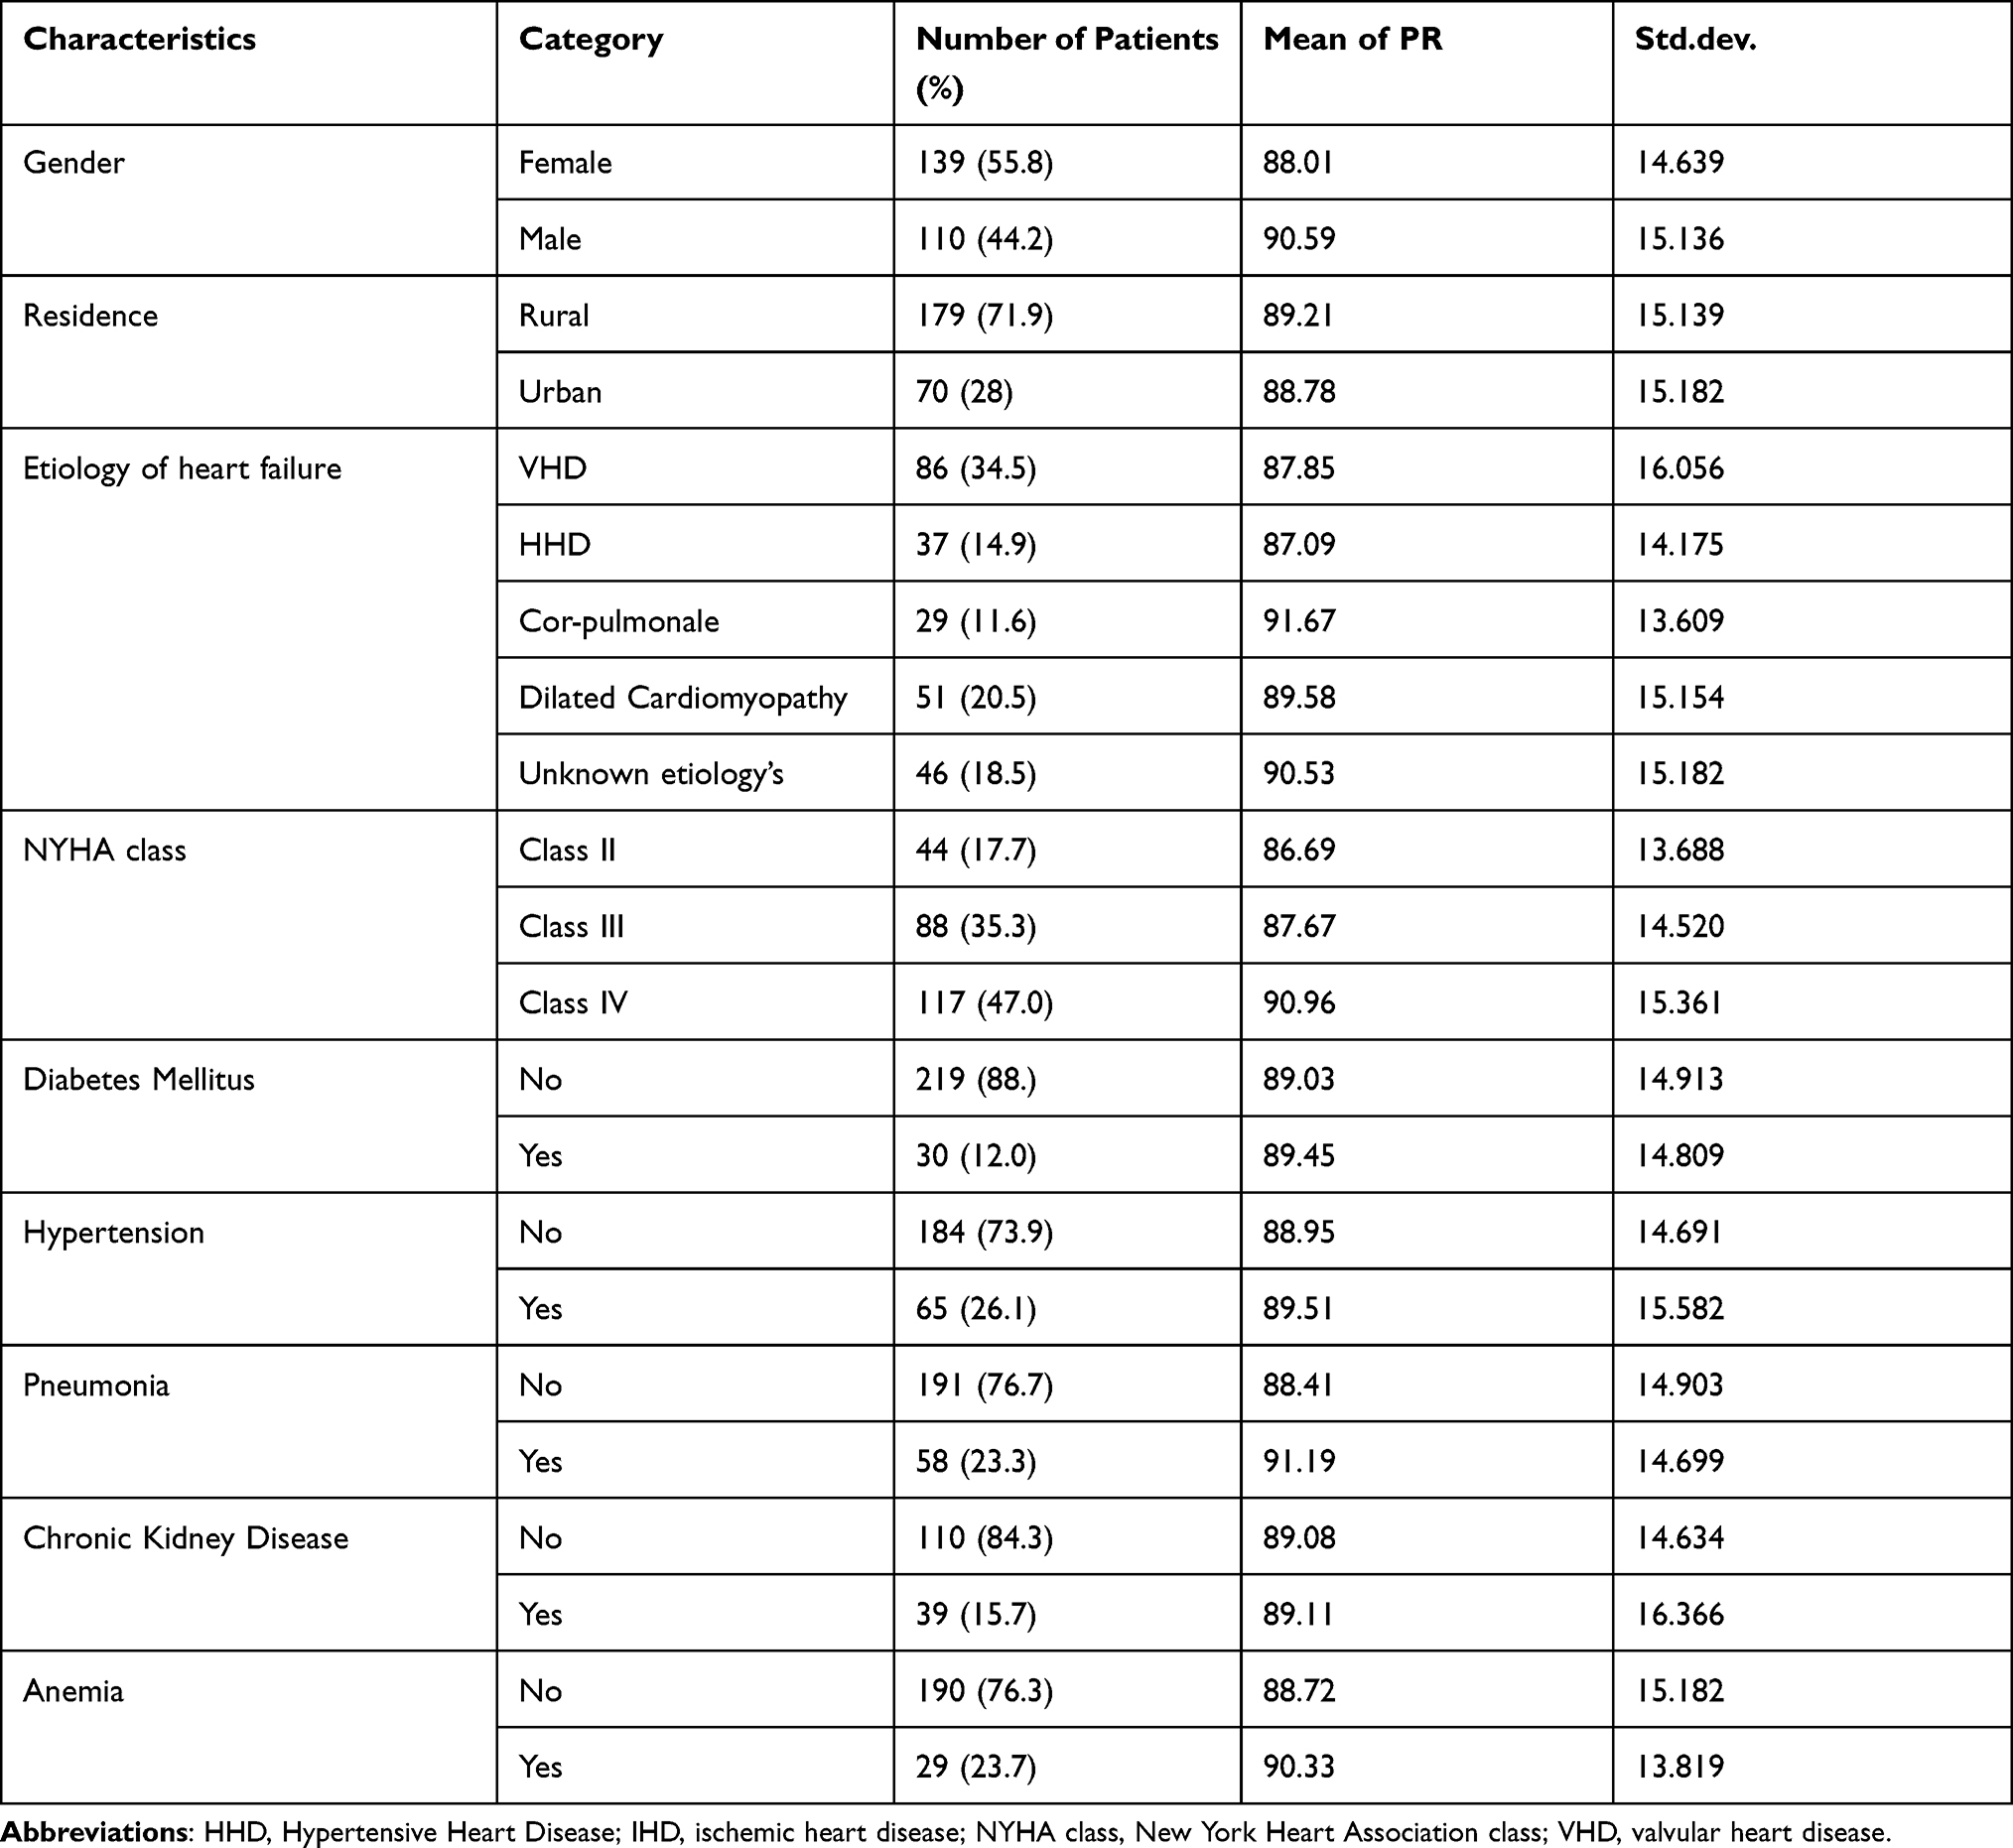 |
Table 1 Results of Descriptive Measures of Categorical Variables of CHF Patient’s Data Taken at FHRH from 2016–2018 |
Table 2 displays baseline characteristics of baseline PR and continuous variable age, weight, and LVEF of CHF patients. The mean with a corresponding standard deviation of baseline PR, baseline age, weight, and Left Ventricular Ejection Fraction of patients were 92.98± 16.444, 47.41±19.474 years, 56.57±8.559 kilogram, and 51.15±14.852%, which means that averagely 51.15% of the blood in the left ventricle is pushed out with each heartbeat respectively (Table 2).
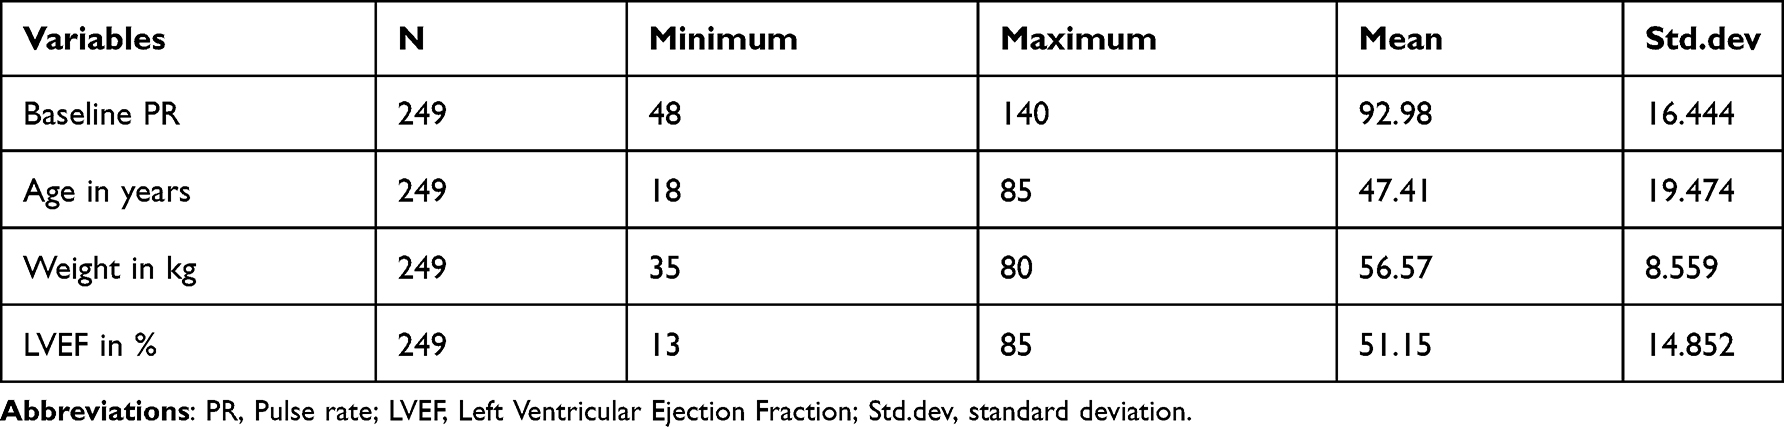 |
Table 2 Baseline Characteristics of Continuous Variable of CHF Patient’s Data Taken at FHRH from 2016–2018 |
Normality Assumption Checking for Pulse Rate
Before any data analysis, the assumptions of the data must be checked and hence the Q-Q plots, histogram, and formal test were used to check the normality of the longitudinal measures PR.
Figure 1 depicted the Q-Q plot for actual pulse rate data, which showed that the actual pulse rate data seems to satisfy the assumption of normality as the points fall close to the line.
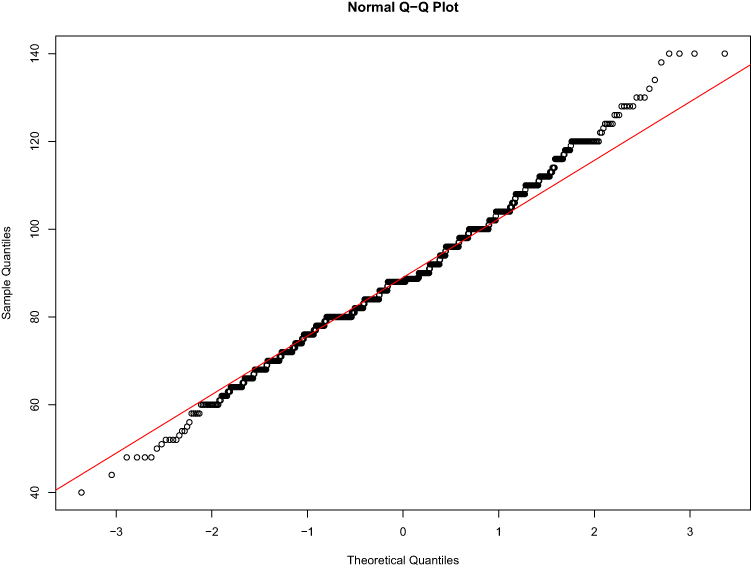 |
Figure 1 Q-Q plots for the actual pulse rate of CHF patients. |
Figure 2 shows a histogram with a normal curve plot of PR data. We can see that the actual pulse rate data has attained normality (Figure 2). This also coincides with the formal approach normality test (Table 3) Shapiro–Wilk test of pulse rate at each measurement time. There is significant evidence of normality since the statistical value is close to one and the p-value is greater than 0.05%. Thus, the analysis of this study uses the original pulse rate data (Table 3).
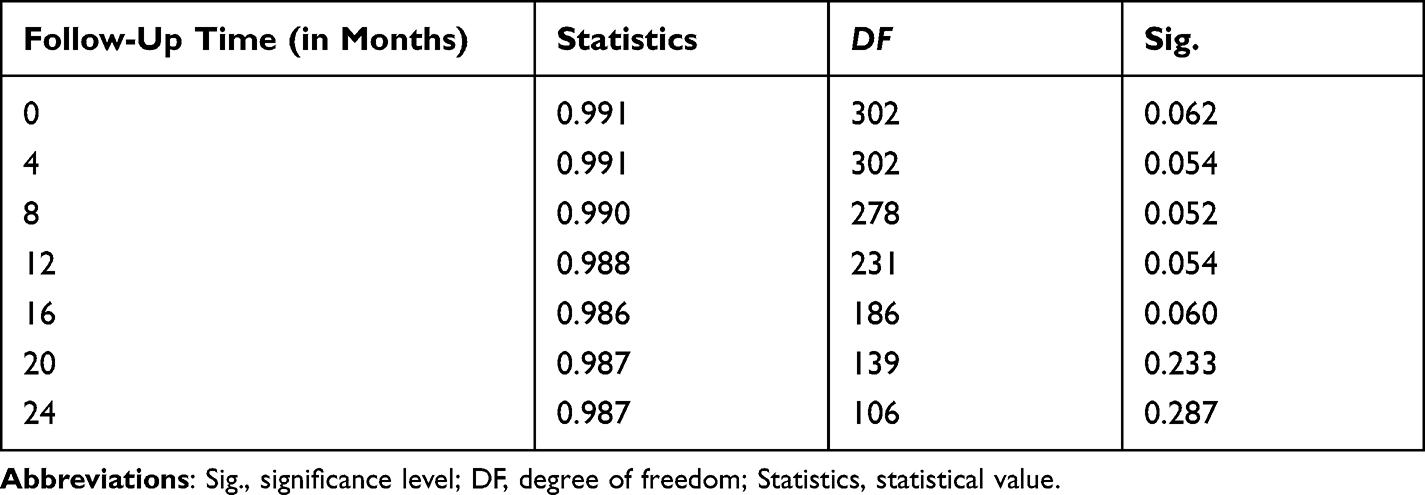 |
Table 3 Shapiro–Wilk Tests of Normality Assumption for CHF Patients Data at FHRH |
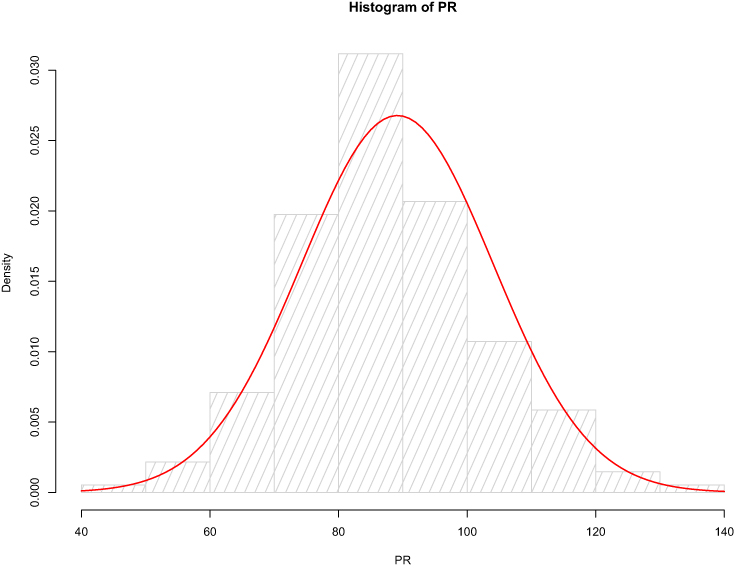 |
Figure 2 Histogram plot of PR with normal curves for CHF patients’ data at FHRH. |
Exploratory Data Analysis (EDA)
Exploratory data analysis was conducted to investigate various associations, structures, and patterns exhibited in the data set. This includes the individual profile plots and mean structure plots.
The individual profiles plot (Figure 3) visualizes the pattern change of the overall individual plots pulse rate measurements of patients over time. It demonstrates the variability (within and between patients) in pulse rate measurements of CHF patients. It indicates the need for random intercept, patients started differently at different baseline pulse rates. In addition to random intercept, there is also a need for random slope to allow subjects to have different slopes and account for the instability between-subject variability at different time points.
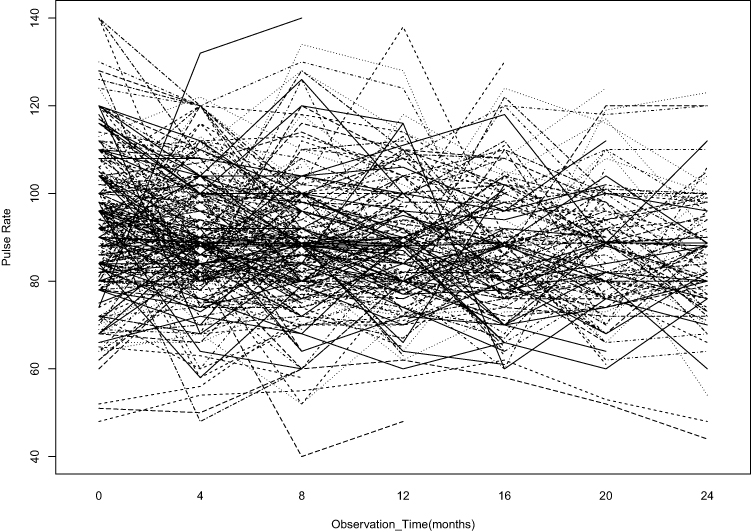 |
Figure 3 Individual profile plot for CHF patients under follow-up. |
Exploring the Mean Structure
We explore the mean plot of pulse rate over time to describe the longitudinal change in pulse rate measures of CHF patients. Figure 4 revealed that there seems to be a slight decrease in the average pulse rate of patients at follow-up time. As depicted in the figure below, the sample sizes at each seven follow-up times were (249, 249, 235, 195, 158, 120, and 90) respectively. There is a sharply increasing degree of missing data over time. It may be due to recovery, deaths, dropouts, missed clinic visits, or transferring to another hospital. Although observations are removed when a value is missing, each observation represents just one of many responses within an individual, so the removal of a single observation has a much smaller effect in the mixed-modeling analysis.15 Therefore, to handle these missing data multiple imputation methods of missing data treatment were used and allayed by using linear mixed model analysis (Figure 4).
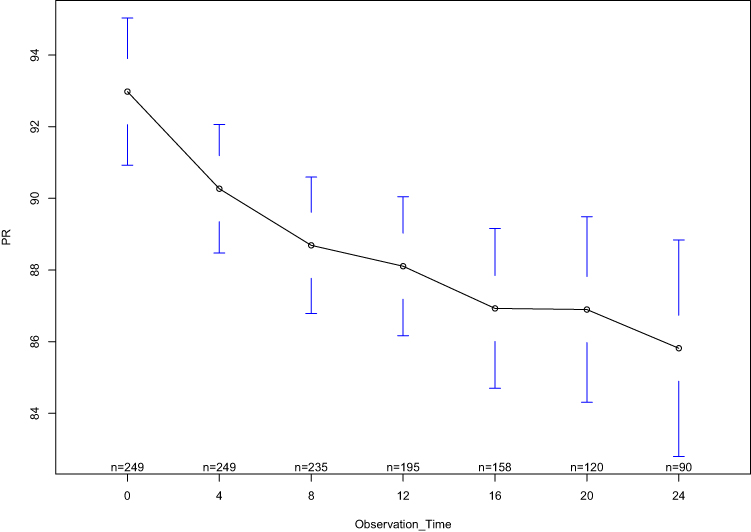 |
Figure 4 Mean profile plot of the pulse rate of CHF patients. Note: In addition to mean value of PR in each follow-up time, in each follow-up time the blue color shows the third quartile, and first quartile of PR. |
The individual profile plot of longitudinal pulse rate by different subgroups was also displayed. As we see from Figure 5, the mean profile shows the average PR of male Patients higher than female patients through time. There is high variability in the evolution of PR between male and female patients between 16 to 20 months of follow-up (Figure 5).
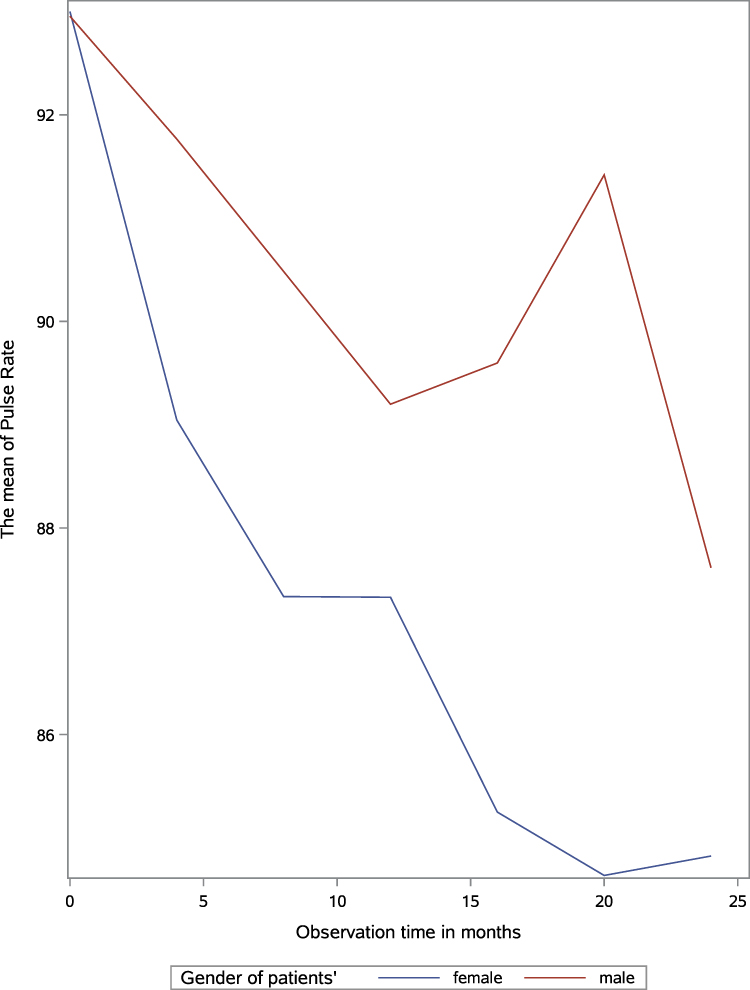 |
Figure 5 The mean profile plot of pulse rate by gender for CHF patient’s data under follow-up. |
There may be no significant effect between gender and time on the evolution of PR over time. From the three NYHA class subgroups, there seems to be a difference between NYHA class subgroups at baseline since the average evaluation of PR for NYHA class IV patients seems to have more pulse rate count per minute compared to NYHA class III and NYHA class II patients. There is also a pulse rate difference between subgroups through follow-up time. This difference may indicate a time by NYHA class interaction (Figure 6).
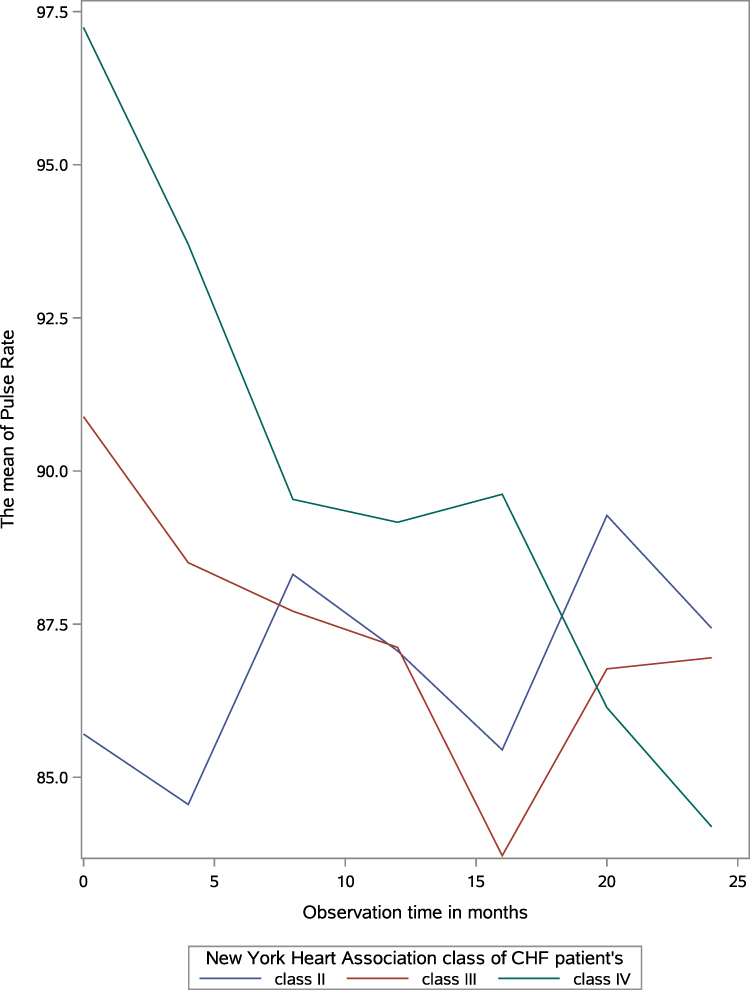 |
Figure 6 The mean profile plot of pulse rate by NYHA class for CHF patient’s data under follow-up. |
These plotted mean profiles by subgroups of covariates also indicate a linearly decreasing pattern, which rationalizes the use of a linear mixed model with random intercept and linear slope to analyze the trajectory of PR count per minute.
Following the observations in the exploratory data analysis, good models that best describe the observed average trends, and reflect the observed correlation structures were sought for the data sets. From the possible covariance structures in fitting the linear mixed model based on the maximum likelihood (ML) and restricted maximum likelihood (REML) covariance parameter estimation the minimum AIC and BIC values are preferred and become the covariance structure and used to model the residual error. The covariance structure, which has the smallest Values of AIC (10296.5) and BIC (10395.0), is unstructured. Table 4 suggests that the unstructured covariance structure with random intercept and slope model best fits the data compared to the remaining covariance structures (Table 4).
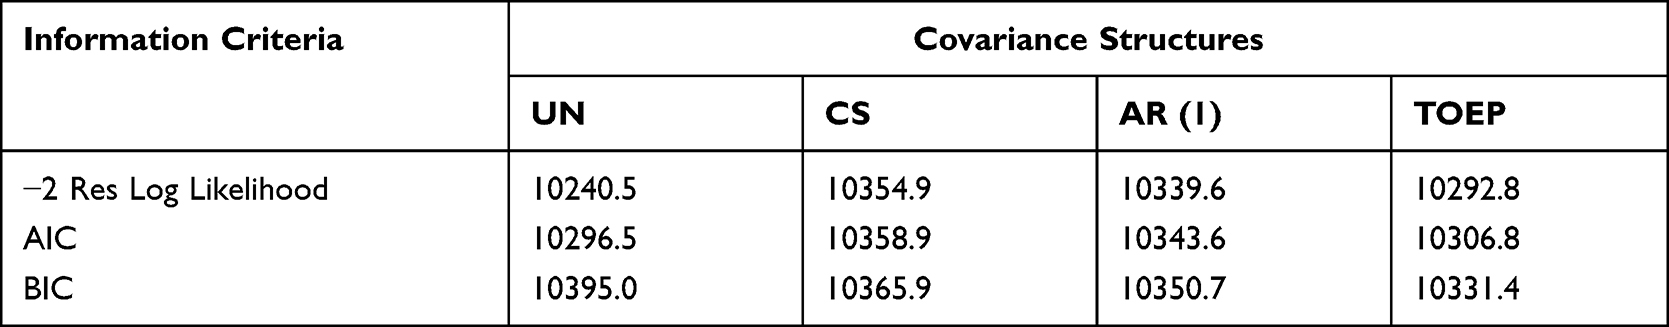 |
Table 4 Comparison of Variance-Covariance Structure for Linear Mixed-Effects Model |
In longitudinal data analysis, which random effect shall be included in the model to account for individual variability is also a critical and basic issue. To select the most appropriate random effect model several hierarchical or subject-specific models for studying longitudinal evolution are illustrated and compared. The summary of the linear mixed-effect model which was modeled by considering different random effects (random intercept, random slope, random Intercept and slope) is shown in Table 5. Hence, we consider model 3 (the model with random intercept, and linear time slope) as the most parsimonious model based on its lower values of AIC (10330.88) and BIC (10392.81) (Table 5).
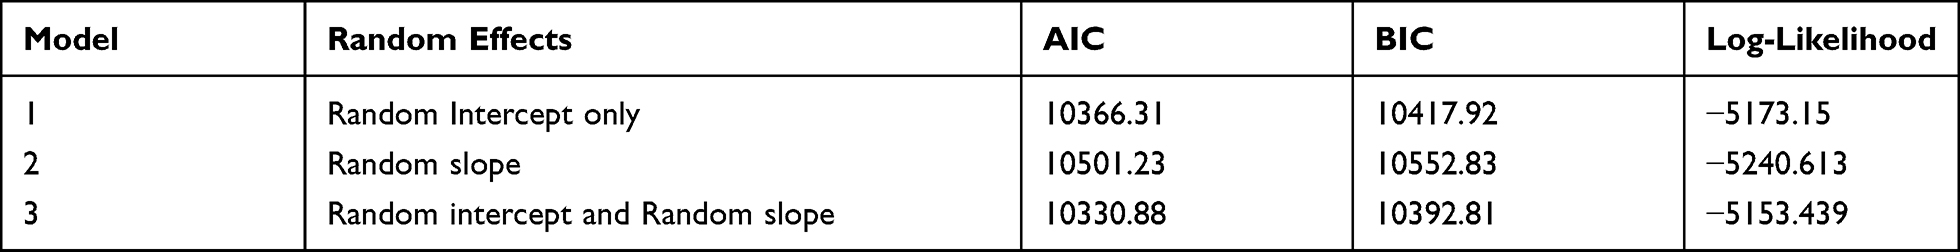 |
Table 5 Selection of Random Effects to Be Included in the Linear Mixed-Effects Model |
The model-building process was carried out by selecting covariates that have the potential effect on the response variable. In this study, model building starts from a single covariate analysis approach of first doing a single covariate analysis to screen out potentially significant variables for consideration in the multivariable model to identify the importance of each predictor. Hence, passing through procedures, the model that included the covariates follow up time in a month, age, gender, pneumonia, NYHA class, LVEF, Time *LVEF, and time*NYHA Class with subject-specific random intercept and the random slope was considered for the final fitted linear mixed model.
All the eight predictors including time interaction with LVEF, and NYHA Class of patients in the model were statistically significant at a 0.05 level of significance. The estimate of average PR at intercept (time=0) and excluding all covariates in the model is 97.5255 (P-value <0.0001). Observation (follow-up) time was negatively associated with the average PR of patients, which means if patients were to repeatedly follow up the treatments in the hospital the average pulse rate would decrease by 0.2871 (P<0.0001).
The time interaction effect of NYHA Class (time* NYHA Class), and LVEF (time*LVEF) were significant. The interaction effect of the NYHA class by the time had a significant progression change on patients’ pulse rate. That is, patients with NYHA class III by visit time, and class IV by time interaction decreased the progression change of pulse rate by 69.5% and 46.52% respectively, as compared to patients with NYHA class II by time interaction. LVEF by time interaction has a significant progression change on the pulse rate of patients such that increasing the LVEF by a visit time interaction had increasing progression change by 0.78%by controlling the other covariates.
The random effect component (Table 6) shows how the ith subject’s pulse rate evolution differs from the population’s average evolution. The estimate for the intercept shows us how much the intercepts differ across subjects, and the estimate for time tells us how much the slopes for time differ between subjects. The covariance estimate between the intercept and time indicates how the slopes of time are affected by changes in the intercepts. The variances and covariance of the random effects are considerably different from zero, according to the findings. This means that baseline pulse rate values differ from subject to subject, and the change in pulse rate over time differs as well (Table 6).
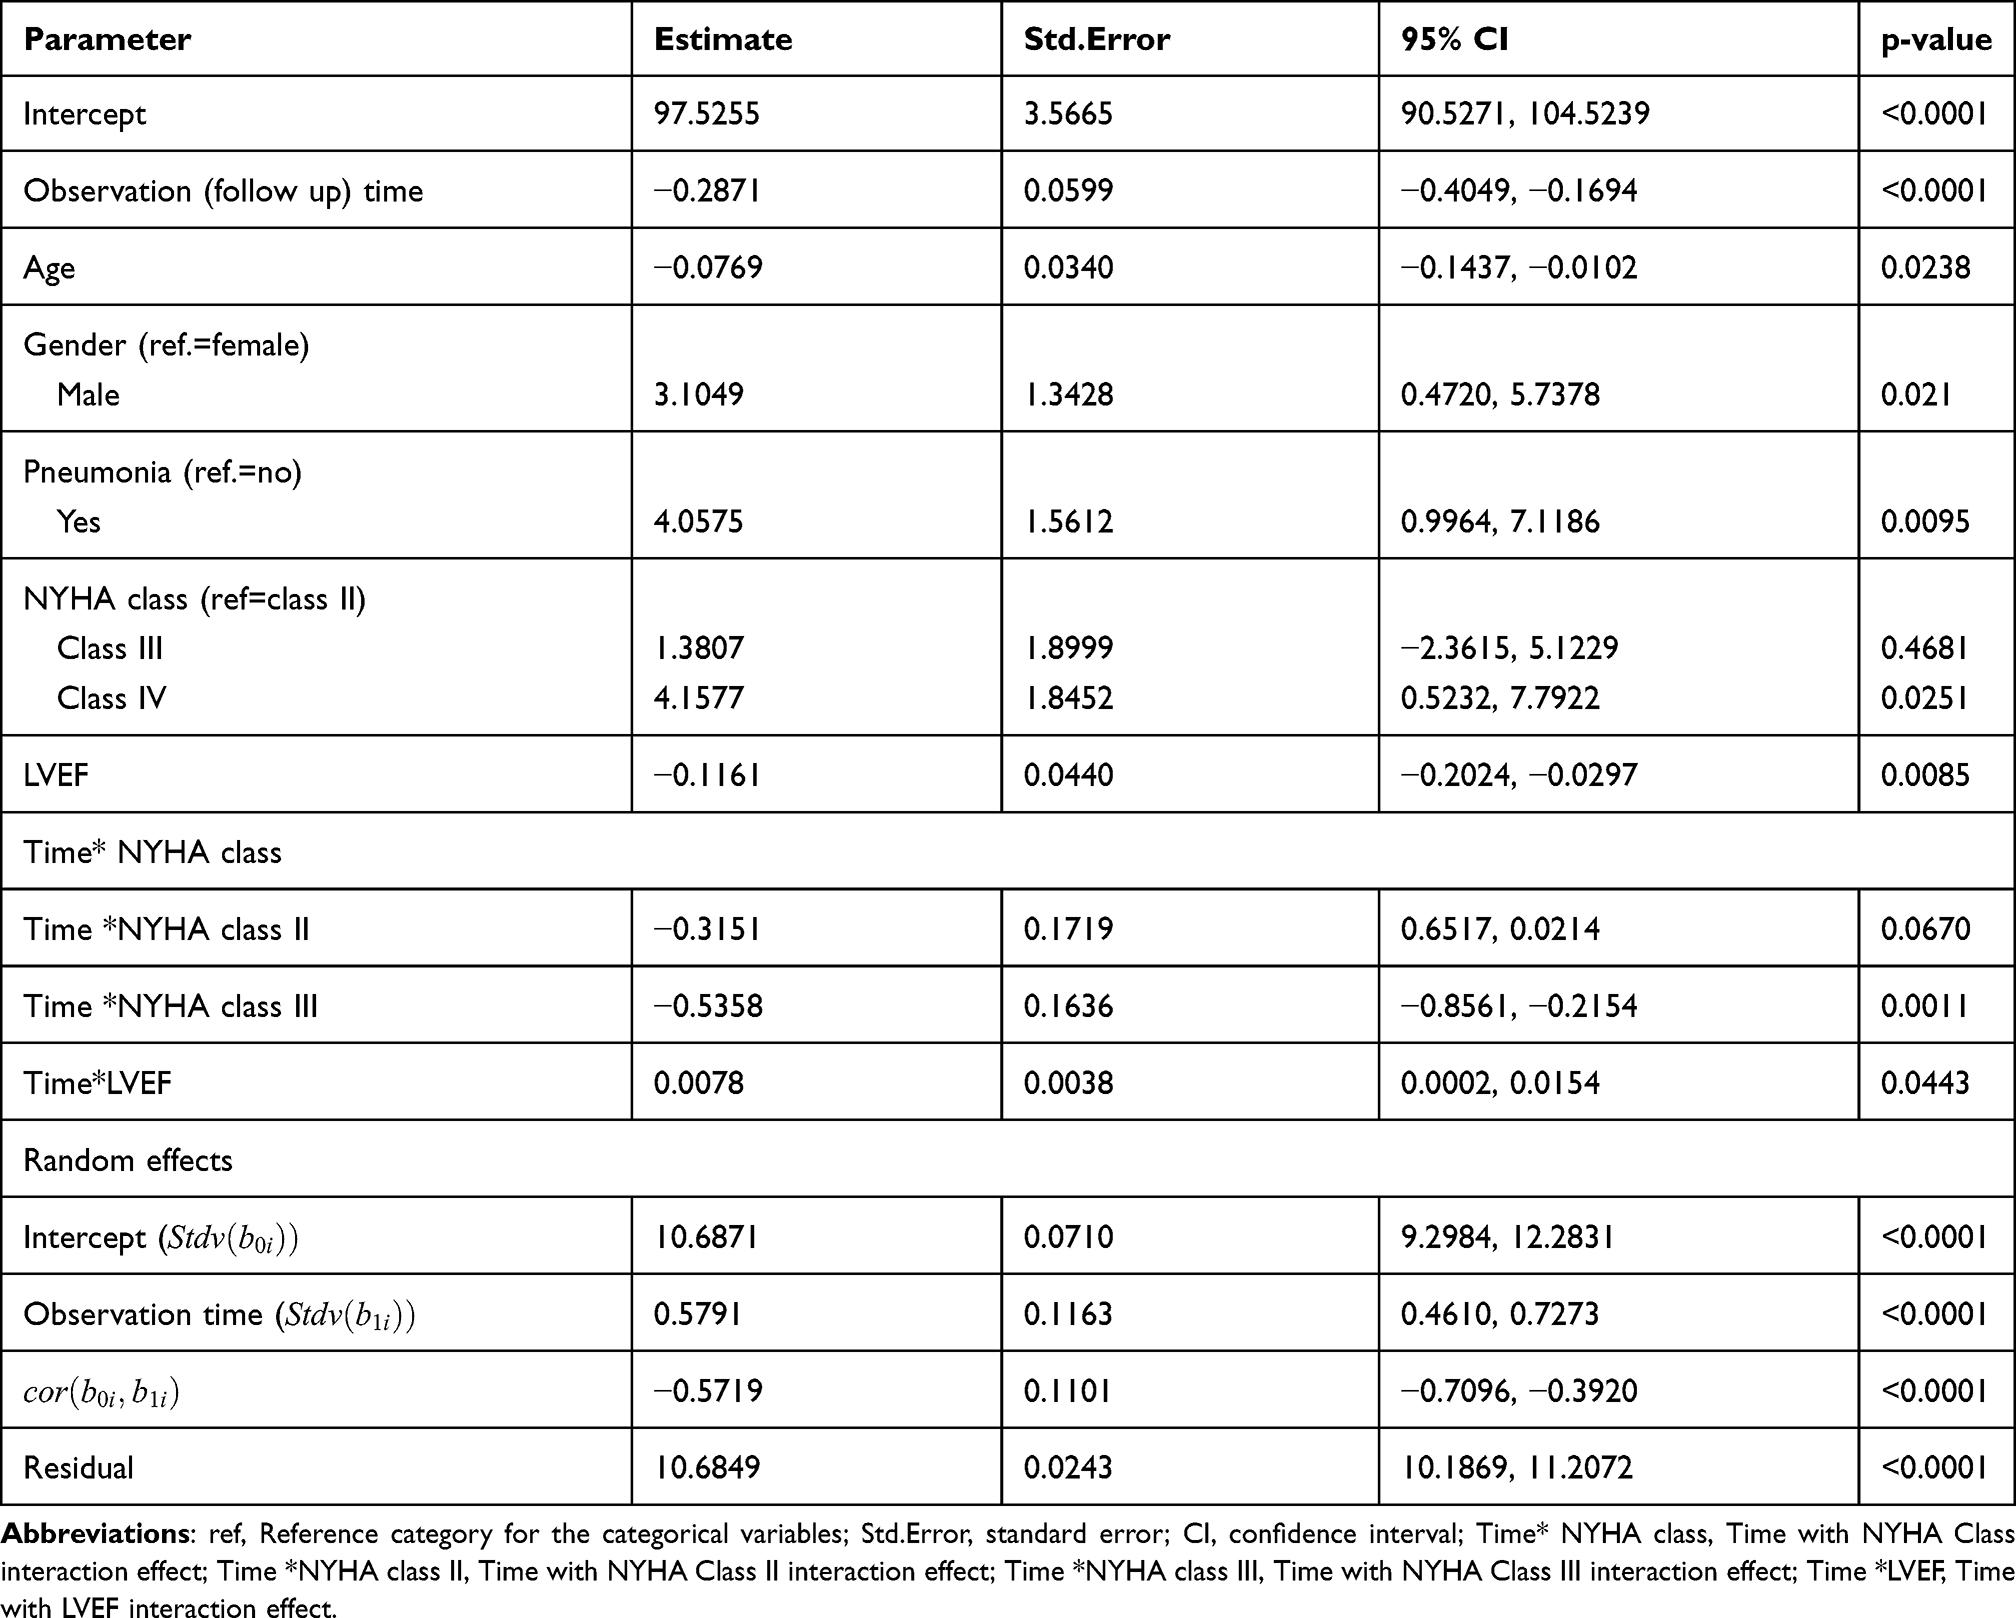 |
Table 6 Parameter Estimation of Linear Mixed Model for CHF Patient’s Data Taken at FHRH from 2016–2018 |
Discussions
In this study, the linear mixed-effects model was used. First, the longitudinal pulse rate was checked for normality using q-q plot, histogram plot, and Shapiro–Wilk test. The result indicates that even if the pulse rate counts per minute data is not continuous data it is approximately normal. Therefore, there is no need for transformation and the original pulse rate data were used for the analysis. Then, the data were analyzed using random intercept, random slope, and random intercept-random slope model by using an unstructured covariance structure. The random intercept and random slope model with the REML method of estimation had been selected for this study since it has a smaller AIC than the other models. As a result age, LVEF, follow-up times had a negative significant effect whereas gender male, pneumonia, and NYHA class IV had a positive significant e effect on the progression of the pulse rate of patients.
In a real-world setting, a follow-up clinical outcome is strongly associated with a lower risk of mortality and hospitalization outcomes. A high heart rate is associated with increased cardiovascular risk.16 Multiple studies have shown that heart rate reduction is associated with improved clinical outcomes in heart failure patients. In patients with cardiovascular disease increased HR represents an important indicator of mortality.17
Our study shows that follow-up times had a negative significant effect on the progression of pulse rate over time. When patients had one more follow up the average pulse rate decreased by 0.2871 (p-value < 0.001). It was in line with the study,18 indicating that after the intervention, the average decrease in pulse rate occurred over time.
If the age of patients increased by one year, the average PR of patients was significantly decreased by 0.0769 (p-value = 0.0238) keeping all variables constant. This finding is in line with another study in Ethiopia,2 which showed that age was found to be negatively associated with the average evolution of pulse rate.
When the left ventricle ejection fraction of patients is increased by one unit the average pulse rate of patients is decreased by 0.1161 while all other predictors are held constant (P=0.0085). This means that if the pushed-out blood in the left ventricle in each heartbeat increased by one percent the average pulse rate of patients decreased by 11.61%. This finding is in line with another study,2 which showed that LVEF was found to be negatively associated with the average evolution of pulse rate. But, our finding contradicts an earlier study,19 which shows that there is no evidence of the association between left ventricular ejection fraction and quality of life of HF patients. Also, our finding is in contrast to the previous finding,20 which shows no statistically significant evidence of the effect of ejection status on the mean number of abnormal heart rate measurements.
For male patients, the average PR was significantly increased by 3.1049 (P-value = 0.021) as compared to female patients keeping all other variables constant. These may be due to the male being exposed to cigarette smoking and drinking alcohol frequently. This study was in line with,21 which shows that male CHF patients had lower quality of life. This study was not in line with the previous study,4,22 which shows that the male gender was inversely associated with a higher pulse rate. Also, our study contradicts earlier studies,2,3 which showed that female patients had higher pulse rates than males during the follow-up.
Among New York heart association class (NYHA class), the average PR of the NYHA Class IV patients were significantly higher by 4.1577 (P-value = 0.0251) as compared to NYHA Class II patients keeping all other variables constant. This indicates that the advanced/latter NYHA Class at diagnosis is associated with the higher mean change of pulse rate measure of patients. This finding is in line with another study,2 which showed that NYHA class had a positive significant effect on PR. Also, this finding is in line with the previous finding,19 which shows that the Higher NYHA class reduced the quality of life of CHF patients.
The average PR of chronic heart failure patients comorbid with pneumonia was increased by 4.0575 (P-value=0.0095) compared with non-pneumonic patients. This indicates that pneumonia is a common condition associated with substantial morbidity and mortality since the elevation of the average pulse rate is associated with the progression of heart failure. This study was in line with,23 the risk of heart failure increases for pneumonia patients.
Limitation
Because information on several crucial characteristics such as body mass index, alcoholism, marital status, education level, and smoking status is not available in the patients’ charts, we did not use these variables in our research. A second restriction is that there is insufficient literature on longitudinal outcomes.
Conclusion and Recommendation
The study investigated and identified factors that are associated with the longitudinal measure pulse rate of chronic heart failure patients in Felege Hiwot referral hospital by using linear mixed model analyses. The result of this study showed that age, LVEF, pneumonia, follow-up time of the patients, NYHA class, time * LVEF, and time * NYHA classes were significant predictors of the progression change of pulse rate. The variables age, LVEF, and follow-up time were negatively associated whereas male gender, NYHA class, and presence of pneumonia were positively associated with the progression change of pulse rate of patients. The rate of progression of pulse rate decreases over time. We recommended that the concerned body Health professionals, Governmental organizations and Non-Governmental Organizations promote and allocate budgets in adequate amounts for treatment of CHF patients to minimize the risk level of CHF, and attention should be given to NYHA class IV and pneumonic patients. Finally, in longitudinal data analysis over time there is a dropout effect of patients from follow-up. So to show the association factor between longitudinal and survival analysis future extension of this work that is a joint model of both models is recommended.
Abbreviations
AIC, Akaike’s Information Criterion; BIC, Bayesian Information Criteria; CHF, Chronic or Congestive Heart Failure; CI, Confidence Interval; CKD, Chronic Kidney Disease; CVD; Cardiovascular Disease, FHRH, Felege Hiwot Referral Hospital; HF, Heart Failure; IHD, Ischemic Heart Disease; LVEF, Left Ventricular Ejection Fraction; NYHA, New York Heart Association; PR, Pulse Rate; RHD, Rheumatic Heart Disease; SPSS, Statistical Package for Social Science; STD.DEV, Standard Deviation; SSA, Sub-Saharan Africa; VHD, Valvular Heart Disease; WHO, World Health Organization.
Data Sharing Statement
The data sets used during the current study are available from the corresponding author on reasonable request.
Ethics Approval and Consent to Participate
The data used in this study was previously obtained by medical personnel for the goal of treating/diagnosing heart failure and initiating follow-up care. The study was conducted according to the guidelines of the Declaration of Helsinki and approved by the Ethical Approval Committee of facility of natural and computational science, Debre Tabor University, Ethiopia, with reference number RCS/121/2019, was received to use this previously gathered data.
Acknowledgments
We would like to express our gratitude to the employees at Felege Hiwot Referral Hospital for providing vital information and unwavering support.
Author Contributions
Both authors made a significant contribution in the conception, study design, execution, acquisition of data, analysis, and interpretation, or in all these areas; took part in drafting, revising, or critically reviewing the article; gave final approval of the version to be published; have agreed on the journal to which the article has been submitted; and agree to be accountable for all aspects of the work.
Funding
No financial support.
Disclosure
The authors report no conflicts of interest in this work.
References
1. Fiuzat M, Wojdyla D, Pina I, et al. Heart rate or beta-blocker dose? Association with outcomes in ambulatory heart failure patients with systolic dysfunction: results from the HF-ACTION trial. JACC Heart Fail. 2016;4(2):
2. Fissuh YH, Muletav G. A joint model for a longitudinal pulse rate and respiratory rate of congestive heart failure patients: at Ayder Referral Hospital of Mekelle University, Tigray, Ethiopia. J Biom Biostat. 2015;6(5):
3. Ho JE, Larson MG, Ghorbani A, et al. Long‐term cardiovascular risks associated with an elevated heart rate: the F ramingham Heart Study. J Am Heart Assoc. 2014;3(3):
4. Peer N, Lombard C, Steyn K, et al. Elevated resting heart rate is associated with several cardiovascular disease risk factors in urban-dwelling black South Africans. Sci Rep. 2020;10(1):
5. Butler J. An overview of chronic heart failure management. Nurs Times. 2012;108(14/15):
6. Dennison RD. PASS CCRN®!-E-Book. Elsevier Health Sciences; 2012.
7. Roger VL. Epidemiology of heart failure. Circ Res. 2013;113(6):
8. Agbor VN, Essouma M, Ntusi NAB, et al. Heart failure in sub-Saharan Africa: a contemporaneous systematic review and meta-analysis. Int J Cardiol. 2018;257(p):207–215. doi:10.1016/j.ijcard.2017.12.048
9. Damasceno A, Cotter G, Dzudie A, et al. Heart failure in Sub-Saharan Africa: time for action. J Am Coll Cardiol. 2007;50:1688–1693.
10. Sadiq AM, Chamba NG, Sadiq AM, et al. Clinical characteristics and factors associated with heart failure readmission at a tertiary hospital in North-Eastern Tanzania. Cardiol Res Pract. 2020;2020:1–6. doi:10.1155/2020/2562593
11. World Health Organization. Global status report on noncommunicable diseases 2014. World Health Organization; 2014.
12. Bhatia A, Maddox TM. Remote patient monitoring in heart failure: factors for clinical efficacy. Int J Cardiol. 2021;3(1):
13. Molenberghs G, Verbeke G. A review on linear mixed models for longitudinal data, possibly subject to dropout. Stat Modelling. 2001;1(4):
14. Rubin DB. Formalizing subjective notions about the effect of nonrespondents in sample surveys. J Am Stat Assoc. 1977;72(359):
15. Brown VA. An introduction to linear mixed-effects modeling in R. Adv Method Pract Psychol Sci. 2021;4(1):
16. Hamill V, Ford I, Fox K, et al. Repeated heart rate measurement and cardiovascular outcomes in left ventricular systolic dysfunction. Am J Med. 2015;128(10):
17. Nikolovska Vukadinović A, Vukadinović D, Borer J, et al. Heart rate and its reduction in chronic heart failure and beyond. Eur J Heart Fail. 2017;19(10):
18. Achmad MH, Horax S, Rizki SS, et al. Pulse rate change after childhood anxiety management with modeling and reinforcement technique of children’s dental care. Pesqui Bras Odontopediatria Clin Integr. 2019;19:1–7. doi:10.4034/PBOCI.2019.191.97
19. Nesbitt T, Doctorvaladan S, Southard JA, et al. Correlates of quality of life in rural heart failure patients. Circ Heart Fail. 2014;7(6):882. doi:10.1161/CIRCHEARTFAILURE.113.000577
20. Njagi EN. Joint Models for Survival and Longitudinal Data, Missing Data, and Sensitivity Analysis, with Applications in Medical Research [Doctoral dissertation, PhD Thesis]. London School of Hygiene and Tropical Medicine; 2013.
21. Nesbitt T, Doctorvaladan S, Southard JA, et al. Correlates of quality of life in rural patients with heart failure. Circ Heart Fail. 2014;7(6):
22. Satoh M, Inoue R, Tada H, et al. Reference values and associated factors for Japanese newborns’ blood pressure and pulse rate: the babies’ and their parents’ longitudinal observation in Suzuki Memorial Hospital on intrauterine period (BOSHI) study. J Hypertens. 2016;34(8):
23. Eurich DT, Marrie TJ, Minhas-Sandhu JK, et al. Risk of heart failure after community acquired pneumonia: prospective controlled study with 10 years of follow-up. BMJ. 2017;356.
 © 2022 The Author(s). This work is published and licensed by Dove Medical Press Limited. The full terms of this license are available at https://www.dovepress.com/terms.php and incorporate the Creative Commons Attribution - Non Commercial (unported, v3.0) License.
By accessing the work you hereby accept the Terms. Non-commercial uses of the work are permitted without any further permission from Dove Medical Press Limited, provided the work is properly attributed. For permission for commercial use of this work, please see paragraphs 4.2 and 5 of our Terms.
© 2022 The Author(s). This work is published and licensed by Dove Medical Press Limited. The full terms of this license are available at https://www.dovepress.com/terms.php and incorporate the Creative Commons Attribution - Non Commercial (unported, v3.0) License.
By accessing the work you hereby accept the Terms. Non-commercial uses of the work are permitted without any further permission from Dove Medical Press Limited, provided the work is properly attributed. For permission for commercial use of this work, please see paragraphs 4.2 and 5 of our Terms.