")
Back to Journals » Risk Management and Healthcare Policy » Volume 15
Determinants of Lifestyle Choices Among South Korean College Students: An Experimental Analysis
Authors Bessey D
Received 23 August 2021
Accepted for publication 13 November 2021
Published 20 January 2022 Volume 2022:15 Pages 93—105
DOI https://doi.org/10.2147/RMHP.S333968
Checked for plagiarism Yes
Review by Single anonymous peer review
Peer reviewer comments 2
Editor who approved publication: Professor Mecit Can Emre Simsekler
Donata Bessey
EastAsia International College, Yonsei University (Mirae Campus), Wonju, Gangwon-do, Republic of Korea
Correspondence: Donata Bessey
EastAsia International College, Yonsei University (Mirae Campus), Yonseidae-gil 1, Jeongui Hall, Wonju, 26493, Gangwon-do, Republic of Korea
Tel +82-33-760-2276
Email [email protected]
Purpose: Based on theoretical predictions from human capital theory, the aim of this exploratory study is to analyze the relationship between experimentally elicited, incentivized economic preference parameters, Big Five and Grit personality traits, cognitive ability, and the Alameda Seven lifestyles: smoking, drinking excessively, being overweight or obese, experiencing stress, following a healthy diet, exercising, and sleeping enough. In addition, self-reported general physical and mental health are analyzed.
Materials and Methods: Data collection took place in an incentivized paper-and-pencil experiment. Undergraduate students were recruited as subjects, with the requirement that they be freshmen, but no restrictions based on gender, major, or age. A pre-test and three experimental sessions were conducted in March and in April 2018, with a total of 178 subjects participating. After deleting observations with missing values, a total of n = 138 subjects remained. Regression analysis (multivariate probit models, resulting marginal effects and changes in predicted probabilities of adopting a lifestyle for “ideal types”) was used to analyze and compare the determinants of the Alameda Seven health behaviors.
Results: Findings suggest that preference parameters, a measure of cognitive ability, and Big Five personality traits are statistically significantly estimated in regressions for the determinants of adopting Alameda Seven health behaviors, but the Grit score is only statistically significantly estimated in a regression for the determinants of reported better general mental health.
Conclusion: The findings regarding preference parameters partly lend support to predictions from human capital theory and partly confirm previous findings in health psychology. Those results might be explained by the relatively small sample size and the inclusion of a measure of cognitive ability in addition to personality traits and preferences.
Keywords: Alameda Seven, Big Five, personality traits, risk preference, time preference
Background
Expanding health care spending in high-income countries1 motivates the development of new policies to implement preventive efforts for lifestyle diseases responsible for substantial numbers of fatalities.2–5 In its latest “Global Burden of Disease” report, the World Health Organization (WHO) estimates that ischaemic heart disease, hypertensive heart disease and strokes accounted for 25.4% of all deaths in industrialized countries in 2016.6
Similar to personalized medicine and its approach of tailoring treatment to individual patients based on genetic or protein-related information,7 new policies could be based on the identification of individuals that are least likely to adopt health-promoting lifestyles and provide them with individualized measures to encourage their adoption, such as health education classes or incentives.8 A well-known set of lifestyles are the “Alameda Seven” (ie, smoking, drinking excessively, exercising, following a healthy diet, being overweight or obese, experiencing stress, and sleeping enough) which were first analyzed in an epidemiological study of circa 7000 individuals in Alameda County, California, in 1965 and subsequently found to affect physical health status.9–14
The aim of this research is to use predictions from human capital theory in a health economic framework to analyze individuals’ decisions to adopt lifestyles. Pioneered by Becker15 for educational and Grossman16 for health capital investment, human capital theory predicts that individuals with low time preference (ie, more “patient” individuals) should invest more in their human capital.17 When the human capital investment model is augmented to analyze risky investments, theoretical models for education18–20 and health21,22 predict lower human capital investment by more risk-averse individuals (ie, individuals who prefer low-uncertainty outcomes over high-uncertainty outcomes). A considerable amount of previous research in experimental health economics has investigated the relationship between time preference and risk attitude and the probability of adopting health behaviors, with mixed results (see Lawless et al23 or Story et al24 for surveys or the following research articles).25–31
Beyond human capital theory, this research is also related to previous research in health psychology analyzing correlations between Big Five personality traits (openness, conscientiousness, extraversion, agreeableness, and neuroticism32), cognitive ability, and health behaviors,33–44 showing important correlations for both.
For the Big Five personality traits, health behavior models predict that personality traits are correlated with lifestyle choices.34 Sirois and Hirsch45 also provide the argument that the probability of engaging in health-promoting lifestyles is a self-regulatory task and predict that conscientiousness, agreeableness, and neuroticism should affect the probability of adopting health behaviors through the mechanism of affect balance. Higher scores on the openness to experience and conscientiousness scale might also be associated with resilience34 and more prudent health behaviors,37 respectively, and resulting higher probabilities to adopt health-promoting lifestyles. Higher scores on the extraversion scale are hypothesized to be associated with higher lower probabilities of adopting health-promoting lifestyles, where a possible transmission channel might be related to the facet of sensation seeking (eg, for the decision to binge drink), but also with higher probabilities of engaging in physical activity through the facet of activity.46 Higher scores on the agreeableness scale are hypothesized to be associated with higher probabilities of engaging in health-promoting behaviors through the mechanism of affect balance.45 Lastly, higher scores on the neuroticism scale are hypothesized to be associated with differences in experiencing negative emotions,34 such as stress, which might also result in lower probabilities of adopting health-promoting lifestyles.
For cognitive ability, results from the health economics literature show that there are considerable differences in lifestyles by education, and that a sizeable part of these differences is due to differences in cognitive ability.41,47 A considerable literature in epidemiology also shows a negative association between cognitive ability and mortality,48–54 most likely as the result of differences in lifestyles by cognitive ability.
Borghans et al55 argue that information on personality traits should be included in economic studies of health outcomes, and Dohmen et al56 find that cognitive ability is negatively correlated with risk aversion and with time preference. Lastly, there is also evidence that personality traits and risk preferences are correlated,57,58 suggesting that lack of data on personality traits and cognitive ability might lead to omitted variables bias and providing the rationale to include them as regressors in all multivariate regression analyses in this research. Finally, previous research has suggested that the grit score predicts various measures of educational success,59 which led to the hypothesis that it might also be an important predictor of health behaviors requiring a sustained effort over time, such as quitting or curbing drinking or smoking or engaging in more physical activity.60 The grit score has been evaluated in obesity research,61 along with a non-incentivized intertemporal choice task, and results suggest a negative association of Grit and BMI. For physical activity, Reed et al60 and Reed62 report positive associations with grit. This previous evidence provides the rationale for testing its associations with a full set of lifestyles in this research, while controlling for economic preference parameters and Big Five personality traits.
The overall objective of this study is to improve the understanding of determinants of lifestyle choices by analyzing a full set of lifestyles (the Alameda Seven) and the effect of economic preference parameters, personality traits, and a measure of ability at the same time on the probability of adopting these lifestyles. Based on human capital theory and previous research in health psychology, it hypothesizes that the probability of adopting health-promoting lifestyles should increase with higher levels of risk-aversion and decrease with higher levels of time preference. Regarding personality traits, it hypothesizes that the associations with health-promoting lifestyles will be stronger for Big Five conscientiousness, extraversion, agreeableness and neuroticism than for Big Five openness. For the Grit score, it hypothesizes that those with higher scores should adopt health-promoting lifestyles with a higher probability. Lastly, it also hypothesizes that the probability of adopting health-promoting lifestyles should increase with the measure of cognitive ability used.
Data and Methods
Data collection took place in an incentivized paper-and-pencil experiment, meaning subjects were paid in accordance with their choices in the experiment. In accordance with standard practice in experimental economics, undergraduate students were recruited as subjects, with the requirement that they be freshmen, but no restrictions based on gender, major, or age.
Subjects gave their informed consent for inclusion orally before they participated in the study. As this is a non-interventional, survey-type study using elicitation methods from experimental economics and some personality scales used in psychological research, the research was deemed to present only minimal risk to the participants, and involved no procedures for which written consent is usually required. The study was conducted in accordance with the Declaration of Helsinki, and the protocol was approved by the Institutional Review Board of Yonsei University, Mirae Campus (2018-52-0092).
A pre-test took place in March 2018 and three experimental sessions were conducted later in March and in April 2018, with a total of 178 subjects participating. After deleting observations with missing values, a total of n = 138 subjects remained.
Table S1 in Appendix A provides basic demographics for the sample, Table S2 in Appendix A provides a correlation matrix.
Experimental Design and Materials
During all three experimental sessions, subjects first took two subtests (the Animal Naming Task and the Symbol Correspondence Task) from one of the most widely used intelligence tests worldwide, the Wechsler Adult Intelligence Scale (WAIS),63 to be used as an (albeit imperfect) proxy measure of cognitive ability that measures semantic fluency, as previous research has shown high correlations for scores on these submodules with scores on other submodules of the WAIS and of other widely used intelligence tests.64
In the Animal Naming Task, subjects were asked to write as many animal names as they could during 90 seconds. The Symbol Correspondence Test presents subjects with nine symbols that correspond to one of the numbers 1 through 9. In the paper-and-pencil-based version of the test, subjects received a series of numbers and had to fill in as many of the corresponding symbols as possible in a row during 90 seconds. Despite clear instructions, unfortunately, many subjects did not answer correctly in this part of the experiment, not filling in the symbols in a row and therefore, only the resulting number of animals named in the Animal Naming Task could be used as a proxy measure of cognitive ability.
In the second part, subjects first participated in an intertemporal choice task, using convex budget tasks following Andreoni and Sprenger65 in the adaptation of Carvalho et al66 to measure their time preference. Convex budget tasks measure delay discounting by providing experimental subjects with choices over how to allocate money between two points in time, where both the amounts of money and the points in time vary. The tasks used in this research are provided in Appendix B. This method was chosen because convex time budgets have been shown to significantly outperform double multiple price lists for out-of-sample predictions.67 Choices that corresponded to preference for higher experimental interest rates correspond to lower levels of time preference.
Next, subjects participated in a lottery choice task using menu choices68 to measure their risk attitude. The number of safe choices they made was used as a measure of their risk aversion, with more safe choices corresponding to higher levels of risk aversion.
In the third part, subjects answered a health questionnaire containing items on the Alameda Seven lifestyles that were derived from the Canadian Community Health Survey.69 The lifestyles used in this research are the original Alameda Seven: smoking, drinking excessively, exercising, following a healthy diet, being overweight or obese, experiencing stress, and sleeping enough. They were measured by subjects’ answers to the following questions, all of which were adapted from the Canadian Community Health Survey 2016.69
For health outcomes, subjects’ self-reported general physical and mental health was measured as their answers to the following questions: “In general, would you say your (mental) health is … ”, with “Excellent”, “Very good”, “Good”, “Fair”, and “Poor” as answer options.
For smoking, subjects’ answer to the following question was used in the regression analysis: “At the present time, do you smoke cigarettes (including e-cigarettes) every day, occasionally or not at all?” (with “daily”, “occasionally” and “not at all” as answer options). Those who answered “daily” or “occasionally” were labeled as smokers.
For binge drinking, subjects’ answer to the following question was used in the regression analysis: “How often in the last week have you had 5 (for men) or 4 (for women) or more drinks on one occasion?” with those who said that they did so at least once labeled as binge drinkers.
For experiencing stress, subjects’ answer to the following question was used in the regression analysis: “Thinking about the amount of stress in your life, would you say that most of your days are … ?” (with “Not at all stressful” – “Extremely stressful” as answer options).
Sleep quality was measured as respondents’ score from the following three questions: “How often do you have trouble going to sleep or staying asleep?”, “How often do you find it difficult to stay awake when you want to?”, and “How often do you find your sleep refreshing?”, with the first two items reverse coded so that higher scores correspond to better sleep quality.
Subjects’ quality of nutrition was measured as the number of times they had vegetable (including juice) or fruit (including juice) during the week before the experiment. Similarly, exercise was measured as the self-reported number of minutes they had exercised in the week before the experiment. Lastly, subjects’ body mass index (BMI) was calculated from their self-reported height and weight.
After the health survey, subjects answered the Grit score inventory59 and a 15-item short version of the Big Five inventory.70,71 This 15-item version was developed and validated for use in the German Socio-Economic Panel70 and aggregated identically to the original research, but not standardized.
The Grit inventory was developed by Duckworth et al59 in order to measure another personality trait, “grit”, that they define as “perseverance and passion for long-term goals” and a fundamental predictor of individual success beyond intellectual ability. In their original research, Duckworth et al59 report that grit is not correlated with IQ, but always significantly correlated with different measures of educational success, such as GPA. In this research, the original version of the Grit scale was used and aggregated identically, but not standardized.
After answering the personality traits questionnaires, subjects answered a questionnaire containing items on their gender, age, and family background.
The experimental instructions and choice sheets and the health and background questionnaires can be found in Appendix B.
Lastly, payments were determined and subjects were paid according to their choices in the experimental time and risk elicitation tasks. For each task, one decision row was randomly determined by the throw of a die to be selected for subjects’ payment.72 Then, subjects’ payment was determined in accordance with their choice by a second throw of a die. The three experimental sessions lasted on average 62 minutes, and the average payment was KRW 42,000. Since on-campus student jobs pay the Korean minimum wage (KRW 7530 at the time of the experiments), incentives for participation should be sufficient.
Statistical Analysis
For the statistical analysis, multivariate probit regressions were used, although some of the lifestyles of interest are measured as ordered outcomes. However, as the interpretation of estimated coefficients from a multivariate ordered probit model is uninformative for the research question and very space-consuming, multivariate probit regressions were employed instead. Multivariate regression analysis was used in order to account for the possible correlations between independent variables and to provide a more precise understanding of the association of each independent variable with the Alameda Seven lifestyles.
Regression results from ordered probits (for general physical and mental health, stress levels and sleep quality) and OLS (for exercise, nutrition and BMI) can be found in Table S3, Appendix A.
As estimated coefficients in non-linear models are not very informative, this research also presents and discusses marginal changes and changes in predicted probabilities for so-called “ideal types”73 in order to gauge the size of effects and uncover possible heterogeneity between subgroups in the sample.
The marginal changes presented in this research were calculated as average marginal effects (ie the marginal effect of a variable xk was computed for each observation at observed values xi, and the average of these effects was computed, as outlined in Long and Freese.73
“Ideal types”, as outlined in Long and Freese,73 describe how predicted probabilities for a given outcome change as the value of an independent variable changes, and are a possibility to uncover heterogeneity in effects across subgroups in the sample. Since the estimated coefficient on self-reported gender is statistically significant in estimations for a majority of the lifestyles and health outcomes under consideration in this research, the “ideal types” considered here are a female and a male student. For those “ideal types”, changes in predicted probabilities were calculated as the result of a change in each regressor of interest from the mean to the mean plus one standard deviation. All other variables were held constant at the sample means (for preference parameters, ability, and personality traits) and modes (for all control variables).
The dependent variables were re-coded as follows: 1 if the respondent stated that their (mental) health was “excellent, “very good” or “good”, as opposed to “fair” or “poor”, which was coded as 0, 1 if their stress level was “extremely stressful”, “quite a bit stressful” or “a bit stressful”, as opposed to “not very stressful” or “not at all stressful”, which was coded as 0, 1 if their sleep quality corresponded to the highest two possible levels as opposed to 0 for the three lowest levels, 1 if they had at least one portion of fruit or vegetables per day during the last week as opposed to 0 if they did have less than this amount, 1 if they exercised at least an average of 30 minutes per day during the last week as opposed to 0 if the exercised less, 1 if their BMI was above 25 (which is “overweight” by Western standards and “obese” by Korean standards74 as opposed to zero if their BMI was lower. All health measures were self-reported.
In order to provide a quick overview of results, only the coefficients of interest from multivariate probit regressions are reported in all tables, while complete regression results with all estimated coefficients are provided in Table S4 in Appendix A. In addition to the variables measuring economic preference parameters, personality traits, and cognitive ability, all regressions include the following control variables: age, gender, and three measures of family background, namely, how difficult it is for the respondent to raise 100,000 Korean won (at the time of the experiment, this corresponded to about US$ 91.42) for personal consumption (on a scale from 1 to 5, with 1 = “very easy” and 5 = “very difficult”), their number of siblings as a measure of social capital, and how happy their childhood was (on a scale from 1 to 5, with 1 = “very unhappy” and 5 = “very happy”).
Results
In the entire sample, 70.29% of subjects report a binge drinking episode during the week before the experiment, 10.87% are smoking, 18.84% have a body mass index (BMI) above 25, and 26.09% of subjects exercised on average for at least 30 minutes per day in the week before the experiment. Full descriptive statistics as well as a correlation matrix can be found in Tables S1 and S2 in Appendix A.
Table 1 presents estimated coefficients from multivariate probit regressions for determinants of two health outcomes and all Alameda Seven lifestyles: general health, general mental health, any binge drinking episode in the week before the experiment, any smoking, perceived level of stress, quality of sleep, nutrition, BMI, and exercise. In addition to the regressors of interest, all estimations include the following control variables: gender, year of birth, the abovementioned income measure, the respondents’ number of siblings and the answer to the question “Did you have a happy childhood?” as measures of family background and social capital.
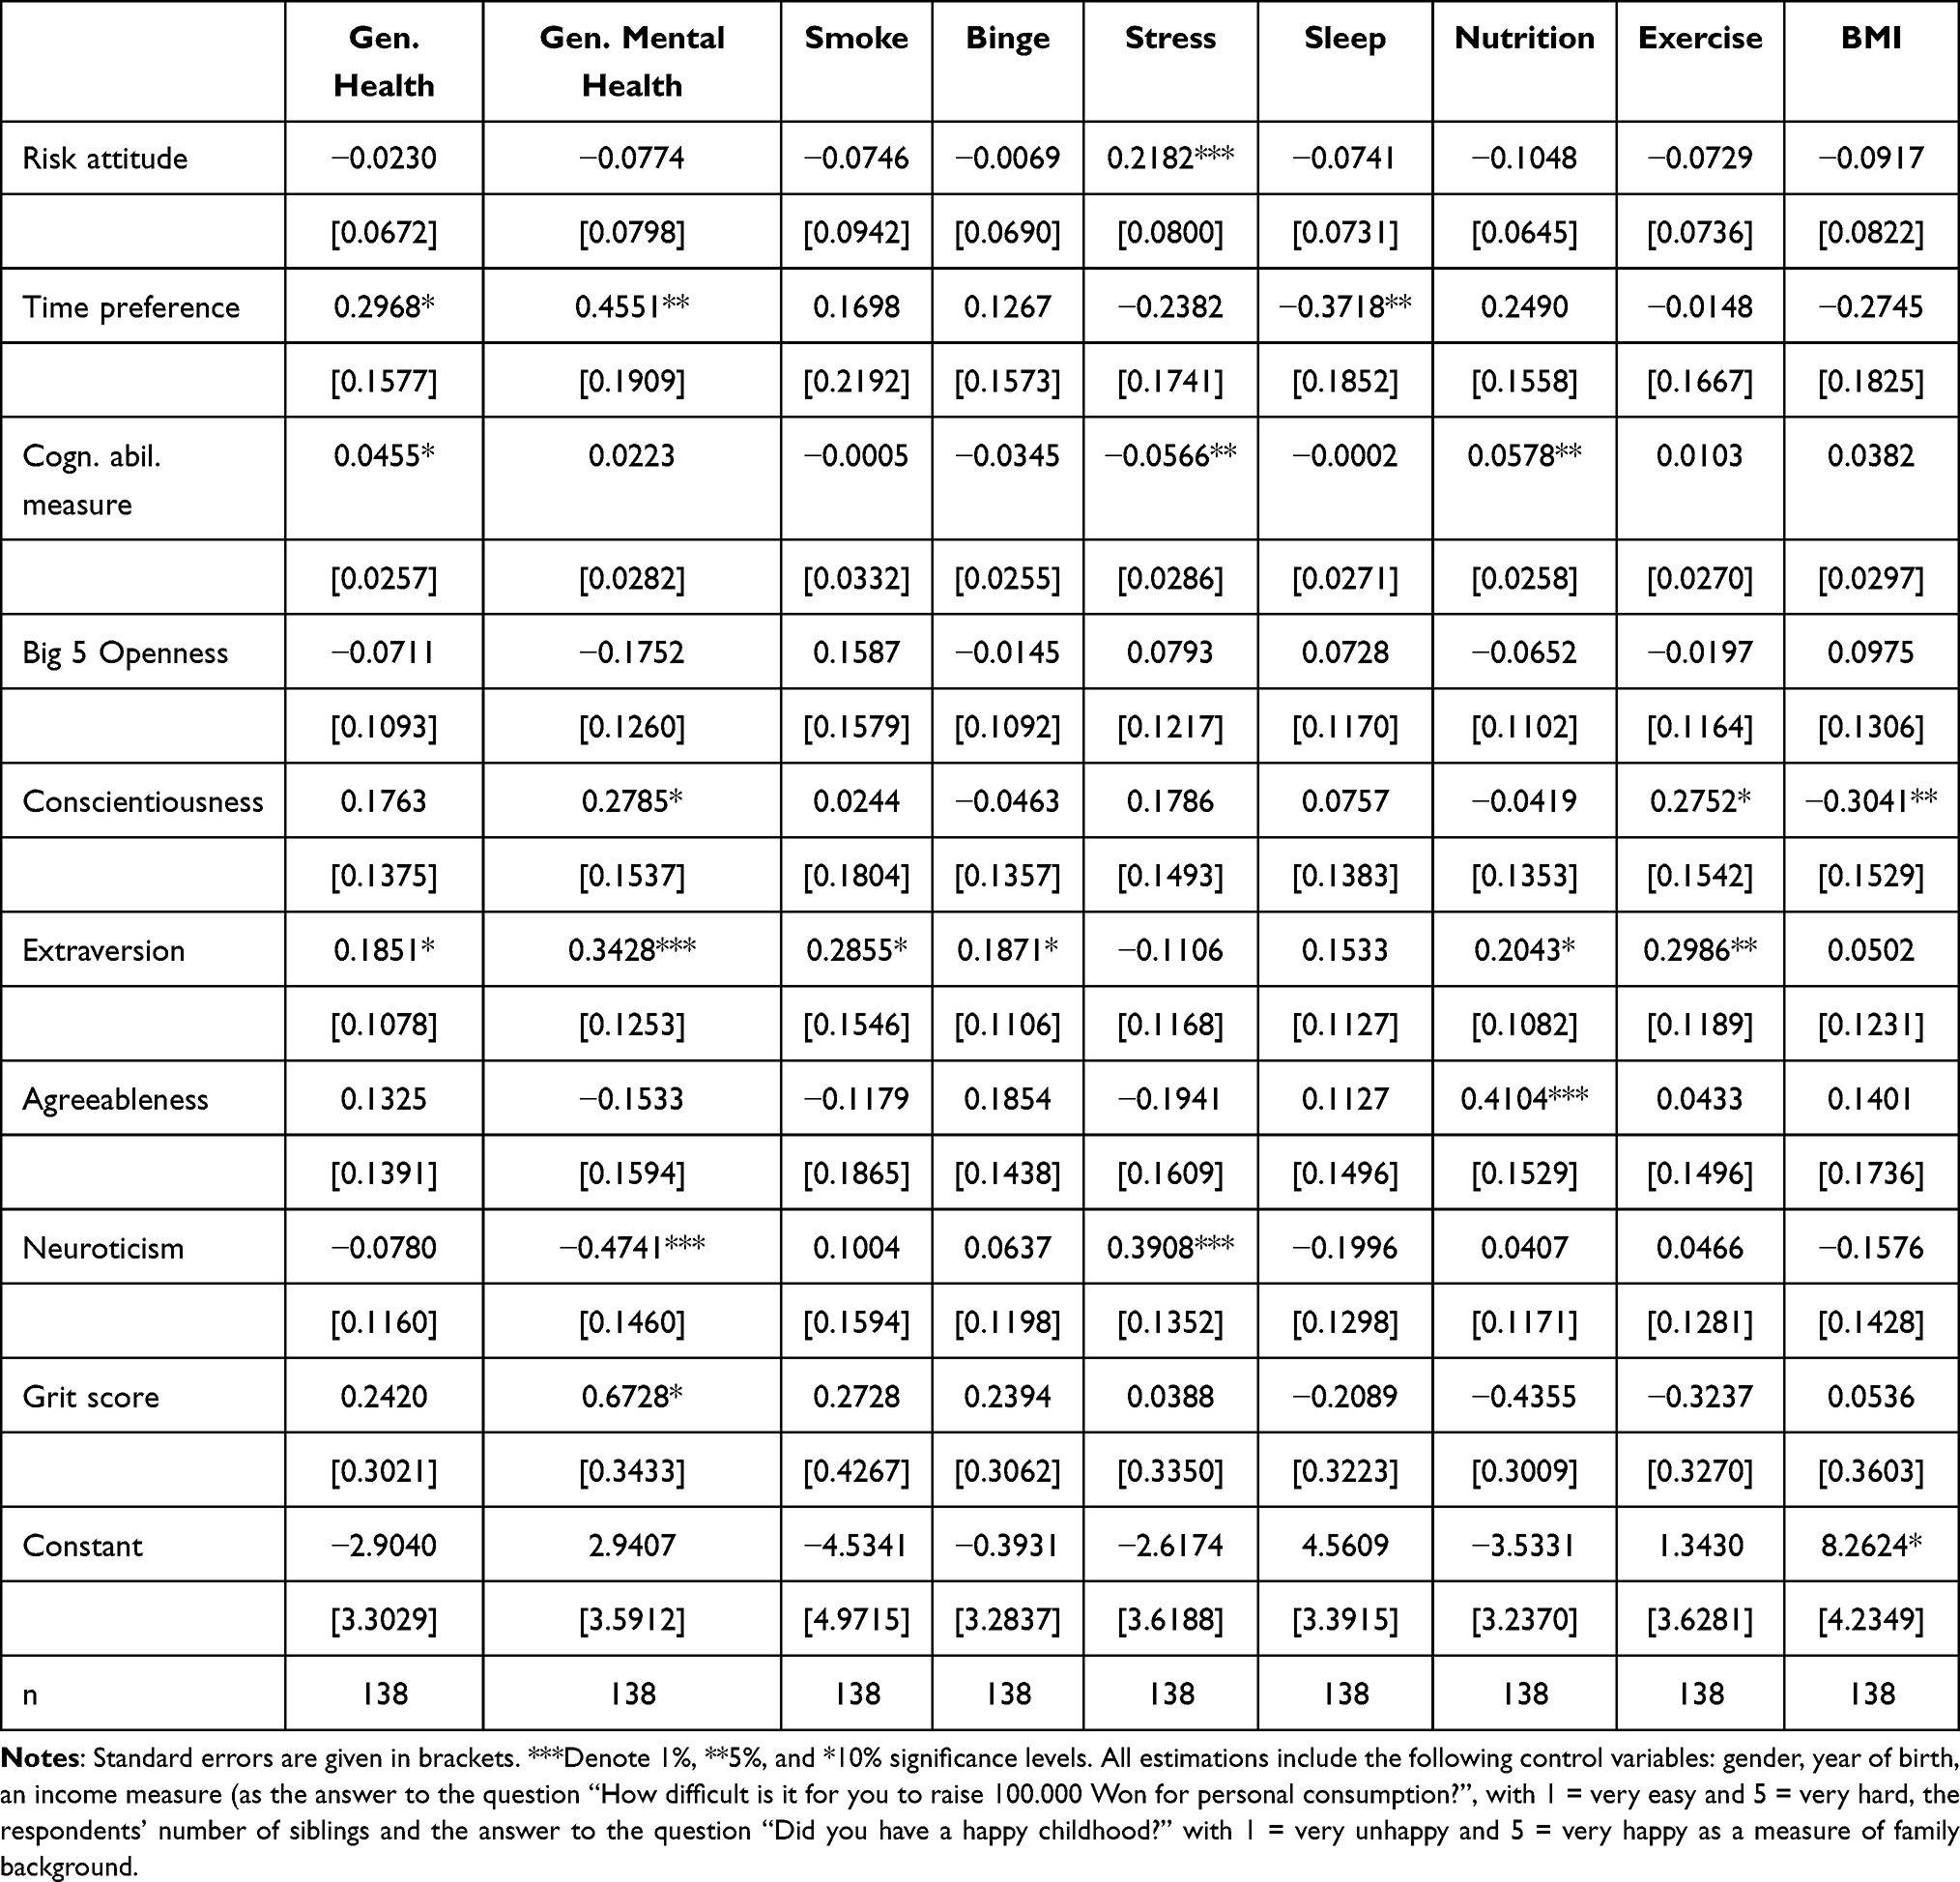 |
Table 1 Preferences, Personality Traits and Lifestyles: Estimated Coefficients from Multivariate Probit Regressions |
Estimation results suggest that risk attitude is positively correlated with perceived stress in this sample and after controlling for the Big Five traits, Grit and a measure of cognitive ability. Time preference is positively correlated with general physical and mental health and negatively correlated with quality of sleep: individuals with low time preference are more likely to report good physical and mental health and less likely to report good sleep.
Cognitive ability, as measured by the subject’s score on the Animal Naming Task, is positively correlated with general physical health, negatively correlated with the probability of reporting higher stress levels, and positively correlated with reporting better nutrition quality.
When controlling for Grit, ability, and economic preference parameters, higher scores on Big Five conscientiousness are correlated positively with good self-reported general mental health and with the probability of reporting more exercise, and negatively correlated with the probability of having a BMI above 25. Higher scores on Big Five extraversion are correlated positively with self-reported general physical and mental health, but also with the probability of smoking and reporting a binge drinking episode. In addition, Big Five extraversion is correlated positively with reporting higher nutrition quality and more exercise. Finally, higher scores on Big Five neuroticism are correlated negatively with self-reported general mental health and correlated positively with perceived stress.
When controlling for Big Five traits, ability and economic preference parameters, higher Grit scores are positively correlated with good self-reported general mental health, but not with any other lifestyles.
In order to gauge the size of these effects, Table 2 presents average marginal effects for the same multivariate regressions as in Table 1.
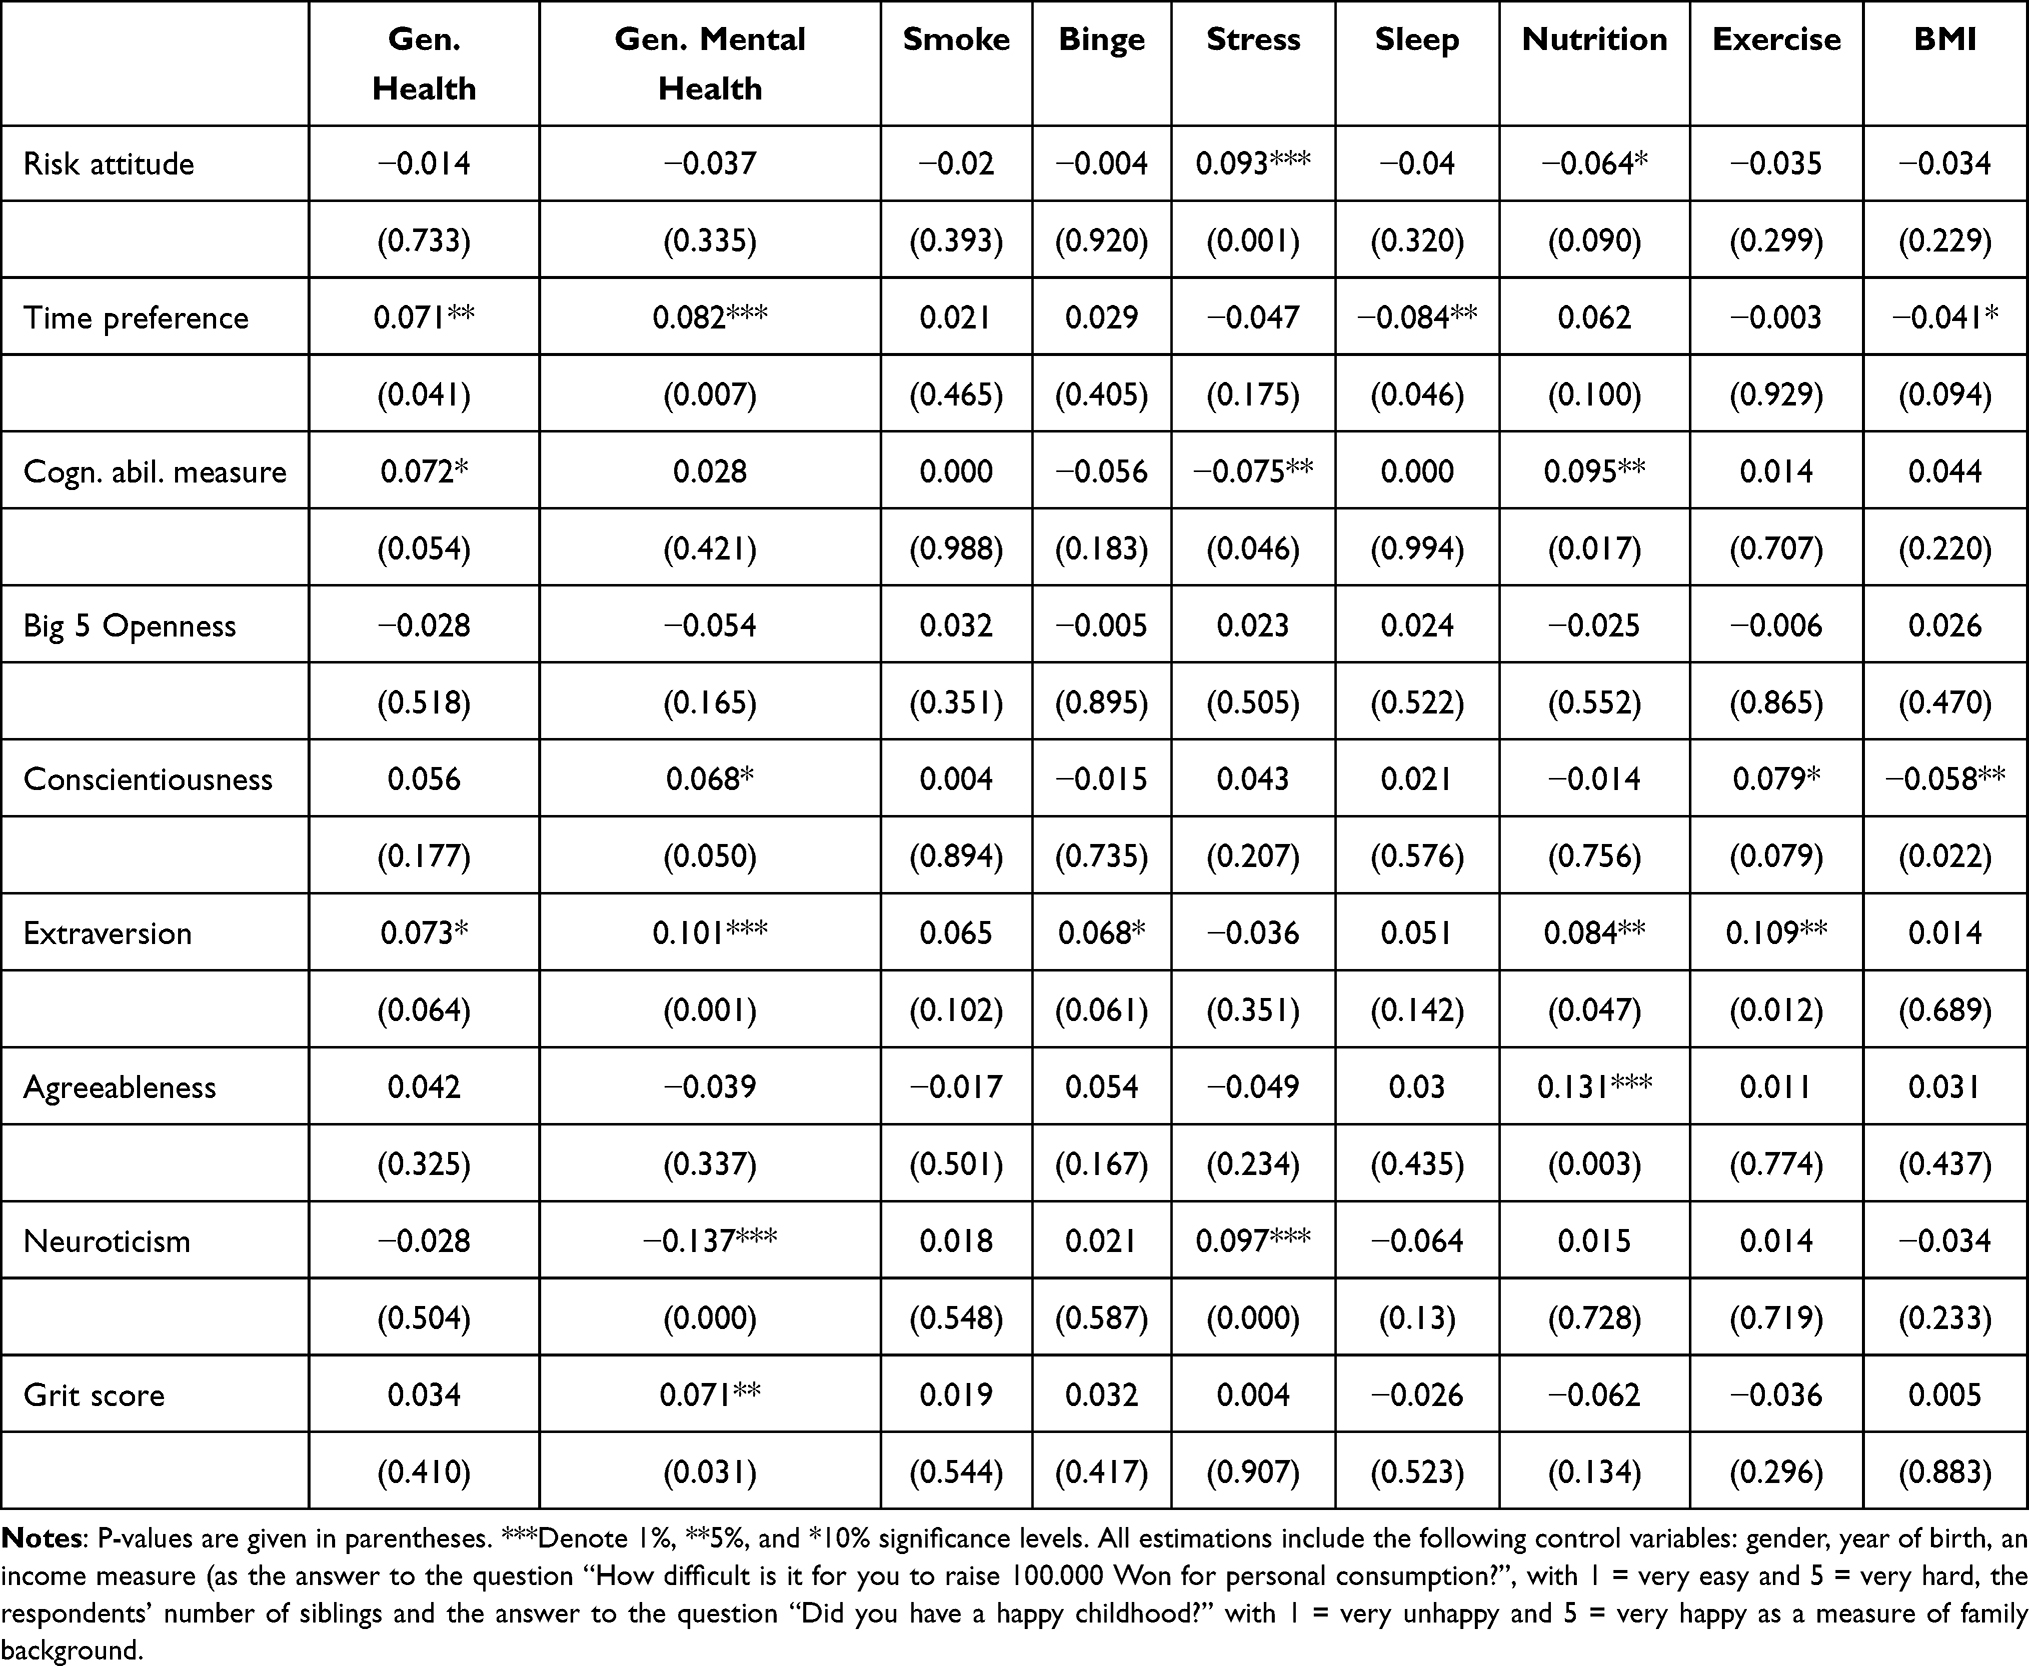 |
Table 2 Preferences, Personality Traits and Lifestyles: Average Marginal Effects from Multivariate Probit Regressions |
On average, an increase of one standard deviation on the risk attitude measure increases the probability of reporting higher stress levels by 9.3% and decreases the probability of reporting better nutrition by 6.4% in this sample. An increase of one standard deviation on the time preference measure increases the probability of reporting better general physical and mental health by 7.1% and 8.2%, respectively. It also decreases the probability of reporting better sleep quality by 8.4% and the probability of having a BMI above 25 by 4.1%. For the measure of cognitive ability used in this study, an increase in one standard deviation leads to a 7.2% increase in the probability of reporting better general physical health, a 7.5% decrease in the probability of reporting higher stress levels and to a 9.5% increase in the probability of reporting better nutrition.
For Big Five traits, on average, an increase in one standard deviation on the conscientiousness score increases the probability of reporting better general mental health by 6.8%, the probability of exercising at least 30 minutes per day by 7.9%, and decreases the probability of having a BMI above 25 by 5.8%. An increase in one standard deviation on the extraversion score on average increases the probability of reporting better general physical and mental health by 7.3% and 10.1%, respectively, but also increases the probability of reporting a binge drinking episode by 6.8%, the probability of reporting better nutrition by 8.4% and the probability of exercising at least 30 minutes per day by 10.9%. Finally, an increase in one standard deviation on the neuroticism score on average decreases the probability of reporting better mental health by 13.7% and increases the probability of reporting higher stress levels by 9.7%. With respect to the Grit score, a one standard deviation increase in Grit leads to a 7.1% increase in the probability of reporting better general mental health.
The statistically significantly estimated coefficient on the dummy variable for self-reported gender in a majority of the estimations suggests that there are gender differences in the probabilities of adopting the Alameda Seven lifestyles in this sample. In order to uncover possible heterogeneity for the effects of preference parameters and personality traits, the next table presents changes in predicted probabilities of adopting a lifestyle for two “ideal types”, namely, a female and a male student. The change in predicted probabilities reported in Table 3 is the change resulting from an increase in the regressor of interest from the respective mean to the mean plus one standard deviation.
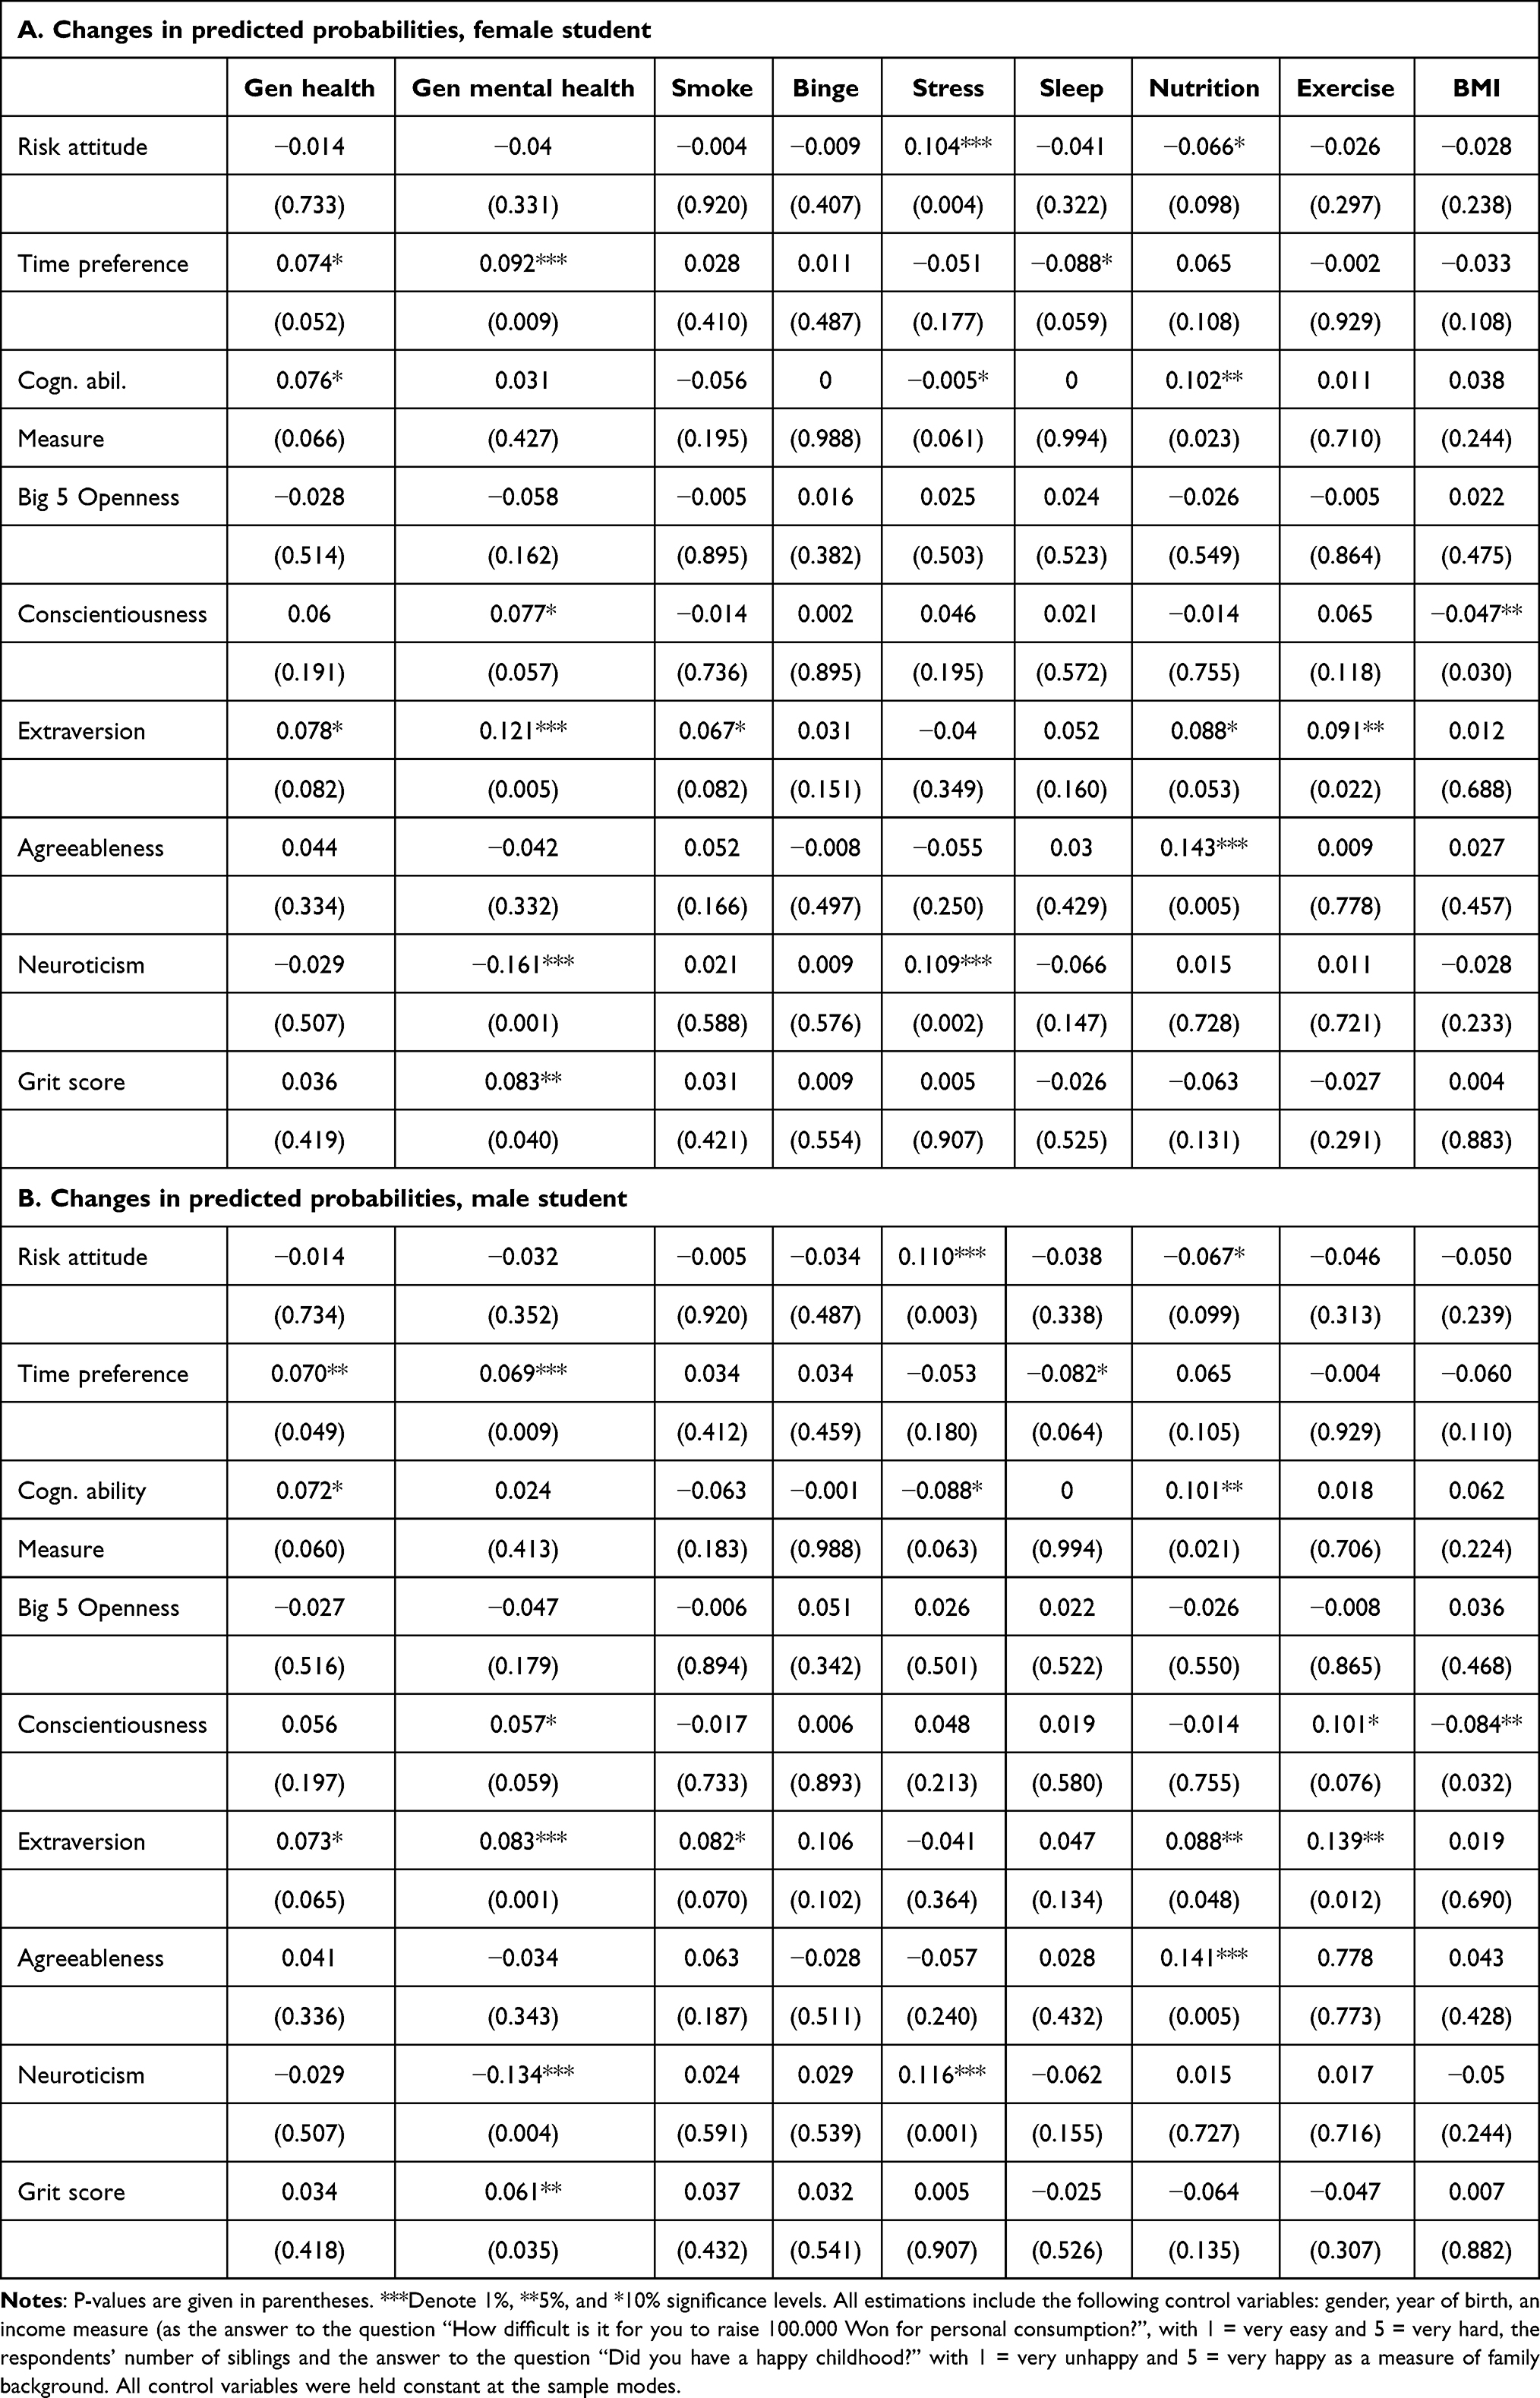 |
Table 3 Changes in Predicted Probabilities for “Ideal Types” (Female and Male Student) |
For risk attitude, an increase in one standard deviation from the mean increases the predicted probability of reporting higher stress levels by 10.4% for a woman and 11% for a man, and reduces the predicted probability of reporting better nutrition by 6.6% and 6.7%, respectively. For time preference, an increase in one standard deviation from the mean increases the probability of reporting better general health by 7.4% (7%), of reporting better mental health by 9.2% (6.9%), and decreases the probability of reporting better sleep quality by 8.8% (8.2%). With respect to the cognitive ability measure, an increase in one standard deviation from the mean increases the probability of reporting better general physical health by 7.6% (7.2%), decreases the probability of reporting higher stress levels by 0.5% (8.8%), and increases the probability of reporting better nutrition by 10.2% (10.1%). For Big Five personality traits, there are no effects for openness. For conscientiousness, an increase in one standard deviation from the mean is associated with a 7.7% (5.7%) increase in the probability of reporting better mental health, a 10.1% increase in the probability of reporting higher exercise levels for men (with no relationship found for women), and a 4.7% (8.4%) decrease in the probability of having a BMI above 25. For extraversion, an increase in one standard deviation from the mean is associated with a 7.8% (7.3%) increase in the probability of reporting better general physical health, a 12.1% (8.3%) increase in the probability of reporting better general mental health, a 6.7% (8.2%) increase in the probability of smoking, an 8.8% (8.8%) increase in the probability of reporting better nutrition, and a 9.1% (13.9%) increase in the probability of reporting higher exercise levels. For agreeableness, an increase in one standard deviation from the mean is associated with a 14.3% (14.1%) increase in the probability of reporting better nutrition and for neuroticism, an increase in one standard deviation from the mean is associated with a 16.1% (13.4%) decrease in the probability of reporting better general mental health, and a 10.9% (11.6%) increase in the probability of reporting higher stress levels.
Lastly, for the Grit score, the only statistically significant relationship found here is with general mental health, where an increase in one standard deviation from the mean increases the probability of reporting better general mental health by 8.3% (6.1%).
Discussion
This study presents exploratory experimental evidence on the ability of incentivized measures of risk aversion and time preference, a measure of cognitive ability and several measures of personality traits to predict the probability of engaging in the lifestyles known as the Alameda Seven, as well as self-reported general physical and mental health.
For the economic preference parameters, and when controlling for Big Five traits, Grit, and a measure of cognitive ability, the results for risk attitude are partly in line with predictions derived from models of human capital investment for education,18–20 predicting that more risk-averse individuals should invest less. For previous experimental research, this is in line with previous results28,29,31,75 reporting that risk preference is not related to the probability of drinking or smoking.
The results for time preference partly lend evidence to predictions derived from human capital theory, namely, that more individuals with lower time preference should invest more in human capital, eg, health.15,16 For previous experimental research, this is in line with previous findings by Chabris et al26 reporting that individuals with low time preference are less likely to be obese, Sutter et al29 who find that individuals with low time preference have a lower BMI, and Bradford et al30 reporting that individuals with low time preference are less likely to snack. Lack of domain independence could serve as a candidate explanation for the varying results across the Alameda Seven lifestyles analyzed in this research.76,77
Results from this study regarding the cognitive ability measure are in line with previous findings by Auld and Sidhu40 reporting that higher cognitive ability is related with a lower probability of reporting health limitations, Harris et al43 who find that a childhood ability measure predicts better old-age health, and Wraw et al42 who report a positive effect of childhood IQ on physical health, mobility difficulty, and overall health status. The large difference between male and female students with respect to the effect of cognitive ability on perceived stress uncovered in the analysis of “ideal types” might be due to the fact that female students’ stress is caused less by academic stress (which might be lower for more able students) than that of male students.
For Big Five traits, previous research suggests they were found to be associated with a number of health measures,34 and the associations seem to larger for agreeableness, conscientiousness, and neuroticism than extraversion or openness to experience, according to a metasynthesis of results.78 This study, after controlling for economic preferences, ability and Grit, finds that openness is unrelated to Alameda Seven lifestyles and two measures of general health outcomes, but all other Big Five traits show at least some statistically significant relationships with lifestyles and outcomes, providing further evidence to these previous results.
For the Grit score, and after controlling for economic preferences, Big Five traits, and cognitive ability, this study finds that higher Grit scores are only related with a higher probability of reporting better general mental health, but not with any lifestyles. Previous research reported positive associations with physical activity for college students in the US,79 a lower probability of seeking help for mental health among college veterans,80 and a positive effect of grit on good mental81–83 and physical health.62,83 This surprising result adds to the growing evidence that Grit as it is currently measured does not appear to be particularly predictive of success and performance and also does not appear to be all that different to conscientiousness,84 and might be explained by the inclusion of Big Five traits, especially conscientiousness, and ability in the regressions presented in this study.
Results using the concept of “ideal types” as a means of discovering possible gender differences in effects suggest that the sizes of effects seem to be remarkably constant for both sexes in the sample, with the exception of cognitive ability and stress. Since previous research in personality psychology suggests that there are considerable gender differences in Big Five personality traits,85,86 this similarity of effects is an unexpected finding.
Limitations and Recommendations
For all results presented in this study, readers should remember that lack of statistical power due to the relatively small sample size (n = 138) is likely responsible for the finding that there are relatively few statistically significant estimated coefficients. Therefore, avenues for further research on the topic might include the use of preferably larger, and also non-college student subject pools. Also, and similarly to much previous research, all results presented in this study report current correlations and not predictions of future probabilities of adapting lifestyles. Longitudinal study designs might overcome this limitation.
As for policy implications, results from this exploratory study seem to suggest that there is a potential of using preference parameters in order to identify individuals at risk of engaging in unhealthy lifestyles, but more research is clearly needed in order to confirm those preliminary findings.
Acknowledgments
Financial support through Yonsei University’s Future-leading Research Initiative, grant number 2017-52-0070, is gratefully acknowledged. Junho Lee, Minjeong Chae, Yejin Lee and Seri Park provided most able research assistance.
Disclosure
The author reports no conflicts of interest in this work.
References
1. OECD. Focus on health spending; 2015.
2. Ford ES, Bergmann MM, Boeing H, Li C, Capewell S. Healthy lifestyle behaviors and all-cause mortality among adults in the United States. Prev Med. 2012;55(1):23–27. doi:10.1016/j.ypmed.2012.04.016
3. Ding D, Rogers K, van der Ploeg H, Stamatakis E, Bauman AE. Traditional and emerging lifestyle risk behaviors and all-cause mortality in middle-aged and older adults: evidence from a large population-based Australian cohort. PLoS Med. 2015;12(12):e1001917. doi:10.1371/journal.pmed.1001917
4. Petersen KEN, Johnsen NF, Olsen A, et al. The combined impact of adherence to five lifestyle factors on all-cause, cancer and cardiovascular mortality: a prospective cohort study among Danish men and women. Br J Nutr. 2015;113(5):849–858. doi:10.1017/S0007114515000070
5. Loef M, Walach H. The combined effects of healthy lifestyle behaviors on all cause mortality: a systematic review and meta-analysis. Prev Med. 2012;55(3):163–170. doi:10.1016/j.ypmed.2012.06.017
6. World Health Organization. The global burden of disease; 2018.
7. Schleidgen S, Klingler C, Bertram T, Rogowski WH, Marckmann G. What is personalized medicine: sharpening a vague term based on a systematic literature review. BMC Med Ethics. 2013;14(1). doi:10.1186/1472-6939-14-55
8. Lynagh MC, Sanson-Fisher RW, Bonevski B. What’s good for the goose is good for the gander. guiding principles for the use of financial incentives in health behaviour change. Int J Behav Med. 2013;20(1):114–120. doi:10.1007/s12529-011-9202-5
9. Belloc NB, Breslow L. Relationship of physical health status and health practices. Prev Med. 1972;1(3):409–421. doi:10.1016/0091-7435(72)90014-X
10. Kenkel DS. Health behavior, health knowledge, and schooling. J Polit Econ. 1991;99(2):287–305. doi:10.1086/261751
11. Contoyannis P, Jones AM. Socio-economic status, health and lifestyle. J Health Econ. 2004;23(5):965–995. doi:10.1016/J.JHEALECO.2004.02.001
12. Balia S, Jones AM. Mortality, lifestyle and socio-economic status. J Health Econ. 2008;27(1):1–26. doi:10.1016/J.JHEALECO.2007.03.001
13. Schneider BS, Schneider U. Determinants and consequences of health behaviour: new evidence from German micro data; 2011.
14. Humphreys BR, McLeod L, Ruseski JE. Physical activity and health outcomes: evidence from Canada. Health Econ. 2014;23(1):33–54. doi:10.1002/hec.2900
15. Becker GS. Investment in human capital: a theoretical analysis. J Polit Econ. 1962;70(5):9–49. doi:10.1086/258724
16. Grossman M. On the concept of health capital and the demand for health. J Polit Econ. 1972;80(2):223–255. doi:10.1086/259880
17. Fuchs V. Economic Aspects of Health. University of Chicago Press; 1982.
18. Levhari D, Weiss Y. The effect of risk on the investment in human capital. Am Econ Rev. 1974;64(6):
19. Johnson WR. A Theory of Job Shopping. Q J Econ. 1978;92(2):261. doi:10.2307/1884162
20. Gibbons R, Murphy KJ. Optimal incentive contracts in the presence of career concerns: theory and evidence. J Polit Econ. 1992;100(3):468–505. doi:10.1086/261826
21. Chang FR. Uncertainty and investment in health. J Health Econ. 1996;15(3):369–376. doi:10.1016/0167-6296(96)00006-9
22. Asano T, Shibata A. Risk and uncertainty in health investment. Eur J Health Econ. 2011;12(1):79–85. doi:10.1007/s10198-010-0238-2
23. Lawless L, Drichoutis AC, Nayga RM. Time preferences and health behaviour: a review. Agric Food Econ. 2013;1(1). doi:10.1186/2193-7532-1-17
24. Story GW, Vlaev I, Seymour B, Darzi A, Dolan RJ. Does temporal discounting explain unhealthy behavior? A systematic review and reinforcement learning perspective. Front Behav Neurosci. 2014;8. doi:10.3389/fnbeh.2014.00076
25. Anderson LR, Mellor JM. Predicting health behaviors with an experimental measure of risk preference. J Health Econ. 2008;27(5):1260–1274. doi:10.1016/j.jhealeco.2008.05.011
26. Chabris CF, Laibson D, Morris CL, Schuldt JP, Taubinsky D. Individual laboratory-measured discount rates predict field behavior. J Risk Uncertain. 2008;37(2–3):237–269. doi:10.1007/s11166-008-9053-x
27. Harrison GW, Lau MI, Rutström EE. Individual discount rates and smoking: evidence from a field experiment in Denmark. J Health Econ. 2010;29(5):708–717. doi:10.1016/J.JHEALECO.2010.06.006
28. Szrek H, Chao LW, Ramlagan S, Peltzer K. Predicting (un) healthy behavior: a comparison of risk-taking propensity measures. Judgm Decis Mak. 2012;7(6):716–727.
29. Sutter M, Kocher MG, Glätzle-Rützler D, Trautmann ST. Impatience and uncertainty: experimental decisions predict adolescents‘ field behavior. Am Econ Rev. 2013;103(1):510–531. doi:10.1257/aer.103.1.510
30. Bradford D, Courtemanche C, Heutel G, McAlvanah P, Ruhm C. Time preferences and consumer behavior. J Risk Uncertain. 2017;55:2–3. doi:10.1007/s11166-018-9272-8
31. Conell-Price L, Jamison J. Predicting health behaviors with economic preferences & locus of control. J Behav Exp Econ. 2015;54:1–9. doi:10.1016/j.socec.2014.10.003
32. Goldberg LR. A historical survey of personality scales and inventories. In: McReynolds P, editor. Advances in Psychological Assessment. Vol. 2. Science and Behavior Books; 1971:293–336.
33. Friedman HS. Long‐term relations of personality and health: dynamisms, mechanisms, tropisms. J Pers. 2000;68(6):1089–1107. doi:10.1111/1467-6494.00127
34. Smith TW. Personality as risk and resilience in physical health. Curr Dir Psychol Sci. 2006;15(5):227–231. doi:10.1111/j.1467-8721.2006.00441.x
35. Hampson SE, Goldberg LR, Vogt TM, Dubanoski JP. Mechanisms by which childhood personality traits influence adult health status: educational attainment and healthy behaviors. Health Psychol. 2007;26(1):121–125. doi:10.1037/0278-6133.26.1.121
36. Turiano NA, Pitzer L, Armour C, Karlamangla A, Ryff CD, Mroczek DK. Personality trait level and change as predictors of health outcomes: findings from a national study of Americans (MIDUS). J Gerontol B Psychol Sci Soc Sci. 2012;67 B(1). doi:10.1093/geronb/gbr072
37. Bogg T, Roberts BW. The case for conscientiousness: evidence and implications for a personality trait marker of health and longevity. Ann Behav Med. 2013;45(3):278–288. doi:10.1007/s12160-012-9454-6
38. Friedman HS, Kern ML. Personality, well-being, and health*. Ann Rev Psychol. 2014;65. doi:10.1146/annurev-psych-010213-115123
39. Weston SJ, Hill PL, Jackson JJ. Personality traits predict the onset of disease. Soc Psychol Personal Sci. 2015;6(3):309–317. doi:10.1177/1948550614553248
40. Christopher Auld M, Sidhu N. Schooling, cognitive ability and health. Health Econ. 2005;14(10):1019–1034. doi:10.1002/hec.1050
41. Bijwaard GE, van Kippersluis H, Veenman J. Education and health: the role of cognitive ability. J Health Econ. 2015;42:29–43. doi:10.1016/J.JHEALECO.2015.03.003
42. Wraw C, Deary IJ, Gale CR, Der G. Intelligence in youth and health at age 50. Intelligence. 2015;53:23–32. doi:10.1016/J.INTELL.2015.08.001
43. Harris MA, Brett CE, Starr JM, Deary IJ, Johnson W. Personality and other lifelong influences on older–age health and wellbeing: preliminary findings in two Scottish samples. Eur J Pers. 2016;30(5):438–455. doi:10.1002/per.2068
44. Fawns-Ritchie C, Starr JM, Deary IJ. Health literacy, cognitive ability and smoking: a cross-sectional analysis of the English longitudinal study of ageing. BMJ Open. 2018;8(10):e023929. doi:10.1136/bmjopen-2018-023929
45. Sirois FM, Hirsch JK. Big Five traits, affect balance and health behaviors: a self-regulation resource perspective. Pers Individ Dif. 2015;87:59–64. doi:10.1016/J.PAID.2015.07.031
46. Raynor DA, Levine H. Associations between the five-factor model of personality and health behaviors among college students. J Am College Health. 2009;58(1):73–82. doi:10.3200/JACH.58.1.73-82
47. Cutler DM, Lleras-Muney A. Understanding differences in health behaviors by education. J Health Econ. 2010;29(1):1–28. doi:10.1016/J.JHEALECO.2009.10.003
48. Deary IJ, Batty GD. Cognitive epidemiology. J Epidemiol Community Health. 2007;61(5):378–384. doi:10.1136/jech.2005.039206
49. Batty GD, Deary IJ, Gottfredson LS. Premorbid (early life) IQ and later mortality risk: systematic review. Ann Epidemiol. 2007;17(4):278–288. doi:10.1016/j.annepidem.2006.07.010
50. Batty GD, Wennerstad KM, Smith GD, et al. IQ in early adulthood and mortality by middle age: cohort study of 1 million Swedish men. Epidemiology. 2009;20(1):100–109. doi:10.1097/EDE.0b013e31818ba076
51. Batty GD, Gale CR, Tynelius P, Deary IJ, Rasmussen F. IQ in early adulthood, socioeconomic position, and unintentional injury mortality by middle age: a cohort study of more than 1 million Swedish men. Am J Epidemiol. 2009;169(5):606–615. doi:10.1093/aje/kwn381
52. Hemmingsson T, Melin B, Allebeck P, Lundberg I. Cognitive ability in adolescence and mortality in middle age: a prospective life course study. J Epidemiol Community Health. 2009;63(9):697–702. doi:10.1136/jech.2008.079160
53. Lager A, Bremberg S, Vågerö D. The association of early IQ and education with mortality: 65 Year longitudinal study in Malmö, Sweden. BMJ. 2009;339:7735. doi:10.1136/bmj.b5282
54. Calvin CM, Deary IJ, Fenton C, et al. Intelligence in youth and all-cause-mortality: systematic review with meta-analysis. Int J Epidemiol. 2011;40(3):626–644. doi:10.1093/ije/dyq190
55. Borghans L, Duckworth AL, Heckman JJ, Weel B. The economics and psychology of personality traits. J Hum Resour. 2008;43(4). doi:10.3368/jhr.43.4.972
56. Dohmen T, Falk A, Huffman D, Sunde U. Are risk aversion and impatience related to cognitive ability? Am Econ Rev. 2010;100(3):1238–1260. doi:10.1257/aer.100.3.1238
57. Becker A, Deckers T, Dohmen T, Falk A, Kosse F. The relationship between economic preferences and psychological personality measures. Annu Rev Econom. 2012;4(1):453–478. doi:10.1146/annurev-economics-080511-110922
58. Rustichini A, DeYoung C, Anderson J, Burks S. Toward the integration of personality theory and decision theory in the explanation of economic and health behavior. IZA Discussion Paper; 2012:6750.
59. Duckworth AL, Peterson C, Matthews MD, Kelly DR. Grit: perseverance and passion for long-term goals. J Pers Soc Psychol. 2007;92(6):1087–1101. doi:10.1037/0022-3514.92.6.1087
60. Reed J, Pritschet BL, Cutton DM. Grit, conscientiousness, and the transtheoretical model of change for exercise behavior. J Health Psychol. 2013;18(5):612–619. doi:10.1177/1359105312451866
61. Graham Thomas J, Seiden A, Koffarnus MN, Bickel WK, Wing RR. Delayed reward discounting and grit in men and women with and without obesity. Obes Sci Pract. 2015;1(2):131–135. doi:10.1002/osp4.12
62. Reed J. A survey of grit and exercise behavior. J Sport Behav. 2014;37(4):390–406.
63. Wechsler D. Wechsler Adult Intelligence Scale–Fourth Edition (WAIS-IV). APA PsycTests; 2008.
64. Lang F, Weiss D, Stocker A, von Rosenbladt B. Assessing cognitive capacities in computer-assisted survey research: two ultra-short tests of intellectual ability in the German Socio-Economic Panel (SOEP). Schmollers Jahrbuch. 2007;127(1):183–192.
65. Andreoni J, Sprenger C. Estimating time preferences from convex budgets. Am Econ Rev. 2012;102(7):3333–3356. doi:10.1257/aer.102.7.3333
66. Carvalho LS, Prina S, Sydnor J. The effect of saving on risk attitudes and intertemporal choices. J Dev Econ. 2016;120:41–52. doi:10.1016/J.JDEVECO.2016.01.001
67. Andreoni J, Kuhn MA, Sprenger C. Measuring time preferences: a comparison of experimental methods. J Econ Behav Organ. 2015;116:451–464. doi:10.1016/J.JEBO.2015.05.018
68. Holt CA, Laury SK. Risk aversion and incentive effects. Am Econ Rev. 2002;92(5):1644–1655. doi:10.1257/000282802762024700
69. Statistics Canada. Canadian community health survey; 2016. Available form: https://www23.statcan.gc.ca/imdb/p3Instr.pl?Function=assembleInstr&lang=en&Item_Id=260675.
70. Gerlitz JY, Schupp J. Zur Erhebung der Big-Five-basierten Persönlichkeitsmerkmale im SOEP. Research Notes 4; 2005. doi:10.1016/j.jsis.2005.07.003.
71. Lang FR, John D, Lüdtke O, Schupp J, Wagner GG. Short assessment of the Big Five: robust across survey methods except telephone interviewing. Behav Res Methods. 2011;43(2):548–567. doi:10.3758/s13428-011-0066-z
72. Cubitt RP, Starmer C, Sugden R. On the validity of the random lottery incentive system. Exp Econ. 1998;1(2):115–131. doi:10.1007/bf01669298
73. Long JS, Freese J. Stata Bookstore: Regression Models for Categorical Dependent Variables Using Stata.
74. Seo MH, Lee WY, Kim SS, et al. 2018 Korean society for the study of obesity guideline for the management of obesity in Korea. J Obes Metab Syndr. 2019;28(1). doi:10.7570/JOMES.2019.28.1.40
75. Bessey D. Preferences, personality and health behaviors: results from an explorative economic experiment. Int J Health Econ Manage. 2018;18(4):437–456. doi:10.1007/s10754-018-9236-1
76. Chapman GB, Elstein AS. Valuing the future: temporal discounting of health and money. Med Decis Making. 1995;15(4):373–386. doi:10.1177/0272989X9501500408
77. Lazaro A. Theoretical arguments for the discounting of health consequences: where do we go from here? PharmacoEconomics. 2002;20(14):943–961. doi:10.2165/00019053-200220140-00001
78. Strickhouser JE, Zell E, Krizan Z. Does personality predict health and well-being? A metasynthesis. Health Psychol. 2017;36(8):797–810. doi:10.1037/hea0000475
79. Dunston ER, Messina ES, Coelho AJ, et al. Physical activity is associated with grit and resilience in college students: is intensity the key to success? J Am Coll Health. 2020:1–7. doi:10.1080/07448481.2020.1740229
80. Wilson TB, Caporale-Berkowitz NA, Parent MC, Brownson CB. Grit is associated with decreased mental health help-seeking among student veterans. J Am Coll Health. 2021;1–6. doi:10.1080/07448481.2021.1953034
81. Barton YA, Miller L. Spirituality and positive psychology go hand in hand: an investigation of multiple empirically derived profiles and related protective benefits. J Relig Health. 2015;54(3):829–843. doi:10.1007/s10943-015-0045-2
82. Meriac JP, Slifka JS, LaBat LR. Work ethic and grit: an examination of empirical redundancy. Pers Individ Dif. 2015;86:401–405. doi:10.1016/j.paid.2015.07.009
83. Sharkey CM, Bakula DM, Gamwell KL, Mullins AJ, Chaney JM, Mullins LL. The role of grit in college student health care management skills and health-related quality of life. J Pediatr Psychol. 2017;42(9):952–961. doi:10.1093/jpepsy/jsx073
84. Credé M, Tynan MC, Harms PD. Much ado about grit: a meta-analytic synthesis of the grit literature. J Pers Soc Psychol. 2017;113(3):492–511. doi:10.1037/pspp0000102
85. Schmitt DP, Realo A, Voracek M, Allik J. Why can’t a man be more like a woman? Sex differences in big five personality traits across 55 cultures. J Pers Soc Psychol. 2008;94(1):168–182. doi:10.1037/0022-3514.94.1.168
86. Schmitt DP, Long AE, McPhearson A, O’Brien K, Remmert B, Shah SH. Personality and gender differences in global perspective. Int J Psychol. 2017;52:45–56. doi:10.1002/ijop.12265
 © 2022 The Author(s). This work is published and licensed by Dove Medical Press Limited. The full terms of this license are available at https://www.dovepress.com/terms.php and incorporate the Creative Commons Attribution - Non Commercial (unported, v3.0) License.
By accessing the work you hereby accept the Terms. Non-commercial uses of the work are permitted without any further permission from Dove Medical Press Limited, provided the work is properly attributed. For permission for commercial use of this work, please see paragraphs 4.2 and 5 of our Terms.
© 2022 The Author(s). This work is published and licensed by Dove Medical Press Limited. The full terms of this license are available at https://www.dovepress.com/terms.php and incorporate the Creative Commons Attribution - Non Commercial (unported, v3.0) License.
By accessing the work you hereby accept the Terms. Non-commercial uses of the work are permitted without any further permission from Dove Medical Press Limited, provided the work is properly attributed. For permission for commercial use of this work, please see paragraphs 4.2 and 5 of our Terms.