")
Back to Journals » Diabetes, Metabolic Syndrome and Obesity » Volume 13
Detection of C-Peptide in Scalp Hair of Healthy Adults
Authors Abdulateef DS , Salih JM
Received 11 December 2019
Accepted for publication 21 January 2020
Published 3 February 2020 Volume 2020:13 Pages 227—236
DOI https://doi.org/10.2147/DMSO.S240785
Checked for plagiarism Yes
Review by Single anonymous peer review
Peer reviewer comments 2
Editor who approved publication: Prof. Dr. Antonio Brunetti
Darya S Abdulateef,1 Jamal M Salih1,2
1Physiology Department, College of Medicine, University of Sulaimani, Sulaymaniyah, Kurdistan Region, Iraq; 2Diabetes Physician, Diabetes and Endocrine Centre, Sulaymaniyah, Kurdistan Region, Iraq
Correspondence: Darya S Abdulateef
Physiology Department, College of Medicine, University of Sulaimani, New–Street-27, Zone 209, P.O. Box: 334, Sulaymaniyah, Kurdistan Region, Iraq
Tel +964-7701580313
Email [email protected]
Purpose: The C-peptide level from blood and urine samples represents endogenous insulin secretion and has clinical implications for individuals with and without diabetes. However, the study results are inconsistent and the available methods can only measure short-term C-peptide levels, which can be substantially affected by concurrent glycaemia. In this study, we evaluated whether C-peptide can be detected from hair? Hair C-peptide if detected could potentially represent long-term, insulin secretion. And to know whether there is any correlation between hair C-peptide with certain biochemical and demographic parameters.
Methods: In a prospective observational study on 120 normal healthy individuals, hair samples were taken from the scalp and C-peptide was extracted. The hair C-peptide levels were measured in pg/mg of hair using electrochemiluminescence immunoassay (ECLISA) after methanol extraction and were compared among different age and body-type groups. Serum C-peptide, fasting plasma glucose (FPG) and HbA1c were assessed and their levels were correlated with anthropometric parameters.
Results: A detectable range of C-peptide was found in the hair samples of all the subjects with a median of 63.59 pg/mg hair and it was positively correlated with FPG but no significant correlation was found between hair C-peptide and serum C-peptide levels. The hair C-peptide level, along with FPG and HbA1c, was significantly different according to age.
Conclusion: These results conclude that C-peptide can be detected from and measured in the scalp hair of humans and it is positively correlated with FPG, and it is significantly different according to age. This technique, if validated, may verify its usefulness in future studies of both healthy and diseased subjects.
Keywords: C-peptide, hair sample, fasting plasma glucose, human
Introduction
Insulin and connection peptide (C-peptide) are secreted in equimolar amounts by the β-cells of the pancreas.1 In the circulatory system, insulin has a short half-life, as it is degraded by the hepatic enzymes and is excreted by the kidneys. Meanwhile, C-peptide has a longer half-life, and studies have suggested the measurement of C-peptide levels to reflect the amount of endogenous insulin secretion.2,3
Despite the fact that C-peptide level is used to differentiate the types of diabetes and to guide the appropriate management, a high C-peptide level, which may indicate insulin resistance (IR), has been linked to various diseases. Indeed, a vast number of studies have suggested an association between a high plasma C-peptide level and metabolic syndrome, increased intra-abdominal fat distribution, heart disease, non-alcoholic steatohepatitis, colorectal, breast and prostate cancer as well as an increased mortality in the latter two diseases.4–9 However, some of these associations are inconsistent within the various studies, which could be partly due to physiologically unsteady C-peptide secretion or to the lack of a standardized method of C-peptide measurement.10,11
Previous studies have used blood and urine samples to detect plasma/serum and urine C-peptide during fasting and/or postprandial states.12,13 While glucagon-stimulated C-peptide is regarded as a standard test, it induces nausea and vomiting and requires multiple blood samplings that must be put in ice immediately.12 Urinary C-peptide levels – obtained either through 24-hr urine collection or a recently suggested morning spot sampling – have also been measured. However, urinary C-peptide levels can be hugely affected by renal functioning, meaning creatinine clearance should be simultaneously assessed.13
Recently, several hormones – largely steroids – were extracted and detected from hair samples, which represents the long-term measurement of these hormones.14–21 The levels of these substances in hair are essential, especially when they are secreted in a pulsatile pattern throughout the day. Furthermore, the detection of these substances in hair has been supported by several animal and human studies.15,16,22–25 To the best of our knowledge, hair C-peptide levels have not been measured.
Because hair growth was found to be of an approximate rate of 1cm per month,26 through one-time sampling from the hair, the researcher can obtain the retrospective values of these hormones throughout the preceding months. Here, every 1cm of hair (10mm) can represent the hormone levels of 1 specific month (ie the most proximal 3cm of the hair sample represents the hormone level of the preceding 3 months, and so on).17 Hair sample collection is an easy technique and the sample can be easily transferred and stored since it only has to be stored at room temperature in a dark, dry place.14,24,27
The main aim of the study was to determine whether C-peptide can be detected from hair samples, as it can with other substances. Detectable hair C-peptide levels may represent a long-term endogenous insulin secretion as the hair cells are exposed to the circulating C-peptide for weeks or months. Meanwhile, unlike plasma or urine samples, the hair C-peptide level may not be affected by acute changes in blood glucose levels, while it will likely reflect both basal and prandial insulin secretion. A further aim was to ascertain whether there is any correlation between hair C-peptide with serum C-peptide, fasting plasma glucose (FPG), glycated hemoglobin (HbA1c) and certain socio-demographic parameters.
Materials and Methods
Before recruiting the larger number of studied subjects, the method was checked in six samples which gave reproducible values. The method of cortisol extraction from hair cited by Sauve et al was used25 with the exception of the amount of methanol that added; 1 mL25 vs 1.6 mL in this study. After the detection of C-peptide in the hair samples of the subjects, the study was initiated using the same hair sample measurement technique. The six original subjects were not included in this study.
The Participants
In a prospective observational study, 120 healthy people were recruited. This included healthy adults between the ages of 18 and 70, who were family members, friends, hospital and university staff and students. Any subjects who had diabetes, a history of systemic diseases or a recent drug history were excluded from the study, while seven of the 120 were excluded due to insufficient hair samples or the presence of other exclusion criteria. Most of the study participants were female, since the popular hair styles among the young males and the hair loss of the older males meant insufficient hair samples could be obtained.
The research was conducted from February 2019 to August 2019 and the samples were collected at the University of Sulaimani, Shahid Dr. Hemn Hospital and Oxford School, in Sulaymaniyah city, Iraq. All of the participants signed the written consent form and the study was conducted in accordance with the Declaration of Helsinki and was approved by the ethical council of the College of Medicine at the University of Sulaimani.
The subjects were asked to fast overnight and the blood samples were drawn at 9:00 am for the assessment of FBG, FCP and HbA1c, while hair samples were also taken. Data for the questionnaire were obtained from each participant, which included questions related to demographic status and systemic disease or drug use history. All the participants were assessed in terms of height, weight and waist circumference.
The participants were placed in three groups according to age: 18–24, 25–40 and over 40 years. According to their BMI, they were divided into two groups: normal weight (BMI between 18 and 24.9 kg/m2); and overweight or obese (BMI ≥ 25 kg/m2).
Method of hair sampling, collection, preparation and measurement: The hair samples were taken from the posterior scalp in the vortex area. The strips of hair were banded with elastic bands and were cut from the most proximal area of the scalp. The hair samples were then packed in aluminum foil before they were placed in paper envelopes and coded. The envelopes containing the samples were stored in a dark, dry place until the analysis stage began.
For each hair sample, the first proximal 2cm segments were used for analysis. The samples were cut into small pieces (2–3mm) with surgical scissors before they were weighed and placed in a glass tube. The hair samples with a weight of less than 10mg were discarded. Next, 1.6mL of pure methanol was added to each sample, the mixtures were incubated at 52°C for 16 hrs inside a shaking incubator. The samples were then centrifuged with the speed of 10,000 rpm for 5 mins and 1mL of the methanol was extracted from the samples and placed in another glass tube.
The methanol was then allowed to evaporate until the samples were completely dried out and then a phosphate-buffered saline with pH of 8 was added to the precipitant. The mixture was shaken well on a mixer for two 30-second periods to allow all the precipitate to dissolve.
Biochemical Investigation
The hair and serum samples were analyzed using the C-peptide kit from Roche Diagnostics GmbH in Germany and through electrochemiluminescence immunoassay (ECLISA) technology, the COBAS E411 analyzer (Hitachi High-Technologies Corporation). The detection limit of the C-peptide kit was: 0.003–13.3 nmol/L (0.010–40.0 ng/mL) and PreciControl Multimarker used as a control. The C-peptide level results measured in ng/mL were converted to mcg/dl and were then calculated to measure the C-peptide level in terms of picogram per milligram of hair sample. HbA1c and FPG were analyzed by using Absorbance Photometry assay by COBAS C111 HITACHI.
Statistical Analysis
The data were analyzed using SPSS version 22, while the normality test was performed using a Kolmogorov test. All the variables are parametric with the exception of Age, BMI, Hair C-peptide and hair weight. The mean and SD were assessed in terms of all the parametric variables, while the median and ranges were assessed for the non-parametric variable. The comparison between groups was conducted using Independent Sample t-test and ANOVA for parametric variables, while the non-parametric variables were compared using the Kruskal–Wallis H-test and the Mann–Whitney U-test, with a significant level at 0.05.The hair C-peptide log transformed to correct the skewness, and log hair C-peptide used for the correlation analysis among the parametric variables using Pearson’s correlation; except for some non-parametric variables, Spearman correlation were used to correlate them with the hair C-peptide value, where a p value of ≤0.05 was regarded as significant.
Results
Among the 120 subjects who participated in the study, 111 were included in the final analysis after the exclusion of the subjects who fell within the exclusion criteria (7 subjects) and the exclusion of two subjects with extreme hair C-peptide values (over 4 SD of the mean).
The demographic characteristics of the study participants are shown in Table 1, including the age range, which was between 18 and 67 years of age. Their biochemical data are represented in Table 2.
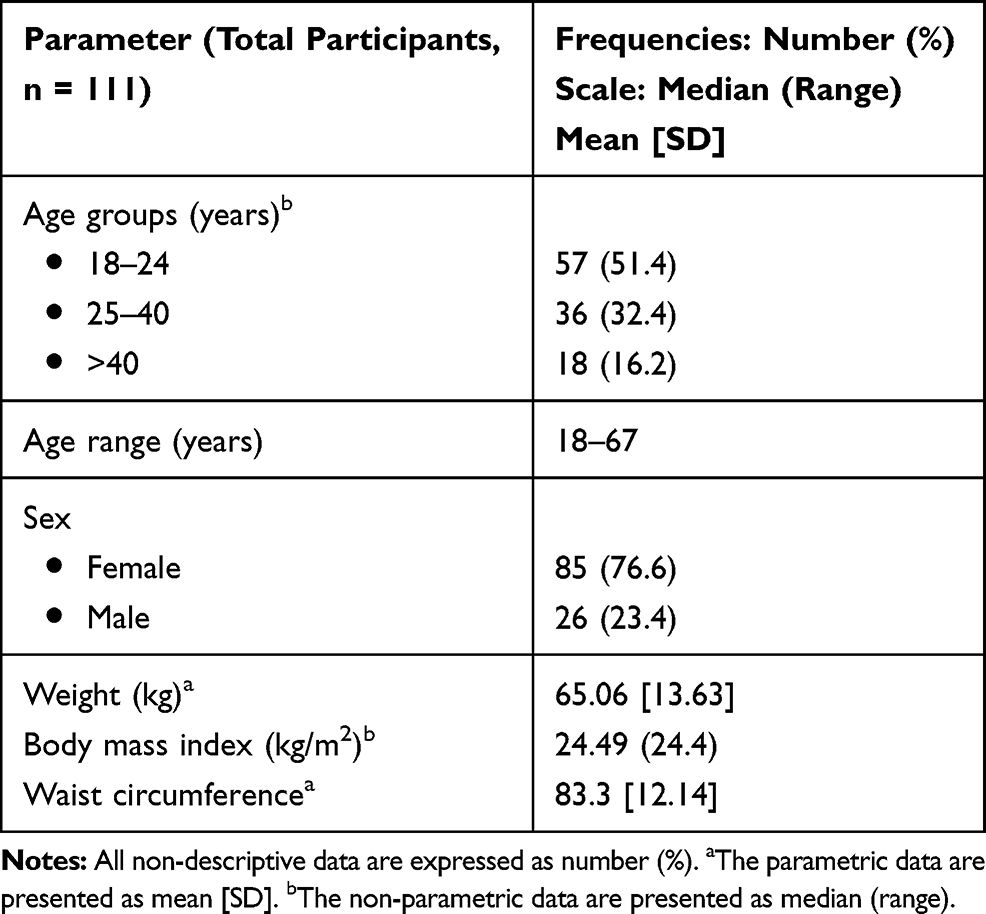 |
Table 1 The Demographic Characteristics of the Study Participants |
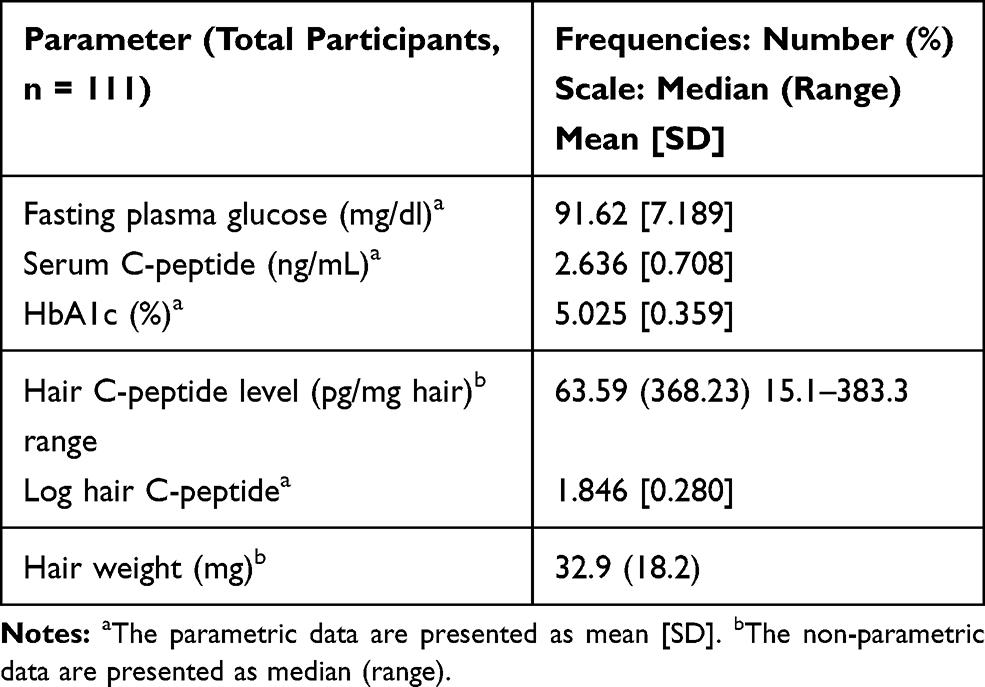 |
Table 2 The Biochemical Data of the Study Participants |
The median hair C-peptide level among the study sample is 63.59 pg/mg hair, with the range of 15.1–383.3 pg/mg hair.
Hair C-peptide was higher with a wider range in males compared with females, but the difference was not significant (Figure 1).
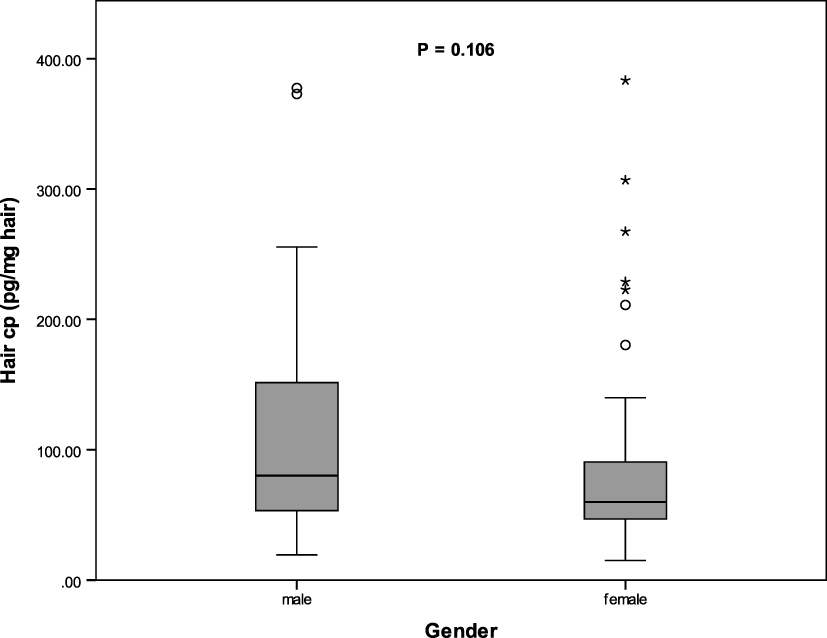 |
Figure 1 Hair C-peptide level among male and female. The median of hair C-peptide level was compared using Mann–Whitney U-test. o mild outlier, * extreme outlier. |
Significant differences among the hair C-peptide levels were found within the different age groups, as is illustrated in Figure 2 (P= 0.026). FPG and HbA1c were higher in age group of >40 years compared to age group of <25 years (FPG: 96.92 vs 90.50, p= 0.021, HbA1c: 5.27 vs 4.84, p =0.001). Serum C-peptide levels were also found to be higher in the age group of >40 years compared to the <25 years age group, p value = 0.330.
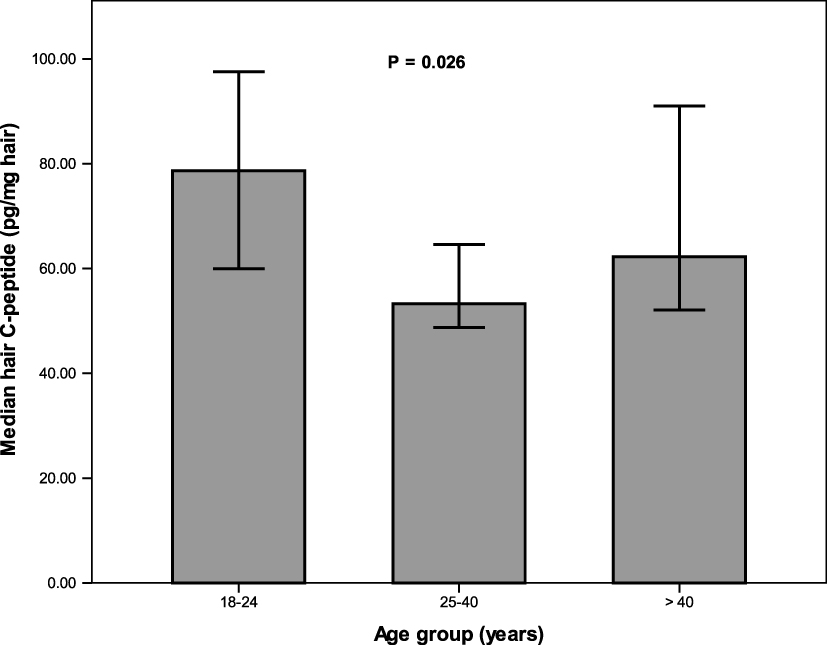 |
Figure 2 Hair C-peptide level among different age groups. The median of hair C-peptide level was compared between groups using Mann–Whitney U-test. |
The median hair C-peptide level was higher in the overweight and obese group than in the normal weight group (P = 0.192), as shown in Figure 3.
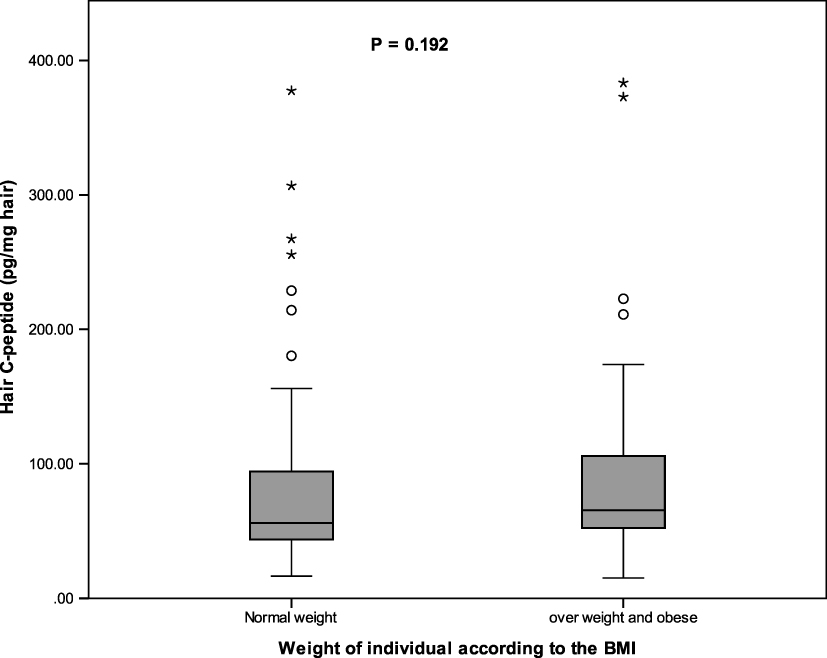 |
Figure 3 Hair C-peptide level among individuals with different BMIs. The median of hair C-peptide level was compared between groups using Mann–Whitney U-test. o mild outlier, * extreme outlier. |
The correlation between biochemical and demographic variables demonstrated in Table 3, and Figure 4 demonstrates a significant positive correlation between the mean of FPG and each of the Hair C-peptide, HBA1c and serum C-peptide (with the P value of 0.029, 0.001 and 0.032, respectively). Hair C-peptide was also negatively correlated with hair sample weight with P = 0.025, as is shown in Figure 5.
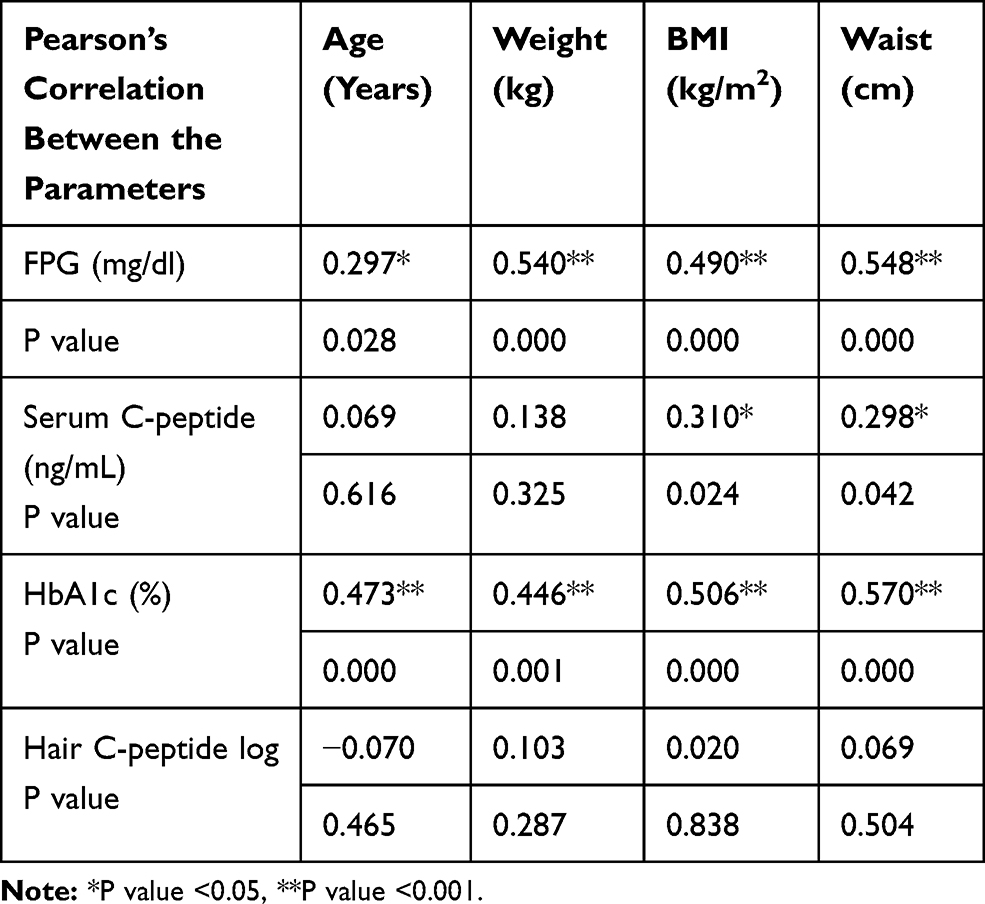 |
Table 3 Correlations Between the Biochemical and Demographic Parameters |
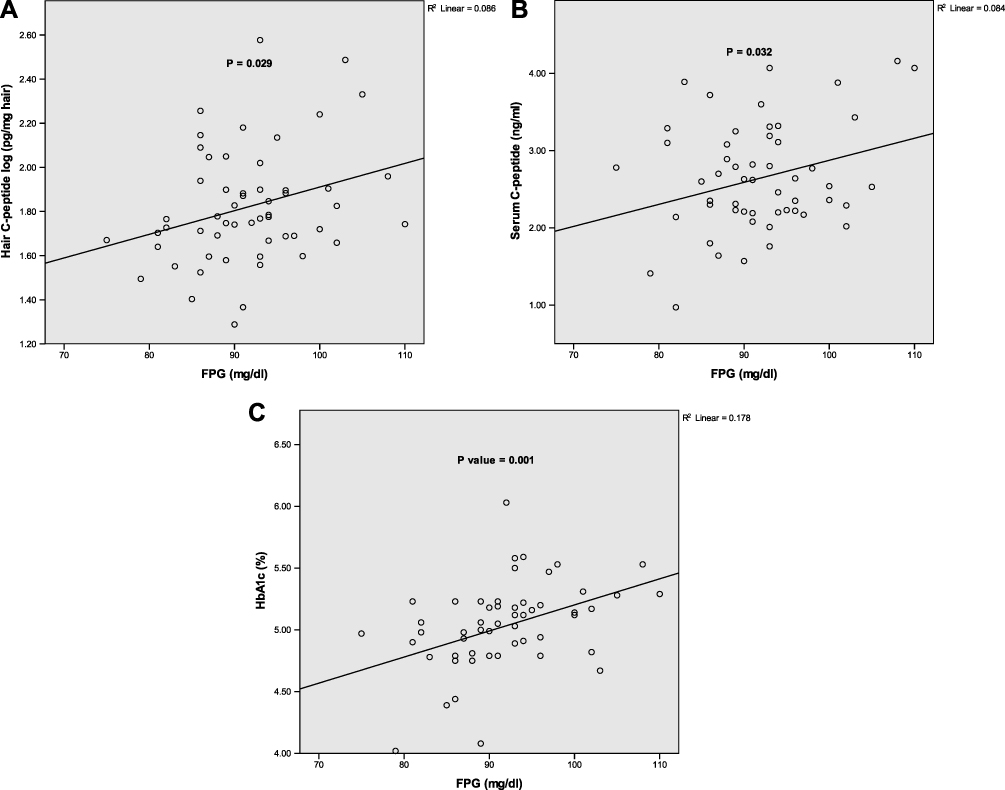 |
Figure 4 Relation of log hair C-peptide (A), serum C-peptide (B) and HbA1c (C) with the fasting plasma glucose (FPG). Pearson’s correlation was used to find the association between the means of the four variables. |
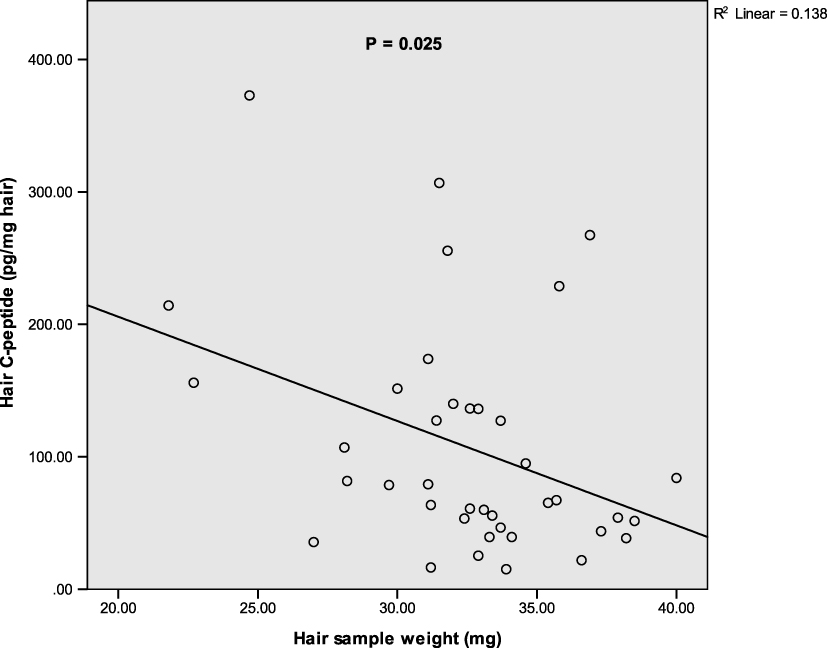 |
Figure 5 A negative correlation between hair sample weight and the hair C-peptide levels. The correlation between the median of hair C-peptide and hair sample weight was used using Spearman correlation. |
Discussion
Previous studies extracted the lipophilic substances, such as steroids, from the hair, as these substances can pass through the cell membrane easily and diffuse through the hair cell.17 However, it is not known whether C-peptide can diffuse to hair and can be detected in hair samples. In fact, to date, there is no published data related to hair C-peptide measurement. It is thus interesting that the authors of this study have found that C-peptide can be detected in the scalp hair samples of human. The hair samples were prepared using the same technique that has been used for other hormone extractions from the hair.
In this study, which involved healthy adults, a median hair C-peptide level of 63.59 pg/mg hair, was found. Meanwhile, the mean fasting serum C-peptide level was 2.63 ng/mL. Hair C-peptide measurement can be supported by studies conducted to measure various hormones in hair samples.14,18,19,21
In the present study, hair C-peptide, HbA1c and FPG levels were found to be significantly higher in people over 40 than their levels in younger individuals. However, adults under 25 have shown a higher hair C-peptide than the other age groups. The significantly higher hair C-peptide, HbA1c and FPG levels of the subjects, who were over 40, could be explained in terms of ageing-related insulin resistance, since it has been well established that insulin resistance increases with age as well as β-cell dysfunction, albeit to varying degrees.28,29 The study subjects were all non-diabetics, meaning they would likely have a natural ability to increase insulin secretion, in order to overcome the insulin resistance.28,30,31 Despite that both age groups (18–24y and 25–40y) showed similar FPG levels, the highest level of hair C-peptide was observed in individuals aged between 18 and 24, while the lowest level was detected in those aged between 25 and 40. The significantly higher hair C-peptide level in the individuals of ≤24 years can likely be explained through the reduction in insulin sensitivity noted in adolescence as among those aged 18–24, majority (75%) were ≤20 years.32 During puberty, and to some extent up to early adulthood, growth hormone and sex hormone levels substantially increase and subsequently antagonize insulin actions.32–34 Normally, a relatively larger amount of endogenous insulin secretion will occur to overcome the reduced insulin sensitivity.32
In this study, fasting serum C-peptide and HbA1c levels have shown a significant correlation with the participant’s weight. Although hair C-peptide did not show positive correlation with subject’s weight, it was found to be numerically higher in overweight/obese participants compared to normal weight subject. Consistently, the existing studies have shown that insulin release is higher in obese people than in non-obese people within the normal range of glycemia.35 Extra fat deposition, especially central obesity, has been linked to an insulin resistance that necessitates increased insulin secretion to maintain normoglycemia.4
The current study also found that hair C-peptide, as for serum C-peptide and HbA1c, is positively associated with FPG level. Although the FPG levels of our studied samples were within the normal range, greater FPG levels were seen in those with higher hair C-peptide concentration. Consistently, previous studies have noted a positive association between FPG and plasma C-peptide levels.36,37
In the present study, a significant negative correlation between hair sample weight and hair C-peptide level was noted. The hair sample weight of 10–60 mg has been used for hormone measurement throughout the existing studies,15–17,23–25 while the slight difference in sample weights within the same study was not believed to have a great effect as corrections were generally made using a specific calculation and were converted into pg/mg of hair sample.23 However, the higher C-peptide levels in the lower weight samples here may be explained through the fact that there was a greater chance of exposure to the extractor solution (methanol) than with the higher weight samples. Thus, the use of an almost fixed hair sample weight for hormone extraction should be considered in order that more accurate and reproducible results can be obtained.
The participant’s glycaemic levels expressed as FPG and HbA1c were found to be correlated with the age, weight, BMI and waist circumference. Consistent with previous studies, FPG has a significantly positive correlation with each of the age and BMI.38,39 In addition, participant age has a significant positive correlation with each of the weights, BMIs and waist circumferences.40 We could not find any significant difference between hair C-peptide levels between male and female. Our result is consistent with a study in Finland, who revealed no significant difference in insulin secretion between male and female.41
Our results need to be cautiously compared to those involving plasma, since while hair C-peptide may represent the retrospective insulin secretion covering weeks or months, including both fasting and prandial peaks, plasma C-peptide indicates insulin secretion during the minutes that immediately precede the blood sampling, which can be substantially affected by concurrent blood glucose concentration.31 In addition, the hair C-peptide was measured in terms of milligrams of hair, while plasma levels are measured in terms of plasma volume.
In this study, we reached the conclusion that hair C-peptide is easily detectable from the scalp hair of humans, a measure which may represent long-term, basal and prandial, endogenous insulin secretion. Interestingly, hair C-peptide, serum C-peptide and HbA1c levels have shown significant correlations with FPG; however, hair C-peptide did not show a significant correlation with serum C-peptide and HbA1c. In addition, hair C-peptide along with HbA1c and FPG levels were found to be significantly higher in subjects above 40 than young adults with the exception of individuals younger than 24 who had higher hair C-peptide level. Although the hair C-peptide was found to be easily detected and related to some important biochemical and demographic variables, further studies are needed to validate this finding and determine normal ranges of hair C-peptide and its associations with relevant health consequences.
In this study for the first time we found that hair C-peptide can be detected in the scalp hair of human, this measure if validated in the future could represent long-term rather than short-term endogenous insulin secretion and therefore may reveal clearer associations between hypo-, eu- and hyper-insulinemia and their relevant complications. Furthermore, the technique of hair sampling is simple compared to that of plasma or urine sampling, since it does not require a fasting state or special sample transference and storage. The detectable amount of C-peptide in more than 100 subjects and its association with FPG and age are all good indicators of the incorporation of the circulating C-peptide into the hair. However, additional studies are required to explore the mechanism of this C-peptide incorporation.
This study has few limitations: the study sample is small, and the hair sample is only taken one time from each individual and most of the participants are female. The hair growth variability between individuals is another limitation of hair analysis for hormone detection.
Further work is recommended to measure the hair C-peptide level in a larger sample that has greater gender and ethnic spread, such that normal limits can be defined. Future studies are suggested to observe the association of hair C-peptide with the standard methods of C-peptide measurement including glucagon-stimulated C-peptide test. It is also recommended for the future researches to involve people with pre-diabetes and diabetes and how hair C-peptide might be of help in the management plan of diabetes. Additionally, further validation of this technique is required by receiving more samples from the same individual and evaluating it in different diseases.
Abbreviations
BMI, Body mass index; C-peptide, Connection peptide; ECLISA, Electrochemiluminescence immunoassay; FPG, Fasting plasma glucose; HbA1c, Haemoglobin A1c.
Data Sharing Statement
The datasets generated and analyzed during the current study are available from the corresponding author (D.S., email: [email protected]) upon request.
Acknowledgments
The authors are grateful to their friends and families for volunteering and offering their support in completing this study. Special thanks go to Mr. Muhammed Musa, lab manager at MediaMed Lab, Sulaymaniyah, for supplying materials used for the extraction procedure. We are also grateful to all the staff at Saman Lab in Sulaymaniyah, who hosted a great part of the study procedure (hair C-peptide extraction and the measurement procedure).
Disclosure
The authors declare there was no conflict of interest to disclose.
References
1. Horwitz DL, Starr JI, Mako ME, Blackard WG, Rubenstein AH. Proinsulin, insulin, and C-peptide concentrations in human portal and peripheral blood. J Clin Invest. 1975;55:1278–1283. doi:10.1172/JCI108047
2. Bonser AM, Garcia-webb P. C-peptide measurement and its clinical usefulness: a review. Ann Clin Biochem. 1981;18:200–206. doi:10.1136/jmg.18.5.386
3. Palmer JP, Fleming GA, Greenbaum CJ, et al. C-peptide is the appropriate outcome measure for type 1 diabetes clinical trials to preserve beta-cell function: report of an ADA workshop, 21–22 October 2001. Diabetes. 2004;53:250–264. doi:10.2337/diabetes.53.1.250
4. Tong J, Fujimoto WY, Kahn SE, et al. Insulin, C-peptide, and leptin concentrations predict increased visceral adiposity at 5- and 10-year follow-ups in nondiabetic Japanese Americans. Diabetes. 2005;54:985–990. doi:10.2337/diabetes.54.4.985
5. Chitturi S, Abeygunasekera S, Farrell GC, et al. NASH and insulin resistance: insulin hypersecretion and specific association with the insulin resistance syndrome. Hepatology. 2002;35:373–379. doi:10.1053/jhep.2002.30692
6. Xu J, Ye Y, Wu H, et al. Association between markers of glucose metabolism and risk of colorectal cancer. BMJ Open. 2016;6:e011430. doi:10.1136/bmjopen-2016-011430
7. Irwin ML, Duggan C, Wang C-Y, et al. Fasting C-peptide levels and death resulting from all causes and breast cancer: the health, eating, activity, and lifestyle study. J Clin Oncol. 2011;29:47–53. doi:10.1200/JCO.2010.28.4752
8. Ma J, Li H, Giovannucci E, et al. Prediagnostic body-mass index, plasma C-peptide concentration, and prostate cancer-specific mortality in men with prostate cancer: a long-term survival analysis. Lancet Oncol. 2008;9:1039–1047. doi:10.1016/S1470-2045(08)70235-3
9. Duggan C, Irwin ML, Xiao L, et al. Associations of insulin resistance and adiponectin with mortality in women with breast cancer. J Clin Oncol. 2011;29:32–39. doi:10.1200/JCO.2009.26.4473
10. Little RR, Wielgosz RI, Josephs R, et al. Implementing a reference measurement system for C-Peptide: successes and lessons learned. Clin Chem. 2017;63:1447–1456. doi:10.1373/clinchem.2016.269274
11. Moore M, Ferguson J, Dougall T, Rigsby P, Burns C; World Health Organization & WHO Expert Committee on Biological Standardization. WHO International Collaborative Study of the Proposed 1st International Standard for Human C-peptide: Expert Committee on Biological Standardization. Geneva; 2015.
12. Jones AG, Hattersley AT. The clinical utility of C-peptide measurement in the care of patients with diabetes. Diabet Med. 2013;30:803–817. doi:10.1111/dme.12159
13. Oram RA, Rawlingson A, Shields BM, et al. Urine C-peptide creatinine ratio can be used to assess insulin resistance and insulin production in people without diabetes: an observational study. BMJ Open. 2013;3:e003193. doi:10.1136/bmjopen-2013-003193
14. Stalder T, Steudte S, Miller R, et al. Intraindividual stability of hair cortisol concentrations. Psychoneuroendocrinology. 2012;37:602–610. doi:10.1016/j.psyneuen.2011.08.007
15. Iglesias S, Jacobsen D, Gonzalez D, et al. Hair cortisol: a new tool for evaluating stress in programs of stress management. Life Sci. 2015;141:188–192. doi:10.1016/j.lfs.2015.10.006
16. Xiang L, Sunesara I, Rehm K, Marshall GD. A modified and cost effective method for hair cortisol analysis. Brain Behav Immun. 2015;49:e2–3. doi:10.1016/j.bbi.2015.06.031
17. Russell E, Kirschbaum C, Laudenslager ML, et al. Toward standardization of hair cortisol measurement. Ther Drug Monit. 2015;37:71–75. doi:10.1097/FTD.0000000000000148
18. Gao W, Stalder T, Foley P, Rauh M, Deng H, Kirschbaum C. Quantitative analysis of steroid hormones in human hair using a column-switching LC–APCI–MS/MS assay. J Chromatogr B. 2013;928:1–8. doi:10.1016/j.jchromb.2013.03.008
19. Wei J, Sun G, Zhao L, et al. Hair thyroid hormones concentration in patients with depression changes with disease episodes in female Chinese. Psychiatry Res. 2014;220:251–253. doi:10.1016/j.psychres.2014.07.029
20. Stalder T, Kirschbaum C, Alexander N, et al. Cortisol in hair and the metabolic syndrome. J Clin Endocrinol Metab. 2013;98:2573–2580. doi:10.1210/jc.2013-1056
21. Zgaga L, Laird E, Healy M. 25-Hydroxyvitamin D measurement in human hair: results from a proof-of-concept study. Nutrients. 2019;11:423. doi:10.3390/nu11020423
22. Koren L, Mokady O, Karaskov T, Klein J, Koren G, Geffen E. A novel method using hair for determining hormonal levels in wildlife. Anim Behav. 2002;63:403–406. doi:10.1006/anbe.2001.1907
23. Meyer J, Novak M, Hamel A, Rosenberg K. Extraction and analysis of cortisol from human and monkey hair. J Vis Exp. 2014;50882. doi:10.3791/50882
24. Wester VL, Staufenbiel SM, Veldhorst MAB, et al. Long-term cortisol levels measured in scalp hair of obese patients. Obesity. 2014;22:1956–1958. doi:10.1002/oby.20795
25. Sauvé B, Koren G, Walsh G, Tokmakejian S, Van Uum SHM. Measurement of cortisol in human hair as a biomarker of systemic exposure. Clin Investig Med. 2007;30:183–191. doi:10.25011/cim.v30i5.2894
26. LeBeau MA, Montgomery MA, Brewer JD. The role of variations in growth rate and sample collection on interpreting results of segmental analyses of hair. Forensic Sci Int. 2011;210:110–116. doi:10.1016/j.forsciint.2011.02.015
27. Webb E, Thomson S, Nelson A, et al. Assessing individual systemic stress through cortisol analysis of archaeological hair. J Archaeol Sci. 2010;37:807–812. doi:10.1016/j.jas.2009.11.010
28. Gumbiner B, Polonsky KS, Beltz WF, Wallace P, Brechtel G, Fink RI. Effects of aging on insulin secretion. Diabetes. 1989;38:1549–1556. doi:10.2337/DIAB.38.12.1549
29. Yates AP, Laing I. Age‐related increase in haemoglobin A1c and fasting plasma glucose is accompanied by a decrease in beta cell function without change in insulin sensitivity: evidence from a cross‐sectional study of hospital personnel. Diabet Med. 2002;19:254–258. doi:10.1046/j.1464-5491.2002.00644.x
30. Fink RI, Revers RR, Kolterman OG, Olefsky JM. The metabolic clearance of insulin and the feedback inhibition of insulin secretion are altered with aging. Diabetes. 1985;34:275–280. doi:10.2337/diab.34.3.275
31. DeFronzo RA, Tobin JD, Andres R. Glucose clamp technique: a method for quantifying insulin secretion and resistance. Am J Physiol. 1979;237:E214–23. doi:10.1152/ajpendo.1979.237.3.E214
32. Kelsey MM, Zeitler PS. Insulin resistance of puberty. Curr Diab Rep. 2016;16:64. doi:10.1007/s11892-016-0751-5
33. Seto-Young D, Paliou M, Schlosser J, et al. Direct thiazolidinedione action in the human ovary: insulin-independent and insulin-sensitizing effects on steroidogenesis and insulin-like growth factor binding protein-1 production. J Clin Endocrinol Metab. 2005;90:6099–6105. doi:10.1210/jc.2005-0469
34. Escobar-Morreale HF, Alvarez-Blasco F, Botella-Carretero JI, Luque-Ramirez M. The striking similarities in the metabolic associations of female androgen excess and male androgen deficiency. Hum Reprod. 2014;29:2083–2091. doi:10.1093/humrep/deu198
35. Stancáková A, Javorský M, Kuulasmaa T, Haffner SM, Kuusisto J, Laakso M. Changes in insulin sensitivity and insulin release in relation to glycemia and glucose tolerance in 6,414 Finnish men. Diabetes. 2009;58:1212–1221. doi:10.2337/db08-1607
36. Chen CH, Tsai ST, Chou P. Correlation of fasting serum C-peptide and insulin with markers of metabolic syndrome-X in a homogenous Chinese population with normal glucose tolerance. Int J Cardiol. 1999;68:179–186. doi:10.1016/S0167-5273(98)00366-0
37. Takita M, Matusmoto S. SUITO Index for evaluation of clinical islet transplantation. Cell Transplant. 2012;21:1341–1347. doi:10.3727/096368912X636885
38. Shimokata H, Muller DC, Fleg JL, Sorkin J, Ziemba AW, Andres R. Age as independent determinant of glucose tolerance. Diabetes. 1991;40:44–51. doi:10.2337/DIAB.40.1.44
39. Petersen KF, Morino K, Alves TC, et al. Effect of aging on muscle mitochondrial substrate utilization in humans. Proc Natl Acad Sci U S A. 2015;112:11330–11334. doi:10.1073/pnas.1514844112
40. Need AG, O’Loughlin PD, Horowitz M, Nordin BEC. Relationship between fasting serum glucose, age, body mass index and serum 25 hydroxyvitamin D in postmenopausal women. Clin Endocrinol (Oxf). 2005;62:738–741. doi:10.1111/j.1365-2265.2005.02288.x
41. Yki-Järvinen H. Sex and insulin sensitivity. Metabolism. 1984;33:1011–1015. doi:10.1016/0026-0495(84)90229-4
 © 2020 The Author(s). This work is published and licensed by Dove Medical Press Limited. The full terms of this license are available at https://www.dovepress.com/terms.php and incorporate the Creative Commons Attribution - Non Commercial (unported, v3.0) License.
By accessing the work you hereby accept the Terms. Non-commercial uses of the work are permitted without any further permission from Dove Medical Press Limited, provided the work is properly attributed. For permission for commercial use of this work, please see paragraphs 4.2 and 5 of our Terms.
© 2020 The Author(s). This work is published and licensed by Dove Medical Press Limited. The full terms of this license are available at https://www.dovepress.com/terms.php and incorporate the Creative Commons Attribution - Non Commercial (unported, v3.0) License.
By accessing the work you hereby accept the Terms. Non-commercial uses of the work are permitted without any further permission from Dove Medical Press Limited, provided the work is properly attributed. For permission for commercial use of this work, please see paragraphs 4.2 and 5 of our Terms.