")
Back to Journals » Drug Design, Development and Therapy » Volume 14
Design, Synthesis and Biological Evaluation of New HDAC1 and HDAC2 Inhibitors Endowed with Ligustrazine as a Novel Cap Moiety
Authors Al-Sanea MM , Gotina L, Mohamed MFA , Grace Thomas Parambi D, Gomaa HAM, Mathew B, Youssif BGM , Alharbi KS , Elsayed ZM, Abdelgawad MA , Eldehna WM
Received 9 November 2019
Accepted for publication 6 January 2020
Published 4 February 2020 Volume 2020:14 Pages 497—508
DOI https://doi.org/10.2147/DDDT.S237957
Checked for plagiarism Yes
Review by Single anonymous peer review
Peer reviewer comments 2
Editor who approved publication: Dr Tuo Deng
Mohammad M Al-Sanea,1 Lizaveta Gotina,2 Mamdouh FA Mohamed,3 Della Grace Thomas Parambi,1 Hesham A M Gomaa,4,5 Bijo Mathew,6 Bahaa G M Youssif,7 Khalid Saad Alharbi,8 Zainab M Elsayed,9 Mohamed A Abdelgawad,1,10 Wagdy M Eldehna9,11
1Department of Pharmaceutical Chemistry, College of Pharmacy, Jouf University, Sakaka, Aljouf 2014, Saudi Arabia; 2Division of Bio-Medical Science & Technology, KIST School, Korea University of Science and Technology (UST), Daejeon, Korea; 3Department of Pharmaceutical Chemistry, Faculty of Pharmacy, Sohag University, Sohag 82524, Egypt; 4Department of Pharmacology, College of Pharmacy, Jouf University, Sakaka, Aljouf 2014, Saudi Arabia; 5Department of Biochemistry, Faculty of Pharmacy, Nahda University, Beni-Suef, Egypt; 6Division of Drug Design and Medicinal Chemistry Research Lab, Department of Pharmaceutical Chemistry, Ahalia School of Pharmacy, Palakkad, Kerala 678557, India; 7Department of Pharmaceutical Organic Chemistry, Faculty of Pharmacy, Assiut University, Assiut 71526, Egypt; 8Department of Pharmacology, College of Pharmacy, Jouf University, Sakakah 72341, Saudi Arabia; 9Scientific Research and Innovation Support Unit, Faculty of Pharmacy, Kafrelsheikh University, Kafrelsheikh, Egypt; 10Department of Pharmaceutical Organic Chemistry, Beni-Suef University, Beni-Suef 62514, Egypt; 11Department of Pharmaceutical Chemistry, Faculty of Pharmacy, Kafrelsheikh University, Kafrelsheikh, Egypt
Correspondence: Mohammad M Al-Sanea
Department of Pharmaceutical Chemistry, College of Pharmacy, Jouf University, Sakaka, Aljouf 2014, Saudi Arabia
Tel +966 594076460
Email [email protected]
Introduction: Histone deacetylases (HDACs) represent one of the most validated cancer targets. The inhibition of HDACs has been proven to be a successful strategy for the development of novel anticancer candidates.
Methods: This work describes design and synthesis of a new set of HDAC inhibitors ( 7a-c and 8a, b) utilizing ligustrazine as a novel cap moiety, and achieving the pharmacophoric features required to induce the desired inhibition.
Results: The newly synthesized derivatives were evaluated for their potential inhibitory activity toward two class I histone deacetylases, namely HDAC1 and HDAC2. The tested ligustrazine-based compounds were more potent toward HDAC2 (IC50 range: 53.7– 205.4 nM) than HDAC1 (IC50 range: 114.3– 2434.7 nM). Furthermore, the antiproliferative activities against two HDAC-expressing cancer cell lines; HT-29 and SH-SY5Y were examined by the MTT assay. Moreover, a molecular docking study of the designed HDAC inhibitors ( 7a-c and 8a,b) was carried out to investigate their binding pattern within their prospective targets; HDAC1 (PDB-ID: 4BKX) and HDAC2 (PDB-ID: 6G3O).
Discussion: Compound 7a was found to be the most potent analog in this study toward HDAC1 and HDAC2 with IC50 values equal 114.3 and 53.7 nM, respectively. Moreover, it was the most effective counterpart (IC50 = 1.60 μM), with 4.7-fold enhanced efficiency than reference drug Gefitinib (IC50 = 7.63 μM) against SH-SY5Y cells. Whereas, compound 8a (IC50 = 1.96 μM) was the most active member toward HT-29 cells, being 2.5-times more potent than Gefitinib (IC50 = 4.99 μM). Collectively, these results suggest that 7a merits further optimization and development as an effective new HDACI lead compound.
Keywords: HDACs Inhibitors, Ligustrazine, Anticancer agents, In silico study, Synthesis
Introduction
Health and diseases are always governed by the highly intricate and regulated actions of a wide armory of transcription factors. The fundamental organic structure of DNA is the nucleosome, which consists of strands of DNA wrapped around a core of 8 histone proteins.1 The amino acid residues protruded from the ‘N- and ‘C- on the histone tail are modified by enzyme-driven post-translational acetylation, methylation, and phosphorylation.2,3 These modifications increase the accessibility of transcription factors to gene promoter regions. Deacetylation, demethylation, and dephosphorylation of histones have the opposite effect of decreasing access of transcription factors to promoter regions. Emerging data now implicate histone modification in the pathobiology of cancer and other diseases. Histone acetylation is mediated by histone acetyltransferases, while acetyl groups are removed by histone deacetylases (HDACs). Recently, the use of HDACs as targeted agents has gained much popularity as a more safe and effective alternative for cancer therapy than classical agents.4–7 Because of the cellular overexpression of HDACs has been reported in the vast majority of human tumors, there is substantial interest to develop more selective and potent inhibitors for these enzymes.6,7
HDAC is known to have 18 isoforms classified into 4 classes (class I-IV) and among these 4 classes, mainly class I is proven to be associated with tumor proliferation.8 It is hypothesized that HDAC-isoform-selective inhibitors would have improved efficacy and minimal adverse effects; thus, isoform-selective compounds have been developed. To date, a few HDAC inhibitors have approved by FDA which include: Vorinostat (Zolinza®) and Romidepsin (Istodax®) for cutaneous T- cell lymphoma,9,10 Panobinostat (Farydak®) for multiple myeloma,11 in addition to Belinostat (Beleodaq®) and Chidamide (Epidaza®) both for use in peripheral T-cell lymphoma.12,13
Generally, the essential topological pharmacophoric features for HDAC inhibitors (HDACIs) contain four basic components. The first one is the zinc-binding group (ZBG) that coordinates the Zn2+ at the bottom of the enzyme cavity; the second one is a cap group (CAP) that interacts with the rim of the catalytic tunnel of the enzyme; the third one is a polar connection unit (CU, apparently dispensable for HDAC8 selective inhibitors) connecting to the fourth pharmacophore which is a linker (hydrophobic spacer) enabling the inhibitor to lie into the aforementioned tunnel (Figure 1).6
Ligustrazine (TMP, 2,3,5,6-tetramethylpyrazine) is originally a natural product extracted from Ligusticum chuanxiong Hort, a Chinese traditional medicinal herb, that is widely used as clinical medication for occlusive cerebrovascular diseases.14 Ligustrazine has recently been reported to be a well-validated adjuvant in the reversal of multidrug resistance (MDR) in tumor cells, in addition to its ability to inhibit growth, invasion and metastasis of tumor cells.15,16 Accordingly, ligustrazine has attracted considerable attention as a privileged scaffold in cancer drug discovery. In this context, several studies reported the development of different ligustrazine-based hybrids such as ligustrazine-curcumin hybrids,17,18 ligustrazine-terpenes hybrids19 and others.20,21
The aforementioned findings have inspired and guided us to design and synthesize a new set of HDAC inhibitors (7a-c and 8a,b) utilizing ligustrazine as a novel cap moiety, and achieving the pharmacophoric features required to induce the desired inhibition (Figure 1). The newly synthesized ligustrazine-based derivatives (7a-c and 8a,b) were evaluated for their potential inhibitory activity toward two class I histone deacetylases, namely HDAC1 and HDAC2. Furthermore, their antiproliferative activities against two HDAC-expressing cancer cell lines, colorectal adenocarcinoma (HT-29) and neuroblastoma (SH-SY5Y) cell lines, were examined by the MTT assay.
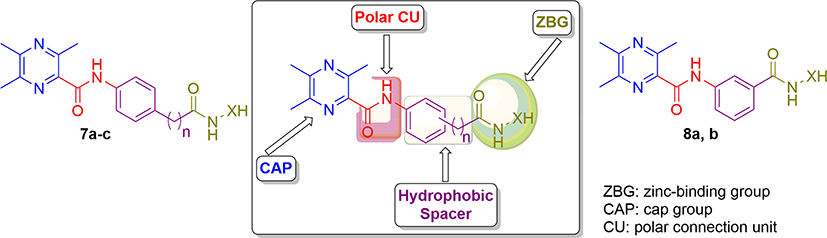 |
Figure 1 Design and general structures of target compounds (7a-c and 8a, b). |
Materials and Methods
Chemistry
Melting points were determined on an electrothermal melting point apparatus (Stuart Scientific Co.) and were uncorrected. NMR spectra were recorded on a Bruker Avance III HD NMR spectrometer. 1H spectrum was run at 400 MHz and 13C spectrum was run at 100 MHz in deuterated dimethylsulfoxide (DMSO-d6). Chemical shifts were expressed in ppm using the solvent peak as internal standard.22 All coupling constant (J) values were given in hertz. The abbreviations used are as follows: s, singlet; d, doublet; m, multiplet. Analytical thin-layer chromatography (TLC) on silica gel plates containing UV indicator was employed routinely to follow the course of reactions.
Synthesis of 3,5,6-Trimethylpyrazine-2-Carboxylic Acid 2
To a solution of TMP (5 g, 36.8 mmol) in water (200 mL), aqueous KMnO4 solution (8.6 g KMnO4: 150 mL water) was added dropwise at room temperature (r.t.) over about 60 min. Upon completion of the addition, the mixture was stirred at 50°C for 12 h, and then the warm reaction mixture was filtered and washed with hot water (300 mL, 90°C). The filtrate and washing liquid were combined, cooled to 0–5°C, and the pH adjusted to 2.0 with concentrated hydrochloric acid. Extraction was performed with ethyl acetate (200 mL × 3), and the organic phase was dried with anhydrous sodium sulfate. The solvent was removed by distillation under vacuum, and the residue was recrystallized from acetone to produce a light-yellow solid (2.39 g, yield: 48%), m.p.: 162–163°C as reported.19
Synthesis of Key Intermediates 4a, b and 6
3,5,6-Trimethylpyrazine-2-carboxylic acid 2 (1.66 g, 10 mmol) was added to a suspension of 1,1-carbonyldiimidazole (CDI, 50 mmol) in dry tetrahydrofuran (THF, 20 mL) and the mixture was stirred for 2 h at r.t. Then, the corresponding acid (50 mmol) and trifluoroacetic acid (TFA, 2.4 mL) were added and stirred for additional 10 h at r.t. The reaction mixture was evaporated to afford the key intermediates 4a,b and 6 that used in the next step without further purification.
Synthesis of Target HDAC Inhibitors 7a-c and 8a,b
To a suspension of key intermediates 4a,b and 6 (5 mmol) in dry THF (10 mL), CDI (19 mmol) was added, and the mixture was stirred for 3 h at 60°C. The clear solution was cooled to r.t. then hydrazine hydrate hydrochloride or hydroxylamine hydrochloride (25 mmol) was added. The reaction mixture was stirred for 6 h then evaporated to remove THF, and the crude product was stirred in water for 1 h and filtered and dried. The residue was purified by column chromatography using dichloromethane: methanol (9:1) to furnish target compounds 7a-c and 8a,b.
Yield 55%, m.p. >250°C; 1H NMR (DMSO-d6, 400 MHz) δ ppm: 2.54 (s, 3H, 6-CH3), 2.56 (s, 3H, 5-CH3), 2.71 (s, 3H, 3-CH3), 4.53 (bs, NH2), 7.52–7.90 (m, 4H, Ar-H), 9.67 (s, 1H, NHNH2), 10.59 (s, 1H, NHCO); 13C NMR (DMSO-d6, 100 MHz) δ ppm: 21.44 (6-CH3), 22.12 (5-CH3), 22.33 (3-CH3), 119.67, 128.19, 128.80, 141.05, 141.80, 148.71, 149.86, 154.57, 164.61 (C=O), 165.93 (C=O).
Yield 60%, m.p. >250°C; 1H NMR (DMSO-d6, 400 MHz) δ ppm: 2.54 (s, 3H, 6-CH3), 2.56 (s, 3H, 5-CH3), 2.71 (s, 3H, 3-CH3), 3.57 (s, 2H, CH2CO), 7.08 (s, 1H, NHOH), 7.18–7.76 (m, 4H, Ar-H), 10.03 (s, 1H, NHCO), 10.58 (s, NHOH); 13C NMR (DMSO-d6, 100 MHz) δ ppm: 21.44 (6-CH3), 22.09 (5-CH3), 22.57 (3-CH3), 29.50 (CH2CO), 119.50, 120.42, 129.83, 131.28, 131.93, 137.51, 138.11, 141.42, 149.62, 154.28, 167.60 (C=O), 169.53 (C=O).
Yield 48%, m.p. >250°C; 1H NMR (DMSO-d6, 400 MHz) δ ppm: 2.51 (s, 3H, 6-CH3), 2.54 (s, 3H, 5-CH3), 2.71 (s, 3H, 3-CH3), 3.57 (s, 2H, CH2CO), 4.39 (bs, NH2), 7.08 (s, 1H, NHOH), 7.17–7.74 (m, 4H, Ar-H), 9.12 (s, 1H, NHNH2), 10.03 (s, 1H, NHCO); 13C NMR (DMSO-d6, 100 MHz) δ ppm: 21.45 (6-CH3), 22.10 (5-CH3), 22.30 (3-CH3), 119.49, 120.41, 129.63, 129.83, 137.52, 138.07, 148.63, 149.62, 164.29 (C=O), 169.50 (C=O).
Yield 52%, m.p. >250°C; 1H NMR (DMSO-d6, 400 MHz) δ ppm: 2.51 (s, 3H, 6-CH3), 2.55 (s, 3H, 5-CH3), 2.72 (s, 3H, 3-CH3), 7.72 (s, 1H, NHOH), 7.18–7.76 (m, 4H, Ar-H), 9.10 (s, 1H, NHOH), 10.36 (s, 1H, NHCO).
Yield 45%, m.p. >250°C; 1H NMR (DMSO-d6, 400 MHz) δ ppm: 2.50–252 (3, 9H, 3(CH3)), 4.49 (s, 2H, NH2), 7.35–7.87 (m, 4H, Ar-H), 8.81 (s, 1H, NHNH2), 9.69 (s, 1H, NHCO).
Biological Evaluations
Evaluation of Inhibitory Activity Against HDAC1 and HDAC2
All the newly synthesized ligustrazine-based derivatives (7a-c and 8a,b) were evaluated for their potential inhibitory activity toward HDAC1 and HDAC2 as the following. Ten microliters of diluted Trichostatin A was added to two of the positive control wells and to two of each of the sample wells. Trichostatin A eliminated all HDAC activity and was used as a control for generating the sample background values. 10 µL of diluted Assay Buffer was added to the positive control and sample wells that were not treated with Trichostatin A. Reactions were initiated after the addition of 10 µL of HDAC substrate to all the wells being used including the standard wells. The final concentration of substrate was 200 µM in the wells. The plate was covered and incubated on a shaker for 30 min at 37°C. Then, the plate cover was removed and 40 µL of developer was added and incubated for 15 min at room temperature.23 Fluorescence was measured by spectrophotometry at an excitation wavelength of 340–360 nm and an emission wavelength of 440–465 nm. The average fluorescence of the Trichostatin-treated samples were subtracted from the average fluorescence of its corresponding samples to yield the corrected sample fluorescence (CSF). Finally, the HDAC activity was calculated using the following equation: HDAC Activity (nmol/min/mL) = [µM/30 min] × sample dilution. One unit is defined as the amount of enzyme that caused the formation of 1.0 nmol of deacetylated compound per minute at 37°C.
In vitro Antiproliferative Activity
Ligustrazine-based derivatives (7a-c and 8a,b) were evaluated for their antiproliferative potency toward colorectal (HT-29) and neuroblastoma (SH-SY5Y) cancer cell lines. Both cell lines were obtained from American Type Culture Collection (ATCC). Cells were cultured using DMEM (Invitrogen, Life Technologies) supplemented with 10% FBS (Hyclone), 10 ug/mL of insulin (Sigma), and 1% penicillin-streptomycin. All of the other chemicals and reagents were from Sigma, or Invitrogen. Plate cells (cell density: 1.2–1.8 x 10⁴/well) in a volume of 100-µL complete growth medium + 100 µL of the tested compound per well in a 96-well plate for 24 h before the assay. Antiproliferative activity of compounds (7a-c and 8a,b) was evaluated following the protocol of MTT (3-[4,5-dimethylthiazol-2-yl]-2,5-diphenyltetrazolium bromide) reduction assay, as reported previously.24–26
Molecular Docking
All molecular docking simulations were performed in the molecular operating environment (MOE).27 The crystal structures of HDAC1 and HDAC2 (PDB ID: 4BKX and 6G3O, respectively) were downloaded from the RCSB Protein Data Bank. The structures were chosen based on crystal structure resolution and 2D similarity of the co-crystallized ligand to the target compounds. Prior to docking simulations, the proteins were prepared according to the following protocol. All water molecules and ligands were removed, except for the Zn ion. Afterward, the hydrogen atoms were added and the protein structure was protonated using the Protonate 3D tool at a temperature of 300K, pH of 7.0 and ion concentration of 0.1 mol/L. The Site Finder tool was used to determine the protein–ligand binding site, which included 19 residues of the ligand-binding pocket. The 2D structures of the ligustrazine-based derivatives (7a-c and 8a,b) and their tautomers were constructed using the Builder tool and energy minimized under the MMFF94x force field and 0.05 rmsd gradient.
The docking protocol included several steps. The first placement of the generated 3D conformations in the protein active site was done by the Triangle Matcher placement method. The favorability of the generated poses was scored by the London dG scoring function, which estimated the binding free energy of the ligand from a given pose. The 30 best-scoring poses underwent further refinement by the MMFF94x force field minimization and subsequent re-scoring by the Affinity dG scoring function. The final poses were evaluated according to the Affinity dG docking score (S), which estimates the enthalpic contribution to ligand-binding free energy as a sum of the hydrogen bond, ionic, metal ligation, hydrophobic and Van der Waals favorable interactions and unfavorable interactions between polar and hydrophobic atoms.
The docking method was verified by performing re-docking of the co-crystallized squaramide inhibitor28 from the HDAC2 structure (PDB ID: 6G3O). Under given docking parameters, the predicted dock pose retained the key interactions from the initial crystal structure (Figure 2), and heavy atom RMSD between the co-crystal and dock pose was 0.8784 Å, with most of the deviations occurring in the solvent-exposed region of the binding site.
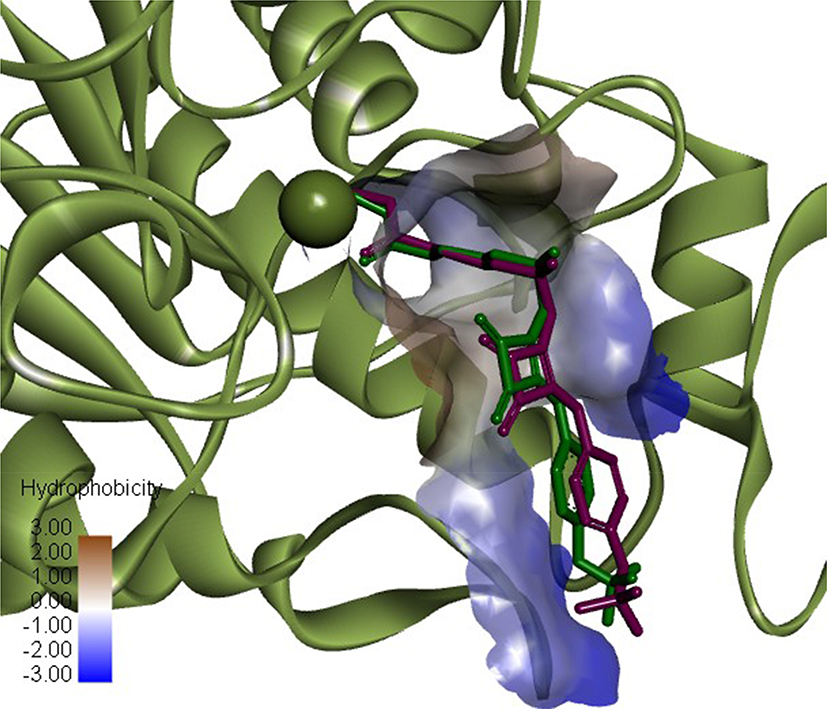 |
Figure 2 Superimposition of HADC2 inhibitor co-crystal conformation (green) and predicted dock conformation (purple). Zn atom showed as green sphere (PDB ID: 6G3O). Image prepared in Discovery Studio Visualizer. |
Result and Discussion
Chemistry
The synthetic pathway adopted for the preparation of the key intermediates and target ligustrazine-based HDACIs (7a-c and 8a,b) is depicted in Scheme 1. Synthesis was initiated by oxidation of ligustrazine 1 with hot KMnO4 solution to afford 3,5,6-trimethylpyrazine-2-carboxylic acid 2.19 Then, carboxylic acid 2 underwent coupling with p-aminobenzoic acid 3a, p-aminophenylacetic acid 3b, and m-aminobenzoic acid 4 via 1ʹ-carbonyldiimidazole (CDI) to furnish the key intermediates 4a,b and 6, respectively. Then, the target ligustrazine-based HDACIs (7a-c and 8a, b) were obtained, with 45–60% yield, via coupling of key intermediates 4a,b and 6 with hydrazine hydrate or hydroxylamine by the use of CDI (Scheme 1).
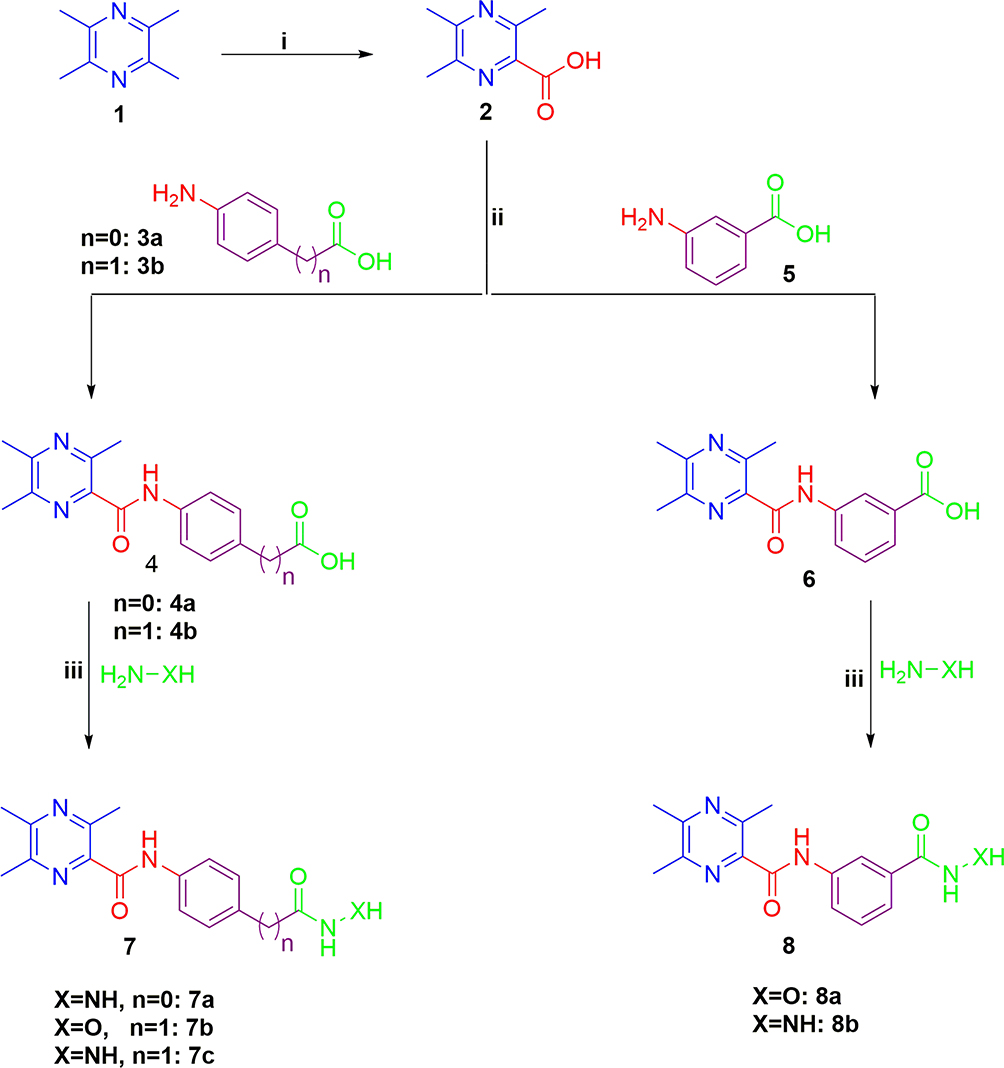 |
Scheme 1 Synthesis of target HDAC inhibitors 7a-c and 8a,b; Reagents and conditions: (i) KMnO4 solution, heating 50°C 12 h, (ii) CDI, THF, r.t. 2 h, then TFA, r.t.10 h, (iii) THF, CDI, 60°C 6 h. |
HNMR spectra of 7a and 7c, and 8b showed new peaks at δ 4.53, 4.39 and 4.49, respectively, equivalent to NH2 protons but at δ 9.67, 9.12 and 8.81 represent NHNH2 consequently. The characteristic OH peak of 7c and 8a appeared down filed at δ 10.58 and 9.10, respectively. New other NH (NHOH) peaks of 7b and 8b appeared at δ 7.08 and 7.72, respectively. The mentioned new HNMR peaks confirmed the structure of 7a-c and 8 a and b, and reactional conversion of 4a and b to 7a-c and 6 to 8a and b.
Biological Evaluation
Evaluation of Inhibitory Activity Against HDAC1 and HDAC2
All the newly synthesized ligustrazine-based derivatives (7a-c and 8a,b) were evaluated for their potential inhibitory activity toward HDAC1 as well as toward HDAC2. The inhibitory activities were compared to Dacinostat, a clinically used standard HDAC inhibitor. Table 1 displays the half-maximal inhibitory concentration data (IC50 values) for the examined compounds and Dacinostat towards HDAC1 and HDAC2.
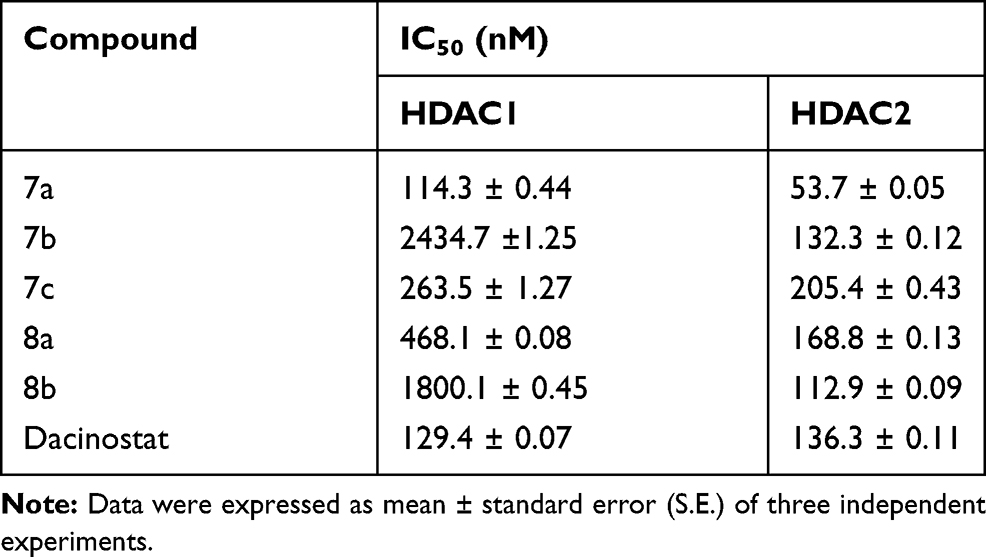 |
Table 1 HDAC1 and HDAC2 Inhibitory Activities of the Newly Synthesized Ligustrazine-Based Derivatives 7a-7c and 8a, b |
The data displayed in Table 1 showed excellent to weak inhibitory activities against both HDAC1 and HDAC2. Investigation of the obtained IC50 values revealed that the tested ligustrazine-based compounds were more potent toward HDAC2 (IC50 range: 53.7–205.4 nM) than HDAC1 (IC50 range: 114.3–2434.7 nM). In particular, compound 7a was found to be the most potent analog in this study toward HDAC1 and HDAC2 with IC50 values equal 114.3 and 53.7 nM, respectively. In addition, compounds 7b and 8b displayed more potent HDAC2 inhibitory activity (IC50 = 112.9 and 132.3 nM, respectively) than the standard drug Dacinostat (IC50 = 112.86 nM). On the other hand, compounds 7c and 8a showed moderate inhibitory activity toward HDAC1 with IC50 = 263.5 and 468.1 nM, respectively, whereas, compounds 7b and 8b exhibited weak HDAC1 inhibitory activity (IC50 = 2434.7 and 1800.1 nM, respectively)
It is noteworthy that shifting of hydrazide ZBG from para (7a) to meta (8b) position resulted in a 15.7-fold and 2.1-fold worsening of effectiveness against HDAC1 and HDAC2, respectively. Analogously, extending the hydrophobic spacer from phenyl (7a) to benzyl (7c) moiety resulted in a reduced inhibitory activity toward both HDAC1 and HDAC2.
In vitro Antiproliferative Activity
Ligustrazine-based derivatives (7a-c and 8a,b) were evaluated for their antiproliferative potency toward two HDAC-expressing cancer cell lines;29,30 colorectal (HT-29) and neuroblastoma (SH-SY5Y) cell lines, utilizing the 3-(4,5-dimethylthiazol-2-yl)-2,5-diphenyltetrazolium bromide (MTT) colorimetric assay [24]. The clinically used anticancer drug Gefitinib was co-assayed as a reference drug. The growth inhibitory activities of the tested ligustrazine-based derivatives against the two cancer cell lines were measured as IC50 values (μM), which represent the compound concentration required to produce a 50% inhibition of cell growth after 48 h of incubation, compared to untreated controls, and listed in Table 2.
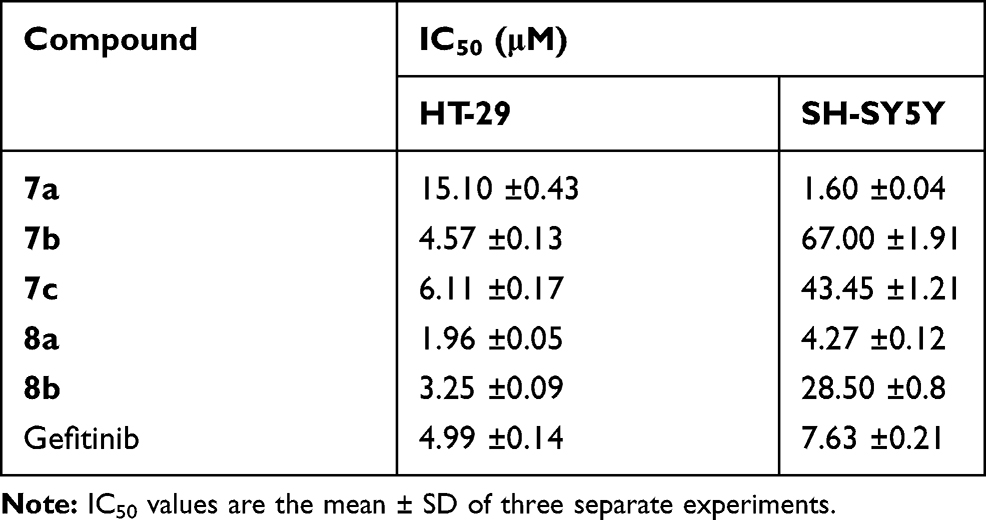 |
Table 2 In vitro Antiproliferative Activities of Compounds 7a-7c and 8a, b Against HT-29 and SH-SY5Y Cancer Cell Lines |
Investigations of the results of the MTT assay highlighted that the tested ligustrazine-based derivatives (7a-c and 8a,b) were more effective toward colorectal HT-29 cells than neuroblastoma SH-SY5Y cells, except compound 7a which possessed much enhanced growth inhibitory activity against SH-SY5Y (IC50 = 1.60±0.04 µM) than HT-29 cells (IC50 = 15.10±0.43 µM). Regarding the antiproliferative activity against colorectal HT-29 cells, compound 8a (IC50 = 1.96±0.05 µM) was found to be the most active member in this study, being 2.5-times more potent than reference drug Gefitinib (IC50 = 4.99±0.14 µM). Also, compounds 7b and 8b displayed higher antiproliferative activities (IC50 = 4.57 ±0.13 and 3.25 ±0.09 µM, respectively) than reference drug Gefitinib in HT-29 cell line.
On the other hand, exploring the antiproliferative activity toward neuroblastoma SH-SY5Y cells revealed that compound 7a was the most effective counterpart (IC50 = 1.60±0.04 µM), with 4.7-fold enhanced efficiency than Gefitinib (IC50 = 7.63±0.21 µM) against SH-SY5Y cells. Moreover, compound 8a possesses higher activity to Gefitinib with IC50 = 4.27 ±0.12 µM. Whereas, compounds 7b, 7c and 8b displayed moderate growth inhibitory activity toward SH-SY5Y with IC50 values equal 4.57±0.13, 6.11±0.17 and 3.25±0.09 µM, respectively.
Molecular Modeling
Comparison of HDAC1 and HDAC2 Sequences and Structure Overlap
The sequences of HDAC1 and HDAC2 are highly conserved (sequence identity: 93.8% and sequence similarity: 98.1%). Within 8 Å radius from the center of the active site, there is only 1 sequence difference: Ser263 (HDAC1) vs Ala268 (HDAC2), which does not cause significant structural changes in the backbone position of active site residues. Most structural deviation occurs in residues Asp104, His146, Phe155, His183, Tyr209, Phe210 according to HDAC2 numbering. Three-dimensional figures viewed from different angles (A,B, C) were grouped and depicted clearly in Figure 3. The resolution of the HDAC1 crystal structure (3 Å) is a limitation that does not allow comparing the structures with full confidence.
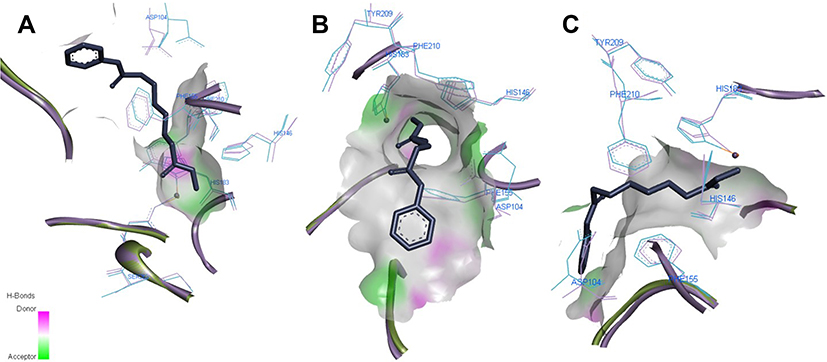 |
Figure 3 Comparison of HDAC1 (blue) and HDAC2 (purple) structures from different angles (A–C). Residues are labeled according to HDAC2 numbering, co-crystal ligand represented in stick view, Zn atom – as red bead. Images prepared in Discovery Studio Visualizer. |
Molecular Docking Studies
The binding orientations of the ligustrazine-based derivatives (7a-c and 8a,b) and their possible tautomeric forms were predicted using MOE under default docking placement parameters, followed by the force field pose refinement stage and re-scoring by the Affinity dG scoring function. The capability of the chosen docking protocol to correctly rank the compounds by their binding affinity (scoring power) is illustrated in Figure 4. In the cases of both HDAC1 and HDAC2 docking, the most and least potent compounds were correctly ranked with sufficient difference in dock score (S). The overall correlation coefficient R2 (0.61 and 0.74 for HDAC1 and HDAC2, respectively) is as well- or higher-performing than the recent evaluation of scoring power done by Huo et al31 on a diverse set of protein-ligand complexes for 10 commercially available and academic docking programs. Together with the ability to correctly reproduce the binding pose of the known squaramide inhibitor (see details in Methods section), these findings indicate that the generated 3D ligand binding poses are trustworthy and can be used to explain the true protein–ligand binding interactions. The dock scores (S) and a list of the highly contributing interactions of the ZBG for each of the ligustrazine-based derivatives (7a-c and 8a,b) are presented in Tables 3 and 4.
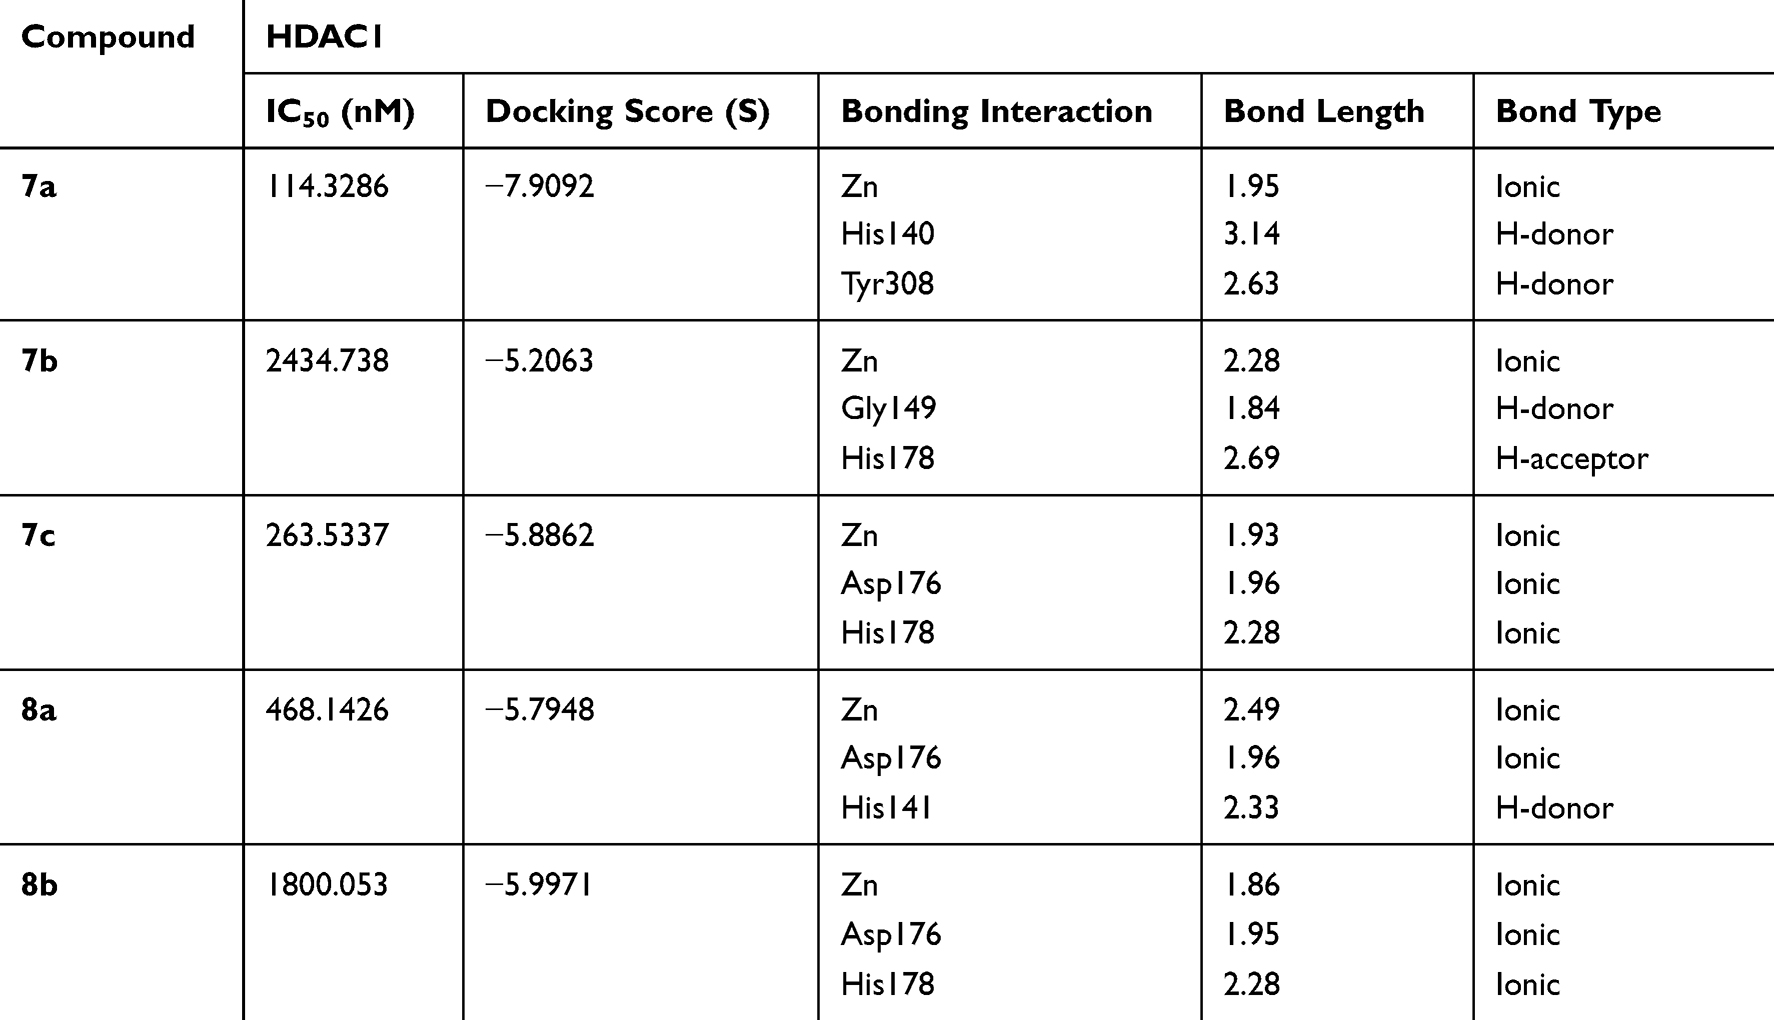 |
Table 3 Docking Results and Characteristic of the Strongest Interactions of ZBG of Target Compounds Within HDAC1 |
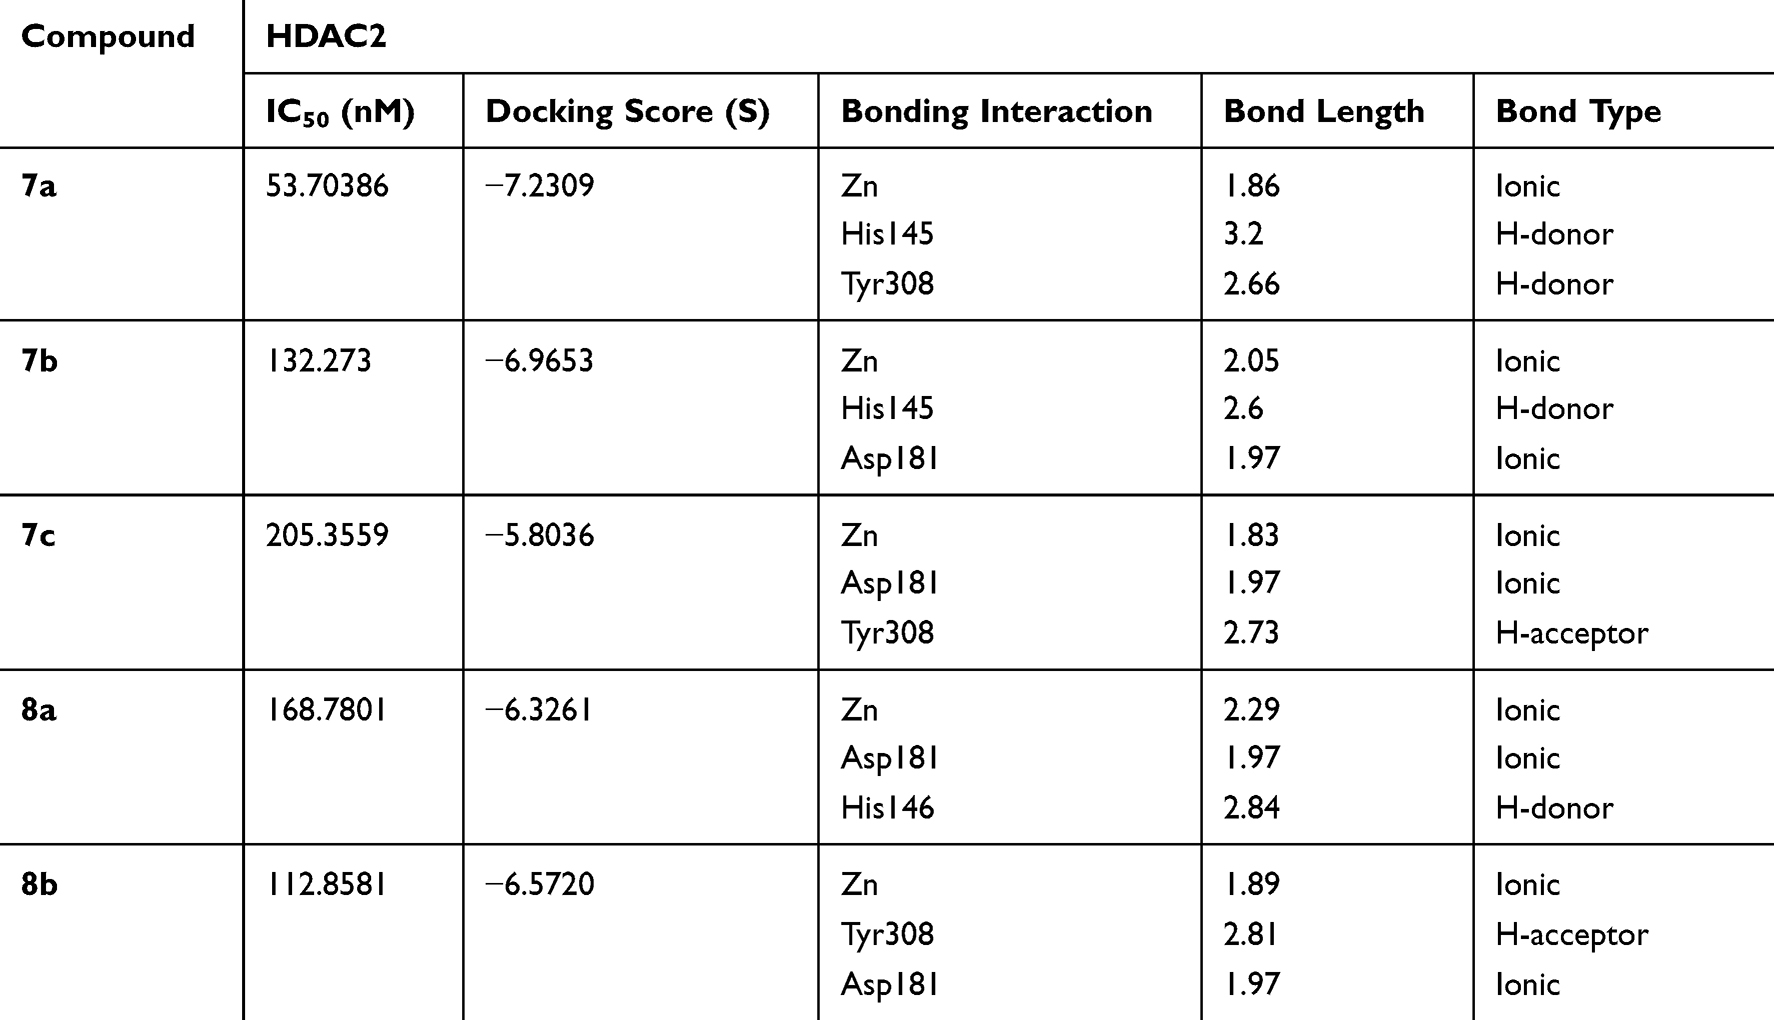 |
Table 4 Docking Results and Characteristic of the Strongest Interactions of ZBG of Target Compounds Within HDAC2 |
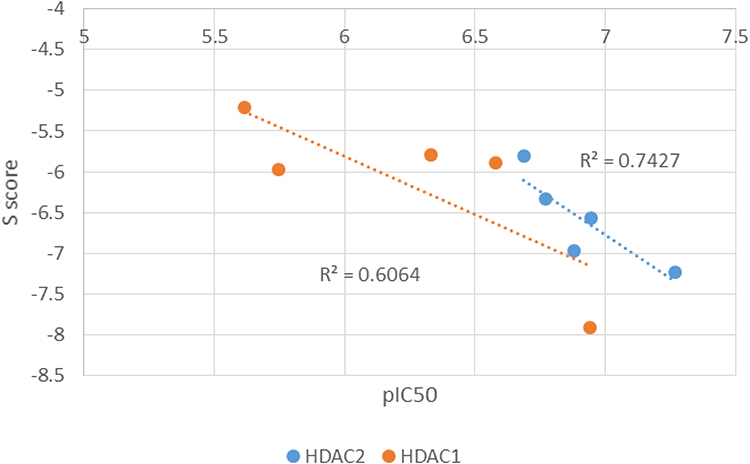 |
Figure 4 Correlation between pIC50 and S Score for target compounds in HDAC1 and HDAC2. |
The most active compound 7a demonstrated the best binding affinity with S equal −7.2309 (HDAC2) and −7.9092 (HDAC1) with similar dock poses in both proteins (Figure 5). The ZBG of 7a makes several strong ionic interactions with Zn2+ ion, as well as numerous H-bonds with His145, His183, Tyr308, and Asp181 residues. The phenyl linker group is sandwiched between 3 aromatic residues Phe155, His183 and Phe210 by pi-pi stacking interactions. The ligustrazine cap moiety and amide linker are capable of pinching the Asp104 via a pi-cation and H-bond, respectively, thus resembling the known squaramide HDAC2 inhibitor.
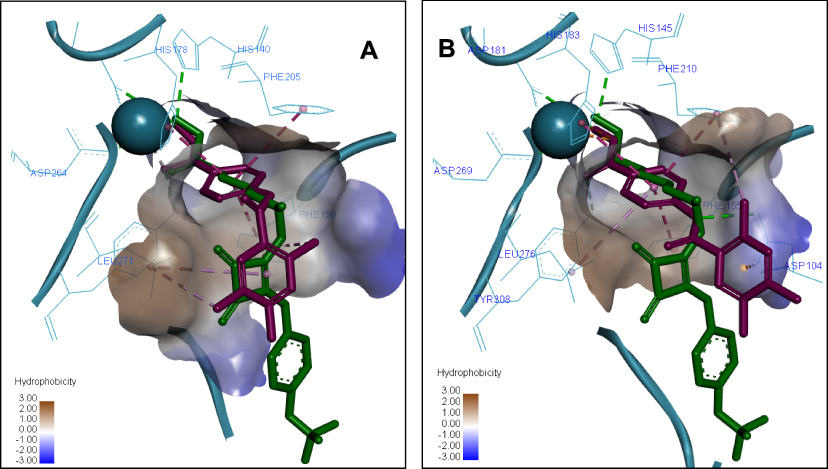 |
Figure 5 Predicted 3D ligand binding pose of compound 7a (purple) in the HDAC1 (A) and HDAC2 (B) active sites overlapped with the binding pose of a known HDAC inhibitor from crystal structure 6G3O (green). The interacting residues are shown in line view, Zn ion is shown as a sky blue sphere. Dotted lines are used to visualize the protein–ligand interactions. Image prepared in Discovery Studio Visualizer. |
The docking pose and binding interactions of compounds 7b, 7c, 8a, and 8b in HDAC2 are similar to that of 7a; however, they have less favorable interactions and lower dock scores, indicating a lower value of the free energy of binding for these compounds (Table 4). Generally, hydrazine ZBG-based derivatives show stronger ionic binding interactions, as well as the dock scores are higher for para-substituted aryl linker derivatives.
The comparison of the 3D ligand docking poses provides a possible explanation for the selectivity of 7b for HDAC2 over HDAC1 and the corresponding decrease in the estimated free binding energy. Although the sequences of HDAC1 and HDAC2 are highly conserved, the slight differences in the published crystal structures resulted in the 3D ligand binding poses of 7a, 7b, and 7c compounds to show different patterns when overlapped (Figure 6). In HDAC2, the complex of interactions with Zn2+ ion is maintained by all three compounds, and the decrease of docking score is small, coming from slightly less favorable hydrophobic interactions. Whereas in HDAC1, the most favorable docking poses showed such a reorientation of the ligand in the binding site that the Pi-Pi stacking interactions with Phe155, His183, and Phe210 are conserved, but there is a significant loss in interactions of the ZBG, which is more critical for inhibitor potency.
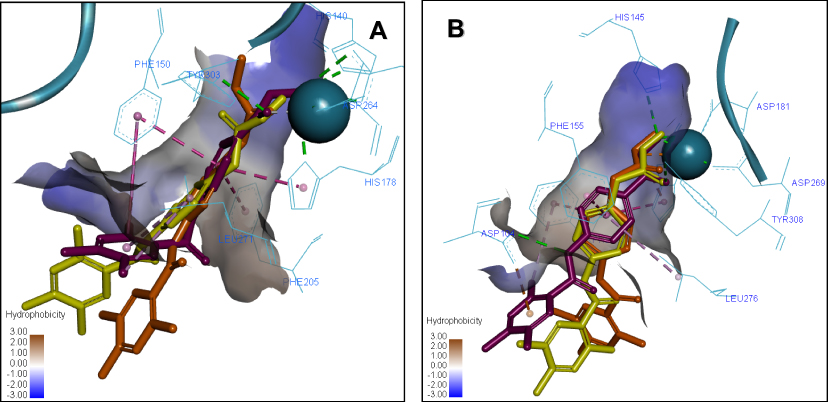 |
Figure 6 Overlay of the 3D ligand binding poses of compounds 7a (purple), 7b (orange) and 7c (yellow) in the HDAC1 (A) and HDAC2 (B) ligand-binding sites. The interacting residues are shown in line view, Zn ion is shown as a sky blue sphere. Dotted lines are used to visualize the protein–ligand interactions. Image prepared in Discovery Studio Visualizer. |
A similar tendency appears when the 3D ligand binding poses for compounds 7a, 8a and 8b are overlapped (Figure 7). In the HDAC2 crystal structure, the ZBG orientation is well overlapped in the poses of 7a, 8a and 8b. Whereas in HDAC1, the docking results show that both 8a and 8b share the hydrophobic Pi-Pi stacking interactions of compound 7a; however, both fail to repeat the same interactions of the ZBG, which results in a higher penalty for the docking score and possibly explains why the changes in inhibition potency for these compounds in HDAC1 and HDAC2 are different.
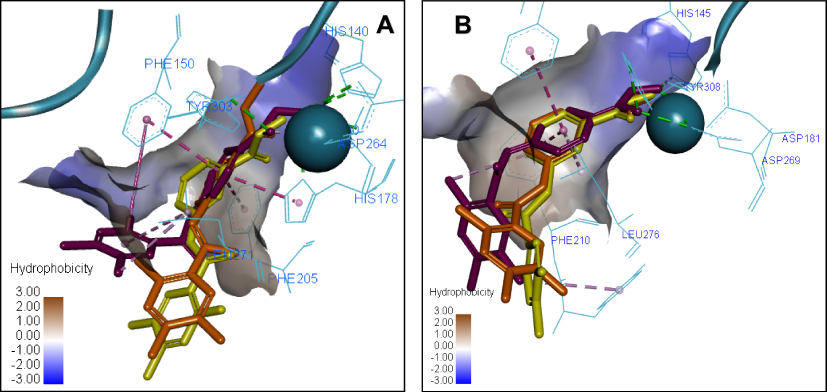 |
Figure 7 Overlay of the 3D ligand binding poses of compounds 7a (purple), 8a (orange) and 8b (yellow) in the HDAC1 (A) and HDAC2 (B) ligand-binding sites. The interacting residues are shown in line view, Zn ion is shown as a sky blue sphere. Dotted lines are used to visualize the protein–ligand interactions. Image prepared in Discovery Studio Visualizer. |
Conclusion
In summary, herein we report the design and synthesis of a new set of HDAC inhibitors (7a-c and 8a, b) utilizing ligustrazine as a novel cap moiety. All the newly synthesized derivatives were evaluated for their potential inhibitory activity toward two class I histone deacetylases, namely HDAC1 and HDAC2. The tested ligustrazine-based compounds were more potent toward HDAC2 (IC50 range: 53.7–205.4 nM) than HDAC1 (IC50 range: 114.3–2434.7 nM). Compound 7a was found to be the most potent analog in this study toward HDAC1 and HDAC2 with IC50 values equal 114.3 and 53.7 nM, respectively. The SAR outcomes hinted that shifting of hydrazide ZBG from para (7a) to meta (8b) position resulted in a 15.7-fold and 2.1-fold worsening of effectiveness against HDAC1 and HDAC2, respectively. Analogously, extending the hydrophobic spacer from phenyl (7a) to benzyl (7c) moiety resulted in a reduced inhibitory activity toward both HDAC1 and HDAC2. Furthermore, the antiproliferative activities against two HDAC-expressing cancer cell lines; HT-29 and SH-SY5Y were examined by the MTT assay. Compound 7a was the most effective molecule (IC50 = 1.60 µM), with 4.7-fold enhanced efficiency than reference drug Gefitinib (IC50 = 7.63 µM) against SH-SY5Y cells. Whereas, 8a (IC50 = 1.96 µM) was the most active compound toward HT-29 cells, being 2.5-times more potent than Gefitinib (IC50 = 4.99 µM).
Acknowledgments
Korea Institute of Science and Technology (KIST) supported this research (2018 KIST School Partnership Research Grant).
Disclosure
The authors report no conflicts of interest in this work.
References
1. Kouzarides T. Chromatin modifications and their function. Cell. 2007;128(4):693–705. doi:10.1016/j.cell.2007.02.005
2. Luger K, Mäder AW, Richmond RK, Sargent DF, Richmond TJ. Crystal structure of the nucleosome core particle at 2.8 Å resolution. Nature. 1997;389(6648):251. doi:10.1038/38444
3. Flaus A, Owen‐Hughes T. Mechanisms for ATP‐dependent chromatin remodelling: the means to the end. FEBS J. 2011;278(19):3579–3595. doi:10.1111/j.1742-4658.2011.08281.x
4. Al-Sanea M, Abdelazem A, Park B, et al. ROS1 kinase inhibitors for molecular-targeted therapies. Curr Med Chem. 2016;23(2):142–160. doi:10.2174/0929867322666151006093623
5. Abdelazem AZ, Al-Sanea MM, Park H-M, Lee SH. Synthesis of new diarylamides with pyrimidinyl pyridine scaffold and evaluation of their anti-proliferative effect on cancer cell lines. Bioorg Med Chem Lett. 2016;26(4):1301–1304. doi:10.1016/j.bmcl.2016.01.014
6. Johnstone RW. Histone-deacetylase inhibitors: novel drugs for the treatment of cancer. Nat Rev Drug Discovery. 2002;1(4):287. doi:10.1038/nrd772
7. Mai A, Massa S, Rotili D, et al. Histone deacetylation in epigenetics: an attractive target for anticancer therapy. Med Res Rev. 2005;25(3):261–309. doi:10.1002/(ISSN)1098-1128
8. Zhang J, Zhong Q. Histone deacetylase inhibitors and cell death. Cell Mol Life Sci. 2014;71(20):3885–3901. doi:10.1007/s00018-014-1656-6
9. Bertino EM, Otterson GA. Romidepsin: a novel histone deacetylase inhibitor for cancer. Expert Opin Investig Drugs. 2011;20(8):1151–1158. doi:10.1517/13543784.2011.594437
10. Mann BS, Johnson JR, Cohen MH, Justice R, Pazdur R. FDA approval summary: vorinostat for treatment of advanced primary cutaneous T-cell lymphoma. Oncologist. 2007;12(10):1247–1252. doi:10.1634/theoncologist.12-10-1247
11. Laubach JP, Moreau P, San-Miguel JF, Richardson PG. Panobinostat for the treatment of multiple myeloma. Clin Cancer Res. 2015;21(21):4767–4773. doi:10.1158/1078-0432.CCR-15-0530
12. Lee H-Z, Kwitkowski VE, Del Valle PL, et al. FDA approval: belinostat for the treatment of patients with relapsed or refractory peripheral T-cell lymphoma. Clin Cancer Res. 2015;21(12):2666–2670. doi:10.1158/1078-0432.CCR-14-3119
13. Lu X, Ning Z, Li Z, Cao H, Wang X. Development of chidamide for peripheral T-cell lymphoma, the first orphan drug approved in China. Intractable Rare Dis Res. 2016;5:185–191. doi:10.5582/irdr.2016.01024
14. Zou J, Gao P, Hao X, Xu H, Zhan P, Liu X. Recent progress in the structural modification and pharmacological activities of ligustrazine derivatives. Eur J Med Chem. 2018;147:150–162. doi:10.1016/j.ejmech.2018.01.097
15. Wang X, Chen X. Study on the effects of tetramethylpyrazine on tumor cells: survey and prospects. Zhongguo Zhong Yao Za Zhi= Zhongguo Zhongyao Zazhi= China Journal of Chinese Materia Medica. 2003;28(4):295–298.
16. Wang X-B, Wang -S-S, Zhang Q-F, et al. Inhibition of tetramethylpyrazine on P-gp, MRP2, MRP3 and MRP5 in multidrug resistant human hepatocellular carcinoma cells. Oncol Rep. 2010;23(1):211–215.
17. Wang P, She G, Yang Y, et al. Synthesis and biological evaluation of new ligustrazine derivatives as anti-tumor agents. Molecules. 2012;17(5):4972–4985. doi:10.3390/molecules17054972
18. Ai Y, Zhu B, Ren C, et al. Discovery of new monocarbonyl ligustrazine–curcumin hybrids for intervention of drug-sensitive and drug-resistant lung cancer. J Med Chem. 2016;59(5):1747–1760. doi:10.1021/acs.jmedchem.5b01203
19. Xu B, Chu F, Zhang Y, et al. A series of new ligustrazine-triterpenes derivatives as anti-tumor agents: design, synthesis, and biological evaluation. Int J Mol Sci. 2015;16(9):21035–21055. doi:10.3390/ijms160921035
20. Xu B, Yan W-Q, Xu X, et al. Combination of amino acid/dipeptide with ligustrazine-betulinic acid as antitumor agents. Eur J Med Chem. 2017;130:26–38. doi:10.1016/j.ejmech.2017.02.036
21. Chu F, Xu X, Li G, et al. Amino acid derivatives of ligustrazine-oleanolic acid as new cytotoxic agents. Molecules. 2014;19(11):18215–18231. doi:10.3390/molecules191118215
22. Gottlieb HE, Kotlyar V, Nudelman A. NMR chemical shifts of common laboratory solvents as trace impurities. J Org Chem. 1997;62(21):7512–7515. doi:10.1021/jo971176v
23. Strahl BD, Allis CD. The language of covalent histone modifications. Nature. 2000;403(6765):41. doi:10.1038/47412
24. Mosmann T. Rapid colorimetric assay for cellular growth and survival: application to proliferation and cytotoxicity assays. J Immunol Methods. 1983;65(1–2):55–63. doi:10.1016/0022-1759(83)90303-4
25. Eldehna WM, Abo-Ashour MF, Ibrahim HS, et al. Novel [(3-indolylmethylene) hydrazono] indolin-2-ones as apoptotic anti-proliferative agents: design, synthesis and in vitro biological evaluation. J Enzyme Inhib Med Chem. 2018;33(1):686–700. doi:10.1080/14756366.2017.1421181
26. Almahli H, Hadchity E, Jaballah MY, et al. Development of novel synthesized phthalazinone-based PARP-1 inhibitors with apoptosis inducing mechanism in lung cancer. Bioorg Chem. 2018;77:443–456. doi:10.1016/j.bioorg.2018.01.034
27. Vilar S, Cozza G, Moro S. Medicinal chemistry and the molecular operating environment (MOE): application of QSAR and molecular docking to drug discovery. Curr Top Med Chem. 2008;8(18):1555–1572. doi:10.2174/156802608786786624
28. Fournier J-F, Bhurruth-Alcor Y, Musicki B, et al. Squaramides as novel class I and IIB histone deacetylase inhibitors for topical treatment of cutaneous t-cell lymphoma. Bioorg Med Chem Lett. 2018;28(17):2985–2992. doi:10.1016/j.bmcl.2018.06.029
29. Keshelava N, Davicioni E, Wan Z, et al. Histone deacetylase 1 gene expression and sensitization of multidrug-resistant neuroblastoma cell lines to cytotoxic agents by depsipeptide. J Natl Cancer Inst. 2007;99(14):1107–1119. doi:10.1093/jnci/djm044
30. Eckschlager T, Plch J, Stiborova M, Hrabeta J. Histone deacetylase inhibitors as anticancer drugs. Int J Mol Sci. 2017;18(7):1414. doi:10.3390/ijms18071414
31. Wang Z, Sun H, Yao X, et al. Comprehensive evaluation of ten docking programs on a diverse set of protein–ligand complexes: the prediction accuracy of sampling power and scoring power. Phys Chem Chem Phys. 2016;18(18):12964–12975. doi:10.1039/C6CP01555G
 © 2020 The Author(s). This work is published and licensed by Dove Medical Press Limited. The full terms of this license are available at https://www.dovepress.com/terms.php and incorporate the Creative Commons Attribution - Non Commercial (unported, v3.0) License.
By accessing the work you hereby accept the Terms. Non-commercial uses of the work are permitted without any further permission from Dove Medical Press Limited, provided the work is properly attributed. For permission for commercial use of this work, please see paragraphs 4.2 and 5 of our Terms.
© 2020 The Author(s). This work is published and licensed by Dove Medical Press Limited. The full terms of this license are available at https://www.dovepress.com/terms.php and incorporate the Creative Commons Attribution - Non Commercial (unported, v3.0) License.
By accessing the work you hereby accept the Terms. Non-commercial uses of the work are permitted without any further permission from Dove Medical Press Limited, provided the work is properly attributed. For permission for commercial use of this work, please see paragraphs 4.2 and 5 of our Terms.