")
Back to Journals » International Journal of Nanomedicine » Volume 13
Design and synthesis of nanoscaled IQCA-TAVV as a delivery system capable of antiplatelet activation, targeting arterial thrombus and releasing IQCA
Authors Wu J , Zhu H , Yang G, He J, Wang Y, Zhao S, Zhang X, Gui L, Zhao M, Peng S
Received 28 August 2017
Accepted for publication 22 November 2017
Published 26 February 2018 Volume 2018:13 Pages 1139—1158
DOI https://doi.org/10.2147/IJN.S150205
Checked for plagiarism Yes
Review by Single anonymous peer review
Peer reviewer comments 2
Editor who approved publication: Dr Linlin Sun
Jianhui Wu,1,2,* Haimei Zhu,1,2,* Guodong Yang,1 Jianhong He,3 Yuji Wang,1,2 Shurui Zhao,1,2 Xiaoyi Zhang,1,2 Lin Gui,1,2 Ming Zhao,1,2,4 Shiqi Peng1,2
1Beijing Area Major Laboratory of Peptide and Small Molecular Drugs, Engineering Research Center of Endogenous Prophylactic of Ministry of Education of China, Beijing, China; 2Beijing Laboratory of Biomedical Materials, College of Pharmaceutical Sciences, Capital Medical University, Beijing, China; 3Department of Internal Medicine of TCM, The First Affiliated Hospital of Guanxi University of Chinese Medicine, Nanning, China; 4Department of Biomedical Science and Environmental Biology, Kaohsiung Medical University, Kaohsiung, Taiwan
*These authors contributed equally to this work
Background: Arterial thrombosis has been associated with a series of pathological conditions, and the discovery of arterial thrombosis inhibitor is of clinical importance.
Methods: By analyzing the pharmacophores of anti-platelet agents, thrombus targeting peptide and anti-thrombotic nano-systems 3S-1,2,3,4-tetrahydroisoquino- line-3-carbonyl-Thr-Ala-Arg-Gly-Asp(Val)-Val (IQCA-TAVV) was designed and prepared as a nano-scaled arterial thrombosis inhibitor.
Results: In vitro the nanoparticles of IQCA-TAVV were able to adhere onto the surface of activated platelets, attenuate activated platelets to extend pseudopodia and inhibit activated platelets to form aggregators. In vivo IQCA-TAVV targeted arterial thrombus, dose dependently inhibited arterial thrombosis with a 1 nmol/kg of minimal effective dose, and the activity was ~1670 folds of that of aspirin.
Conclusion: IQCA-TAVV represented the design, preparation and application of nanomedicine capable of adhering on the surface of activated platelets, attenuating platelet activation, targeting arterial thrombus and inhibiting arterial thrombosis.
Keywords: arterial thrombosis, thrombus targeting, nanodelivery, antithrombosis
Introduction
Thrombus formation is responsible for elevated mortality worldwide. Arterial thrombosis has been associated with a series of pathologic conditions, such as acute coronary syndromes,1–3 ischemic stroke,4,5 transient ischemic attack,5,6 tumor thrombosis,7,8 recurrence of thromboembolic events,9,10 metabolic syndrome,11–15 chronic pain and swelling symptoms.16
Platelet activation plays an important role in the formation of arterial thrombosis.17,18 Thrombosis involves the complex interactions between coagulation, and fibrinolytic and innate immune systems, while the interaction between the platelets, injured vessel and a variety of specific membrane receptors plays an essential role.19 Through activating the specific membrane receptors for adhesive proteins, the adhesion, activation and aggregation of platelets is triggered at the site of vascular injury to form a plug, that is, thrombus.20 A series of drugs, such as heparin tissue plasminogen activator,21,22 urokinase,23 warfarin24 and melagatran,25 have been used to dissolve the formed thrombus or to inhibit the formation of thrombus. On the other hand, these drugs have some clinical shortcomings. For instance, most of these drugs need to be intravenously injected, can cause serious side effects and usually have short half-life in the blood circulation.26–34 To solve these problems, a series of nanopreparations, such as hollow nanogels, magnetic nanoparticles and liposomes, were discovered.35–37 However, the oral nanodelivery capable of inhibiting platelet activation, targeting arterial thrombus and releasing pharmacophores remains unknown. Based on 3S-1,2,3,4-tetrahydroiso-quinoline-3-carbonyl-Thr and 3S-1,2,3,4-tetrahydroisoquinoline-3-carbonyl-Ala being antiplatelet agents,38 Arg-Gly-Asp-Val in aspirin-Arg-Gly-Asp-Val being a thrombus-targeting peptide,39 3S-1,2,3,4-tetrahydroisoquinoline-3-carbonyl-Thr-Ala-Arg-Gly-Asp-(Phe)-Phe40 and 3S-1,2,3,4-tetrahydroisoquinoline-3-carbonyl-Thr-Ala-Arg-Gly-Asp(Ser)-Ser41 being an oral antithrombotic nanodelivery system, this paper designed 3S-1,2,3,4-tetrahydroisoquinoline-3-carbonyl-Thr-Ala-Arg-Gly-Asp(Val)-Val (IQCA-TAVV of Figure 1) as a nanoscaled delivery system to inhibit the activation of platelets, to target the arterial thrombus and to release 3S-1,2,3,4-tetrahydroisoquinoline-3-carboxylic acid (IQCA).
 | Figure 1 The combination of pharmacophores of the antiplatelet agents, thrombus-targeting peptide Arg-Gly-Asp-Val and antithrombotic agents leads to the design of IQCA-TAVV as a thrombus-targeting nanodelivery system capable of antiplatelet activation, targeting arterial thrombus and releasing IQCA. |
Materials and methods
General
The chemicals were commercially available without further purification. The chromatography was performed on silica gel H (Qingdao Marine Chemical Factory, Qingdao, China). The purity of IQCA-TAVV was analyzed with high-performance liquid chromatography (Waters Corporation, Milford, MA, USA; C18 column, 4.6×150 mm). Melting points (MPs) of all prepared compounds were measured on an electrothermal XT5G apparatus (Beijing Keyi Electro-optic Instrument, Beijing, China) and without correction. 1H nuclear magnetic resonance (NMR) spectra of all prepared compounds were recorded at 500 MHz (1H NMR) and 125 MHz (13C NMR) on a Bruker AVANCE II 500. Optical rotations of all prepared compounds were measured with a Jasco P-1020 Polarimeter. Electrospray ionization mass spectrometry (ESI-MS) readings of all prepared compounds were measured on a ZQ 2000 (Waters Corp) and 9.4 T solariX Fourier transform ion cyclotron resonance (FT-ICR) mass spectrometer (Bruker Corp, Billerica, MA, USA), with an ESI/matrix-assisted laser desorption/ionization (MALDI) dual ion source. Male Sprague Dawley rats and ICR mice were purchased from the Animal Center of Capital Medical University. Animal experiments were reviewed and approved by the ethics committee of Capital Medical University. The committee assures that the welfare of the animals is maintained in accordance with the requirements of the Animal Welfare Act and in accordance with the NIH Guide for Care and Use of Laboratory Animals. Student’s t-test and analysis of variance were used for statistical analyses of all data. P-values <0.05 were considered statistically significant.
Preparation of 3S-1,2,3,4-tetrahydroisoquinoline-3-carboxylic acid
Into a solution of 4.0 g (24.2 mmol) of L-Phe in 21.6 mL of formaldehyde 36 mL of hydrochloric acid (35%) was added dropwise. This solution was stirred at 90°C for 12 h and TLC (CHCl3/CH3OH, 5/1) indicated the complete disappearance of L-Phe. The reaction mixture was cooled to room temperature, and the formed precipitates were collected and successively washed with water and acetone to give 4.17 g (98%) of the title compound as a colorless powder. ESI-MS (m/z): 176 (M − H)−.
Preparation of 3S-N-Boc-1,2,3,4-tetrahydroisoquinoline-3-carboxylic acid (1)
At 0°C a solution of 10 g (56.5 mmol) of IQCA and 2.5 g (62.2 mmol) of NaOH in 63 mL of water and a solution of 14.8 g (67.8 mmol) of (Boc)2O in 40 mL of tetrahydrofuran were mixed. This mixture was stirred at room temperature for 24 h, TLC (CHCl3/CH3OH, 10/1) indicated the complete disappearance of IQCA, the solvent was removed under reduced pressure, and the residue was dissolved in 60 mL of ethyl acetate. The formed solution was washed successively with 40 mL of hydrochloric acid (0.5 M), 40 mL of aqueous sodium bicarbonate (5%) and 40 mL of saturated aqueous sodium chloride. The ethyl acetate phase was separated, dried over anhydrous sodium sulfate, filtered, and the filtrate was concentrated under reduced pressure to give 14.8 g (95% yields) of the title compound as colorless powder. ESI-MS (m/z): 276 [M − H]−.
Preparation of 3S-N-Boc-1,2,3,4-tetrahydroisoquinoline-3-carbonyl-Thr-OBzl (2)
A solution of 149 mg (1.2 mmol) of N-hydroxy benzotriazole and 290 mg (1.1 mmol) of 3S-N-Boc-1,2,3,4-tetrahydroisoquinoline-3-carboxylic acid (1) in 10 mL of anhydrous tetrahydrofuran was at 0°C, stirred for 10 min, then 228 mg (1.1 mmol) of dicyclohexylcarbodiimide was added to form solution A. A solution of 381 mg (1.0 mmol) of Tos·Thr-OBzl in 4 mL of anhydrous tetrahydrofuran was adjusted to pH 9 with 1 mL of N-methyl-morpholine to form solution B. Solution A and Solution B were mixed, at room temperature stirred for 12 h, and TLC (ethyl acetate/petroleum, 1/3) indicated the complete disappearance of Tos·Thr-OBzl. This mixture was filtered, the filtrate was concentrated under reduced pressure and the residue was dissolved in ethyl acetate (50 mL). The formed solution was washed successively with 40 mL of aqueous sodium bicarbonate (5%), 40 mL of aqueous citric acid (5%) and 40 mL of aqueous saturated sodium chloride. The ethyl acetate phase was separated, dried over anhydrous sodium sulfate, filtered, and the filtrate was concentrated under reduced pressure to give 453 mg (90% yields) of the title compound as a colorless powder. ESI-MS (m/z): 469 [M + H]+.
Preparation of 3S-N-Boc-1,2,3,4-tetrahydroisoquinoline-3-carbonyl-Thr (3)
At 0°C, to a solution of 400 mg (1.0 mmol) of 3S-N-Boc-1,2,3,4-tetrahydro-isoquinoline-3-carbonyl-Thr-OBzl (2) in 4 mL of methanol, 10 mL of aqueous NaOH (2 M) was added dropwise; this mixture was stirred at room temperature for 5 h, and TLC (acetone/petroleum, 1/3) indicated the complete disappearance of 2. The reaction mixture was filtered and the filtrate was concentrated under reduced pressure. The residue was dissolved in 30 mL of water and the solution was adjusted to pH 2 with hydrochloric acid (2 M). The formed precipitates were dissolved in 50 mL of ethyl acetate, and the solution was washed successively with 40 mL of aqueous sodium bicarbonate (5%), 40 mL of aqueous citric acid (5%) and 40 mL of aqueous saturated sodium chloride. The ethyl acetate phase was separated and dried over anhydrous sodium sulfate, filtered, and the filtrate was concentrated under reduced pressure to give 305 mg (96% yields) of the title compound as a colorless powder. ESI-MS (m/z): 377 [M − H]−.
Preparation of Ala-Arg(NO2)-Gly-Asp(OBzl)-OBzl
The solution method and a stepwise strategy (from C terminal to N terminal) were used to prepare Ala-Arg(NO2)-Gly-Asp(OBzl)-OBzl as a colorless powder in 85% yield. ESI-MS (m/z): 701 [M + H]+.
Preparation of 3S-N-Boc-1,2,3,4-tetrahydroisoquinoline-3-carbonyl-Thr-Ala- Arg(NO2)-Gly-Asp(OBzl)-OBzl (4)
By using the same procedure as for preparing 2, from 1.05 g (3 mmol) of 3 and 2.04 g (3 mmol) of Ala-Arg(NO2)-Gly-Asp(OBzl)-OBzl, 926 mg (93% yields) of the title compound was obtained as a colorless powder. MP 159°C–160°C. ESI-MS (m/z): 1,003 [M + H]+. [α]D25=−14 (c=1.1, CH3OH). 1H NMR (500 MHz, DMSO-d6) δ/ppm =8.42 (d, J=6.6 Hz, 1 H), 8.12 (s, 1 H), 7.99 (s, 1 H), 7.91 (d, J=7.5 Hz, 1 H), 7.74 (m, 1 H), 7.59 (m, 1 H), 7.34 (s, 10 H), 7.17 (s, 4 H), 5.09 (d, J=6 Hz, 4 H), 4.97 (s, 1 H), 4.78 (s, 1 H), 4.58 (m, 2 H), 4.49 (m, 1 H), 4.27 (m, 3 H), 3.94 (s, 1 H), 3.75 (s, 2 H), 3.14 (s, 4 H), 2.92 (dd, J=6.3 Hz, J=5.7 Hz, 3 H), 2.01 (s, 1 H), 1.99 (s, 2 H), 1.30 (m, 13 H), 0.84 (m, 4 H). 13C NMR (125 MHz, DMSO-d6) (ppm) =172.7, 171.9, 170.8, 169.2, 169.1, 136.2, 136.1, 128.8, 128.5, 128.4, 128.1, 127.3, 126.3, 66.8, 66.4, 52.7, 49.1, 48.9, 48.7, 42.1, 36.3, 29.5, 28.4, 19.6.
Preparation of 3S-N-Boc-1,2,3,4-tetrahydroisoquinoline-3-carbonyl-Thr-Ala-Arg(NO2)-Gly-Asp (5)
By using the same procedure as for preparing 3, from 1.0 g (1.0 mmol) of 4, 756 mg (92%) of the title compound was obtained as a colorless powder. ESI-MS (m/z): 821 [M − H]−.
Preparation of 3S-N-Boc-1,2,3,4-tetrahydroisoquinoline-3-carbonyl-Thr-Ala-Arg(NO2)-Gly-Asp(Val-OBzl)-Val-OBzl (6)
By using the same procedure as for preparing 3, from 822 mg (1.0 mmol) of 5 and 909 mg (2.4 mmol) of Tos·Val-OBzl, 864 mg (72% yields) of the title compound was obtained as a colorless powder. ESI-MS (m/e): 1,201 [M + H]+. MP 128°C–129°C. [α]D25=−17.86 (c=1.1, CH3OH), 1H NMR (500 MHz, DMSO-d6) δ/ppm =8.51 (s, 1 H), 8.42 (d, J=8.0 Hz, 2 H), 8.14 (d, J=7.5 Hz, 1 H), 8.07 (s, 1 H), 7.97 (d, J=5.5 Hz, 1 H), 7.75 (d, J=8 Hz, 1 H), 7.34–7.26 (m, 10 H), 7.16 (m, 4 H), 5.19–5.10 (m, 4 H), 4.63 (m, 1 H), 4.51 (m, 1 H), 4.45 (q, J=8.0 Hz, 1 H), 4.39 (m, 2 H), 4.28 (m, 4 H), 4.12 (m, 4 H), 3.11 (m, 2 H), 3.04 (m, 2 H), 3.15 (m, 2 H), 2.64 (dd, J=6.3 Hz, J=6.9 Hz, 1 H), 2.55 (dd, J=6.3 Hz, J=6.9 Hz, 1 H), 2.01 (s, 2 H), 1.96 (s, 1 H), 1.77 (m, 2 H), 1.55 (m, 2 H), 1.49 (d, J=7.8 Hz, 3 H), 1.37 (s, 9 H), 1.02 (d, J=8.2 Hz, 12 H), 1.22 (d, J=8.2 Hz, 3 H).
Preparation of 3S-1,2,3,4-tetrahydroisoquinoline-3-carbonyl-Thr-Ala-Arg-Gly-Asp-(Val)-Val (IQCA-TAVV)
At 0°C a solution of 50 mg (0.4 mmol) of 6 in 1 mL of dimethyl sulfide, 1 mL of phenyl methyl ether, 4 mL of CF3CO2H and 1 mL of CF3SO3H (1 mL) was stirred for 1 h. Upon removal of CF3CO2H/CF3SO3H, the residue was triturated with 150 mL of ether, and the residue was purified on Sephadex G10 to provide 28.4 mg (94% yields) as a colorless powder. ESI-MS (m/e): 874 [M − H]−. MP 164°C–165°C. [α]D25=−10.1 (c=1.4, CH3OH). IR (cm−1) 3,446, 2,963, 2,386, 1,653, 1,542, 1,456, 1,390, 1,254, 1,172, 1,029, 762, 641, 515, 437; 1H NMR (800 MHz, DMSO-d6) δ/ppm =8.36 (m, 1 H), 8.20 (m, 1 H), 8.08 (m, 1 H), 8.03 (m, 1 H), 7.98 (m, 1 H), 7.94 (m, 1 H), 7.82 (m, 1 H), 7.71 (m, 1 H), 7.20 (m, 4 H), 4.62 (m, 1 H), 4.31 (m, 4 H), 4.17 (m, 3 H), 4.14 (m, 2 H), 3.97 (m, 1 H), 3.72 (m, 2 H), 3.22 (m, 1 H), 3.08 (s, 2 H), 2.88 (m, 1 H), 2.58 (m, 1 H), 2.02 (m, 2 H), 1.71 (m, 1 H), 1.54 (m, 1 H), 1.50 (m, 3 H), 1.26 (t, J=7.2 Hz, 3 H), 1.09 (d, J=5.6 Hz, 3 H). 0.85 (m, 12 H) (Figure S1); 13C NMR (200 MHz, DMSO-d6) δ/ppm =172.53, 172.46, 171.51, 170.89, 170.69, 168.80, 168.69, 167.98, 167.85, 156.15, 134.87, 131.15, 128.08, 126.37, 125.84, 125.62, 66.11, 64.30, 57.42, 56.99, 56.68, 54.21, 51.63, 47.73, 41.23, 36.55, 29.49, 29.37, 28.63, 19.02, 18.48, 17.49 (Figure S2).
Energy-minimized conformation of IQCA-TAVV
The structure of IQCA-TAVV was constructed, converted to conformation using Chem Office 10.0, and energy minimization was carried out in MM2 force field until the minimum root mean squared (RMS) gradient reached 0.001. Systematic search and BEST methods of Discovery Studio 3.5 sampled the energy-optimized conformations of IQCA-TAVV. The SMART minimizer was used for the conformation sampling. The sampling parameters were set to CHARMm force field such as 20 kcal/mol energy threshold, 300 K, maximum 200 minimization steps and minimization RMS gradient 0.1 Å. In addition, maximum 255 conformations were generated with an RMS deviation cutoff of 0.2 Å. The lowest energy conformation of IQCA-TAVV was used for docking investigation.
Mesoscale simulation of nanoparticles of IQCA-TAVV
The structure of IQCA-TAVV was sketched by use of ChemDraw Ultra 10.0 (Cheminformatics company CambridgeSoft, Cambridge, MA, USA), which was transformed into conformation with Materials Studio 3.2 (Accelrys, Inc., San Diego, CA, USA) and entirely optimized with MS Forcite module. The geometry of the prepared model of IQCA-TAVV was optimized until the maximum energy convergence and the maximum force changed to 2×10⁻⁵ kcal/mol and 0.001 kcal/mol/Å, respectively. The molecular dynamic simulation was performed at 500 K by use of NVT ensemble till equilibration. The final structure of IQCA-TAVV was further optimized with MS Dmol3 module, based on which a rigid coarse grain model of three connected spherical beads was built. In a cubic box of 200×200×200 Å3 three-spherical-bead model was randomly distributed with a density of 0.15 g/cm3, and a simulation of 15,000 ps was performed at 298 K by use of NVT ensemble.
Recording FT-MS spectrum of IQCA-ATVV
On solariX FT-ICR mass spectrometer (Bruker Daltonics, Billerica, MA, USA) consisting of an ESI/MALDI dual ion source and a 9.4 T superconductive magnet, the FT-MS spectrum of IQCA-ATVV was recorded in positive MALDI ion mode. The qualitative contingent influence diagram (qCID) spectrum of 1,773.58817 m/z was recorded, and the isolation window was 5 mass units. By use of software solariX and Bruker Daltonics Data Analysis the spectral data were analyzed.
Recording NOESY 2D NMR spectrum of IQCA-ATVV
1H NMR tests were performed on Bruker AvanceIII 800 MHz spectrometer operating at 18.8 T equipped a CPQCI cryoprobe of 5 mm, and the signals were observed at 800.25 MHz and recorded at 303 K. DMSO-d6 and tetramethylsilane were used as the solvent and the internal standard, respectively. The spectrum was acquired by use of spectral width of 16,447 Hz, data points of 65,536, pulse width of 8.78 μs, relaxation delay of 1.0 s, acquisition time of 2 s and 16 scans. To enhance the sensitivity before Fourier transforms, the spectrum was processed, accurately phased and baseline adjusted by applying an exponential line broadening of 0.3 Hz. NOESY 2D NMR spectrum was recorded by a phase-sensitive mode with 2,048 points and 512 points in the F2 and the F1 directions, respectively. NOESY 2D NMR spectrum was acquired with 12 scans, a relaxation delay of 2 s and mixing time values of 0.30 s.
Determining the particle size and zeta potential of IQCA-ATVV solution state
To characterize the nanoproperty of IQCA-TAVV in solution state, the particle size of the compound in normal saline (NS, 10 nM) was determined on a particle size analyzer (Nano-ZS90; Malvern Instruments Ltd, Malvern, UK), while the zeta potential of the compound in ultrapure water (10 nM, pH 6.7) was measured on a Zeta Potential Plus Analyzer (Brookhaven Instruments Corp, Holtsville, NY, USA). To explore time-induced change of the particle size, and thereby to provide a basis for the application of the nanosolution, these determinations were performed at 25°C for 7 days, and each experiment was repeated three times.
Imaging the nanospecies of IQCA-TAVV with transmission electron microscopy (TEM)
The morphology and size of the nanospecies formed by IQCA-TAVV in water were imaged on a TEM (JSM-2100LV; JEOL, Tokyo, Japan). In brief, onto the surface of a formvar-coated copper grid a solution of IQCA-TAVV in ultrapure water (pH 6.7, 100 μL) was dropped, which was followed by air-drying, and warming at 37°C for 7 days to load IQCA-TAVV. The copper grid with IQCA-TAVV was put under the microscope, the randomly selected regions were viewed, and the morphology and size distribution of the nanospecies were recorded over 100 species. Then 6,000–400,000× digitally enlarged nanospecies were recorded on the imaging plate (Gatan Bioscan Camera Model 1792; Gatan, Inc., Pleasanton, CA, USA) with 20 eV energy windows. Each imaging was performed with triplicate grids.
Imaging the nanofeatures of lyophilized powders of IQCA-TAVV with a scanning electron microscope (SEM)
The morphology and size of the lyophilized powders of IQCA-TAVV were imaged on an SEM (S-4800; Hitachi, Tokyo, Japan) at 15 kV. The SEM sample was prepared by fixing the lyophilized powders from a 10−8 M solution of IQCA-TAVV in ultrapure water onto the stub with double-sided tape (Euromedex, Strasbourg, France), which was then coated with 10-nm-thick gold–palladium by use of a Joel JFC-1600 auto fine coater (JEOL, Tokyo, Japan). The imaging conditions were 15 kV, 30 mA and 200 mTorr (argon) for 60 s. The randomly selected regions of the coater were viewed, and the morphology and size distribution of the lyophilized powders were recorded for over 100 species. Then 100–10,000× digitally enlarged lyophilized powders were recorded on the imaging plate (Gatan Bioscan Camera Model 1792) with 20 eV energy windows. Each imaging was performed with triplicate samples.
Atomic force microscopy (AFM) images of the nanoparticles of IQCA-TAVV adhering on platelets
Rat blood containing 3.8% sodium citrate (citrate/blood =1/9, v/v) was centrifuged at 1,000 rpm for 10 min to get platelet-rich plasma (PRP). Then PRP was centrifuged at 3,000 rpm for an additional 10 min. The rat plasma and the platelets were collected. The platelets were carefully washed with NS three times, and then diluted to 1×10⁵ platelets per mL NS to give the normal platelet solution. This solution (500 μL) was activated at 37°C with arachidonic acid (AA: [Sigma-Aldrich Co., St Louis, MO, USA] final concentration 350 mM) or thrombin (TH, Sigma-Aldrich Co., final concentration 0.1 U/mL) for 5 min to give AA- or TH-activated platelet solution. At 37°C AA- and TH-activated platelet solutions were incubated with 10 and 100 nM as well as 0.05, 0.5 and 5 nM of IQCA-TAVV for 30 min, respectively. The platelet solutions were individually dropped onto a mica sheet, fixed with glutaraldehyde (3%) for 10 min, carefully washed with ultrapure water, and dried overnight in air to record the images of AFM. For this purpose, a gold-coated nonconductive silicon nitride (Si3N4) tip of 180–220 μm in length, a cantilever with an spring constant of 0.15 N/m and scan rate of 0.5 Hz were used, while the pixel resolution was 512×512. Three locations were imaged for each platelet solution.
To get insight into the nanoparticles of IQCA-TAVV adhering on the surfaces of AA-activated platelets, AFM images were recorded on a Nanoscope 3D AFM or Multimode 8 instrument (Veeco Metrology, Santa Barbara, CA, USA) by using the contact mode and the Nanoscope V531r1 software. In addition, the AFM images of the resting rat platelets, TH-activated rat platelets and TH-activated rat platelets treated with IQCA-TAVV (0.05, 0.5 and 5 nM) were recorded on the Multimode 8 instrument using the Nanoscope analysis 1.7 software.
In vitro platelet aggregation assay of IQCA-TAVV
Platelet aggregation was evaluated with two-channel Chronolog aggregometer by following the manufacturer’s instructions. The citrated pig blood was immediately centrifuged at 1,000 rpm for 15 min to get PRP and further centrifuged at 3,000 rpm for another 10 min to get platelet-poor plasma (PPP). With stirring in an optical glass cuvette, 500 μL PRP was diluted with PPP and the concentration of the platelets became ~2×10⁸ platelets/mL, into which 5 μL NS or 5 μL solution of IQCA-TAVV in NS (final concentrations ranging from 0.01 to 10 nM) was added. After adjustment of the baseline, 5 μL solution of AA in NS (final concentration 350 μM) or 5 μL solution of TH in NS (final concentration 0.1 U/mL) was added. At 37°C the change of the light transmission was measured for 5 min, and the activity of IQCA-TAVV against the aggregation induced by AA or TH was recorded. The inhibition rate was calculated by the following: inhibition% = [1 − (Am% of IQCA-TAVV)/(Am% of NS)] ×100%, wherein Am% was the maximal rate of platelet aggregation and was represented by the peak height of aggregation curve. IC50 values were obtained from the dose–response curves and calculated with a logarithmic curve-fitting program.
SEM image of IQCA-TAVV-treated rat platelets
To image the action of IQCA-TAVV on platelets, 10 μL solution of IQCA-TAVV in NS (final concentration, 200 nM) or 10 μL of NS was added to 500 μL of PRP; 3 min after incubation AA was added (final concentration, 15 μM); at 37°C the resultant solution was incubated for 5 min and centrifuged at 3,000 rpm for 15 min to precipitate the platelets. The precipitated pellet was fixed with glutaraldehyde (3%) for 1 h, washed with PBS three times, at 0°C post-fixed with osmium tetroxide (1%) for 1 h, and centrifuged and treated with 50% ethanol two times (each 10 min). The platelets were successively dehydrated in 70%, 80%, 90% and 100% ethanol for 10 min. The platelets were dried with critical point dryer (CPD300; Leica Ltd., Wetzlar, Germany), mounted on an aluminum stub, coated with platinum by the JFC-1600 Auto Fine Coater and imaged on an SEM (S-4800).
In vivo assay of IQCA-TAVV on rat arterial thrombosis model
Platelets and fibrin are implicated in the arterial thrombus that can be cross-linked with thread thrombus of rat arteriovenous shunt-silk thread model. In this context the in vivo anti-arterial thrombosis activity of IQCA-TAVV was evaluated in this model. In brief, male Sprague Dawley rats (200±20 g) were randomly divided into five groups of 12 animals each to orally receive IQCA-TAVV (0.1, 1 and 10 nmol/kg) or aspirin (167 μmol/kg) or NS (3 mL/kg). Thirty minutes after the administration the rat was anesthetized with sodium pentobarbital (80.0 mg/kg, intraperitoneal injection [ip]), and then the right carotid artery and left jugular vein were separated. A polyethylene tube with an exact weighted thread of 6 cm in length was filled with a solution of heparin sodium in NS (50 IU/mL). One end of this polyethylene tube was inserted into the left jugular vein, while the other end of this polyethylene tube was implanted into the right carotid artery, prior to which heparin sodium was injected as anticoagulant. After conjugation of the left jugular vein and the right carotid artery, blood was allowed to circulate for 15 min, and the thread in the polyethylene tube was removed and weighed to calculate the weight increase of the thread, which was the weight of the thrombus which was used to represent the antithrombotic activity.
In vivo assay of IQCA-TAVV on mouse arterial thrombosis model
Endothelial cell injury is one of the important mechanisms of the arterial thrombosis and FeCl3 can induce endothelial cell injury. To explore the efficacy of IQCA-TAVV preventing endothelial cells from injury, thereby preventing the arterial vessel from thrombosis, the FeCl3-induced mouse thrombosis model was used. In brief, male ICR mice (25±2 g) were randomly divided into three groups (each 12) for orally receiving IQCA-TAVV (10 nmol/kg) or aspirin (240 μmol/kg) or NS (10 mL/kg). Thirty minutes after the administration the mice were intraperitoneally injected with chloral hydrate (10 g/100 mL) for anesthesia. The segment abdominal aorta of the mouse was exposed and dissected, and then two strips of filter paper (0.5×3 cm) saturated with 15% FeCl3 were placed beneath and above the dissected carotid artery for 15 min, while a paraffin strip of 4×8 mm was placed below the filter paper to protect the surrounding tissue. An artery segment of 0.5 cm with thrombus was excised, the blood was blotted with filter paper and the thrombus was weighed to represent the antithrombotic activity.
Results
Synthesis of IQCA-TAVV
3S-1,2,3,4-tetrahydroisoquinoline-3-carbonyl-Thr (3) was prepared with a four-step route. Via Pictet-Spengler condensation L-Phe was converted into IQCA (98% yield). Using (Boc)2O, 2N of IQCA was blocked by Boc (95% yield) and formed 1. The coupling of 1 with Tos·Thr-OBzl gave N-(3S-N-Boc-1,2,3,4-tetrahydroisoquino-line-3-carbonyl)-L-Thr-OBzl (2, 90% yield). The saponification of 2 provided 3 (96% yield). The protective Ala-Arg(NO2)-Gly-Asp(OBzl)-OBzl was prepared by use of the solution-phase method and stepwise synthesis (from C-terminal to N-terminal) in 85% yield. Coupling 3 with Ala-Arg(NO2)-Gly-Asp(OBzl)-OBzl yielded 3S-N-Boc-1,2,3,4-tetrahydroisoquinoline-3-carbonyl)-Thr-Ala-Arg(NO2)-Gly-Asp(OBzl)-OBzl (4, 93% yield). Upon removing benzyl groups 4 was converted to 3S-N-Boc-1,2,3,4-tetrahydroisoquinoline-3-carbonyl-Thr-Ala-Arg(NO2)-Gly-Asp (5). The conjugation of 5 with Tos·Val-OBzl gave 3S-N-Boc-1,2,3,4-tetrahydroiso quinoline-3-carbonyl-Thr-Ala-Arg(NO2)-Gly-Asp(Val-OBzl)-Val-OBzl (6, 72% yield). Upon removal of all protective groups of 6, IQCA-TAVV was obtained with 94% yield. These data suggest that the reaction conditions are mild and the yield of the individual reaction is acceptable. Thus, the route depicted with Scheme 1 for the preparation of IQCA-TAVV represents an acceptable strategy of a mild reaction condition, desirable yield and good purity.
 | Scheme 1 Synthetic route to IQCA-TAVV. |
FT-MS spectrum explores IQCA-TAVV forming a dimer
To explore the association profile the FT-MS spectrum was measured on a SolariX FT-ICR mass spectrometer (Bruker Daltonics) with an ESI positive ion source and a superconductive magnet of 9.4 T. Figure 2A is the FT-MS spectrum of 1 nM solution of IQCA-TAVV in ultrapure water and gives an ion peak at 1,773.64447, the mass of a dimer plus Na, while the qCID spectrum (Figure 2B) gives an ion peak at 876.45208, the mass of a monomer plus H. Thus FT-MS spectrum reveals that in water the intermolecular association drives IQCA-TAVV to carry out the dimerization and form the dimer as the existing form. In FT-MS condition the dimer undergoes fragmentation and forms the monomer.
 | Figure 2 FT-MS spectrum, NOESY 2D NMR spectrum and the dimer of IQCA-TAVV. |
NOESY 2D NMR spectrum defines the manner of IQCA-TAVV forming a dimer
To explore the formation manner of the dimer, NOESY 2D NMR spectrum of IQCA-TAVV was measured on Bruker AvanceIII 800 MHz spectrometer. DMSO-d6 and tetramethylsilane were used as the solvent and the internal standard, respectively. Figure 2C gives one interesting cross-peak marked with a red circle. This cross-peak represents the interaction between the NH of Val residue of one molecule and the β-CH of Thr residue of another molecule. Thus, NOESY 2D NMR spectrum reveals that to form a dimer the aromatic ring of IQCA of one molecule should approach the Asp residue of another molecule and the distance between the mentioned protons should be <4 Å.
Energy minimization gives the dimer of IQCA-TAVV a V-like conformation
To explore the conformation of the dimer the monomer of IQCA-TAVV first received energy minimization. Figure 2D indicates that the energy minimization gives the monomer a scorpion-like conformation. Based on the formation manner of the dimer defined by NOESY 2D NMR spectrum, that is, the aromatic ring of IQCA of one molecule approaching the Asp residue of another molecule, two monomers of scorpion-like conformation were manually accessed to control the distance between the mentioned protons within 4 Å. Figure 2E indicates that this operation leads the energy-minimized dimer of IQCA-TAVV to the V-like conformation.
SEM-, TEM- and mesoscale-simulation-predicted images of IQCA-TAVV
The nanofeature of IQCA-TAVV in aqueous solution was visualized with the TEM image. Figure 3A and B show that in pH 6.7 ultrapure water the diameters of the nanoparticles formed by 10 and 0.1 nM of IQCA-TAVV are 12–186 and 48–197 nm, respectively, and the diameters of most particles fall within a range of 75–125 nm (Figure 3C). Figure 3D shows that the SEM images of lyophilized powders formed from 10 nM aqueous IQCA-TAVV are nanoparticles of 20–70 nm in diameter, and the diameters of most particles fall within a range of 50–80 nm (Figure 3E). Mesoscale simulation predicts that 824 molecules of IQCA-TAVV can form a particle of 12.1 nm in diameter (Figure 3F).
 | Figure 3 TEM and SEM images, as well as mesoscale simulation software-predicted nanoparticle of IQCA-TAVV. |
Nanoproperty of aqueous IQCA-TAVV
The nanoproperty of aqueous IQCA-TAVV was characterized with 650 nm laser-induced Faraday–Tyndall effect, zeta potential and 7-day mean size. Figure 4A indicates that ultrapure water without radiation is a clear solution. Figure 4B indicates that ultrapure water with 650 nm laser radiation shows no Faraday–Tyndall effect, and is a clear solution. Figure 4C and D indicate that the radiation of 650 nm laser induces the solution of IQCA-TAVV in ultrapure water (1 nM, pH 6.7 or pH 1.2) to show Faraday–Tyndall effect, while the solution is clear. Figure 4E and F indicate that the radiation of 650 nm laser induces the solution of IQCA-TAVV in ultrapure water (10 nM, pH 6.7 or pH 1.2) to show Faraday–Tyndall effect, and the solution is also clear. These observations suggest that the nanosolution formed by IQCA-TAVV in water has no colloidal property. The zeta potential test indicates that aqueous IQCA-TAVV (10 nM, pH 6.7) has a zeta potential of −18.57 mV with a half-width of 2.32 mV (Figure 4G). The mean size of 10 nM solution of IQCA-TAVV in NS over 7 days ranges from ~160 to ~350 nm (Figure 4H). Thus, the 650-nm laser-induced Faraday–Tyndall effect, the zeta potential test and the 7-day size determination consistently evidence that aqueous IQCA-TAVV is a nanosolution.
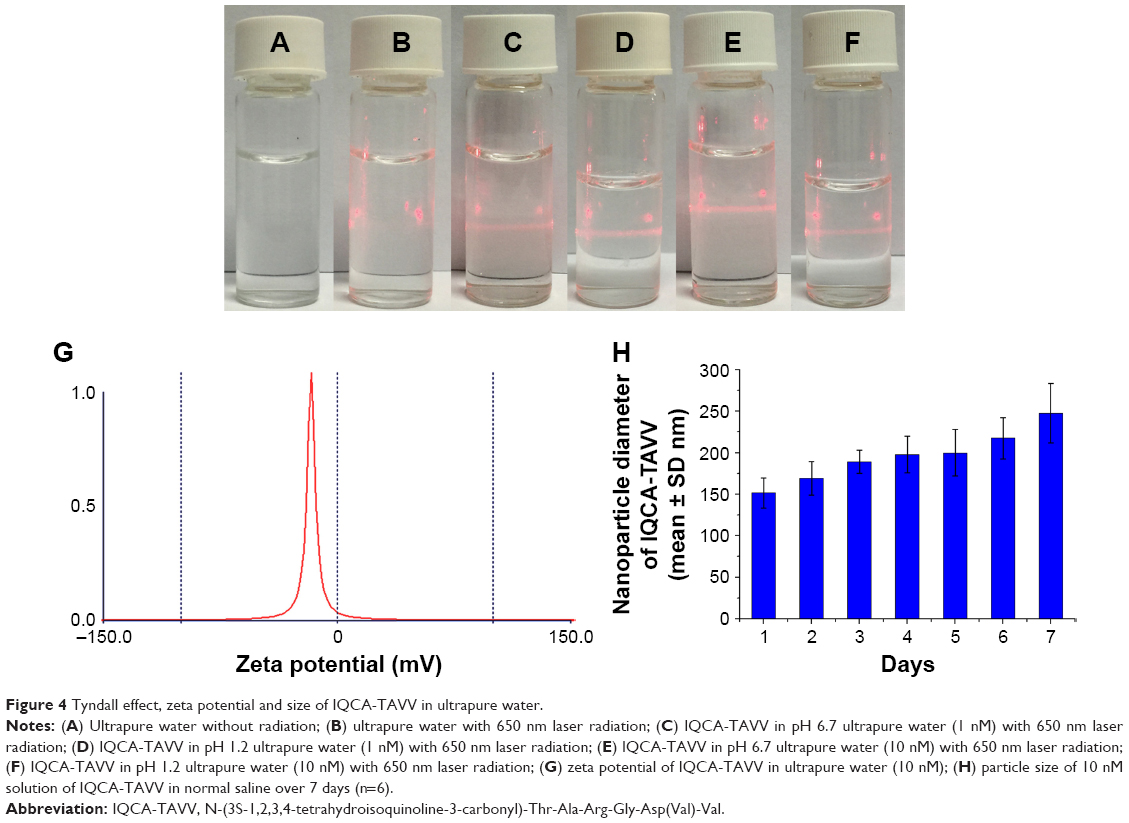 | Figure 4 Tyndall effect, zeta potential and size of IQCA-TAVV in ultrapure water. |
Nanoparticles of IQCA-TAVV adhere on platelet surface
To clearly visualize the adhesion of the nanoparticles of IQCA-TAVV on the surface of AA-activated platelets, the AFM model of Veeco Nanoscope 3D was used. Figure 5A shows the IC50 of IQCA-TAVV against AA-induced rat platelet aggregation. Figure 5B is the AFM image of rat plasma without platelets, giving no nano particle. Figure 5C is the AFM image of IQCA-TAVV in rat plasma (10 nM) to visualize the features of its particles in physiologic environment. Figure 5D is the AFM image of the resting rat platelets. The locally amplified platelet is marked with a blue box, showing a smooth surface and no extended pseudopodia. Figure 5E is the AFM image of AA-activated and -aggregated rat platelets without IQCA-TAVV. The locally amplified platelet aggregator is marked with a blue box, showing a smooth surface and extended pseudopodia. Figure 5F is the AFM image of AA-activated rat platelets treated with 10 nM of IQCA-TAVV. The locally amplified platelet with extended pseudopodia is marked with a blue box, showing some nanoparticles of 23.7–51.3 nm in height and some aggregators on its surface. Figure 5G is the AFM image of AA-activated rat platelets treated with 100 nM of IQCA-TAVV. The locally amplified platelet with extended pseudopodia is marked with a blue box, showing some nanoparticles of 8.5–20.9 nm in height and few aggregators on its surface. The features of the AFM images show that the size of the nanoparticles formed by IQCA-TAVV in rat plasma is smaller than that of its nanoparticles in ultrapure water, which can adhere on the surface of the activated platelets to inhibit their activation and aggregation.
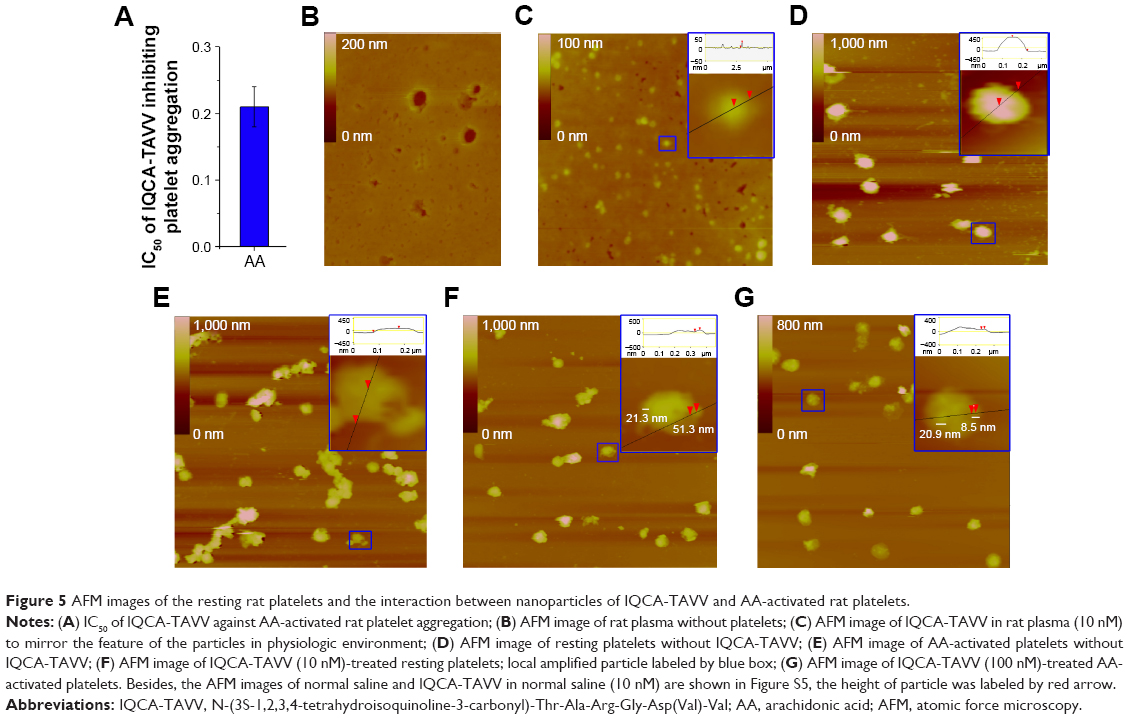 | Figure 5 AFM images of the resting rat platelets and the interaction between nanoparticles of IQCA-TAVV and AA-activated rat platelets. |
Effect of the nanoparticles of IQCA-TAVV on platelet activation
To clearly visualize the effect of the nanoparticles of IQCA-TAVV on the platelet activation induced by TH, the AFM model of multimode 8 instruments was used. Figure 6A shows the IC50 of IQCA-TAVV against TH-induced rat platelet aggregation. Figure 6B is the AFM image of the resting rat platelets, giving no aggregators and extended pseudopodia. Figure 6C is the AFM image of TH-activated rat platelets, showing a lot of aggregated platelets with extended pseudopodia. Figure 6D is the AFM image of TH-activated rat platelets treated with 0.05 nM of IQCA-TAVV, where the extended pseudopodia and the aggregators are less than that of Figure 6C. Figure 6E is the AFM image of TH-activated rat platelets treated with 0.5 nM of IQCA-TAVV, where the extended pseudopodia and the aggregators are less than that of Figure 6D. Figure 6F is the AFM image of TH-activated rat platelets treated with 5 nM of IQCA-TAVV, where the extended pseudopodia and the aggregators are less than that of Figure 6E. Thus, AFM images visualize that IQCA-TAVV concentration dependently inhibits platelet activation.
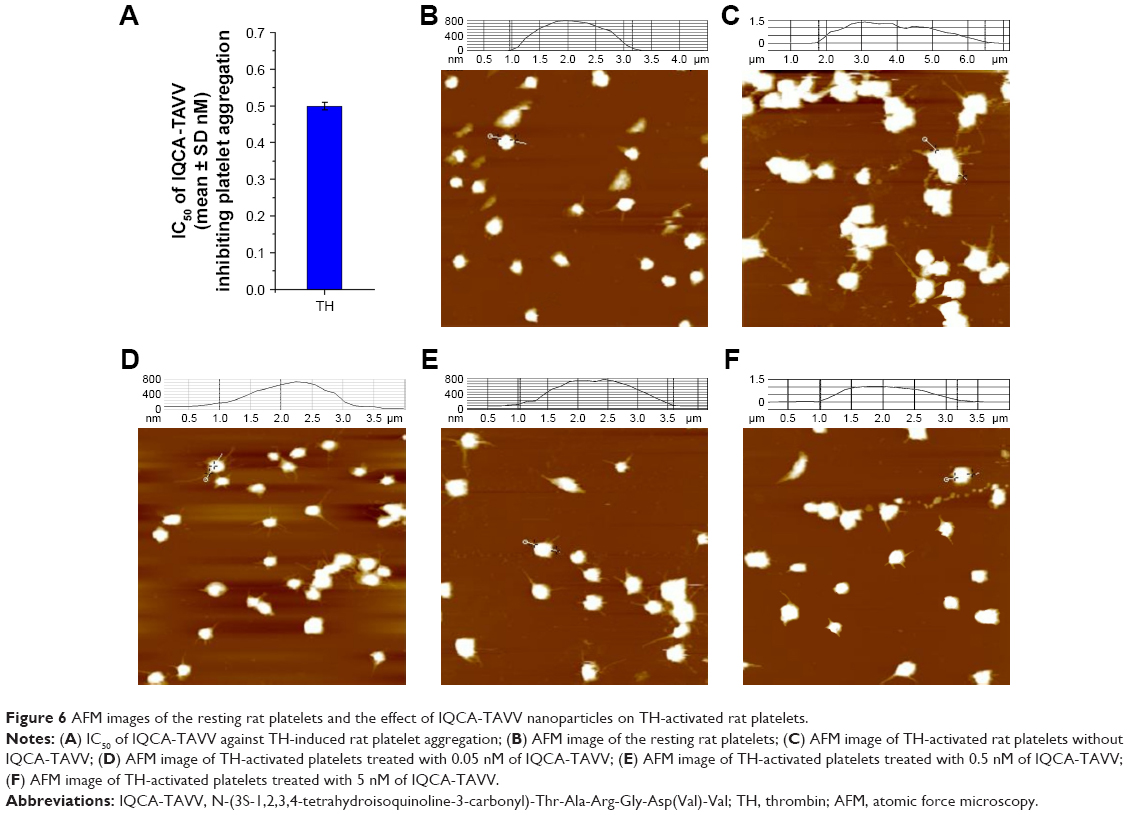 | Figure 6 AFM images of the resting rat platelets and the effect of IQCA-TAVV nanoparticles on TH-activated rat platelets. |
SEM images and the effect of the nanoparticles of IQCA-TAVV on rat platelets
The effect of the nanoparticles of IQCA-TAVV on AA-activated rat platelets was visualized with the SEM image. Figure 7A shows the SEM images of AA-activated rat platelets treated with NS. These platelets have smooth surfaces and a series of extended pseudopodia. Figure 7B shows the SEM images of AA-activated rat platelets treated with 200 nM IQCA-TAVV. In contrast, these platelets have no extended pseudopodia. However, on the surfaces of these platelets there are a lot of nanoparticles of IQCA-TAVV.
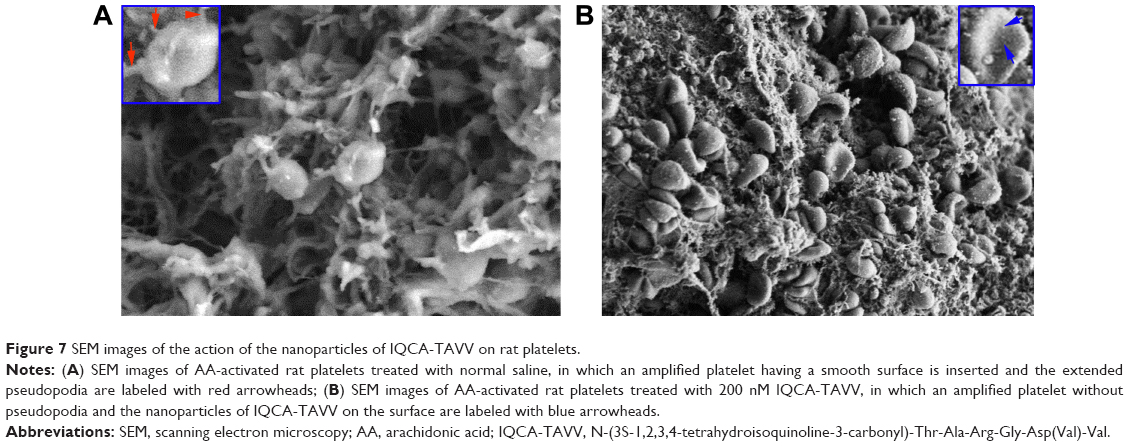 | Figure 7 SEM images of the action of the nanoparticles of IQCA-TAVV on rat platelets. |
IQCA-TAVV effectively inhibits mouse arterial thrombosis
Figure 8A indicates that 10 nmol/kg of oral IQCA-TAVV significantly inhibits the mice to form an arterial thrombus, and the thrombus weight is significantly lower than that of the mice treated with NS and equal to that of the mice treated with 240 μmol/kg aspirin. This means that the activity of IQCA-TAVV is 24,000-fold that of aspirin. The morphology of arterial thrombus in the mouse model is shown in Figure S3.
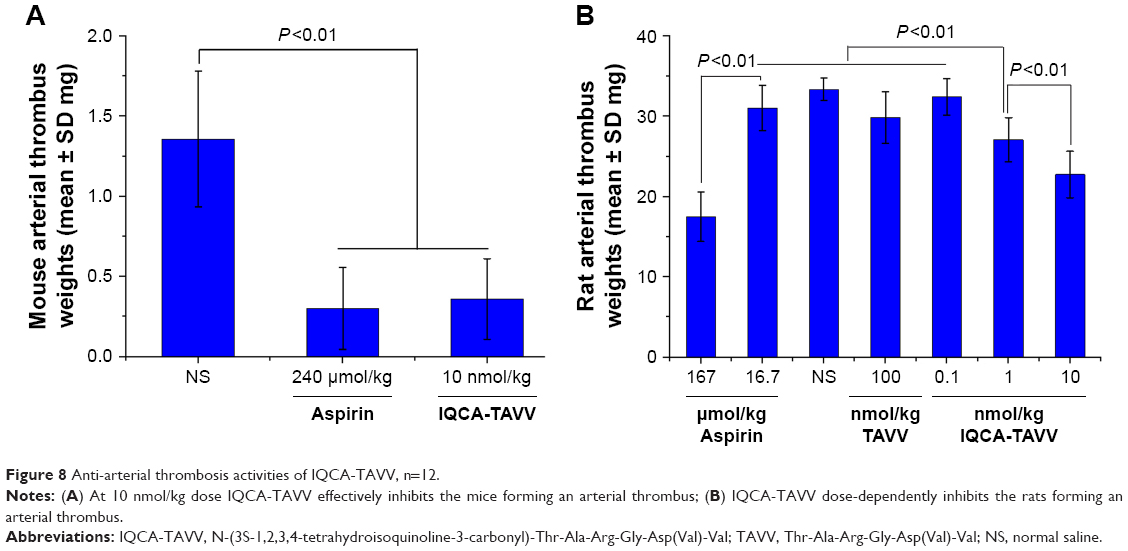 | Figure 8 Anti-arterial thrombosis activities of IQCA-TAVV, n=12. |
IQCA-TAVV effectively inhibits rat arterial thrombosis
Figure 8B indicates that in the rat arterial thrombosis model, IQCA-TAVV dose dependently inhibits rats forming an arterial thrombus and the minimal effective dose is 1 nmol/kg. The thrombus weight of the rats orally receiving 1 nmol/kg IQCA-TAVV is significantly lower than those of the rats orally receiving NS, 100 nmol/kg of Thr-Ala-Arg-Gly-Asp(Val)-Val (TAVV) and 16.7 μmol/kg of aspirin. This means that the activity of IQCA-TAVV is ~1,670-fold higher than that of aspirin. The morphology of arterial thrombus in the rat model is shown in Figure S4.
IQCA-TAVV targets arterial thrombus to release IQCA
The benefit of the nanoparticles adhering on the surface of rat platelets was reflected with IQCA-TAVV targeting arterial thrombus to release IQCA and Thr-Ala-Arg-Gly-Asp(Val)-Val (TAVV) in vivo. For this profile, the brain, heart, lung, liver, spleen, kidney, blood and thrombus of the thrombosis rats treated with 10 nmol/kg IQCA-TAVV were homogenized, ultrasonically extracted with methanol, centrifuged at 3,000 rpm for 10 min and the supernatants were used for ESI(±)-FT-MS analysis. Figure 8A is the ESI(−)-FT-MS spectrum of the thrombus extract of the treated rats. The local amplified inset of Figure 9A gives an ion peak at 178.07821; the mass of IQCA subtracting H. Figure 9B is the ESI(+)-FT-MS spectrum of the thrombus extract of the treated rats. The local amplified inset of Figure 9B gives an ion peak at 519.25641; the mass of TARGD (Thr-Ala-Arg-Gly-Asp) plus H. Figure 9C is the ESI(−)-FT-MS spectrum of the blood extract of the treated rats. The local amplified inset of Figure 9C gives no IQCA-related ion peak. Figure 9D–I are the ESI(−)-FT-MS spectra of the extracts of the brain, heart, lung, liver, spleen and kidney of the treated rats. The local amplified insets show no IQCA-related ion peak. Thus, the ESI(−)-FT-MS spectrum of the thrombus extract is characterized by the ion peak of IQCA and is distinctly different from the ESI(−)-FT-MS spectra of the blood, brain, heart, lung, liver, spleen and kidney extracts that give no ion peak of IQCA. The ESI(+)/FT-MS spectrum of the thrombus extract is characterized by the ion peak of Thr-Ala-Arg-Gly-Asp, and is distinctly different from the ESI(+)-FT-MS spectra of the blood, brain, heart, lung, liver, spleen and kidney extracts that give no ion peak of Thr-Ala-Arg-Gly-Asp. The ESI(−)-FT-MS spectrum with the ESI(+)-FT-MS spectrum of the thrombus extract together suggest that IQCA-TAVV targets arterial thrombus, wherein it releases IQCA and TARGD(V)V.
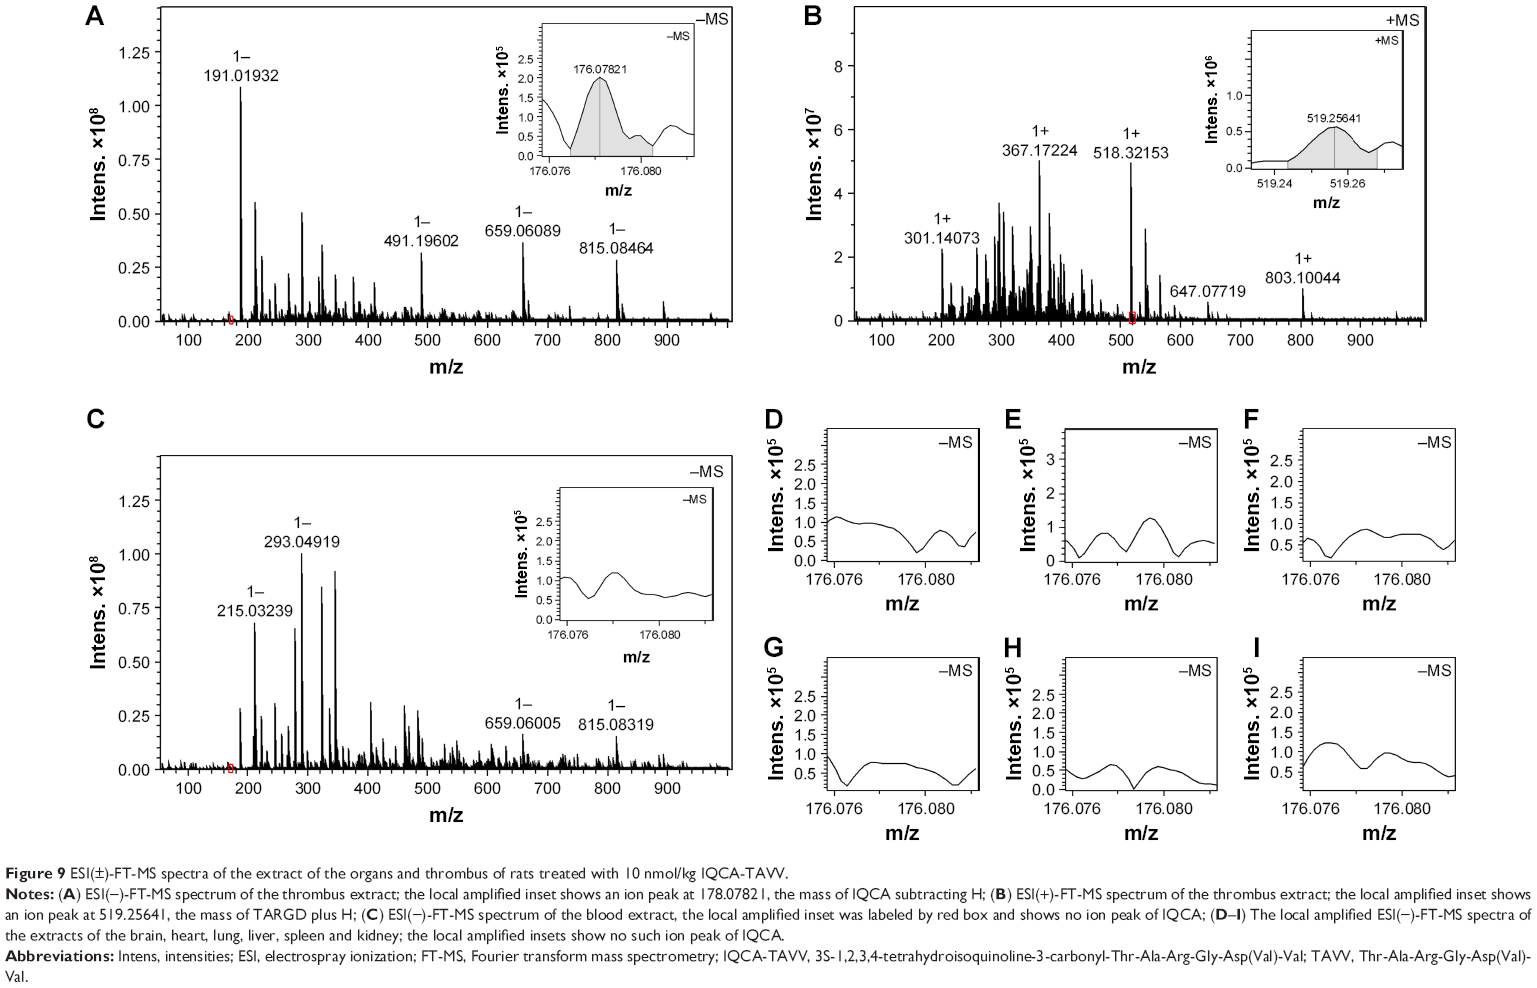 | Figure 9 ESI(±)-FT-MS spectra of the extract of the organs and thrombus of rats treated with 10 nmol/kg IQCA-TAVV. |
Acute toxicity of IQCA-TAVV in mice
Acute toxic action of IQCA-TAVV on mice was examined. It was found that even at a dose of 1 μmol/kg (100- or 1,000-fold of the minimal effective dose) IQCA-TAVV still induced no mouse death or neurotoxicity behavior, such as tremor, twitch, jumping, tetanus and supination. This suggests that the LD50 value of IQCA-TAVV is more than 1 μmol/kg. Figure 10A–C indicate that the serum levels of alanine transaminase, aspartate transaminase and creatinine of 1 μmol/kg IQCA-TAVV-treated mice are equal to those of NS-treated mice. All the observations together suggest that even at a high dose IQCA-TAVV still exhibits no neurotoxicity and does not injure the kidneys, liver and heart.
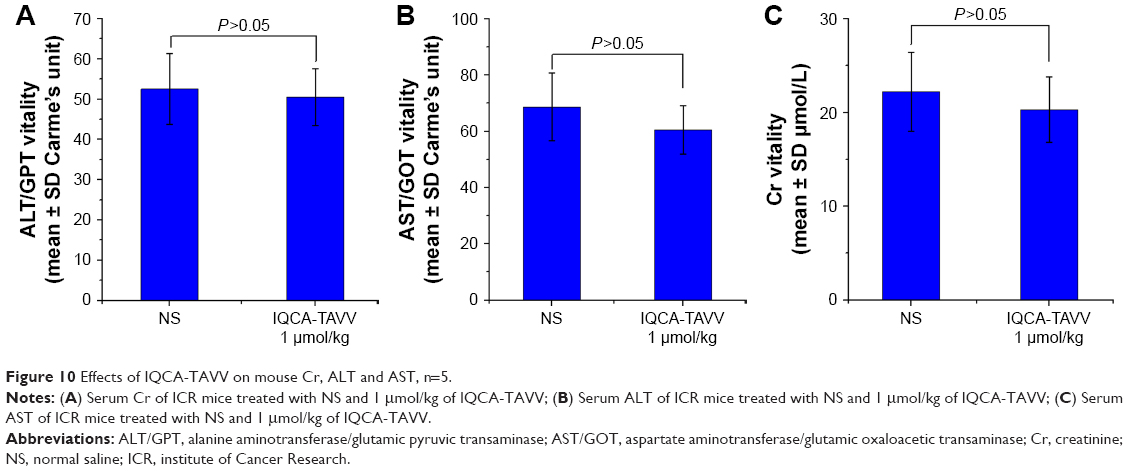 | Figure 10 Effects of IQCA-TAVV on mouse Cr, ALT and AST, n=5. |
Discussion
The route to the preparation of 3S-1,2,3,4-tetrahydroisoquinoline-3-carbonyl-Thr-Ala-Arg-Gly-Asp(Val)-Val (IQCA-TAVV) represents an acceptable strategy that uses mild reaction condition, provides desirable yield and gives good purity.
The FT-MS spectrum reveals that in water the intermolecular association drives the dimerization of IQCA-TAVV and the dimer is the unique form of it existing in water. In FT-MS condition the dimer undergoes fragmentation to form the monomer. Energy minimization gives the monomer a scorpion-like conformation. The NOESY 2D NMR spectra reveal that the intermolecular association is an aromatic ring of IQCA of one molecule accessing the Asp residue of another molecule. Energy minimization gives the dimer a V-like conformation.
The intermolecular association–based self-assembly drives IQCA-TAVV forming nanoparticles. TEM, SEM, AFM and 650-nm laser-induced Faraday–Tyndall effect visualize the nanoproperty of IQCA-TAVV. The particle size of IQCA-TAVV in aqueous solution, in lyophilized powders and in rat plasma is suitable to deliver and to avoid phagocytosis of macrophages in blood circulation.
AFM images show that the nanoparticles of IQCA-TAVV can adhere onto the surface of AA-activated rat platelets to inhibit their activation and aggregation. AFM images also show that the IQCA-TAVV can effectively inhibit TH to activate rat platelets, thereby decreasing the amount of the extended pseudopodia and the aggregator of the platelets.
Relying on inhibiting platelet activation, IQCA-TAVV dose dependently inhibited the rats forming an arterial thrombus, and at 1 nmol/kg of dose, its minimal effective dose, the activity is significantly higher than that of 16.7 μmol/kg aspirin. Relying on the inhibition of platelet activation, IQCA-TAVV also effectively inhibited the mice forming an arterial thrombus and at 10 nmol/kg of dose the activity is equal to that of 240 μmol/kg aspirin. These data suggest that in inhibiting arterial thrombosis the mice are more sensitive to IQCA-TAVV therapy.
Relying on adhering onto the surface of the platelets, IQCA-TAVV targets the arterial thrombus, wherein it releases IQCA and Thr-Ala-Arg-Gly-Asp(Val)-Val. Both of these compounds resulted from the thrombus-specific metabolism of IQCA-TAVV and the course could be hypothesized as in Figure 11.
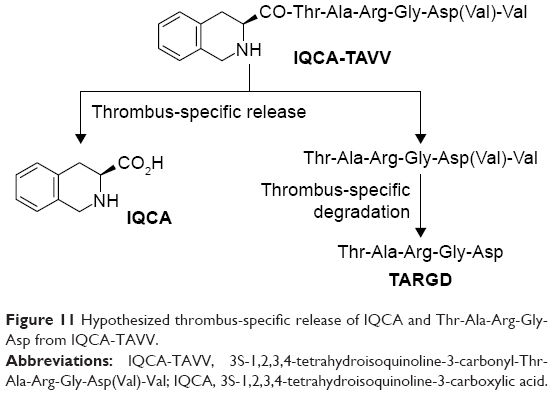 | Figure 11 Hypothesized thrombus-specific release of IQCA and Thr-Ala-Arg-Gly-Asp from IQCA-TAVV. |
Conclusions
In aqueous solution, lyophilized powders and rat plasma IQCA-TAVV form nanoparticles that not only could be suitably delivered in blood circulation but also could adhere onto the surface of activated platelets, and thereby inhibit the activation of the platelets. This allows IQCA-TAVV to dose dependently inhibit rats forming an arterial thrombus, and leads to its minimal effective dose being as low as 1 nmol/kg. This high therapeutic efficacy is correlated with IQCA-TAVV targeting arterial thrombus. Therefore, IQCA-TAVV shows an example of the application of nanomedicine capable of adhering on the surface of activated platelets, attenuating platelet activation, targeting arterial thrombus and consequently inhibiting arterial thrombosis.
Acknowledgments
This work was supported by Special Project (2017ZX09201008) of China, NSFC (81673303, 81373265 and 81373264), BNSF (7162025 and 7172028), PHR (KZ201610025029 and KM201710025009), 863 program (2015AA020902) and The Importation and Development of High-Caliber Talents Project of Beijing Municipal Institutions. We are grateful to Yaonan Wang of the Capital Medical University for helping us with this project.
Disclosure
The authors report no conflicts of interest in this work.
References
Agnello L, Bivona G, Lo Sasso B, et al. Galectin-3 in acute coronary syndrome. Clin Biochem. 2017;50(13–14):797–803. | ||
Asrar ul Haq M, Erickson M, Rankin J, Whelan A. Late strut fracture within a partially resorbed bioresorbable vascular scaffold: a possible cause of late scaffold thrombosis and acute coronary syndrome. Heart Lung Circ. 2017;26(4):e26–e28. | ||
Laine M, Frere C, Cuisset T, et al. Potential mechanism of acute stent thrombosis with bivalirudin following percutaneous coronary intervention in acute coronary syndromes. Int J Cardiol. 2016;220:496–500. | ||
deVeber GA, Kirton A, Booth FA, et al. Epidemiology and outcomes of arterial ischemic stroke in children: the Canadian pediatric ischemic stroke registry. Pediatr Neurol. 2017;69:58–70. | ||
Arnaez J, Garcia-Alix A. Extracerebral thrombosis in symptomatic neonatal arterial ischemic stroke. Eur J Pediatr Neurol. 2017;21(4):687–688. | ||
Yuan Z, Voss EA, DeFalco FJ, et al. Risk prediction for ischemic stroke and transient ischemic attack in patients without atrial fibrillation: a retrospective cohort study. J Stroke Cerebrovasc Dis. 2017;26(8):1721–1731. | ||
van der Spuy WJ, Augustine TN. Ultrastructural investigation of the time-dependent relationship between breast cancer cells and thrombosis induction. Micron. 2016;90:59–63. | ||
Castaman G. Risk of thrombosis in cancer and the role of supportive care (transfusion, catheters, and growth factors). Thromb Res. 2016;140(Suppl 1):S89–S92. | ||
Cha DJ, Alfrey EJ, Desai DM, MacConmara M, Hwang CS. Increased risk of vascular thrombosis in pediatric liver transplant recipients with thrombophilia. J Surg Res. 2015;199(2):671–675. | ||
Funabashi N, Takaoka H, Ozawa K, et al. Combined ostium secundum type ASD and pulmonary arterial thromboembolism causing pulmonary artery enlargement, pulmonary hypertension and recurrent paradoxical cerebral embolism due to deep venous thrombosis. Int J Cardiol. 2016;207:303–307. | ||
Rodriguez-Zuniga MJM, Cortez-Franco F, Quijano-Gomero E. Association of psoriasis and metabolic syndrome in Latin America: a systematic review and meta-analysis. Actas Dermosifiliogr. 2017;108(4):326–334. | ||
O’Neill S, Bohl M, Gregersen S, Hermansen K, O’Driscoll L. Blood-based biomarkers for metabolic syndrome. Trends Endocrinol Metab. 2016;27(6):363–374. | ||
Kim HL, Lee JM, Seo JB, et al. The effects of metabolic syndrome and its components on arterial stiffness in relation to gender. J Cardiol. 2015;65(3):243–249. | ||
Wiley JF, Carrington MJ. A metabolic syndrome severity score: a tool to quantify cardio-metabolic risk factors. Prev Med. 2016;88:189–195. | ||
Chen Q, Zhang Y, Ding D, et al. Metabolic syndrome and its individual components with mortality among patients with coronary heart disease. Int J Cardiol. 2016;224:8–14. | ||
Abbott E, Truong J, Rada K. Superior mesenteric artery thrombosis. Vis J Emerg Med. 2017;7:13–14. | ||
Chen X, Fan X, Tan J, et al. Palladin is involved in platelet activation and arterial thrombosis. Thromb Res. 2017;149:1–8. | ||
Czepluch FS, Meier J, Binder C, Hasenfuss G, Schäfer K. CCL5 deficiency reduces neointima formation following arterial injury and thrombosis in apolipoprotein E-deficient mice. Thromb Res. 2016;144:136–143. | ||
Foley JH, Walton BL, Aleman MM, et al. Complement activation in arterial and venous thrombosis is mediated by plasmin. EBioMedicine. 2016;5:175–182. | ||
Vardon Bounes F, Mujalli A, Cenac C, et al. The importance of blood platelet lipid signaling in thrombosis and in sepsis. Adv Biol Regul. Epub 2017 Sep 29. | ||
Bhushan I, Alabbas A, Sistla JC, Saraswat R, Desai UR, Gupta RB. Heparin depolymerization by immobilized heparinase: a review. Int J Biol Macromol. 2017;99:721–730. | ||
Li Q, Han X, Lan X, et al. Inhibition of tPA-induced hemorrhagic transformation involves adenosine A2b receptor activation after cerebral ischemia. Neurobiol Dis. 2017;108:173–182. | ||
Ebben HP, Nederhoed JH, Slikkerveer J, et al. Therapeutic application of contrast-enhanced ultrasound and low-dose urokinase for thrombolysis in a porcine model of acute peripheral arterial occlusion. J Vasc Surg. 2015;62(2):477–485. | ||
Eltayeb TYM, Mohamed MS, Elbur AI, Elsayed ASA. Satisfaction with and adherence to warfarin treatment: a cross-sectional study among Sudanese patients. J Saudi Heart Assoc. 2017;29(3):169–175. | ||
Furugohri T, Morishima Y. Paradoxical enhancement of the intrinsic pathway-induced thrombin generation in human plasma by melagatran, a direct thrombin inhibitor, but not edoxaban, a direct factor Xa inhibitor, or heparin. Thromb Res. 2015;136(3):658–662. | ||
Lemarchant S, Docagne F, Emery E, Vivien D, Ali C, Rubio M. tPA in the injured central nervous system: different scenarios starring the same actor? Neuropharmacology. 2012;62(2):749–756. | ||
Schindewolf M, Gobst C, Kroll H, et al. High incidence of heparin-induced allergic delayed-type hypersensitivity reactions in pregnancy. J Allergy Clin Immunol. 2013;132(1):131–139. | ||
Harenberg J. Past, present, and future perspectives of heparins in clinical settings and the role of impaired renal function. Int J Cardiol. 2016;212(Suppl 1):S10–S13. | ||
Kim YJ, Kim SK, Cho SY, et al. Safety of acupuncture treatments for patients taking warfarin or antiplatelet medications: retrospective chart review study. Eur J Integr Med. 2014;6(4):492–496. | ||
Šupe S, Poljaković Z, Božina T, Ljevak J, Macolić Šarinić V, Božina N. Clinical application of genotype-guided dosing of warfarin in patients with acute stroke. Arch Med Res. 2015;46(4):265–273. | ||
Ichihara N, Ishigami T, Umemura S. Effect of impaired renal function on the maintenance dose of warfarin in Japanese patients. J Cardiol. 2015;65(3):178–184. | ||
Abu Fanne R, Nassar T, Yarovoi S, et al. Blood-brain barrier permeability and tPA-mediated neurotoxicity. Neuropharmacology. 2010;58(7):972–980. | ||
Jin H, Tan H, Zhao L, et al. Ultrasound-triggered thrombolysis using urokinase-loaded nanogels. Int J Pharm. 2012;434(1):384–390. | ||
Noel N, Dutasta F, Costedoat-Chalumeau N, et al. Safety and efficacy of oral direct inhibitors of thrombin and factor Xa in antiphospholipid syndrome. Autoimmun Rev. 2015;14(8):680–685. | ||
Goh M, Kim Y, Gwon K, Min K, Hwang Y, Tae G. In situ formation of injectable and porous heparin-based hydrogel. Carbohydr Polym. 2017;174:990–998. | ||
Bi F, Zhang J, Su Y, Tang YC, Liu JN. Chemical conjugation of urokinase to magnetic nanoparticles for targeted thrombolysis. Biomaterials. 2009;30(28):5125–5130. | ||
Duehrkop C, Leneweit G, Heyder C, et al. Development and characterization of an innovative heparin coating to stabilize and protect liposomes against adverse immune reactions. Colloids Surf B Biointerfaces. 2016;141:576–583. | ||
Cheng S, Zhang X, Wang W, et al. A class of novel N-(3S-1,2,3,4-tetrahydroisoquinoline-3-carbonyl)-L-amino acid derivatives: their synthesis, anti-thrombotic activity evaluation, and 3D QSAR analysis. Eur J Med Chem. 2009;44(12):4904–4919. | ||
Jin SM, Wang YN, Zhu HM, et al. Nanosized aspirin-Arg-Gly-Asp-Val: delivery of aspirin to thrombus by the target carrier Arg-Gly-Asp-Val tetrapeptide. ACS Nano. 2013;7(9):7664–7673. | ||
Yang GD, Zhu HM, Zhao M, et al. The application of tetrahydroisoquinoline-3-carbonyl-TARGD(F)F as an anti-thrombotic agent having dual mechanisms of action. Mol Biosyst. 2012;8(10):2672–2679. | ||
Wu J, Zhu H, Zhao M, et al. IQCA-TASS: a nano-scaled P-selectin inhibitor capable of targeting thrombus and releasing IQCA/TARGD(S)S in vivo. J Mater Chem B. 2017;5(5):917–927. |
Supplementary materials
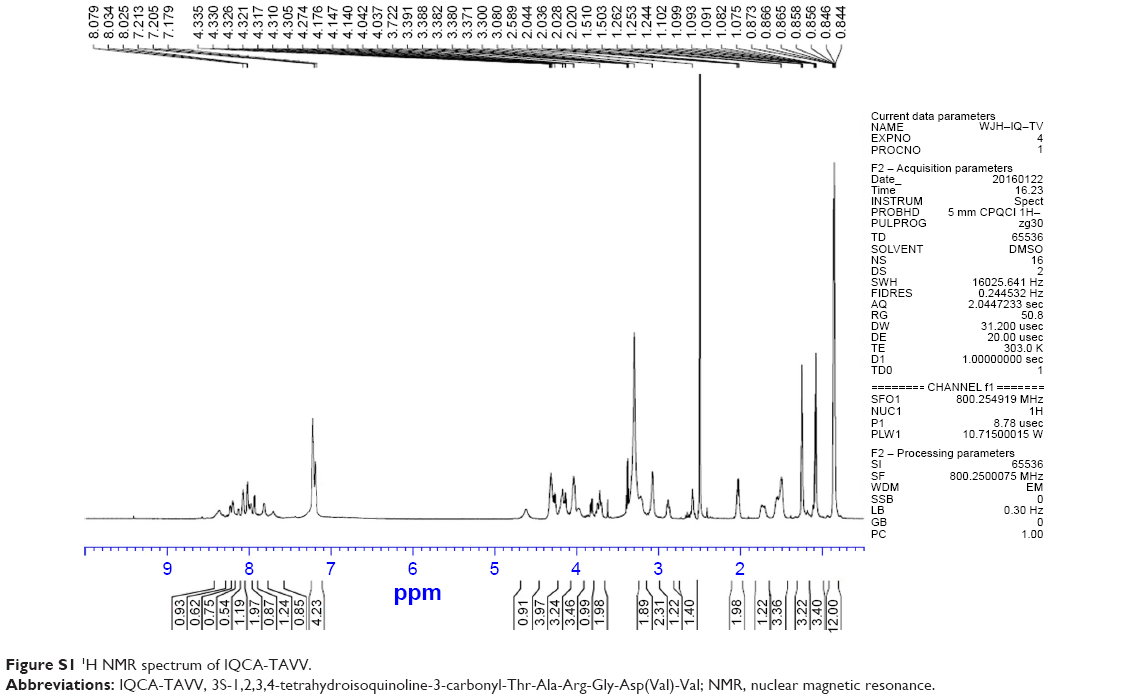 | Figure S1 1H NMR spectrum of IQCA-TAVV. |
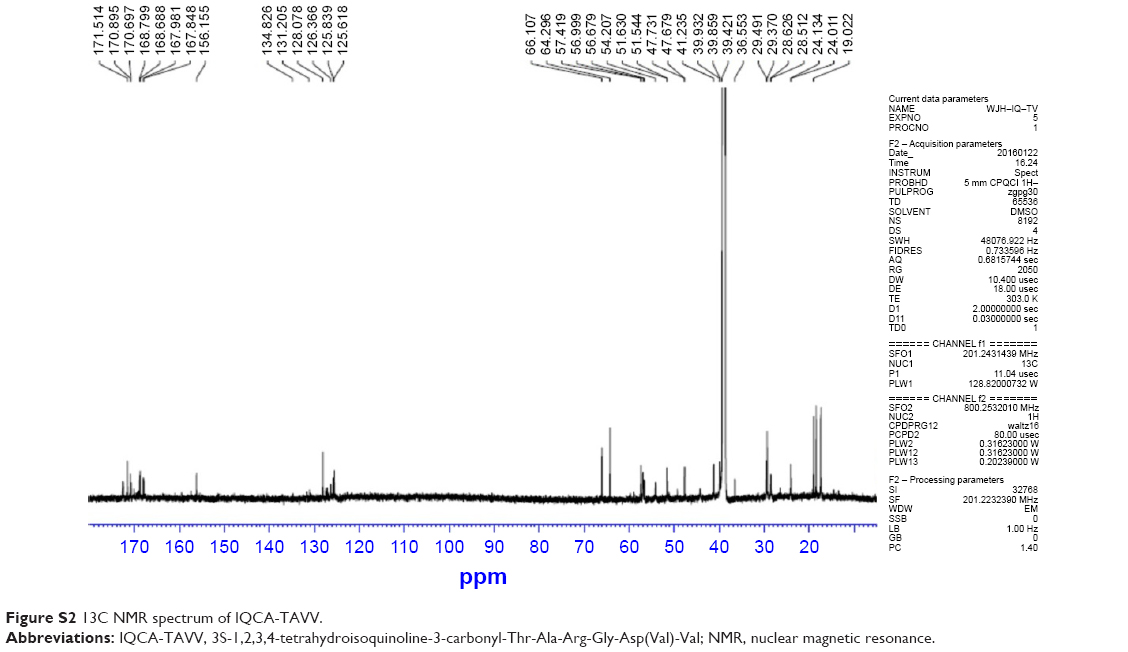 | Figure S2 13C NMR spectrum of IQCA-TAVV. |
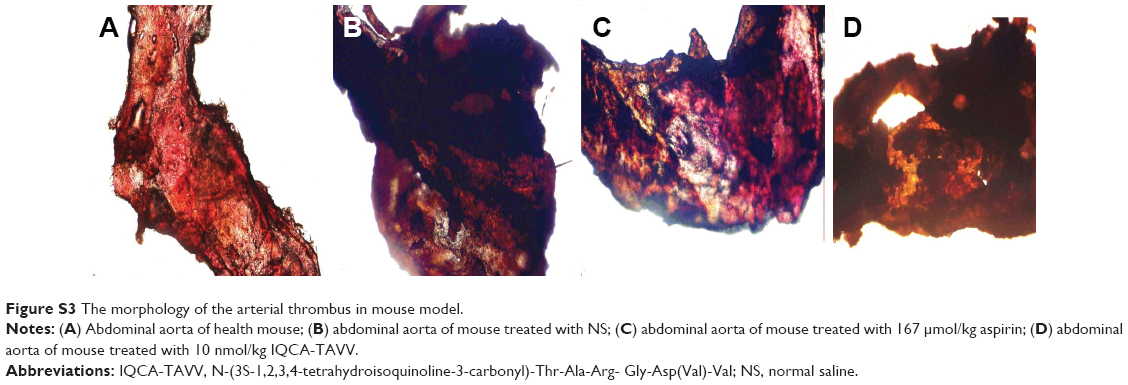 | Figure S3 The morphology of the arterial thrombus in mouse model. |
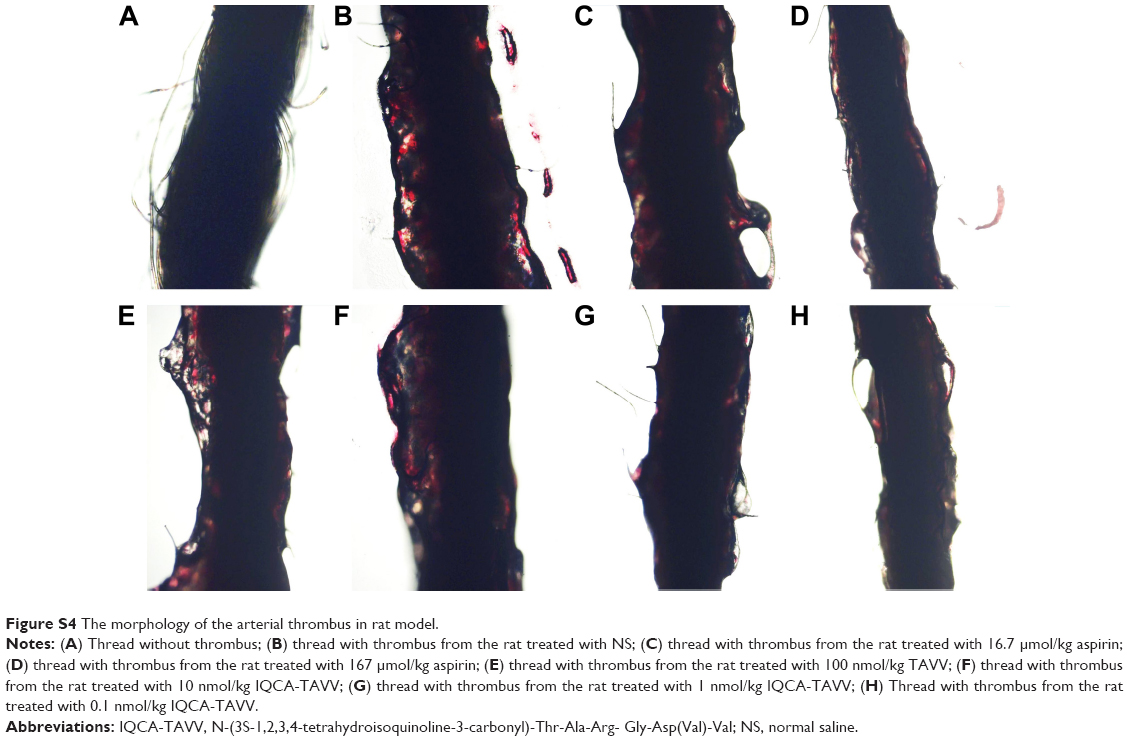 | Figure S4 The morphology of the arterial thrombus in rat model. |
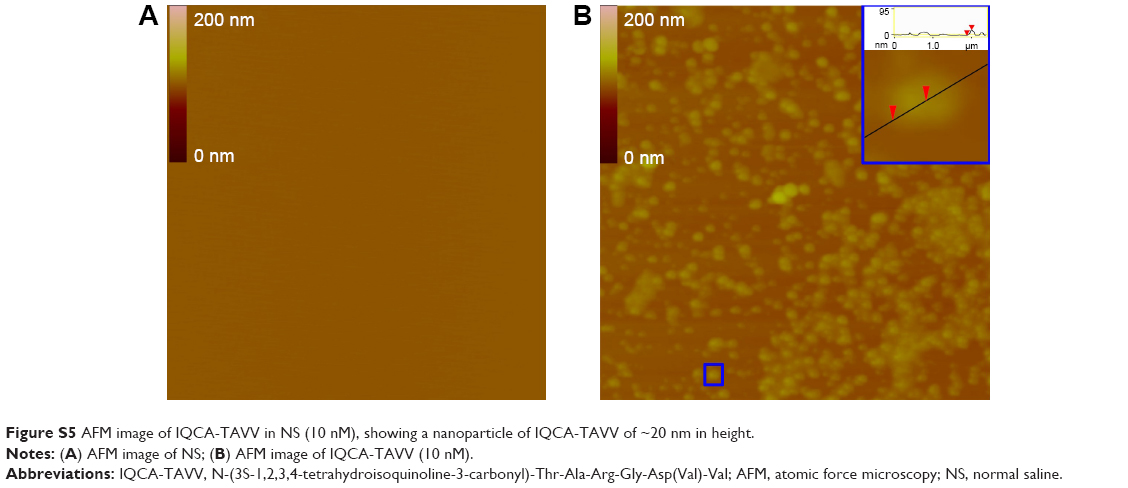 | Figure S5 AFM image of IQCA-TAVV in NS (10 nM), showing a nanoparticle of IQCA-TAVV of ~20 nm in height. |
 © 2018 The Author(s). This work is published and licensed by Dove Medical Press Limited. The full terms of this license are available at https://www.dovepress.com/terms.php and incorporate the Creative Commons Attribution - Non Commercial (unported, v3.0) License.
By accessing the work you hereby accept the Terms. Non-commercial uses of the work are permitted without any further permission from Dove Medical Press Limited, provided the work is properly attributed. For permission for commercial use of this work, please see paragraphs 4.2 and 5 of our Terms.
© 2018 The Author(s). This work is published and licensed by Dove Medical Press Limited. The full terms of this license are available at https://www.dovepress.com/terms.php and incorporate the Creative Commons Attribution - Non Commercial (unported, v3.0) License.
By accessing the work you hereby accept the Terms. Non-commercial uses of the work are permitted without any further permission from Dove Medical Press Limited, provided the work is properly attributed. For permission for commercial use of this work, please see paragraphs 4.2 and 5 of our Terms.