")
Back to Journals » International Journal of Nanomedicine » Volume 15
Design and Characterization of Chitosan-Graphene Oxide Nanocomposites for the Delivery of Proanthocyanidins
Authors Figueroa T, Aguayo C, Fernández K
Received 28 November 2019
Accepted for publication 23 January 2020
Published 20 February 2020 Volume 2020:15 Pages 1229—1238
DOI https://doi.org/10.2147/IJN.S240305
Checked for plagiarism Yes
Review by Single anonymous peer review
Peer reviewer comments 2
Editor who approved publication: Dr Thomas Webster
Toribio Figueroa,1 Claudio Aguayo,2 Katherina Fernández1
1Laboratory of Biomaterials, Department of Chemical Engineering, Faculty of Engineering, University of Concepción, Concepción, Chile; 2Department of Clinical Biochemistry and Immunology, Faculty of Pharmacy, University of Concepción, Concepción, Chile
Correspondence: Katherina Fernández
Laboratory of Biomaterials, Department of Chemical Engineering, Faculty of Engineering, University of Concepción, Concepción, Chile
Email [email protected]
Introduction: In the last years, the utilization of phytomedicines has increased given their good therapeutic activity and fewer side effects compared to allopathic medicines. However, concerns associated with the biocompatibility and toxicity of natural compounds, limit the phytochemical therapeutic action, opening the opportunity to develop new systems that will be able to effectively deliver these substances. This study has developed a nanocomposite of chitosan (CS) functionalized with graphene oxide (GO) for the delivery of proanthocyanidins (PAs), obtained from a grape seed extract (Ext.).
Methods: The GO-CS nanocomposite was covalently bonded and was characterized by Fourier transform infrared spectroscopy (FTIR), X-ray photoelectron spectroscopy (XPS), thermogravimetric analysis (TGA), scanning electron microscopy (SEM), atomic force microscopy (AFM) and by dynamic light scattering (DLS). The loading and release of Ext. from the GO-CS nanocomposite were performed in simulated physiological, and the cytotoxicity of the raw materials (GO and Ext.) and nanocomposites (GO-CS and GO-CS-Ext.) was determined using a human kidney cell line (HEK 293).
Results: The chemical characterization indicated that the covalent union was successfully achieved between the GO and CS, with 44 wt. % CS in the nanocomposite. The GO-CS nanocomposite was thermostable and presented an average diameter of 480 nm (by DLS). The Ext. loading capacity was approximately 20 wt. %, and under simulated physiological conditions, 28.4 wt.% Ext. (g) was released per g of the nanocomposite. GO-CS-Ext. was noncytotoxic, presenting a 97% survival rate compared with 11% for the raw extract and 48% for the GO-CS nanocomposite at a concentration of 500 μg mL-1 after 24 hrs.
Conclusion: Due to π–π stacking and hydrophilic interactions, GO-CS was reasonably efficient in binding Ext., with high loading capacity and Ext. release from the nanocomposite. The GO-CS nanocomposite also increased the biocompatibility of PAs-rich Ext., representing a new platform for the sustained release of phytodrugs.
Keywords: biomaterials, synthesis, chitosan, CS, proanthocyanidins, PAs, graphene oxide, GO, cytotoxicity, nanocomposite
Introduction
In recent decades, the utilization of phytomedicines has increased given their good therapeutic activity and fewer side effects compared to allopathic medicines. One promising phytodrug has arisen in the form of grape seed extract (Ext.), which has a high concentration of proanthocyanidins (PAs). PAs are flavonols, a class of polyphenols that have different substitution patterns in the C6-C3-C6 rings and are present in fruits and vegetables. PAs possess several bioactive effects, including antiviral, anti–inflammatory, cardioprotective, antidiabetic, anticancer, and anti-aging effects, among others.1 Despite the promising biological activities of raw plant extracts, their poor solubility and stability, short biological half-life, and rapid elimination hinder their clinical application.2 These aspects, together with concerns associated with the biocompatibility and toxicity of natural compounds, severely limit phytochemical therapeutic action, leading research interests towards the synthesis of systems that are able to effectively deliver these substances.3,4
Various carbonaceous materials have been used as drug delivery carriers, including carbon nanotubes, graphene, and graphene oxide (GO). Among these materials, GO stands out for its biomedical applications, enabled by its chemical, physical and mechanical properties.5 GO has a closely packed honeycomb two-dimensional lattice structure with sp2-bonded carbon atoms and is easily functionalized via π-π interaction with functional groups, such as epoxy, hydroxyl and carboxylic acid groups.6 Nevertheless, the major drawback of GO for biomedical applications is its jagged edges, which often lead to the disruption of nontargeted cells.7 Moreover, GO has been reported to exhibit dose-dependent hemolytic activity and controversial cytotoxicity.8 To minimize the risks associated with the biomedical application of GO, it is often functionalized with biocompatible polymers. A commonly used polymer that interacts with GO is chitosan (CS), which also has favorable properties of mucoadhesivity, biodegradability, antibacterial activity, low immunogenicity, a polyelectrolyte nature and solubility in various media.9 The cross-linked nature of CS makes it permeable to large molecules.10 Therefore, CS can be a suitable candidate for the delivery of phytodrugs, such as PAs obtained from Ext.
The GO and CS can be combined to yield favorable properties in a GO-CS composite, to be used as a biocompatible drug delivery agent (or carrier).11 Common forms of these composites for drug delivery have included composite films, hydrogels, aerogels, nanofibers and nanoparticles.6 Nanoparticles have mainly been used for the simultaneous release of genes and chemotherapy drugs.12–14 Although such carriers are useful for the transport of chemical compounds, no studies have immobilized phytodrugs on GO-CS nanoparticles.
The use of nanoparticles offers the possibility to develop delivery systems that are particularly adapted to improve the therapeutic efficacy of natural bioactive molecules.15 Indeed, nanocarriers have drawn increasing attention as potential alternatives to traditional formulation approaches, reducing toxicity, increasing bioavailability and permitting site-specific targeted delivery.3
Thus, the aim of this study was to develop a GO-CS nanocomposite loaded with Ext. for drug (PA) delivery. The GO-CS and GO-CS-Ext. nanocomposites were physicochemically characterized; the loading efficiency and release profile of Ext. from the nanocomposite was determined, and the cytotoxicity of both nanocomposites was evaluated and compared to that of the raw materials.
Materials and Methods
Materials
Graphite powder (Flake, mesh 325) was purchased from Asbury Online (Asbury Carbons, New Jersey, USA). All other chemicals and solvents, such as sulfuric acid (H2SO4, 98%), potassium permanganate powder (KMnO4, 99.9%) and hydrochloric acid (HCl, 37% v/v), were purchased from Merck (Darmstadt, Germany). Ethanol, acetone, 2-propanol, N-(3-dimethylaminopropyl-N-ethylcarbodiimide) hydrochloride (EDC), N-hydroxysuccinimide (NHS), CS, acetic acid, dimethyl sulfoxide (DMSO), 3-(4,5-dimethylthiazol-2-yl)-2,5-diphenyltetrazolium bromide (MTT) reagent, Dulbecco’s modified Eagles medium (DMEM), fetal bovine serum (FBS), phosphate buffered saline (PBS), and 2-(N-morpholino)ethanesulfonic acid (MES) were purchased from Sigma Aldrich (Saint Louis, USA). These chemicals were used as received without further purification. Milli-Q water was used throughout the study. For the sonication treatments, a probe sonicator (Branson 450 model, 42 kHz, 240 W) was used.
País Grape Seed Extract Production
Natural extracts rich in PAs were produced from the seed of grapes from the cultivar País, following the methodology described by Morales et al (2014). The seeds of 200 País grapes were separated manually and extracted separately in Erlenmeyer flasks with a solution of acetone in water (250 mL, 33% v/v) using a New Brunswick G24 gyratory shaker (New Brunswick Scientific Co., Edison, NJ) for 15 h at room temperature and in the dark to avoid oxidation.16 The acetone was removed under reduced pressure and temperature (<35 °C) in a rotary evaporator (Bibby Sterilin Ltd., RE-100B, Stone Staffordshire, England) until 50 mL of Ext. remained. The liposoluble compounds in the grape extracts were removed by washing with n-hexane (50 mL, three times).
The raw extracts were purified according to size exclusion chromatography using Toyopearl HW-40F resin packed in an Omnifit column (420 Å, 35 mm, 7 mL min−1).17 The column was equilibrated with ethanol/water (55:45, v/v) (two column volumes). The skin and seed extracts were separately loaded into the column; the sugars and phenolic acids were removed with ethanol/water (55:45, v/v) (three column volumes). This fraction was discarded and not analyzed. Then, acetone/water (60:40, v/v) (one column volume) was used to elute the PA fraction. Acetone present in this fraction was evaporated at reduced pressure and temperature (<35 °C), and the seed extracts (Ext.) were lyophilized separately to yield 2.31 mg g−1 grape seed, which was stored at 4 °C for further analysis.
The PAs in each extract was characterized by total phenol content, mean degree of polymerization (mDP) (determined by acid-catalyzed depolymerization (phloroglucinolysis) followed by HPLC detection),18 average molecular weight (aMW), and molar composition of the extracts. The molecular weight distribution of the extracts was determined by gel permeation chromatography (GPC).19 The details of the methodology and results for these assays are presented in Table S1 and Table S2, which are included in the supplementary information.
Preparation of the Chitosan-Grafted GO Nanocomposite (GO-CS)
The GO precursor was synthesized from natural graphite powder using a modified Hummers method.20 Then, the nanocomposite GO-CS was prepared by the amidation of GO with CS in the presence of EDC and NHS.21 First, CS (0.5 g, 2.77 mmol) and GO (0.1 g, 0.17 mmol) were dispersed in 50 mL of MES buffer (0.1 M, pH adjusted to 5) and sonicated in a probe sonicator for 15 min to obtain a homogeneous colloidal suspension. EDC (0.652 g, 3.4 mmol) and NHS (0.782 g, 6.8 mmol) were charged into the flask in an inert atmosphere (N2). The reaction proceeded at room temperature under bath sonication for six h, after which magnetic stirring was performed at 250 RPM for another 16 h. After the reaction was finished, the suspension was washed with an acetic acid solution (0.1 M) to remove unreacted CS. Then, the solid material was redispersed and dialyzed (MW cutoff =12 kDa) against Milli-Q water at 4°C for 3 days. The final product was lyophilized to obtain a powder.
Nanocomposite Characterization
The developed nanocomposites and their components were characterized using different analytical methods. Fourier transform infrared (FTIR) spectroscopy (Perkin Elmer UATR Two FTIR Spectrometer, USA) was used to characterize GO, GO-CS and CS samples at wavenumbers ranging from 500 to 4000 cm−1. X-ray photoelectron spectroscopy (XPS) (Surface Analysis Station, model RQ300/2, USA) was used for the surface chemistry analysis of the samples, with a monochromatic Al Ka X-ray source operating at 15 kV and 5 mA. The core-level spectra were obtained at a photoelectron take-off angle of 90° measured with respect to the sample surface. Thermogravimetric analysis (TGA) was used to evaluate the thermal stability of the GO, CS and GO-CS samples by using a NETZSCH STA 409 PC/PG at a heating rate of 10°C min−1; the temperature was scanned from room temperature to 500°C in a nitrogen atmosphere (100 mL min−1). Atomic force microscopy (AFM) measurements were performed in AC mode using an OmegaScope 1000 (AIST-NT Inc., USA). The samples for AFM were prepared by dropping the GO solutions onto a silica wafer (≈0.01 mg mL−1) and incubating for 20 min, followed by washing the samples in 2-propanol and drying them under ambient conditions for 2 h. Scanning electron microscopy (SEM) was performed using a JEOL JSM-6380LV microscope at 10 kV. The aqueous GO and GO-CS suspensions (50 mg mL−1) were freeze-dried for 2 days. The powdered samples were coated using a gold sputter coater, and the surfaces were observed at different resolutions to compare the internal structures. The hydrodynamic size and z-potential of the samples were determined using a dynamic light scattering (DLS) analyzer (SZ-100-Z, Horiba Ltda., Japan). The nanocomposites were suspended in Milli-Q® water at a concentration of 0.05 g L−1. Each sample was measured in a polystyrene container (DTS0012). To confirm Ext. loading, UV–vis spectra of GO-CS and GO-CS-Ext. were recorded by using a Spectroquant® Prove 600 spectrometer (Merck KGaA, Germany) from 250 to 700 nm with a resolution of 0.1 nm. Additionally, UV–vis at 765 nm was used for phenolic concentration determination with Folin-Ciocalteu reagent.
Loading and in-vitro Release of PAs from GO-CS
Initially, 10 mL Milli-Q water was added to 0.5 mg mL−1 GO-CS over the course of one hour to hydrate the powdered nanocomposite. Then, 100 mL Ext. (0.5, 1 and 1.5 mg mL−1) was poured into Milli-Q water solutions of the nanocomposite and magnetically stirred for 72 h. Sixteen samples of supernatant (0.5 mL) were extracted at selected time intervals, and the total phenol concentrations were measured using Folin-Ciocalteu reagent.22 The nanocomposite was recovered by centrifugation (2000 g, 20 min), resuspended in Milli-Q water (20 mL) and then filtered through a 2 μm filter to fully remove any solid. The obtained solution was then dialyzed (Spectra/Por® Dialysis membrane, MWCO =12 kDa) against Milli-Q water for 6 h to remove the small amount of solubilized free extract and impurities. The resulting GO-CS-Ext. solution was preserved at 4°C or lyophilized and then powdered for later use. To evaluate the Ext. release from GO-CS-Ext., 50 mg of GO-CS-Ext. nanocomposite powder was dissolved in 10 mL of PBS, placed into an inner dialysis tube (MWCO =12 kDa) and dialyzed against 90 mL PBS buffer in an outer flask, which was incubated in an orbital shaker (100 rpm) at 37°C for 3 days. At selected time intervals, 0.5 mL of the dialyzate was removed from the flask and replaced with an equal volume of fresh PBS buffer. The difference in total phenol content between the original PBS solution and the dialyzate (with dissolved extract) at time ti was determined by Folin-Ciocalteu assay,22 using a Spectroquant® Prove 600 (Merck KGaA, Germany) at a wavelength of 765 nm. The amount of extract released from the nanocomposite, Qd(ti), at time ti was calculated using the following equation: Qd(ti) = qd(ti) m−1, where qd(ti) is the content of total phenols in the medium (mg eq. gallic acid mg−1 extract) and m is the mass of nanocomposite (mg).
In vitro Cytotoxicity Study of the Nanocomposites
The cytotoxicity was determined using the MTT assay. HEK 293 cells (purchased from Merck KGaA, Germany) were cultured in DMEM medium supplemented with 5% heat-inactivated FBS, 100 units per mg penicillin, and 100 μg mL−1 streptomycin at 37 °C, 5% CO2, and 95% relative humidity. MTT was used as an indicator of cell viability as determined by its mitochondrial-dependent reduction to formazan. In detail, 100 μL of cells were seeded into 96-well plates at a density of 105 cells mL−1. After incubation for 24 h, the culture media were replaced with fresh media (100 μL) containing free extract, GO-CS or GO-CS-Ext. at selected concentrations (50, 100, 200, 250, 300, 400 and 500 mg mL−1) for an additional 24 h. In the case of GO-CS-Ext., the concentration of Ext. released was calculated based on previous studies of drug loading and release, eg, to obtain a 100 μg mL−1 Ext. concentration in media culture, 1.6 mg mL−1 GO-CS-Ext. should be used to yield an equivalent concentration to that of free extract. After the cells were washed with PBS to remove the media and remaining particles, 10 μL MTT (5 mg mL−1 in PBS) was added to the wells for 4 h. Then, the supernatant was removed by aspiration, and the formazan crystals were dissolved in DMSO (100 μL per well), followed by shaking for 5 min. The absorbance was read using a microplate reader (Spectra Plus, TECAN, USA) at a wavelength of 570 nm. The cell viability (%) relative to control cells was calculated from A test/(A control)×100%, where A test and A control are the absorbance values of the wells (with the nanocomposites) and control wells (without the nanocomposites), respectively. For each sample, the final absorbance was the average of measured values from six wells in parallel.
Statistics
All experimental designs were performed at least in triplicate, and the results are expressed as arithmetic means with the standard deviation (mean ± S.D.), as determined using Statgraphics Centurion XVI® software, with a statistical significance of p ≤ 0.05. The mean values and the error bars are reported in each figure.
Results
Characterization of GO-CS Nanocomposites
In the FTIR spectra (Figure 1A), GO shows the following characteristic peaks: 3354 cm−1, indicating O-H deformation; 1710 cm−1, corresponding to C=O bonds; 1599 cm−1, corresponding to C=C bonds; and 1386 cm−1 and 1042 cm−1, indicating the presence of C-O groups. The CS spectra show peaks at 3294 cm−1 (O-H deformation); 1715 cm−1, indicating the presence of C=O bonds; 1554 cm−1, corresponding to the bending of N-H in amide groups; and 1460 cm−1 and 1030 cm−1, corresponding to C-O bonds. The GO-CS spectra show peaks at 3352 cm−1 (O-H distortion) and 1634 cm−1, as well as a superposition band assigned to the amine groups of CS and carboxylated groups of GO, 1333 cm−1 and 1245 cm−1, indicating C-O bonds. Additionally, the characteristic signal of secondary amides (N–H bending) shifts from 1541 to 1569 cm−1 (between the CS and GO-CS signals).
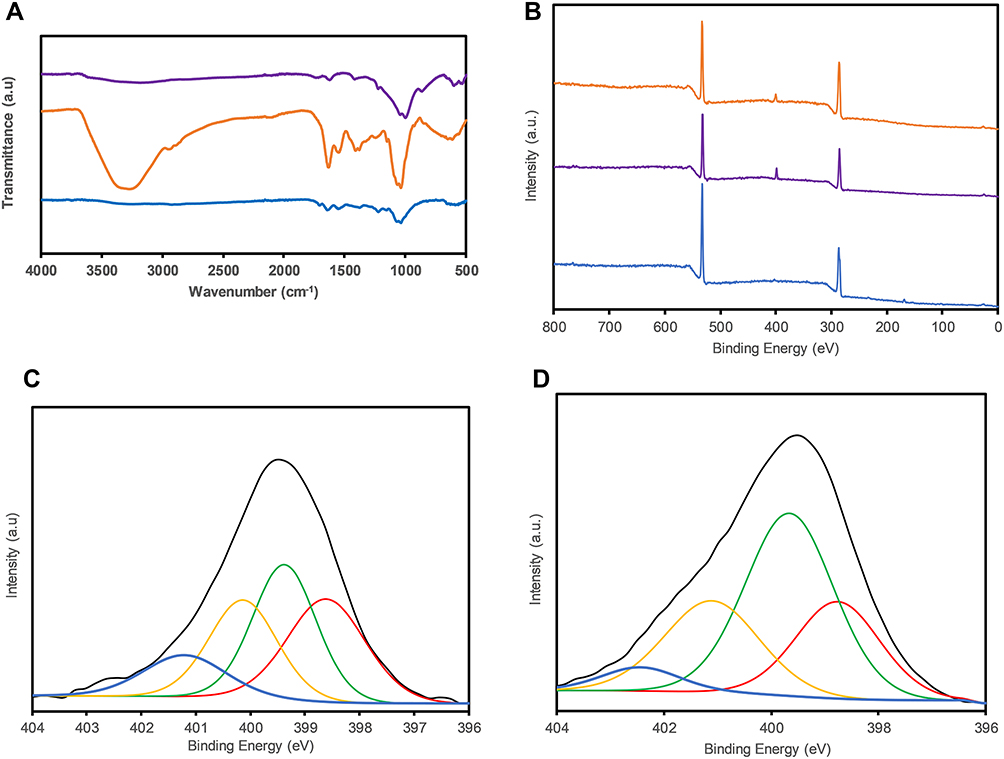 |
Figure 1 (A) FTIR and (B) XPS spectra of GO (blue), CS (purple) and GO-CS (orange), The N 1s band (black) of (C) CS and (D) GO-CS with the deconvoluted peaks of N-C (red), amine C-NH2 (green), amide N-C=O (yellow) and protonated C-NH4+ (blue) bonds. |
The XPS spectra of GO, GO-CS, and CS are shown in Figure 1B, where the GO spectrum differs from those of CS and GO-CS by the absence of the N 1s band at 399 e.V. Figure 1C and 1 (D) compare the N 1s peaks after deconvolution, and the area ratios were evaluated to determine the compositions. The N 1s bands existing only in CS and GO-CS represent N-C (398.6 e.V.), amine C-NH2 (399 e.V.), amide N-C=O (400.5 e.V.) and protonated C-NH4+ bonds (401.6 e.V.). The area ratio of the amide bond peak increased from 12.7% in CS to 24.8% in the GO-CS nanocomposite, and a decrease in the amine peak from 32.2% in CS to 23.6% in GO-CS was observed.
TGA revealed the composition and changes in the thermal stability of the GO, CS and GO-CS nanocomposite (Figure 2). GO and GO-CS start to lose mass below 120°C, and mass loss decreases rapidly close to 196 °C; for CS, the mass loss begins sooner. The DTG curves show rapid weight loss in GO at 198 °C and CS at 240 °C and show 2 rapid weight loss peaks in the GO-CS nanocomposite at 203 °C and 255 °C (the DTG curves are shown in Figure 1S in the supplementary information). Finally, at 400°C, GO-CS shows a 48% weight loss, whereas GO and pure CS have weight losses of 32% and 61%, respectively. On the basis of these results, we calculated a 44% mass content of CS in the GO-CS nanocomposite.
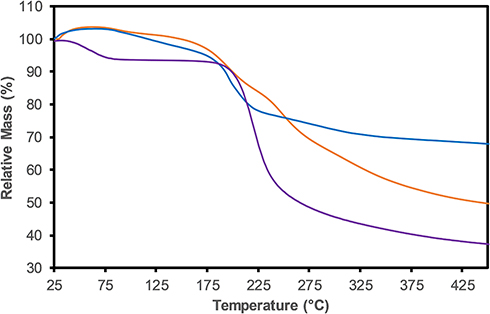 |
Figure 2 TGA curves of GO (blue), CS (purple) and GO-CS (orange). |
The GO surface morphology was analyzed by SEM (Figure 3A). The GO sheets became smooth and layered in macrostructures formed during lyophilization during sample preparation. The particle morphology was further analyzed by AFM (Figure 3B), where a GO-CS sheet was isolated with a diameter of 850 nm. This value was higher than the hydrodynamic diameter measured by DLS (480±70 nm), probably caused by the AFM sampling preparation technique. Additionally, a height profile (Figure 3C) was extracted, and a single plane of a GO-CS particle presented a 1.5 nm height. Finally, a CS particle approx. 3 nm in height can be seen on the sheet border. The z-potential of the GO was −54.7±4.1 mV, and this value changed as a result of CS addition to +47.2 ±3.2 mV for the GO-CS nanocomposite.
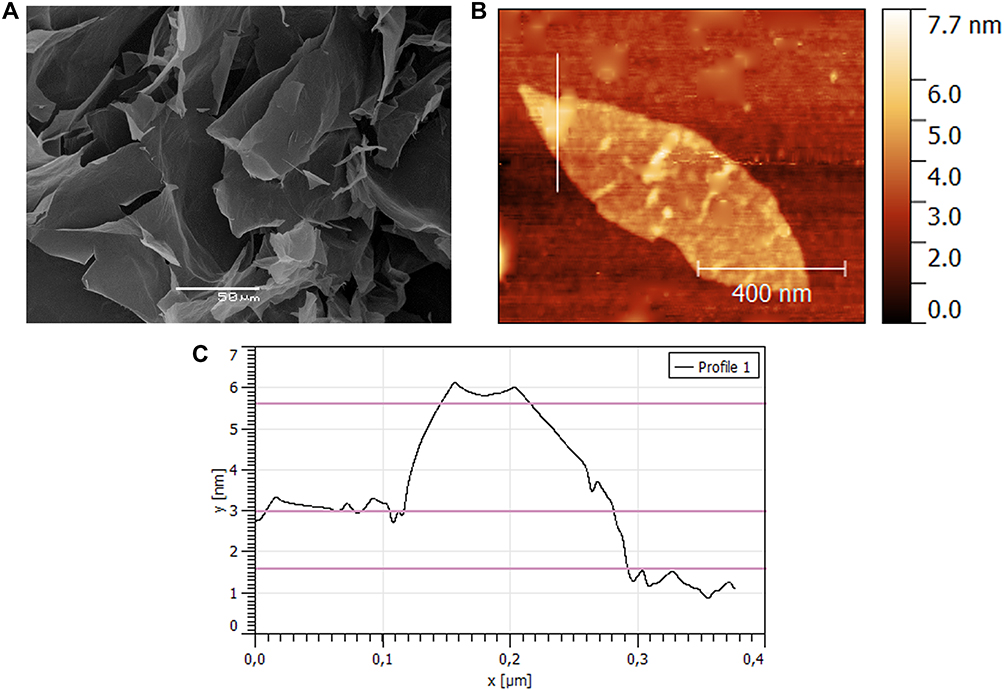 |
Figure 3 (A) SEM image of a GO sample, (B) No-contact AFM image of a GO-CS sheet, (C) Extracted height profile of a GO-CS sample from AFM. |
PA Loading and Release
The loading of Ext. onto the GO-CS nanocomposite was evidenced via UV–Vis spectra (Figure 4A), which show absorbance peaks at 300 nm for the GO-CS nanocomposite and 300 nm for the GO-CS-Ext. spectrum. The shift of 30 nm is explained by the strong π-π interactions and hydrogen bonds between Ext. and the hydrophobic zones of the GO surface and hydrogen bonds with oxygenated groups.
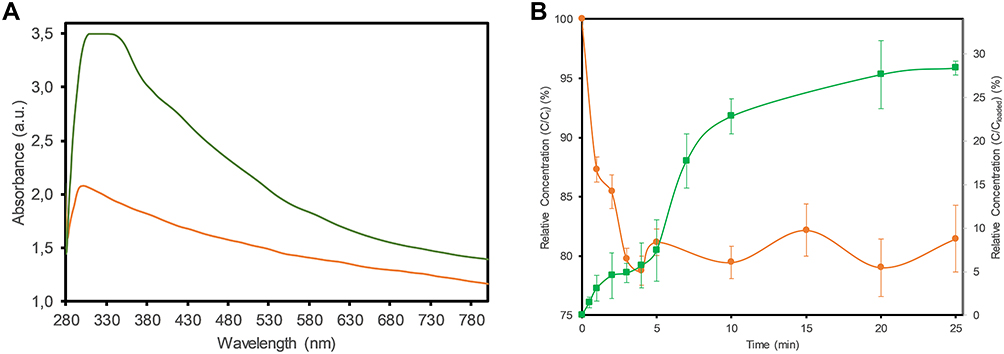 |
Figure 4 (A) UV–Vis absorption spectra of GO-CS (orange) and loaded GO-CS-Ext. (green). (B) Adsorption profile of Ext. on GO-CS in water (orange ●) and in vitro release profile of Ext. from GO-CS-Ext. (green ■) in PBS buffer (pH 7.4) at 37 °C. |
The adsorption of the extract on the nanocomposite is shown in Figure 4B (left axis). In the beginning, high-speed adsorption was observed, and after only 5 min, smooth changes were present (approx. 20% absorbed). After 25 min, the sample measurements were not significantly different, reaching a steady-state (data not shown). The extract loading capacity on the GO-CS nanocomposite was 0.22 ± 0.02 g (n =6) of extract per g of nanocomposite (equivalent to 72.8 µmol of extract per g of nanocomposite). With extract loading, the electrical charge of the nanocomposite surface was reduced from +47.2 ± 3.1 mV for GO-CS to +30.5 ± 1.6 mV for GO-CS-Ext.
The release profile of PA extract from GO-CS was simulated under physiological conditions (PBS, pH 7.4, 35 °C). In the profile (Figure 4B, right axis), a change in velocity was observed at approximately 5 min, but release then occurred until 10 min, reaching a plateau value close to 25 min. No significant difference was observed after 24 h of sampling (data not shown). Thus, 28.4% (in mass) of the loaded extract in the nanocomposite was released in 25 min.
Cell Viability
In this study, we used human embryonic kidney (HEK) cells as an in vitro model since the kidney participates in the metabolism of flavonoids in the body.23 Figure 5 presents the cell viability of HEK cells, measured by MTT assay, for GO, Ext. and nanocomposites. GO cytotoxicity (blue line) was not present below 100 µg mL−1 (p<0.05 compared with the control). Higher concentrations of GO particles decreased the cell viability (p<0.05) via a directly dependent relation, with only 48% viability of the cell population at 500 µg mL−1. The addition of CS to form the GO-CS nanocomposite (orange line) increased the cell viability for all tested concentrations studied. The samples did not show a significant difference from the control (p>0.05), with a 97% survival rate observed at a concentration of 500 µg mL−1.
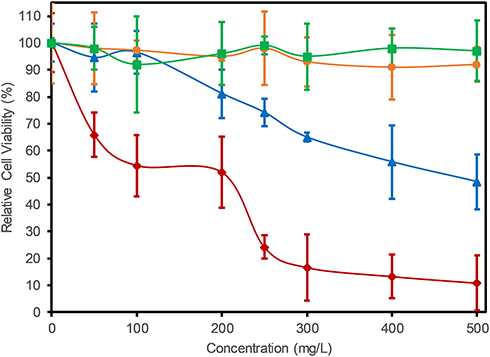 |
Figure 5 In vitro cell toxicity assay. Relative cell viability of HEK cells treated with GO (blue ▲), Ext. (dark red ♦), GO-CS (orange ●) and GO-CS-Ext. (green ■) at different concentrations. Controls were cells without the addition of the studied samples. |
The cell viability of the raw extract (red line) decreased rapidly with increasing concentration compared with the control (p<0.05), reaching 11% at 500 µg mL−1 extract (165 mM). The immobilization of the extract on the GO-CS nanocomposite increased cell viability for all the extract concentrations evaluated (green line), showing no significant difference from the control (p>0.05), with final cell viability of 97% at 500 µg mL−1 extract (165 mM).
Discussion
To form the GO-CS nanocomposites, we used a covalent combination of GO and CS, as reported in Bao et al (2011). The covalent bonding between GO and CS was evidenced by FTIR spectroscopy, presenting peaks at 3294 cm−1, indicative of CS and GO conjugation, and 3352 cm−1, corresponding to GO-CS bonds, as previously reported.21 The XPS spectra showed a C 1s energy shift, indicating the influence of graphene’s aromatic carbon multiple bonds on the CS chains.10,24 Furthermore, the proportional area of the characteristic signal of secondary amides increased, indicating the presence of newly formed amide bonds between the carboxylic groups of GO and the amine groups of CS.
The unexpected variations at the beginning of the TGA curve below 120 °C can be attributed to the volatilization of stored water in the π-stacked structure of the nanocomposite.25 The reaction used to compare the samples occurred at approximately 200 °C and is attributed to the pyrolysis of labile oxygen-containing groups.26 TGA also confirmed the union of GO-CS through the difference in degradation temperature between GO and GO-CS (from 240 °C to 255 °C), which is associated with the enhanced thermal stability of GO resulting from the union with CS chains. In addition, TGA indicated a mass composition of 44% CS on the nanocomposite, which was higher than the 32% reported by Bao et al (2011) in their work investigating GO-CS nanoparticle synthesis. The higher amount of CS in the composition of the GO-CS nanocomposite might be due to the higher average molecular weight (aMW) of the CS used in our synthesis. In this study, we used CS with a MW of 50 kDa, in contrast to the 3 kDa CS used by Bao et al (2011). A higher aMW of CS chains has a reported positive effect on the drug loading capacity of the carrier but also an adverse effect on the amount of drug released.27 Nevertheless, a negative effect was not observed in our results, which showed higher cumulative drug release than the work of Bao et al (2011), possibly attributed to different mass transfer limitations or a different process of desorption between the grape extract used in this study and the nanocomposite.
Once we confirmed the covalent union of GO-CS, the nanocomposite morphology was studied using AFM. The particle images show CS bonded on the GO surface, especially on the borders of GO sheets, which could be caused by carboxylic groups at the GO edge, as part of the amidation reaction.26 Additionally, the height profile shows a larger GO sheet width of 1.5 nm compared with the literature value of approximately 0.9 nm,5 which can be attributed to bilayer GO sheet formation or oxygenated groups on the planar surface and borders of the GO.25 The particle size determined from AFM images was higher than that obtained from DLS, probably due to the AFM sampling preparation technique, where isolating large GO particles on the silica wafer is easier than isolating smaller particles.25 Based on the previous analyses, we achieved the successful formation of amidic bonds between GO and CS to produce a thermally stable nanocomposite.
The loading of Ext. on the nanocomposite was first studied via UV–vis, where a wavenumber shift of 30 nm between GO-CS and GO-CS-Ext. was observed and was explained by the strong π-π interactions and hydrogen bonds of Ext. with the GO’s oxygenated groups.28 Various drugs have been successfully loaded onto GO via π-π stacking interactions between the large π-conjugated structure of GO and aromatic structures, such as PAs, on the Ext.,29 The GO-CS-Ext. composite showed a good loading capacity of approximately 20 wt.% compared with studies of other graphitic materials and polyphenolic compounds30 or other GO nanocomposites bound with CS and folic acid.31 Furthermore, the incorporation of CS and Ext. stabilized the GO-CS-Ext. nanocomposite, changing the surface charge from negative to positive, which is a previously observed stabilizing property of CS.32
The release profile of Ext. from GO-CS indicated rapid liberation, reaching a stable value in 25 min. In comparison to the results observed in the study of Bao et al (2011), who used camptothecin as a loading drug, our release profile was different. The faster liberation and the higher amount released can be attributed to different mass transfer limitations or to a different process of desorption between the Ext. and the GO-CS nanocomposite.33 One important and well-reported effect on synthetic phenolic drug loading and release is dependence on pH; for example, Khoee et al (2017) synthesized chitosan-coated GO mesoporous silica nanoparticles and showed that the cumulative release of doxorubicin at lower pH was higher than that at physiological pH.33 In another study, Chen et al (2014) showed the same behavior by a GO and CS xerogel loaded with doxorubicin when the nanocomposite was in acidic media.34 This process might also affect the amount of Ext. released at physiological pH (7.4).
The total amount of released extract from the GO-CS-Ext. nanocomposite (165 mM) was comparable with the results of in vivo bioactivity studies of similar flavonoids. Van het Hof et al (1998) showed that after green tea consumption (3 g), which was equivalent to 0.9 g of catechins, the maximum blood concentration of catechins reached was 0.53 µM (approx. 300 times lower than our cell culture doses).35 Additionally, Hollman (2004) reported a maximum blood concentration of 0.08 µM in humans after an oral dose of 630 µmol PAs from chocolate ingestion.23 Comparing our results with the abovementioned results, we can assume that the GO-CS-Ext. nanocomposite will have observable bioactivity in humans or animals, considering the higher bioeffect attributable to the use of the developed nanocomposite delivery system.
The synthesis of nanocomposites for drug delivery is usually designed to reduce the toxicity of their components.6,24 In our case, we evaluated the cell viability of kidney cells (HEK) in the presence of CS, GO, Ext. and nanocomposites at concentrations up to 500 µg mL−1. The GO-CS nanocomposite had lower cytotoxicity than free GO and the GO-CS-Ext. complex was not cytotoxic compared with the raw extracts, probably due to CS interacting ionically with the negatively charged GO and Ext., forming polyelectrolyte complexes that interact better than their components with the negatively charged cell membrane, thus reducing cytotoxicity.9 Liao et al (2011) showed that GO nanoparticles have good cell viability on fibroblasts (>90% by MTT assay at a concentration of 200 µg mL−1).36 In another study, Sasidharan et al (2012) showed that GO nanoparticles have good hemocompatibility (>90% at a concentration of 75 µg mL−1). These studies present models for some of the biological barriers to drug pharmacokinetics. Nevertheless, GO-CS toxicity using kidney cells as a biological model has not been reported until now, and the results showed no cytotoxicity of the developed nanocomposites.
Since Ext. molecules pass through the plasma membrane by passive diffusion,37 a high dose is needed to achieve cell permeation, which can be accomplished by delivery with this nanocomposite. Complexes of drugs and GO-CS may be internalized by cells mainly through an efficient endocytic process.21 The positive charge of the nanocomposite, confirmed by the z-potential, may also improve the cellular uptake of GO-CS-Ext. via electrostatic interaction with the negatively charged cell membrane.6 As a drug delivery system, the GO-CS-Ext. nanocomposite presents great potential as a support for the evaluated phytodrug.
Conclusion
Currently, in medicine, drug delivery is important for actual drug bioactivity, especially for phytodrugs, which have beneficial properties but are easily degraded under physiological conditions. In this study, we report the synthesis of CS-functionalized GO as a nanocomposite to deliver Ext., which is rich in flavonoids, and evaluate its cytotoxicity on a human kidney cell line. Due to π–π stacking and hydrophilic interactions, GO-CS was reasonably efficient in binding Ext., with a high loading content of approximately 20 wt.%. Ext. release from the nanocomposite in vitro in simulated physiological media reached 28.4 wt.% of the mass originally loaded. The GO-CS-Ext. complexes were found to be nontoxic to kidney cells compared with the raw extract at the concentrations studied. Based on the above results, the GO-CS nanocomposite could increase the biocompatibility of Ext. and could be used as a new phytodrug delivery carrier. In further studies, we suggest in vivo confirmation of the biocompatibility of the loaded GO-CS-Ext. composite.
Acknowledgments
We thank FONDECYT-Chile for the financial support of this investigation, Project No. 1170681. The authors are grateful to FONDEQUIP Projects AFM No. EQM150139, University of Concepción, and XPS EQM 140044 2014–2016, MAINI, Universidad Católica del Norte.
Supporting Information
Determination of the structure composition, mean degree of polymerization (mDP), average molecular weight (aMW) and concentration of grape seed and skin extracts by phloroglucinolysis. Molecular weight distribution of grape seed and skin extracts by gel permeation chromatography (GPC). Derivative Thermogravimetry (DTG) of GO, GO-CS, CS.
Disclosure
The authors report no conflicts of interests in this work.
References
1. Georgiev V, Ananga A, Tsolova V. Recent advances and uses of grape flavonoids as nutraceuticals. Nutrients. 2014;6(1):391–415. doi:10.3390/nu6010391
2. Vale N, Ferreira A, Matos J, Fresco P, Gouveia MJ. Amino acids in the development of prodrugs. Molecules. 2018;23(9):2318. doi:10.3390/molecules23092318
3. Gunasekaran T, Haile T, Nigusse T, Dhanaraju MD. Nanotechnology: an effective tool for enhancing bioavailability and bioactivity of phytomedicine. Asian Pac J Trop Biomed. 2014;4(Suppl 1):S1–7. doi:10.12980/APJTB.4.2014C980
4. Conte R, De Luca I, De Luise A, Petillo O, Calarco A, Peluso G. New therapeutic potentials of nanosized phytomedicine. J Nanosci Nanotechnol. 2016;16(8):8176–8187. doi:10.1166/jnn.2016.12809
5. Rao C, Sood A, Subrahmanyam K, Govindaraj A. Graphene: the new two-dimensional nanomaterial. Angewandte Chemie Int Ed. 2009;48(42):7752–7777. doi:10.1002/anie.v48:42
6. Gooneh-Farahani S, Naimi-Jamal MR, Naghib SM. Stimuli-responsive graphene-incorporated multifunctional chitosan for drug delivery applications: a review. Expert Opin Drug Deliv. 2019;16(1):79–99. doi:10.1080/17425247.2019.1556257
7. Sasidharan A, Panchakarla LS, Sadanandan AR, et al. Hemocompatibility and macrophage response of pristine and functionalized graphene. Small. 2012;8(8):1251–1263. doi:10.1002/smll.201102393
8. Vallabani NV, Mittal S, Shukla RK, et al. Toxicity of graphene in normal human lung cells (BEAS-2B). J Biomed Nanotechnol. 2011;7(1):106–107. doi:10.1166/jbn.2011.1224
9. Agnihotri SA, Mallikarjuna NN, Aminabhavi TM. Recent advances on chitosan-based micro-and nanoparticles in drug delivery. J Control Release. 2004;100(1):5–28. doi:10.1016/j.jconrel.2004.08.010
10. Pan Y, Wu T, Bao H, Li L. Green fabrication of chitosan films reinforced with parallel aligned graphene oxide. Carbohydr Polym. 2011;83(4):1908–1915. doi:10.1016/j.carbpol.2010.10.054
11. Song X, Huang X, Li Z, et al. Construction of blood compatible chitin/graphene oxide composite aerogel beads for the adsorption of bilirubin. Carbohydr Polym. 2019;207:704–712. doi:10.1016/j.carbpol.2018.12.005
12. Zhao X, Wei Z, Zhao Z, et al. Design and development of graphene oxide nanoparticle/chitosan hybrids showing pH-sensitive surface charge-reversible ability for efficient intracellular doxorubicin delivery. ACS Appl Mater Interfaces. 2018;10(7):6608–6617. doi:10.1021/acsami.7b16910
13. Saravanabhavan SS, Rethinasabapathy M, Zsolt S, et al. Graphene oxide functionalized with chitosan based nanoparticles as a carrier of siRNA in regulating Bcl-2 expression on Saos-2 & MG-63 cancer cells and its inflammatory response on bone marrow derived cells from mice. mater Sci Eng C. 2019;99:1459–1468. doi:10.1016/j.msec.2019.02.047
14. Zhang F, Xie M, Zhao YW, et al. Chitosan and dextran stabilized GO-iron oxide nanosheets with high dispersibility for chemotherapy and photothermal ablation. Ceram Int. 2019;45(5):5996–6003. doi:10.1016/j.ceramint.2018.12.070
15. Bansal SS, Goel M, Aqil F, Vadhanam MV, Gupta RC. Advanced drug delivery systems of curcumin for cancer chemoprevention. Cancer Prev Res. 2011;4(8):1158–1171. doi:10.1158/1940-6207.CAPR-10-0006
16. Morales C, Roeckel M, Fernández K. Microscopic modeling of país grape seed extract absorption in the small intestine. AAPS PharmSciTech. 2014;15(1):103–110. doi:10.1208/s12249-013-0045-z
17. Fernández K, Kennedy JA, Agosin E. Characterization of Vitis vinifera L. Cv. Carménère grape and wine proanthocyanidins. J Agric Food Chem. 2007;55(9):3675–3680. doi:10.1021/jf063232b
18. Kennedy JA, Jones GP. Analysis of proanthocyanidin cleavage products following acid-catalysis in the presence of excess phloroglucinol. J Agric Food Chem. 2001;49(4):1740–1746. doi:10.1021/jf001030o
19. Williams VM, Porter LJ, Hemingway RW. Molecular weight profiles of proanthocyanidin polymers. Phytochemistry. 1983;22(2):569–572. doi:10.1016/0031-9422(83)83048-9
20. Marcano DC, Kosynkin DV, Berlin JM, et al. Improved synthesis of graphene oxide. ACS Nano. 2010;4(8):4806–4814. doi:10.1021/nn1006368
21. Bao H, Pan Y, Ping Y, et al. Chitosan-functionalized graphene oxide as a nanocarrier for drug and gene delivery. Small. 2011;7(11):1569–1578. doi:10.1002/smll.v7.11
22. Jerez M, Sineiro J, Nuñez MJ. Fractionation of pine bark extracts: selecting procyanidins. Eur Food Res Technol. 2009;229(4):651–659. doi:10.1007/s00217-009-1096-y
23. Hollman PC. Absorption, bioavailability, and metabolism of flavonoids. Pharm Biol. 2004;42(sup1):74–83. doi:10.3109/13880200490893492
24. Yang X, Tu Y, Li L, Shang S, Tao X. Well-dispersed chitosan/graphene oxide nanocomposites. ACS Appl Mater Interfaces. 2010;2(6):1707–1713. doi:10.1021/am100222m
25. Han D, Yan L, Chen W, Li W. Preparation of chitosan/graphene oxide composite film with enhanced mechanical strength in the wet state. Carbohydr Polym. 2011;83(2):653–658. doi:10.1016/j.carbpol.2010.08.038
26. Budnyak T, Pylypchuk I, Tertykh V, Yanovska ES, Kolodynska D. Synthesis and adsorption properties of chitosan-silica nanocomposite prepared by sol-gel method. Nanoscale Res Lett. 2015;10:87. doi:10.1186/s11671-014-0722-1
27. Dudhani AR, Kosaraju SL. Bioadhesive chitosan nanoparticles: preparation and characterization. Carbohydr Polym. 2010;81(2):243–251. doi:10.1016/j.carbpol.2010.02.026
28. Yu C-P, Shia C-S, Tsai S-Y, Hou Y-C. Pharmacokinetics and relative bioavailability of flavonoids between two dosage forms of gegen-qinlian-tang in rats. Evid-Based Complementary Altern Med. 2012;2012. doi:10.1155/2012/308018
29. Liu J, Cui L, Losic D. Graphene and graphene oxide as new nanocarriers for drug delivery applications. Acta Biomater. 2013;9(12):9243–9257. doi:10.1016/j.actbio.2013.08.016
30. Hashemi E, Akhavan O, Shamsara M, Rahighi R, Esfandiar A, Tayefeh AR. Cyto and genotoxicities of graphene oxide and reduced graphene oxide sheets on spermatozoa. RSC Adv. 2014;4(52):27213–27223. doi:10.1039/c4ra01047g
31. Deb A, Vimala R. Camptothecin loaded graphene oxide nanoparticle functionalized with polyethylene glycol and folic acid for anticancer drug delivery. J Drug Deliv Sci Technol. 2018;43:333–342. doi:10.1016/j.jddst.2017.10.025
32. Collado-González M, Montalbán MG, Peña-García J, Pérez-Sánchez H, Víllora G, Baños FGD. Chitosan as stabilizing agent for negatively charged nanoparticles. Carbohydr Polym. 2017;161:63–70. doi:10.1016/j.carbpol.2016.12.043
33. Khoee S, Bafkary R, Fayyazi F. DOX delivery based on chitosan-capped graphene oxide-mesoporous silica nanohybride as pH-responsive nanocarriers. J Solgel Sci Technol. 2017;81(2):493–504. doi:10.1007/s10971-016-4213-y
34. Chen Y, Qi Y, Yan X, et al. Green fabrication of porous chitosan/graphene oxide composite xerogels for drug delivery. J Appl Polym Sci. 2014;131:6.
35. Van Het Hof KH, Kivits GAA, Weststrate JA, Tijburg LBM. Bioavailability of catechins from tea: the effect of milk. Eur J Clin Nutr. 1998;52(5):356. doi:10.1038/sj.ejcn.1600568
36. Liao K-H, Lin Y-S, Macosko CW, Haynes CL. Cytotoxicity of graphene oxide and graphene in human erythrocytes and skin fibroblasts. ACS Appl Mater Interfaces. 2011;3(7):2607–2615. doi:10.1021/am200428v
37. Manach C, Williamson G, Morand C, Scalbert A, Remesy C. Bioavailability and bioefficacy of polyphenols in humans. I. Review of 97 bioavailability studies. American J Clin Nutr. 2005;81(1):230S–242S. doi:10.1093/ajcn/81.1.230S
 © 2020 The Author(s). This work is published and licensed by Dove Medical Press Limited. The full terms of this license are available at https://www.dovepress.com/terms.php and incorporate the Creative Commons Attribution - Non Commercial (unported, v3.0) License.
By accessing the work you hereby accept the Terms. Non-commercial uses of the work are permitted without any further permission from Dove Medical Press Limited, provided the work is properly attributed. For permission for commercial use of this work, please see paragraphs 4.2 and 5 of our Terms.
© 2020 The Author(s). This work is published and licensed by Dove Medical Press Limited. The full terms of this license are available at https://www.dovepress.com/terms.php and incorporate the Creative Commons Attribution - Non Commercial (unported, v3.0) License.
By accessing the work you hereby accept the Terms. Non-commercial uses of the work are permitted without any further permission from Dove Medical Press Limited, provided the work is properly attributed. For permission for commercial use of this work, please see paragraphs 4.2 and 5 of our Terms.