")
Back to Journals » International Journal of Nanomedicine » Volume 14
Design And Characterisation Of Novel Sorafenib-Loaded Carbon Nanotubes With Distinct Tumour-Suppressive Activity In Hepatocellular Carcinoma
Authors Elsayed MMA , Mostafa ME, Alaaeldin E , Sarhan HAA, Shaykoon MS, Allam S , Ahmed ARH , Elsadek BEM
Received 20 July 2019
Accepted for publication 5 October 2019
Published 29 October 2019 Volume 2019:14 Pages 8445—8467
DOI https://doi.org/10.2147/IJN.S223920
Checked for plagiarism Yes
Review by Single anonymous peer review
Peer reviewer comments 2
Editor who approved publication: Dr Thomas Webster
Mahmoud MA Elsayed,1 Mahmoud E Mostafa,2 Eman Alaaeldin,2,3 Hatem AA Sarhan,2 Montaser ShA Shaykoon,4 Shady Allam,5 Ahmed RH Ahmed,6 Bakheet EM Elsadek7
1Department of Pharmaceutics and Clinical Pharmacy, Faculty of Pharmacy, Sohag University, Sohag, Egypt; 2Department of Pharmaceutics, Faculty of Pharmacy, Minia University, Minia, Egypt; 3Department of Clinical Pharmacy, Deraya University, Minia, Egypt; 4Department of Pharmaceutical Chemistry, Faculty of Pharmacy, Al-Azhar University, Assiut Branch, Assiut, Egypt; 5Department of Pharmacology and Toxicology, Faculty of Pharmacy, Kafrelsheikh University, Kafrelsheikh, Egypt; 6Department of Pathology, Faculty of Medicine, Sohag University, Sohag, Egypt; 7Department of Biochemistry and Molecular Biology, Faculty of Pharmacy, Al-Azhar University, Assiut Branch, Assiut, Egypt
Correspondence: Bakheet EM Elsadek
Biochemistry and Molecular Biology, Faculty of Pharmacy, Al-Azhar University, Assiut Branch, P. O. Box 71524, Assiut, Egypt
Tel +201110596270
Email [email protected]
Purpose: Over the past 30 years, no consistent survival benefits have been recorded for anticancer agents of advanced hepatocellular carcinoma (HCC), except for the multikinase inhibitor sorafenib (Nexavar®), which clinically achieves only ∼3 months overall survival benefit. This modest benefit is attributed to limited aqueous solubility, slow dissolution rate and, consequently, limited absorption from the gastrointestinal tract. Thus, novel formulation modalities are in demand to improve the bioavailability of the drug to attack HCC in a more efficient manner. In the current study, we aimed to design a novel sorafenib-loaded carbon nanotubes (CNTs) formula that is able to improve the therapeutic efficacy of carried cargo against HCC and subsequently investigate the antitumour activity of this formula.
Materials and methods: Sorafenib was loaded on functionalized CNTs through physical adsorption, and an alginate-based method was subsequently applied to microcapsulate the drug-loaded CNTs (CNTs-SFN). The therapeutic efficacy of the new formula was estimated and compared to that of conventional sorafenib, both in vitro (against HepG2 cells) and in vivo (in a DENA-induced HCC rat model).
Results: The in vitro MTT anti-proliferative assay revealed that the drug-loaded CNTs formula was at least two-fold more cytotoxic towards HepG2 cells than was sorafenib itself. Moreover, the in vivo animal experiments proved that our innovative formula was superior to conventional sorafenib at all assessed end points. Circulating AFP-L3% was significantly decreased in the CNTs-SFN-MCs-treated group (14.0%) in comparison to that of the DENA (40.3%) and sorafenib (38.8%) groups. This superiority was further confirmed by Western blot analysis and immunofluorescence assessment of some HCC-relevant biomarkers.
Conclusion: Our results firmly suggest the distinctive cancer-suppressive nature of CNTs-SFN-MCs, both against HepG2 cells in vitro and in a DENA-induced HCC rat model in vivo, with a preferential superiority over conventional sorafenib.
Keywords: carbon nanotubes, sorafenib, DENA, hepatocellular carcinoma, microcapsules
Introduction
In modern societies, cancer is considered the deadliest killer among the top three causes of death.1 According to the latest global estimates of the American Cancer Society, the cancer burden increased in 2018 to 18.1 million new cases with 9.6 million annual cancer deaths.2 Worldwide, hepatocellular carcinoma (HCC) is the most common primary liver cancer, representing the second and sixth causes of cancer-related mortalities in men and women, respectively.3,4 Its incidence continues to increase rapidly due to the widespread diverse risk factors.5 Statistical estimates have revealed that the prognosis of HCC is very poor, and approximately 75% of the affected patients are diagnosed within advanced stages of the disease at which point the complete surgical removal of the malignant tissues becomes infeasible.6–8 Often, those patients have a short overall survival rate, usually in the range of 3–8 months.9,10 Nevertheless, with only a three-month gain in the overall survival rate compared to that of the placebo, sorafenib (SFN), a vascular endothelial growth factor and multi-kinase inhibitor, remains the only approved drug for advanced HCC to prolong survival and counteract disease progression.11–13 Despite these benefits, several published data and clinical practices highlighted large inter-individual and even intra-individual variabilities regarding the clinical benefit, limited bioavailability (approximately 8.5%, after oral administration) and toxicity of SFN.14–16 These variabilities were usually attributed to the very poor aqueous solubility of SFN at pH values varying from 1.2 to pH 7.4 that lead to a slow dissolution rate in the gastrointestinal tract, which is supposed to be the rate-limiting step for absorption.17–19 Thus, novel formulation modalities are needed to enhance the physiochemical properties and accordingly improve the bioavailability of the drug to attack HCC in a more efficient manner, resulting in a more satisfactory therapeutic outcome.
Over the last several decades, the application of nanotechnology-guided platforms has made a major revolutionary breakthrough in the field of oncology with the potential to improve the pharmacokinetics of the sparingly soluble anticancer agents, enhancing their solubility, site-specific delivery and accumulation into tumours.20,21 Among the numerous nanomaterials available as potential scaffolds or carriers for the development of new generations of cancer therapeutics, carbon nanotubes (CNTs) stand out with unusual features that distinguish them from other possible carriers.22 CNTs, including single- and multi-walled CNTs, are rolled graphene cylindrical tubes composed of 100% carbon with very large aspect ratios (length/width).23–25 With regard to their specific chemical nature, shape, ultra-small size, and targeting capabilities, CNTs can act at biomolecular levels, providing site-specific delivery, ability to load with different therapeutic agents, and prolonged accumulation into targeted tumour tissues, minimizing the prospective systemic toxicities.22,26–29 Despite these advantages, pristine CNTs have a significant issue regarding solubility that can restrict their use in pharmaceutical industries.30 Therefore, pristine CNTs require further chemical modifications to render them dispersible in aqueous media and reactive towards other chemical moieties.31 Functionalization of the CNTs surface with hydrophilic polymers, such as long poly(ethylene glycol) (PEG), is considered one of the most successfully practised methods to overcome the aforementioned obstacle.32
PEG is preferred as a promising candidate for the surface decoration of CNTs because of its assured safety in humans, good biocompatibility and aqueous solubility, as well as the exceptional ability to attach a wide range of biologically active agents.33 Additionally, PEGylated CNTs have been proven to elongate the plasma circulation time of the loaded cargo, which inturn reduces the dose and frequency of administration. PEGylated CNTs are also less susceptible to recognition by the reticuloendothelial system and other defence players in the bloodstream, most likely via imparting “stealth” properties.34 Many reports in this regard have stated that surface modification of CNTs with PEG groups improves the solubility of some insoluble chemotherapeutic agents and enhances their cytotoxicity, bioavailability, and therapeutic efficacy.35–37
In light of this knowledge, the objective of the current study was two-fold: first, to design and characterise, for the first time, SFN-loaded functionalized CNTs that are able to target the carried cargo to the tumour tissue; second, to assess the in vitro anti-proliferative potential of these innovative SFN-loaded CNTs against HepG2 cells and to evaluate the in vivo antitumour activity of a microcapsulated formula on a rat model of HCC in comparison to that of the conventional drug. Preferentially, an alginate-based microcapsulation method was applied in our formula to avoid drug leakage and to ensure a pH-dependent drug release, delivering the carried cargo to the intestine and colon in a predominant sustaining release profile.
The chemically induced rat model of HCC using N-nitrosodiethylamine (DENA), an alkylating agent of a family of carcinogenic N-nitroso compounds, has been proven to be a feasible model for our objective. In general, hepatic chemical carcinogenesis in experimental animals is a multi-step process that is initiated with a carcinogen and followed by regression, growth and clonal proliferation, eventually leading to cancer formation.38 Administration of DENA to animals has been shown to cause liver cancer and also other organs carcinoma but in a lower incidence. Initiation during or after DENA exposure is believed to be due to its rapid metabolism into more reactive metabolites that interact with DNA forming diverse DNA adducts, including O4-ethyldeoxythymidine adduct that when accumulate in hepatocyte DNA can lead to mutations, initiating tumour formation.39
Materials And Methods
Materials
Multi-walled CNTs (number of walls: 3–15, outer diameter: 30–50 nm, length: 10–30 μm, purity of ≥95%) were purchased from Sisco Research Laboratories Pvt. Ltd., India. SFN, DENA, polyethylene glycol 6000 g/mol (PEG-6000), sodium alginate (NaA) and thionyl chloride (SOCl2) were purchased from Sigma Chemical Co., St. Louis, USA. High-quality water employed to prepare solutions was obtained by using a Milli-Q Reagent Water System (Continental Water Systems, El Paso, TX, USA). Alpha-fetoprotein (AFP), and Lens culinaris agglutinin-reactive fraction of AFP (AFP-L3) rat specific ELISA kits were purchased from Elabscience Biotechnology Co., Ltd, Wuhan, China. Protease and phosphatase inhibitors cocktail was purchased from Cell Signaling Technology, Inc., MA, USA. Rabbit polyclonal antibodies of golgi protein 73 (GP73), glypican-3 (GPC-3), heat shock protein 70 (HSP70), and β-actin, as well as alkaline phosphatase-conjugated goat anti-rabbit secondary antibody were purchased from Novus Bio-logicals, LLC, Littleton, CO, USA. Rabbit polyclonal antibodies of connective tissue growth factor (CTGF), fibroblast growth factor-2 (FGF-2), hypoxia-inducible factor-1 alpha (HIF-1α) and phosphorylated mammalian target of rapamycin (mTOR) were kindly provided by Santa Cruz Biotechnology, Inc., Texas, USA. Goat anti-rabbit secondary antibody (Texas Red, Alexa Fluor 488) and nuclear stain (40,6-diamidino-2-phenylindole (DAPI)) were purchased from Abcam (Cambridge, UK). Thiazolyl blue tetrazolium bromide (MTT) assay chemicals were purchased from Bio Basic Canada Inc., (Canada). All other chemicals, reagents, and solvents were of analytical grade were obtained from standard suppliers, and were used without further purification.
Preparation Of The SFN-Loaded CNTs (CNTs-SFN)
Purification Of The Pristine CNTs
Five grams of the as-received CNTs were purified by refluxing at 80 °C in concentrated hydrochloric acid for 12 hr, followed by filtration with a Millipore membrane (0.22 μm) and a careful rinse with ultrapure water till neutralization of the filtrate.
Carboxylation Of CNTs Into CNTs-COOH
Four and half grams of the purified CNTs were refluxed in a mixture of concentrated sulfuric and nitric acids (3:1, v/v) at 80 °C for 24 hr. The suspension was cooled and rinsed several times with ultrapure water till the pH value reached neutral. The obtained CNTs-COOH were separated from the solution by filtration and dried under vacuum at 40 °C for 24 hr.
Acylation Of CNTs-COOH Into CNTs-COCl
Four grams of CNTs-COOH was mixed in a round bottom flask with 1000 mL SOCl2 and 30 mL DMF and refluxed under nitrogen atmosphere at 75°C for 48 hr. The obtained CNTs-COCl was washed with THF and dried under vacuum at 60 °C for 24 hr.
PEGylation Of CNTs-COCl Into CNTs-PEG
Firstly, 45 g of PEG6000 were refluxed in the presence of 6 mL TEA under nitrogen atmosphere at 50 °C for 24 hr. Secondly, 4.5 g of the CNTs-COCl was added to the above mixture and refluxing was continued at 60 °C for 72 hr. Subsequently, absolute methanol was used to remove any excess reagents and the obtained CNTs-PEG was dried under vacuum at 65 °C for 24 hr.
Drug Loading On The PEGylated CNTs
Sorafenib loading on the functionalized CNTs was achieved via physical adsorption. Briefly, different amounts of SFN were loaded onto the carrier in different ratios (1:2, 1:1, 2:1 and 3:1) in ethanol under ultrasonic condition. After 2 hr of stirring at room temperature, the product was collected by repeated centrifugation (at 9000 rpm for 5 min) until the supernatant became colorless. Using a M350 UV-Visible double-beam spectrophotometer (CamSpec, UK), the unbound SFN amounts were determined at 265 nm according to a calibration curve instructed in the same conditions. The amounts of SFN adsorbed by the functionalized CNTs (q) were calculated employing the following equation:

where, Co is the amount of SFN initially taken, Ct is the amount of SFN at time t, V is the volume of sample taken, and m is the mass of CNTs employed during the protocol.40
Microcapsulation Of The Drug-Loaded CNTs-SFN
Three grams of CNTs-SFN were dispersed in 100 mL NaA aqueous solution (2.5%) using a magnetic stirrer for 10 mins. Using a 10 mL syringe, this drug alginate (1:2) dispersion was transferred drop-wise to a 50 mL CaCl2 solution (0.4 M) with mild agitation within a period of 7 mins at ambient temperature. The mixture was then stirred slowly for 6 mins to cure the formulated CNTs-SFN-MCs which were subsequently dried under vacuum at 65°C for 24 hr.
Characterisation Studies
FT-IR Spectroscopy
Flourier-transform infrared (FT-IR) analysis was carried out using FT-IR-8400S, Shimadzu Fourier Transform Infrared Spectrophotometer, Japan.
Scanning And Transmission Electron Microscopy Imaging
Scanning electron microscopy (SEM) was used to investigate the topographical features and fracture surface details of the final and synthesis intermediate products. Visual examination of samples was carried out on a JEOL JSM-5400 LV scanning electron microscope (Oxford, USA).
Transmission electron microscopy (TEM) was used to investigate the micro structural details of final and intermediate products during the design of the SFN-loaded CNTs. The samples were observed on a JEM-2010F transmission electron microscope (JEOL Ltd., Japan).
Thermo-Gravimetric Analysis
Owing to the high thermal stability of the pristine CNTs, the degree of its functionalization was monitored using Thermo-gravimetric analysis (TGA) under nitrogen flow at a heating rate of 10 °C/minute on a TA Q500 thermal analyzer system (TA Instruments, New Castle, DE, USA).
Differential Scanning Calorimetry
Additionally, differential scanning calorimetry (DSC) was carried out to estimate the heat capacity of the drug-loaded formula using a DSC-50 differential scanning calorimeter (Shimadzu Co., Japan). The samples were heated at a temperature of (25–700) °C with a heating rate of 10 °C/minute.
Zeta Potential Measurement
In order to detect the influence of various chemical modifications on the CNTs surface charge, zeta potential was estimated using ZS 90 (Malvern Instruments Ltd., Worcestershire, UK) in a 0.05 mg/mL sample concentration suspended in PBS (pH 7.4).
Determination Of Drug Content In The Microcapsulated Formula
The SFN content in the prepared CNTs-SFN-MCs was determined according to literatures.41 Briefly, 100 mg of CNTs-SFN-MCs was crushed carefully in a glass mortar and transferred to a 100 mL volumetric flask containing phosphate buffer pH 7.4. The volume was adjusted with the same buffer and then the flask was agitated for 5 mins every hour for 5 hrs. The drug concentration was determined in the filtrate spectrophotometrically at 265 nm according to SFN standard calibration curve in phosphate buffer pH 7.4 using a M350 UV-Visible double-beam spectrophotometer (CamSpec, UK).
In Vitro Drug Release Study
In vitro release of SFN from the formulated microcapsules, equivalent to 200 mg SFN, was performed at 37 °C according to a dissolution medium pH shift method with a paddle type dissolution test apparatus, SR II, 6 flasks (Hanson Research Co., USA) adjusted at 50 rpm as described in literatures.42 In brief, 500 mL of simulated gastric fluid (pH 1.2) was used as a release medium for two hours, followed by the addition of 5 mL of 7 M KH2PO4 containing 16.75% (w/v) NaOH in order to shift the pH to 7.4 and the experiment was continued for another six hours. The release study of SFN from the PEGylated CNTs-SFN, equivalent to 200 mg SFN, was performed using a similar protocol but only at pH 7.4. Throughout the whole experimental time, a three mL aliquot was aspirated and filtered every 30 mins interval to measure the absorbance at the predetermined λmax of each media against a corresponding blank.
Stability Study Of The Microcapsulated Formula
Evaluations of the stability of the prepared microcapsules were carried out after storage at room temperature (25 °C), 30 °C, and 40 °C for three months in a relative humidity (RH) of 75±5% using a thermostatically-controlled cabinet. The CNTs-SFN-MCs were tested for changes in the morphological shape, the drug content, and the amount of drug released within 6 hr in comparison to the corresponding properties of a freshly prepared microcapsules.
In Vitro Cell Viability Assay Of The Drug-Loaded CNTs
The MTT assay was used to assess the anti-proliferative activity of the drug-loaded CNTs-SFN against HepG2 cells (Vacsera, Egypt) in comparison to that of the conventional SFN and PEGylated CNTs as positive and negative controls, respectively, according to a published protocol.43
In Vivo Animal Experiments
All animal experiments were carried out according to the National Institutes of Health guide (NIH 1985) for the Care and Use of Laboratory Animals after being approved by the Ethical Committee of the Faculty of Pharmacy, Minia University, Egypt (09/2017). All the in vivo experimental works were achieved using healthy male Wistar rats that were obtained from the National Research Center (NRC), Dokki, Giza, Egypt.
In Vivo Pharmacokinetic Behavior Of The Drug-Loaded CNTs
Evaluation of the pharmacokinetic behavior of the drug-loaded CNTs was carried out using six healthy male Wistar rats (weighing 150 ± 10 g). The animals were randomly divided into two groups (3 rats each) and allowed to acclimatize for one week under regular environmental conditions (temperature, 22 ± 2 °C; humidity, 50 ± 5%; night/day cycle, 12 hrs) with free access to an ordinary rodent diet and tap water ad libitum.
Subsequent to a 12 hr fasting period, animals in the 1st group were given SFN (60 mg/kg, per os), while animals in the 2nd group were given CNTs-SFN-MCs (60 mg/kg SFN-equivalent per os). Post oral administrations, blood samples were collected from each animal via the retro-orbital plexus at a predetermined time intervals. These blood samples were centrifuged at 10,000 rpm for 5 mins and plasma was isolated and kept frozen at −20°C until analysis.
The plasma SFN concentration in each sample was quantified using a YL9100 HPLC system (Republic of Korea) consisting of a quaternary gradient pump, a UV detector, a G137PA automatic degasser, a standard auto-sampler, a column oven, a chromatography workstation, and a Kromasil C18 column (250 mm × 4.6 mm length × internal diameter, 5 μm particle size). The used mobile phase consisted of potassium dihydrogen phosphate (20 mM) and acetonitrile (35:65, v/v) (pH 6.3) with a flow rate of 1 mL/min. According to these chromatographic conditions, SFN concentration in the collected plasma samples was determined at 265 nm after sample handling according to a previously described processing method.44 Briefly, 50 μL of each plasma sample was added to 50 μL acetonitrile in an Eppendorf tube to precipitate proteins. Subsequent to 1 min vortex, each tube was centrifuged at 10,000 rpm for 10 mins and the obtained supernatant was transferred into a glass tube containing 250 μL deionized purified water. Then, SFN was extracted by adding 1 mL ethyl acetate. After mechanical shaking for 5 mins, each tube was centrifuged at 4000 rpm for 10 mins and the obtained supernatant was transferred into 5 mL glass tube to be evaporated until dryness in a 25°C water bath under a nitrogen stream. The obtained residue was dissolved in 100 μL methanol, of which a 20 μL aliquot was injected into the chromatographic system.
Animal Model Design
In the current study, 40 healthy male Wistar rats (weighing 150 ± 10 g) were housed (2 per cage) under regular environmental conditions (temperature, 22 ± 2 °C; humidity, 50 ± 5%; night/day cycle, 12 hrs) with free access to an ordinary rodent diet and tap water ad libitum. The animal’s weights were regularly recorded two times per week. After a 2-week acclimatization period, the rats were randomized into 2 groups of 10 and 30 rats, respectively. The animals in the 1st small group served as a negative control, while the animals in the 2nd large group received DENA in their drinking water (100 mg/L) for 8 consecutive weeks.10,45
Four weeks after the end of the DENA administration, the 30 rats of the large group were further divided into 3 subgroups (10 rats each). The 1st subgroup (DENA group) received no treatment. The 2nd subgroup was treated daily with the conventional SFN at a dose of 60 mg/kg for one month per os.10,46 The 3rd subgroup was treated daily with CNTs-SFN-MCs at a dose of 60 mg/kg SFN-equivalent for one month per os.
Two days after the last treatment, a blood sample was collected from each animal via the retro-orbital plexus under isoflurane anaesthesia, and the animals were then scarified by cervical decapitation. Subsequent to autopsy, the livers were excised, washed in ice-cold isotonic saline, inspected, photographed, and subdivided into two parts. One part was kept in a 10% neutral buffered formalin solution for histological examinations. The other part was homogenized in ice-cold RIPA lysis buffer containing a 1% protease and phosphatase inhibitor cocktail using a Potter-Elvehjem rotor-stator homogenizer fitted with a Teflon pestle (Omni International, Kennesaw, GA, USA). The samples were subsequently aliquoted, instantly flash frozen in liquid nitrogen, and stored at –80 °C until use in the Western blot assays.
Biochemical Assays
The circulating levels of albumin and total bilirubin, as well as the serum activities of alanine aminotransferase (ALT), aspartate aminotransferase (AST), alkaline phosphatase (ALP), gamma-glutamyl transferase (GGT), and alpha L-fucosidase (AFU), were estimated using commercially available colorimetric and kinetic assay kits together with the photometer 5010 V5+ (ROBERT RIELE GmbH & Co KG - Berlin - Germany). The serum levels of AFP and AFP-L3 were assayed using commercially available rat-specific ELISA kits on a Stat Fax microplate ELISA reader (FL, USA), and the results are expressed as the ratio of AFP-L3 to total AFP (AFP-L3%).
Western Blot Assessments
The liver tissue protein levels of three HCC-relevant tumour markers, GP73, GPC-3, and HSP70, were assessed by Western blotting using the corresponding rabbit polyclonal antibodies according to a protocol prescribed in our previously published work.10 Each experiment was repeated three times to assure the reproducibility of results. The quantification was performed using the ImageJ software and expressed as the band density relative to that of the β-actin.
Histopathology And Immunofluorescence Examinations
The histopathological examination of the obtained liver tissue sections was carried out using a standard haematoxylin and eosin (H&E) staining protocol.47 Some paraffin sections on positive slides were picked for the immunofluorescence lesion detection of four HCC-pertinent biomarkers, CTGF, FGF-2, HIF-1α and mTOR, according to a published protocol.48 The evaluation was performed by Nikon fluorescence microscope (model: Nikon eclipse 90i with a DS-U3 imaging system, Nikon Metrology, Inc., Brighton, Missouri, USA) under blue, green, and red channels. Fluorometric analysis: fluorometric intensity of at least nine microscopic fields was measured for each tissue section using the ImageJ/NIH software (National Institute of Mental Health, Bethesda, Maryland, USA).
Statistical Analysis
Statistical analysis of the results was performed using GraphPad Prism software version 6.0 (GraphPad Software, Inc., San Diego, USA). All values are expressed as the mean±SEM, and the variables were compared using one-way analysis of variance (ANOVA) followed by Tukey’s t-test for multiple comparisons. Differences were considered statistically significant at p<0.05.
Results And Discussion
Preparation Of The Drug-Loaded CNTs-SFN Microcapsules
The synthesis of the SFN-loaded CNTs was adopted from methods described in the literature,49 as illustrated in Figure 1.
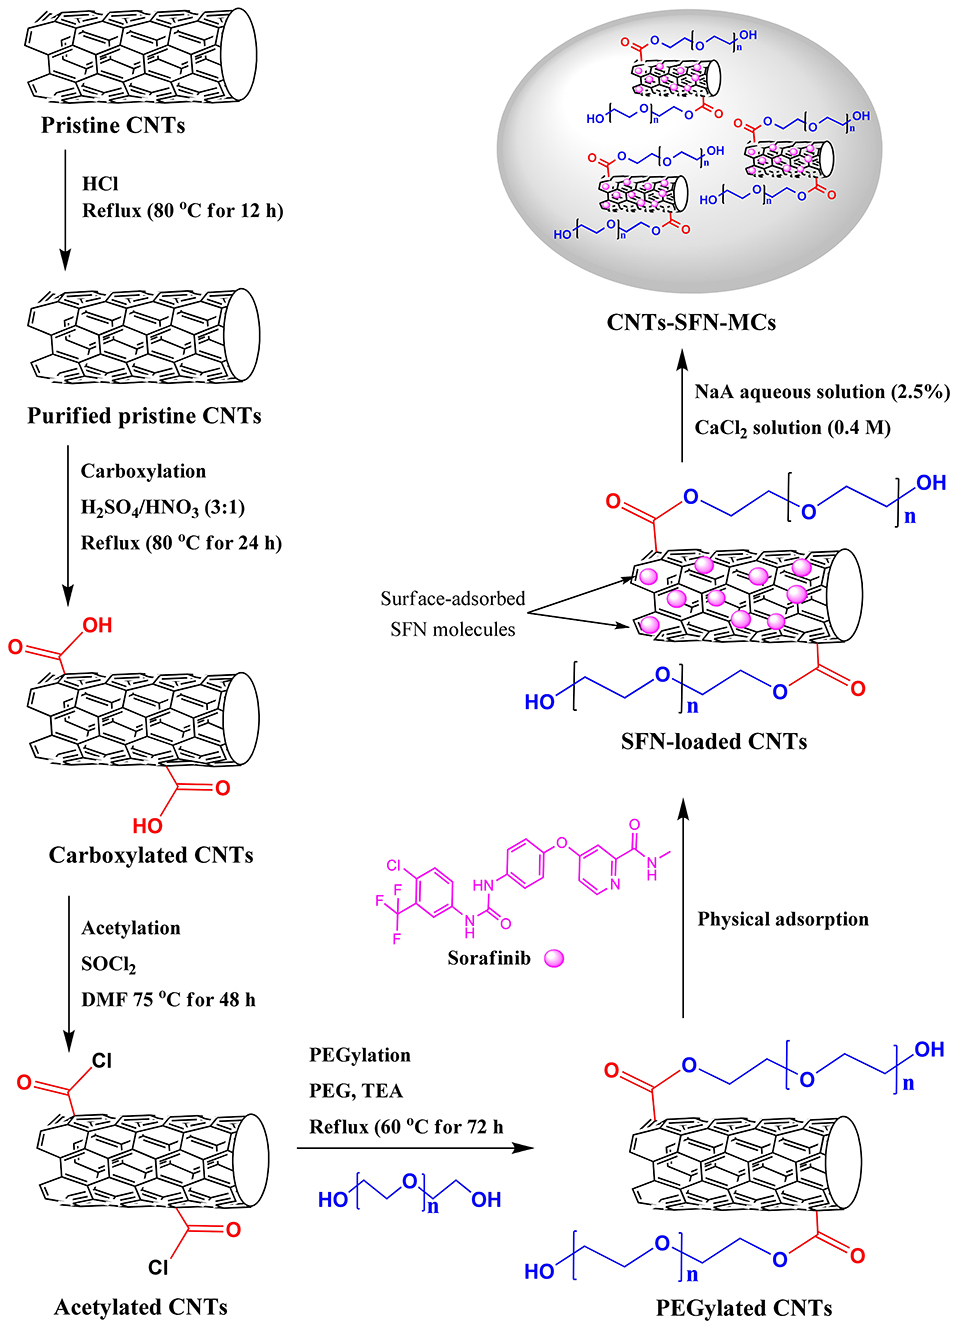 |
Figure 1 Schematic illustration of the synthesis of CNTs-SFN-MCs. |
Microcapsulation of the drug-loaded CNTs-SFN was achieved via an alginate-based method. This system was ubiquitously described in the literature to exhibit many therapeutic benefits via tailoring the release profile of the bioactive species.50,51 In particular, the biocompatible and biodegradable alginate microcapsules have been widely and preferentially used as a drug carrier because of their ease and mild encapsulation process. Minutely, the alginate microcapsules are ionically cross-linked in the presence of multivalent cations, such as Ca2+, and therefore exhibit the sensitivity of Ca2+/COO− linkage to pH as a key of controlled release function. Post oral administration, the loaded cargo can be released within the swelling and cracking of the microcapsules under the predetermined pH while the swelling and cracking behavior can also be used to regulate the period of drug release.52–54
Characterisation Of The Drug-Loaded CNTs And Their Microcapsulation Formula
SEM Analysis
To investigate the topographical features and fracture surface details of the prepared CNTs-SFN, CNTs-SFN-MCs and all reaction intermediates, SEM was used, and the obtained images are presented in Figure 2. The purified CNTs appeared quite clear without obvious amorphous carbon (Figure 2A). The CNTs-COOH showed a smooth surface with curled and entangled tubes (Figure 2B). The surface of the CNTs-PEG appeared rough and exhibited some attached clusters (Figure 2C), indicating that PEG macromolecules were grafted onto the surface of CNTs by the formation of ester linkages between the reactive hydroxyl groups of PEG and the acyl groups of CNTs-COCl.55 The images of CNTs-SFN show drug particles adsorbed on the CNTs-PEG surface (Figure 2D). These SEM images clearly show that the pristine CNTs were highly tangled tubes with a diameter of 30–50 nm. In addition, sidewall functionalization with carboxylic and PEG groups and loading with SFN did not significantly alter the morphological structure of the CNT surfaces, as observed from their corresponding SEM images. Moreover, the obtained SEM images show that the finally prepared CNTs-SFN-MCs (Figure 2E and F) and their corresponding plain formula (Figure 2G and H) were spherical in shape and exhibited smooth surfaces with an obvious indication for efficient drug loading in the case of the CNTs-SFN-MCs formulation.
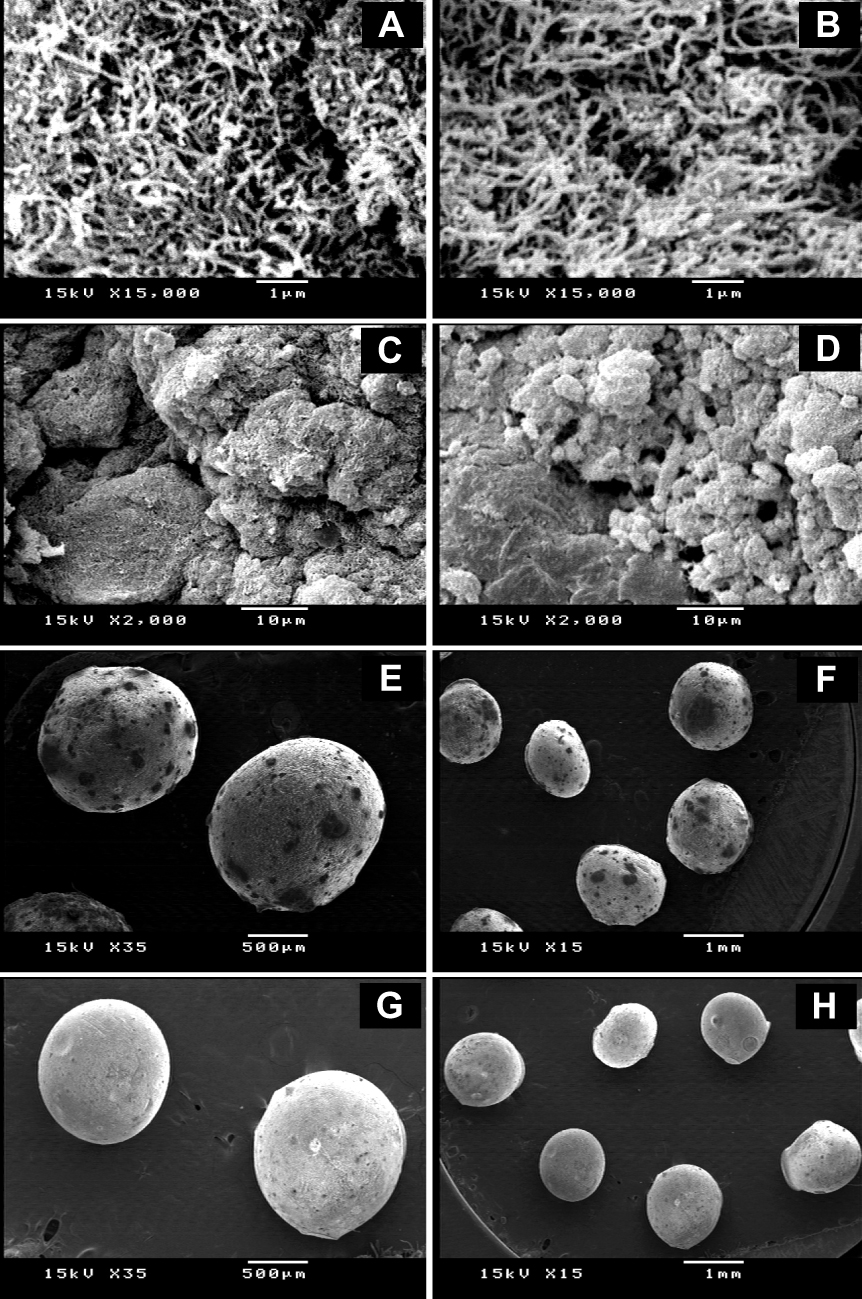 |
Figure 2 SEM images of pure CNTs (A), CNTs-COOH (B), CNTs-PEG (C), CNTs-SFN (D), CNTs-SFN-MCs (E and F), and plain CNTs-MCs (G and H) at different magnification powers. |
TEM Analysis
To investigate the microstructural details of the different formulation reaction specimens, TEM was applied. The obtained images, as shown in Figure 3, reveal a relatively uniform size distribution of the outer diameter of the CNTs ranging from 30–50 nm with a length of ~10–30 μm. The dark and thicker area around the CNTs was intensified with high-PEGylated CNTs, clearly indicating the PEGylation process. As shown, the coating was not completely uniform throughout the entire length of the nanotubes, while uniform thickness was achieved over the tube after SFN loading (Figure 3A–D).
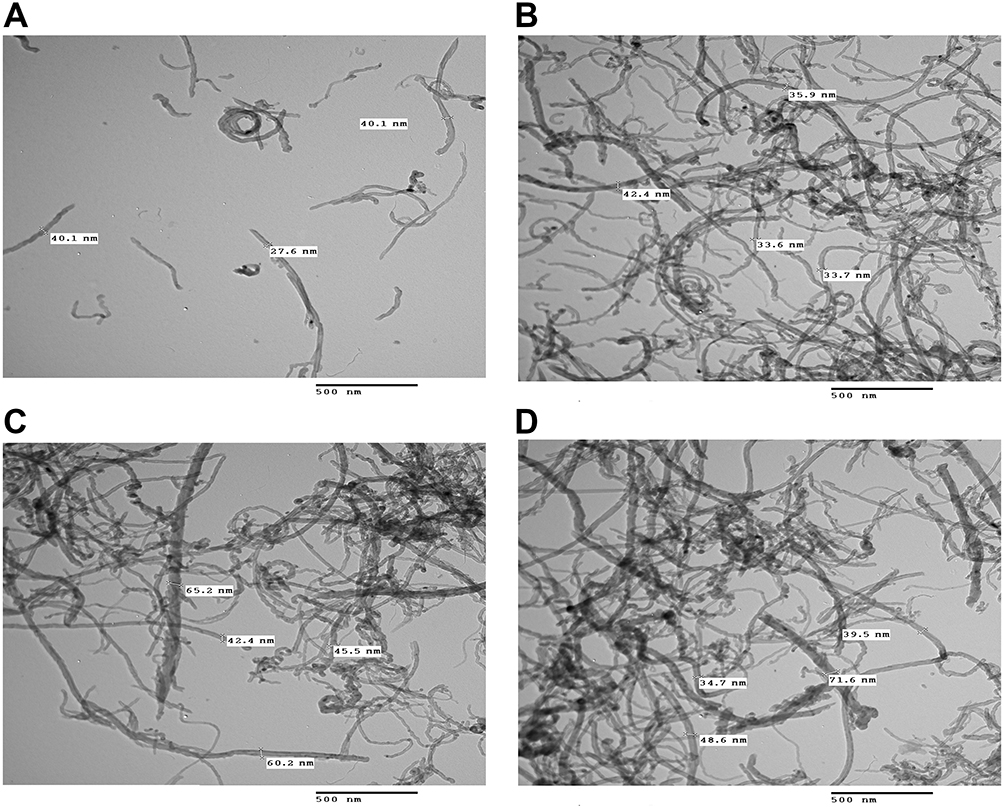 |
Figure 3 TEM images of the pure CNTs (A), CNTs-COOH (B), CNTs-PEG (C), and CNTs-SFN (D). |
FT-IR Spectroscopy
The structure of the final product and synthesis intermediates were confirmed by FT-IR measurement as presented in Figure 4. The FT-IR spectra of pristine CNTs (Figure 4A) and purified CNTs (Figure 4B) are similar, with a characteristic peak at 1635.88 cm−1, related to the C=C bond of the unconjugated sp2 carbons of folded graphenes. The stretching peaks of C-O and H-O bonds were observed at 1113.29 cm−1 and 3440.0 cm−1, respectively which are related to the low percentage of hydroxyl groups on the nanotube surface. The pure PEG spectrum (Figure 4C) shows two strong peaks `between 2694.33 cm−1 and 3420.39 cm−1 due to the C-H stretching in the PEG chain. The OH stretching vibration is observed in the region of 3420.39 cm−1, exhibiting an intermolecular hydrogen bonding nature. The spectrum of SFN (Figure 4D) shows two characteristic peaks at 3295.97 cm−1 and 3337.73 cm−1 due to the N-H stretching of amide. The observed peaks at 3079.19 cm−1 and 2943.36 cm−1 are related to the C-H stretching band of aromatic and aliphatic CH, respectively. The peak at 1689.52 cm−1 is characteristic of the amide C=O group. The peaks in the CNTs-COOH spectra (Figure 4E) at 1635.22 cm−1, 1466.59 cm−1, and 1359.62 cm−1 are related to the C-O, C=O and C=C bonds, respectively. The wide peak in the region of 3429.56 cm−1 is assigned to the -OH (carboxylic acid) group, and the two peaks at 2885.70 and 2900.0 cm−1 are the absorption peaks of C-H bonds. Notably, new peaks coinciding with C=O and C-H bonds were recorded after reaction with HNO3/H2SO4, reflecting the successful oxidation of CNTs. The peaks in the CNTs-COCl spectra (Figure 4F) at 1703.22 cm−1 are related to the carbonyl stretch of the acyl chloride intermediate (CNTs-COCl). The wide peak in the region of 3425.41 cm−1 assigned to the -OH group is due to the incomplete conversion of carboxylic acid into acid chloride. Comparing the CNTs-COOH FT-IR spectra with the CNTs-PEG spectrum in (Figure 4G) indicates a change in the position of the peaks from 1635.22 to 1631.68 cm−1, which is due to the formation of ester C=O bonds in CNTs-PEG. The intensity of the C-H peak increased as a result of the increase in the amount of alkyl (-CH2) group in PEG. The figure clearly shows that introducing a PEG group on the surface of the oxidized CNTs slightly changed their IR spectra. The FT-IR spectrum of CNTs-SFN (Figure 4H) shows all characteristic peaks in all of the individual compounds.
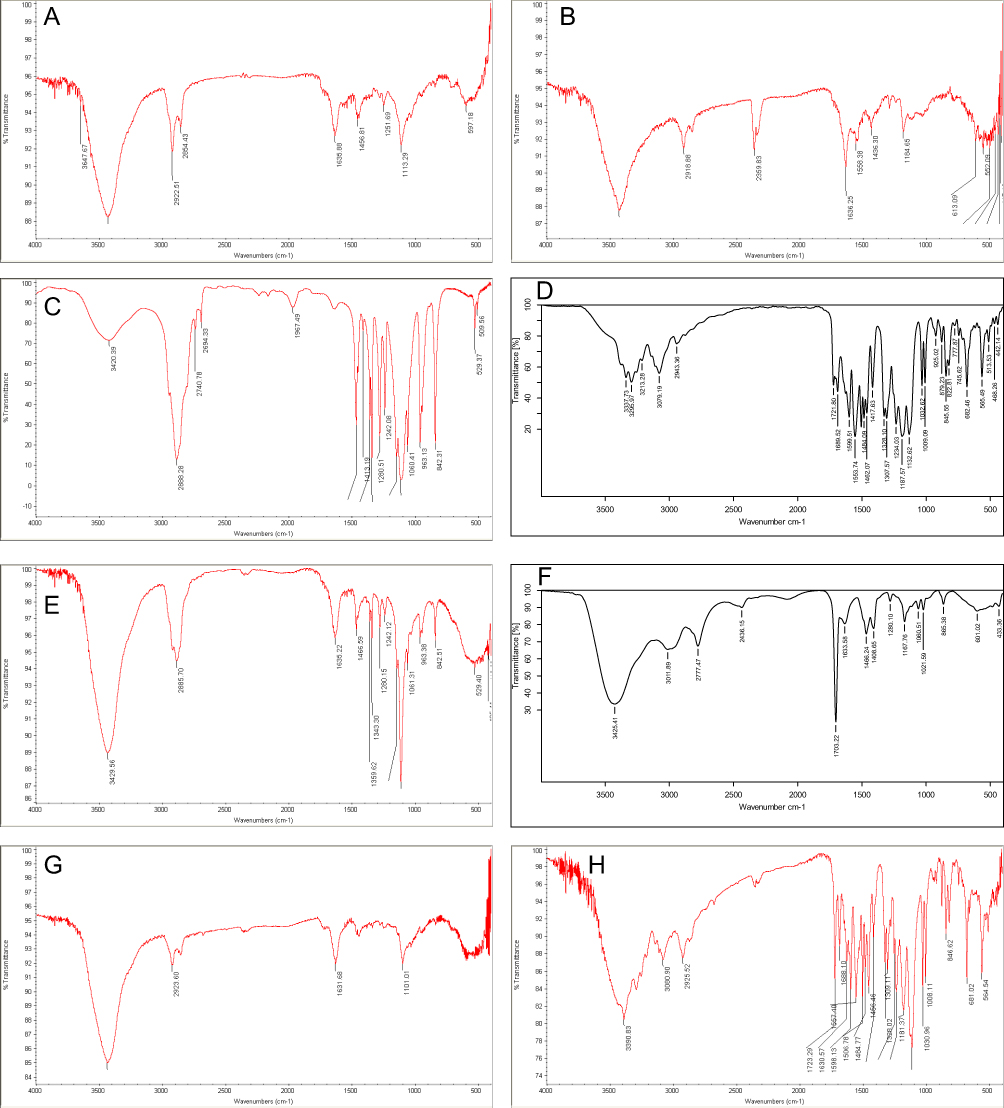 |
Figure 4 FT-IR spectra of pristine CNTs (A), purified CNTs (B), pure PEG (C), SFN (D), CNTs-COOH (E), CNTs-COCl (F), CNTs-PEG (G), and CNTs-SFN (H). |
Zeta Potential Assessments
To detect the influence of various chemical modifications on the CNTs surface charge, zeta potential, one of the benchmarks of stability of the colloidal system, was determined for all CNTs dispersions. The pristine, oxidized, acylated, PEGylated and SFN-loaded CNTs were negatively charged in the aqueous solution (see Figure 1S in the supplementary data). The pristine CNTs showed a negative zeta potential (−22.24 mV). The oxidized CNTs showed a negative zeta potential (−37.60 mV), most likely due to the insufficient ionization reaction of carboxylic acids in water. The acylated CNTs showed a negative zeta potential (−11.48 mV), which is higher than that of the oxidized CNTs. A possible explanation for this phenomenon could be the negative inductive effect of chlorine.56 Specifically, PEG functionalization shifted the value of the zeta potential to negative (−24.21 ± 0.31 mV). The negative zeta potential of PEGylated CNTs has been postulated to be attributed, in part, to the long hydrocarbon chain of PEG.56 The additional increase in the negative value of zeta potential in the case of CNTs-SFN (−28.75 mV) could be due to the presence of the non-protonated amino group of the adsorbed SFN tosylate. A diagrammatic illustration of all zeta potential values is presented in the supplementary data (Figure 1S).
Thermo-Gravimetric Analysis (TGA)
Due to the high thermal stability of CNTs, TGA has been widely used to quantify the their degree of functionalization.49,57 As seen in Figure 5A, weight loss was observed two times for the PEGylated CNTs; the 1st was due to PEG degradation, and the 2nd was related to the CNTs decomposition. A complete degradation of PEG in the PEGylated CNTs occurred at 350 °C (Figure 5A).
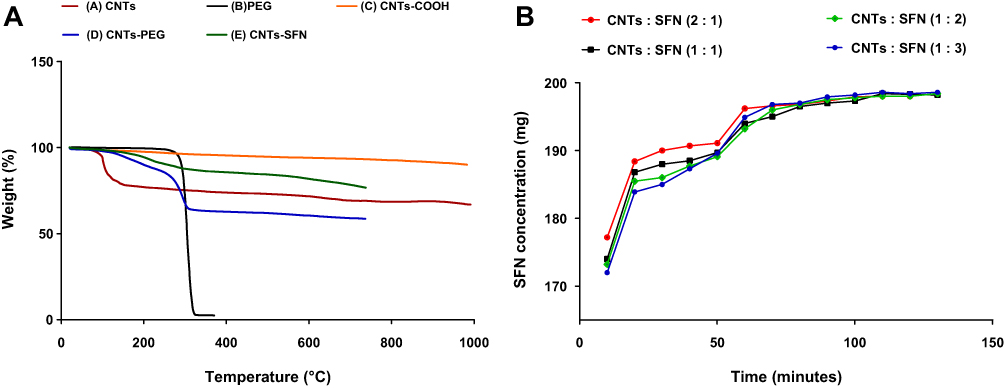 |
Figure 5 TGA of the formulation reaction specimens (A); SFN adsorption into CNTs at different ratios (B). |
Differential Scanning Calorimetry (DSC)
To precisely estimate a number of characteristic properties of the formulation, reactions such as heat capacity, and to observe fusion and crystallization events of the prepared formulation and the intermediates, DSC spectroscopy was applied. Calcium chloride showed two endothermic peaks in the temperature range of 178.65 and 214.74 °C, while NaA decomposed at approximately 265.23 °C, showing broad exothermic peaks (Figure 2S of the supplementary data). The DSC curve of SFN displays one large, sharp endothermic peak at approximately 212.91 °C, which corresponds to the melting point of the tosylate salt form, and another small endothermic peak at approximately 200.40 °C, which might be relevant to the melting point of the SFN base form. The DSC thermogram of the drug-loaded CNTs and their plain form show only broad and small endothermic peaks at 123.36 °C and 115.23°C, respectively, most likely related to dehydration of the microcapsules (Figure 2S of the supplementary data).
Assessment Of Drug Loading On CNTs-SFN
As described in Figure 5B, minimum variations were observed in the SFN adsorption capacity of the functionalized CNTs-PEG. Accordingly, an adsorption ratio of 1:2 (100 mg CNTs-PEG: 200 mg SFN) was adopted in all upcoming experiments. On the one hand, the one-part CNTs will minimize any side effects accompanied by its use; on the other hand, the two-part SFN will increase the drug loading to match the marketing dose (200 mg).
Assessment Of Drug Content And Release Profile From The Drug-Loaded Microcapsules
To estimate the actual weight of SFN itself in the finally formulated drug-loaded microcapsules, the drug content was calculated by measuring the deviation from the theoretical weight. The SFN contents in the prepared CNTs-SFN-MCs were found to be 191.2/200 g (95.6%).
The in vitro release profile of SFN from the CNTs-SFN-MCs was assessed according to a dissolution medium pH shift method. Under acidic conditions mimicking those in the stomach (pH 1.2), only a small amount of the drug was released during the first 2 hrs. This finding could correspond to the drug molecules deposited on the surface of the microcapsules. Once these drug molecules were consumed, the insoluble nature of the pH-dependent polymer, NaA, prevented drug release from CNTs-SFN-MCs. In contrast, the pH shift towards alkaline (pH 7.4), which resembles that of the intestine, apparently enhanced the drug release to be efficiently completed within 5 hrs (Figure 6A).
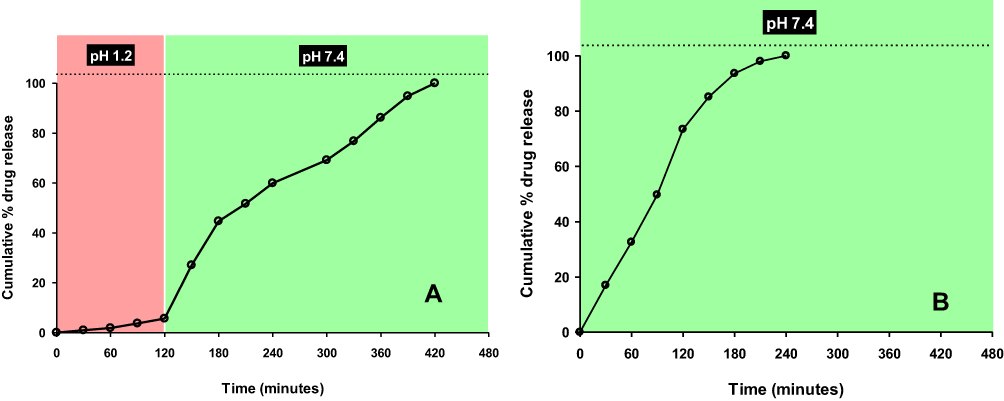 |
Figure 6 pH-dependent in vitro release profiles of SFN from the microcapsulated formula (A), and from the PEGylated CNTs-SFN (B). The violet background resembles pH 1.2 and the greenish background resembles pH 7.4. |
The in vitro release profile of SFN from the PEGylated CNTs-SFN was assessed at pH 7.4, assuming that the drug-loaded CNTs will be susceptible only this alkaline pH medium after its liberation in the intestine subsequent to swelling and cracking of the alginate microcapsules. Under these alkaline conditions, simulating those in the intestine (pH 7.4), there was a relatively faster release of the loaded drug from the PEGylated CNTs than that of the microcapsulated formula, especially during the first 3 hrs to be efficiently completed within 4 hrs (Figure 6B). This enhanced release of SFN from the PEGylated CNTs-SFN is most likely due to the absence of the insoluble NaA polymer, allowing for an instant liberation of the adsorbed drug.
Assessment Of The Stability Of The Drug-Loaded Microcapsules
After a three months storage period at 25°C, 30°C and 40°C in a RH of 75±5%, no significant changes were observed in the morphological shape of the CNTs-SFN-MCs as detected by SEM analysis (Figure 3S of the supplementary data). As well, these storage conditions were unable to significantly affected the drug content of the CNTs-SFN-MCs as illustrated in Table 1.
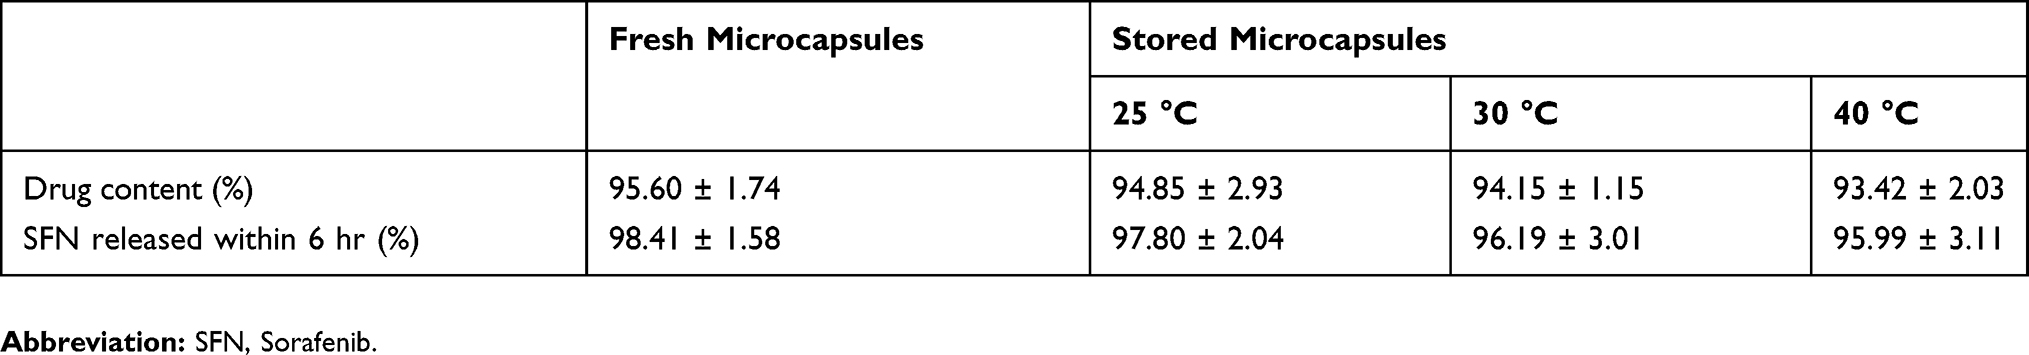 |
Table 1 Effects Of Storage Conditions On The Drug Content And Rate Of Drug Release From The Stored SFN-Loaded Microcapsules |
Regarding the drug release profile, the obtained results indicated that storage of the CNTs-SFN-MCs for three months at stress conditions induced a negligible decrease in the rate of the drug release from the stored microencapsules as illustrated Table 1.
In Vitro Anti-Proliferative Activity Of The SFN-Loaded CNTs
The cytotoxic activity of the developed CNTs-SFN against HepG2 cells was assessed using the MTT assay and was compared to that of the conventional SFN and PEGylated CNTs, which served as the positive and negative controls, respectively. As depicted in Figure 7, the obtained results revealed that the viability of the HepG2 cells was significantly reduced after 28 hrs of incubation with both the free drug and CNTs-SFN, with corresponding IC50 values of 10.24 µmol/l and 4.05 µmol/l, respectively. This apparent double increase in the anti-proliferative activity of SFN towards HepG2 cells after being loaded onto the functionalized CNTs indicates enhanced bioavailability, which could be due to the feasible delivery of the nanosized CNTs-SFN inside the cells with a subsequent more efficient and faster intracellular release and accumulation of SFN than that of the free drug. These results are in agreement with previous studies that reported the improved bioavailability of anticancer agents, other than SFN, via their binding to CNTs.37,58–60 Additionally, our results are consistent with other recent investigations that reported increased cellular uptake and consequently enhanced anticancer activity of SFN via its loading onto nanosystems other than CNTs.61–63 Of note, the currently reported limited anti-proliferative activity of CNTs-PEG towards HepG2 cells (IC50 >9.5 mg/mL) proves to a large extent that the developed cytotoxicity of the novel formula is attributed only to the loaded SFN. These findings are in accordance with a recently published work in which PEG-functionalized CNTs were described to be non-cytotoxic.56 These data collectively revealed that the PEGylated CNTs could be used as a drug carrier and that the SFN-loaded formula could be a promising potent system for in vivo HCC treatment.
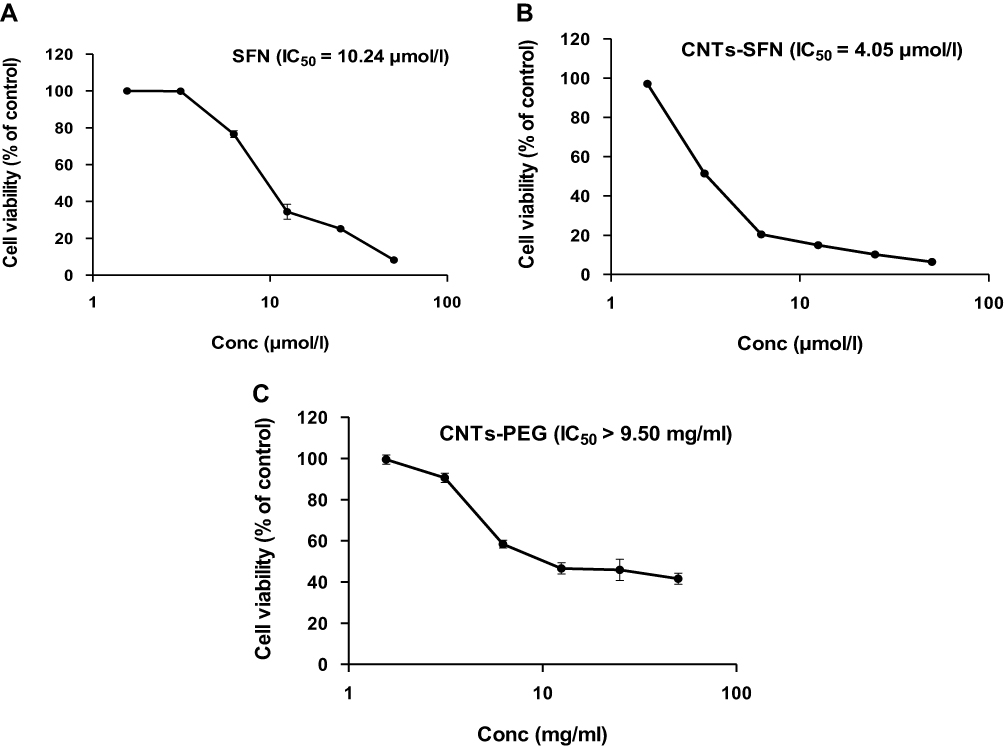 |
Figure 7 In vitro anti-proliferative activity of SFN (A), CNTs-SFN (B) and CNTs-PEG (C) against HepG2 cells. Cell viability was measured by MTT assay and IC50 values were calculated by GraphPad Prism software version 6.0. Data are presented as the mean ± SD from three independent experiments. Abbreviations: CNTs-PEG, PEGylated CNTs; SFN, sorafenib; CNTs-SFN, SFN-loaded CNTs. |
Pharmacokinetics In Vivo
The applied HPLC method was validated with respect to its specificity, linearity, precision, recovery, and sensitivity. The blank plasma, SFN solution in blank plasma, and plasma samples collected after the CNTs-SFN-MCs administration were manipulated based on the above described HPLC method and the obtained chromatograms were recorded (Figure 8).
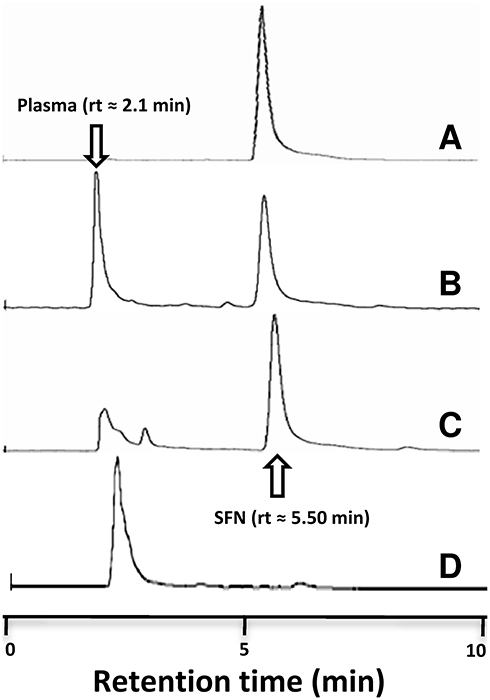 |
Figure 8 HPLC chromatogram of (A) SFN, (B) SFN in blank plasma, (C) plasma samples collected after the CNTs-SFN-MCs administration, and (D) the blank plasma. |
According to the obtained results, the used HPLC method was found to be satisfactory regarding its sensitivity and specificity with no interference with SFN determination from the endogenous substances in plasma under the selected chromatographic conditions. As described in Table 2 and Figure 9, the pharmacokinetic parameters showed that the area under curve (AUC) of SFN was seven-times higher in case of its administration in the form of drug-loaded microcapsules compared to that of the conventional SFN (680.60 μg.hr/mL versus 96.87 μg.hr/mL, respectively). Additionally, the half-life (t1/2) of SFN was four-times prolonged after its administration in this new formula in comparison to its conventional form (18.43 hrs versus 4.54 hrs, respectively). This could be an effect of the drug wrapping into the CNTs-SFN-MCs that avoid the metabolic action of CYP enzymes, allowing the drug to stay longer in the systemic circulation.
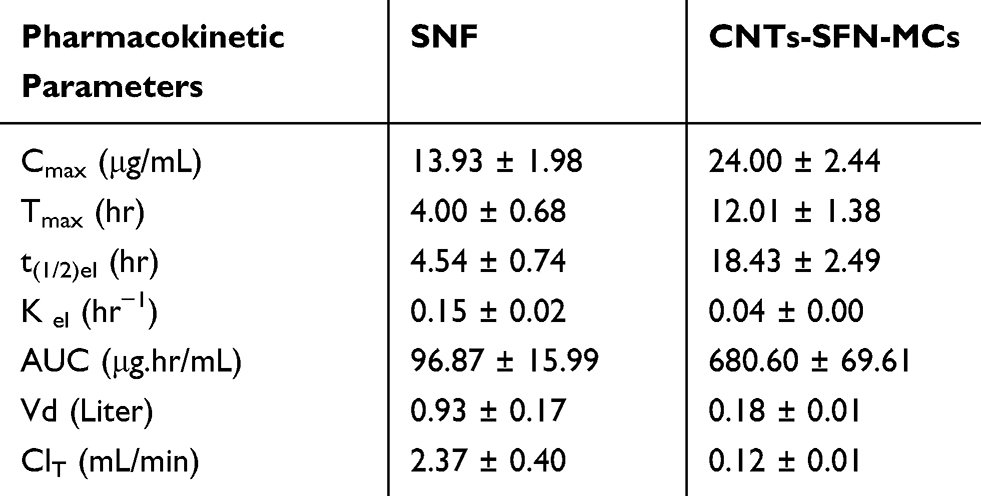 |
Table 2 The Plasma Pharmacokinetic Parameters After Oral Administration Of SFN And CNTs-SFN-MCs In Rats |
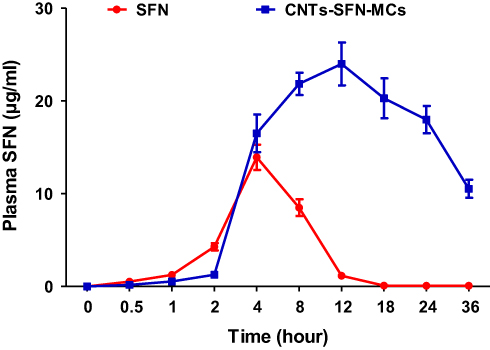 |
Figure 9 The mean concentration-time curve of SFN (µg/mL) in plasma after oral administration of SFN and CNTs-SFN-MCs in rats. Data are presented as the mean ± SD (n = 3). |
In Vivo Antitumour Activity Of The SFN-Loaded Microcapsules
Changes In The Animals’ Body Weights
Throughout the course of the experiment, the rats in the control group remained healthy and alert and gained a significant amount of body weight compared to the DENA-drinking rats, which appeared lethargic with an intangible body weight gain. As observed in Figure 10, all DENA-drinking rats lost weight during the course of the exposure before treatment, likely due to the primary tumour burden or the metastatic spread of the tumour. Comparable observations were previously reported using the same animal model.10,64 Throughout the experimental period, only one death was recorded in both the DENA and SFN groups in the 4th week of DENA-exposure. After starting the treatments, animals treated with the SFN-loaded microcapsules started gradually to regain their weight, vitality, and activity in comparison to the animals in the untreated and SFN-treated groups (Figure 10). This result represents a good indicator of the superiority of the CNTs-SFN-MCs over the conventional SFN with respect to systemic toxicity and tolerability.
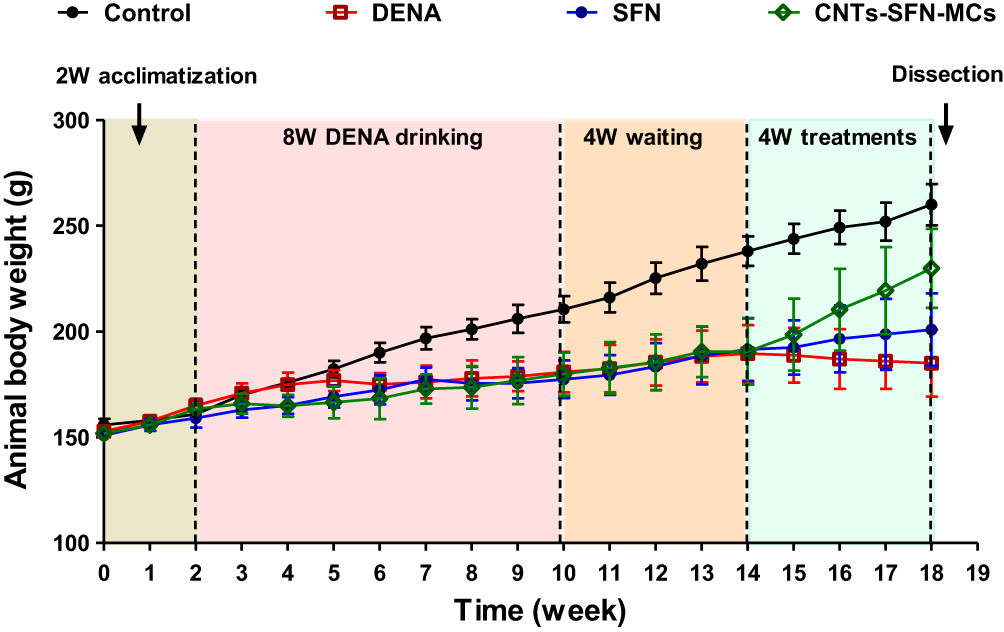 |
Figure 10 Illustration of the changes in the body weights of the animals in different groups during the experiment. |
Morphological Changes In The Liver Features
Naked-eye investigations of the excised livers in the DENA group showed abnormal morphological features in the form of faint, red, irregular rough surfaces incorporating numerous HCC nodules. Some livers showed loose consistency, incorporating diffuse massive heterogeneous lesions (tumour bulges) on the outer surfaces with numerous adjacent small sized nodules of up to 5x5 mm (Figure 11B and Figure 4SB of the supplementary data). Similar morphological changes have also previously been observed in several DENA-induced HCC rat models.10,65–67 To a relatively similar extent, livers in the conventional SFN-treated group showed altered morphological features with irregular, rough and pale surfaces, incorporating some scattered micronodules of different sizes throughout the liver (Figure 11C and Figure 4SC of the supplementary data). Conversely, the livers of rats treated with the CNTs-SFN-MCs showed comparatively normal morphological aspects with a healthy reddish brown colour, normal firm consistency, smooth surface, and borders without any defined mass lesions (Figure 11D and Figure 4SD of the supplementary data) that were similar to those of rats in the healthy control group (Figure 11A and Figure 4SA of the supplementary data), except for very few small nodules in some cases.
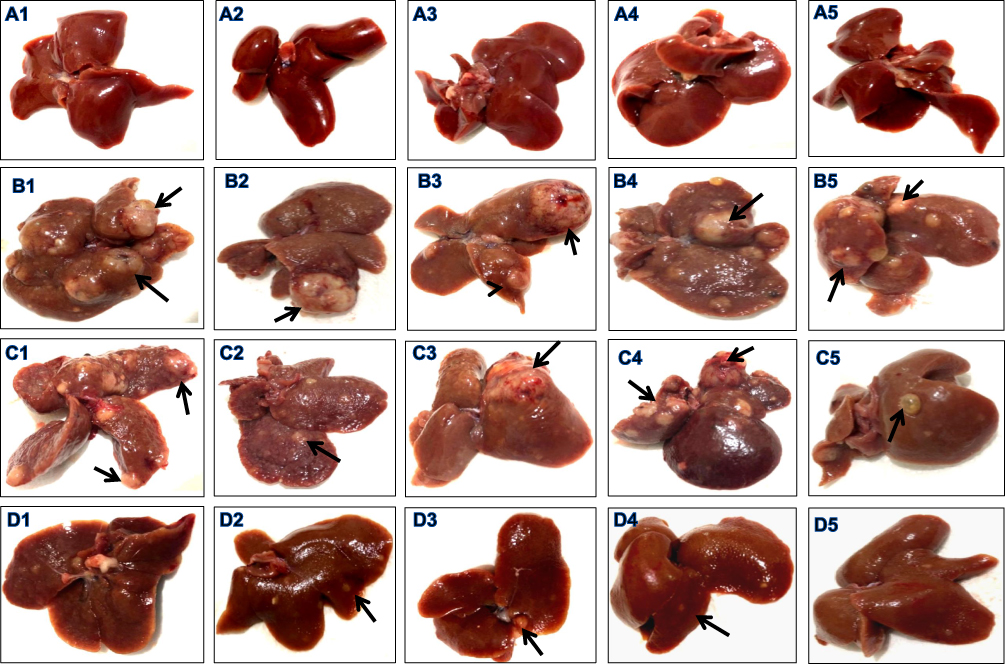 |
Figure 11 Effect of the tested compounds on the morphological aspect of livers. Representative photographs of livers from the control (A1–5) group showed normal morphological aspects. Liver from the DENA group (B1–5) showed faint red irregular rough surface and mostly loose consistency. Liver from the SFN-treated group (C1–5) showed firm consistency with irregular rough surface incorporating some scattered micronodules (arrows) of different sizes throughout the liver. Livers in the CNTs-SFN-MCs -treated group (D1–5) showed relatively normal morphological aspects. |
Liver Function Tests
In comparison to those in the healthy control group, animals in the DENA and SFN groups showed signs of impaired liver functions, including significant hypoalbuminemia (p<0.001 & p<0.001, respectively), in addition to significant multi-fold increases in the serum activities of ALT (p<0.001 & p<0.001, respectively), AST (p<0.001 & p<0.001, respectively), GGT (p<0.001 & p<0.001, respectively), and ALP (p<0.001 & p<0.01, respectively), as well as the total serum bilirubin level (p<0.001 & p<0.05, respectively), as illustrated in Table 3. This notable DENA-induced hepatic insufficiency could be due to secondary events following lipid peroxidation of hepatocyte membranes with a consequent increase in the leakage of the liver function indices from damaged liver tissues, as has been previously reported in many models of DENA-induced hepatic carcinogenesis.10,67–69 Remarkably, these observed signs of impaired liver function were well tolerated in the CNTs-SFN-MCs-treated group to relatively match the corresponding values in the healthy control group, as illustrated in Table 3.
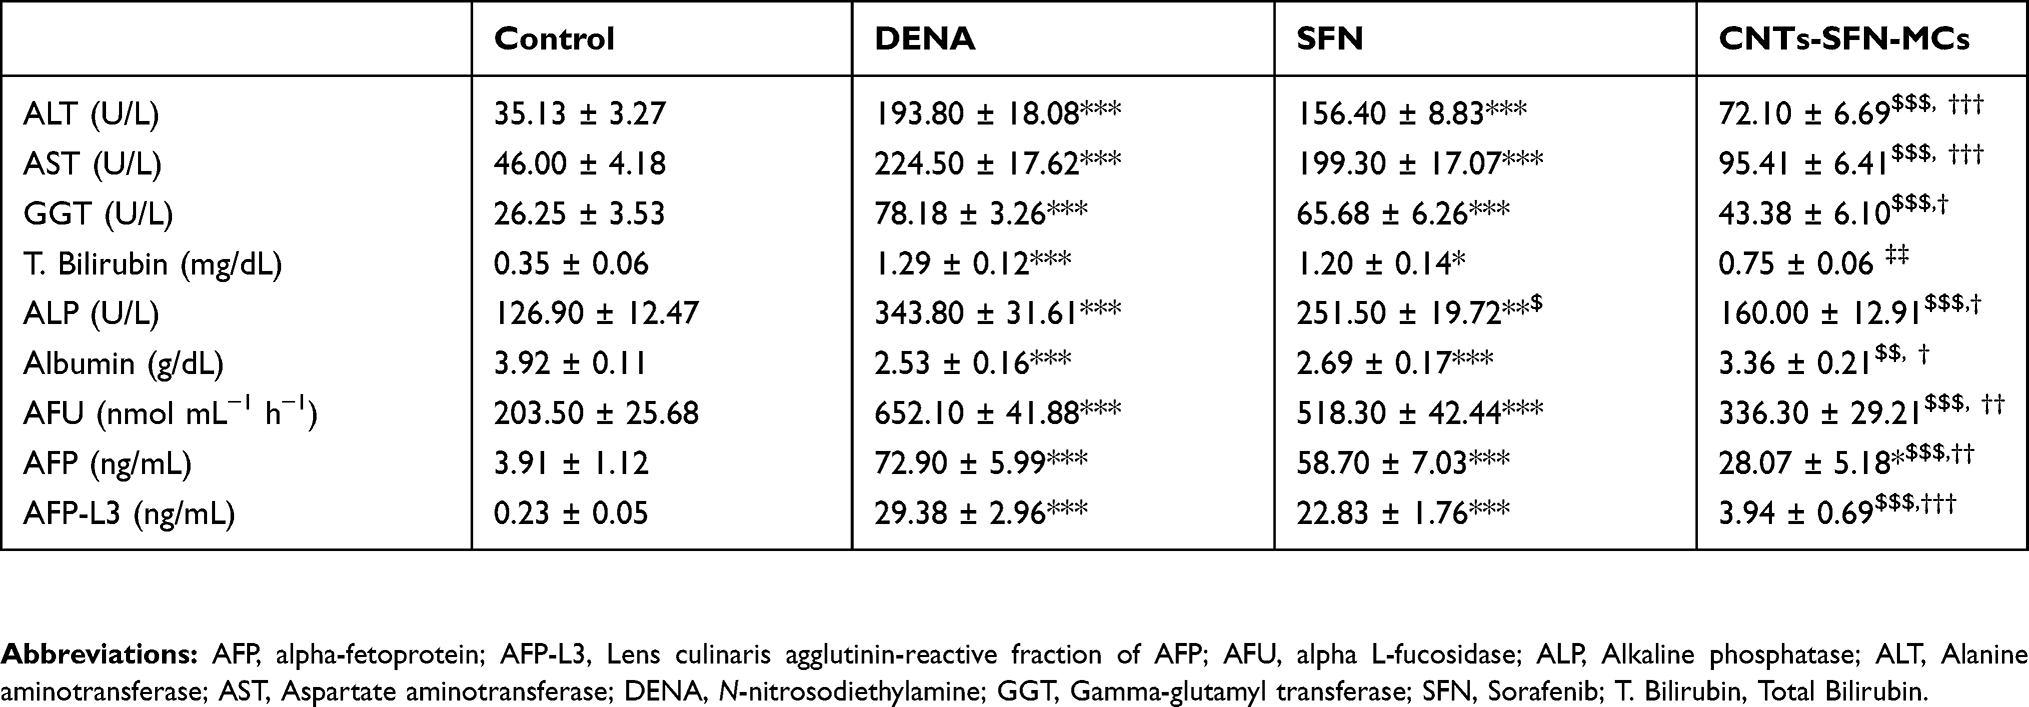 |
Table 3 Circulating Levels Of Clinically Relevant Liver Function Indices And Tumour Markers In Different Groups |
HCC-Related Tumour Markers
Additional proof supporting the tumour-repressing potential of the CNTs-SFN-MCs was found in the circulating levels and lesional expression of a new generation of HCC-relevant tumour markers, including AFP-L3%, AFU, GPC-3, GP73, and HSP70. These markers have been used in several investigations for monitoring treatment response and recurrence and as surrogate markers of clinicopathological variables of HCC.10,70–77 As described in Figure 12A, circulating AFP-L3% was apparently decreased in the CNTs-SFN-MCs-treated group (14.0%) in comparison to that in the DENA (40.3%) and SFN (38.8%) groups. Additionally, the serum activity of AFU was significantly diminished in the CNTs-SFN-MCs-treated group in comparison to that in the DENA and SFN groups (p<0.001 & p<0.01, respectively) – see Figure 12B.
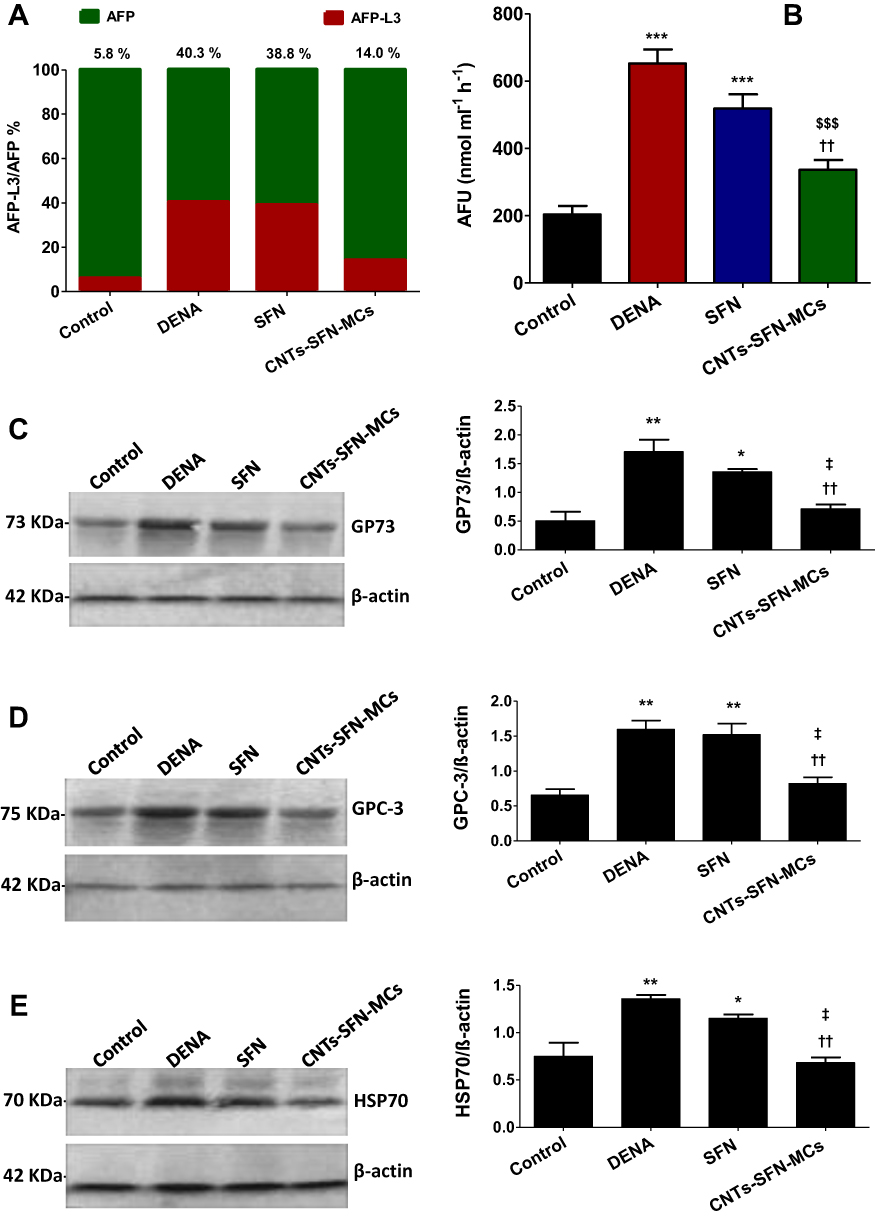 |
Figure 12 Serum AFP-L3% (A); AFU activity (B); representative Western blot analysis of GP73 (C), GPC-3 (D) and HSP70 (E) expression in liver tissues of different groups. (A) Bar chart showing the ratio of AFP-L3 (red) to total AFP (green). In (B), the data are presented as the mean ± SEM (n = 10). *$ and † indicate significant changes from the control, DENA, and SFN groups respectively. *$ and † indicate significant change at p<0.05; **$$ and †† indicate significant changes at p<0.01; ***$$$ and ††† indicate significant changes at p<0.001. Abbreviations: AFP, alpha-fetoprotein; AFP-L3, Lens culinaris agglutinin-reactive fraction of AFP; AFU, alpha l-fucosidase; DENA, N-nitrosodiethylamine; SFN, sorafenib; CNTs-SFN-MCs, sorafenib-loaded microcapsules; GP73, golgi protein 73; GPC-3, glypican-3; HSP70, heat shock protein. |
Moreover, Western blot estimation of GPC-3, GP73, and HSP70 as HCC-relevant molecular markers offered additional evidence for the superiority of the CNTs-SFN-MCs over the conventional SFN. As demonstrated in Figure 12C–E and Figure 5S of the supplementary data, exposure to DENA led to strong protein expression of the hepatic tissue levels of GPC-3, GP73, and HSP70, demonstrating the occurrence of premalignant liver changes in this group. Exceptionally, for the CNTs-SFN-MCs-treated group, the lesional expression pattern of these molecular markers was markedly attenuated to relatively notable levels. Treatment with the conventional SFN, on the other hand, seemed to have no obvious impact in alleviating the redundant expression of these proteins, as depicted in Figure 12 and Figure 5S of the supplementary data.
Immunofluorescence Staining
Additionally, immunofluorescence assessment provided proof of the promising therapeutic efficacy of microcapsulated SFN-loaded CNTs in withstanding DENA-induced HCC. An obvious lesional over-expression in the levels of four HCC-related biomarkers, CTGF, FGF-2, HIF-1α, and mTOR, was observed in the DENA group, as detected by immunofluorescence staining of the corresponding liver tissue sections. Only treatment with CNTs-SFN-MCs, but not with the conventional SFN, was able to decrease the relative DENA-enforced lesional expression level of these biomarkers, as shown in Figure 13 and Figures 6S & 7S of the supplementary data. Over-expression of these biomarkers has been widely validated in several studies and was proven to be associated with poor HCC prognosis, poor differentiation, early recurrence, and poor clinical outcomes.78–84 Several other in vivo studies confirmed a dose-dependent inhibitory effect of SFN on the expression pattern of some of these biomarkers, leading to decreased tumour vascularization and growth.3,46,85,86 Therefore, the estimation of protein expression pattern of these biomarkers can serve as a prognostic marker for HCC and a potential tool for evaluating HCC therapeutic efficacy. These results collectively indicate that treatment with CNTs-SFN-MCs is relatively superior to treatment with the conventional SFN in reducing the DENA-enforced lesional over-expression of these biomarkers, as shown in Figure 13 and Figures 6S & 7S of the supplementary data.
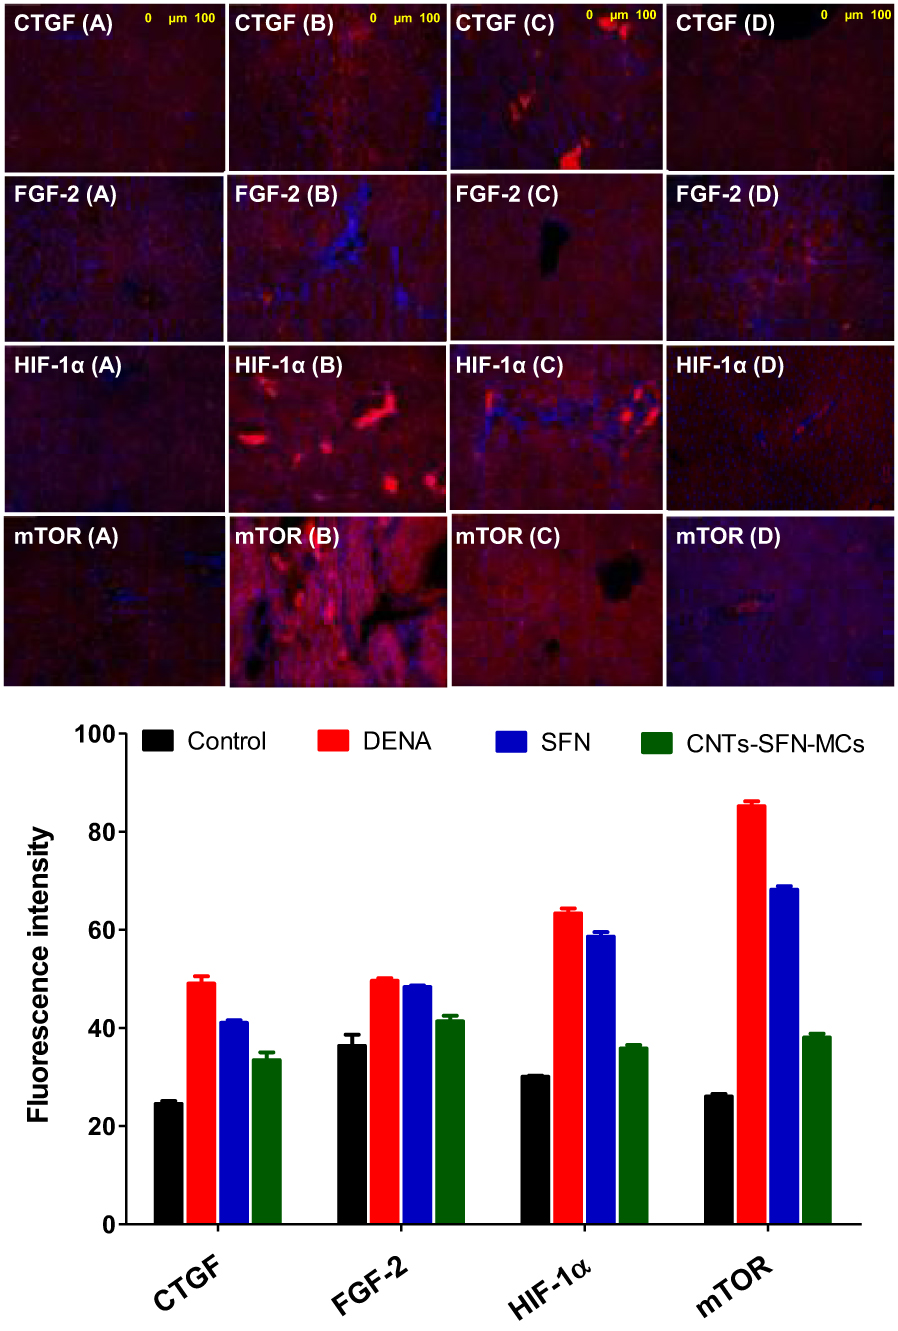 |
Figure 13 Representative immunofluorescence illustration of liver tissue sections stained for the detection of CTGF, FGF-2, HIF-1α, and mTOR as HCC-relevant biomarkers in control (A), DENA (B), SFN (C), and CNTs-SFN-MCs (D) groups. |
Histopathological Examinations
The hepatic tissue sections of healthy control rats revealed a preserved hepatic lobular architecture, normal hepatocyte cording, maintained central veins and identifiable portal tracts. Cytologically, the hepatocytes are polyhedral and uniform in size and shape, and the nuclei are monotonous with no recorded cytological or nuclear atypia (Figure 14A and Figures 8SA & 9SA of the supplementary data).
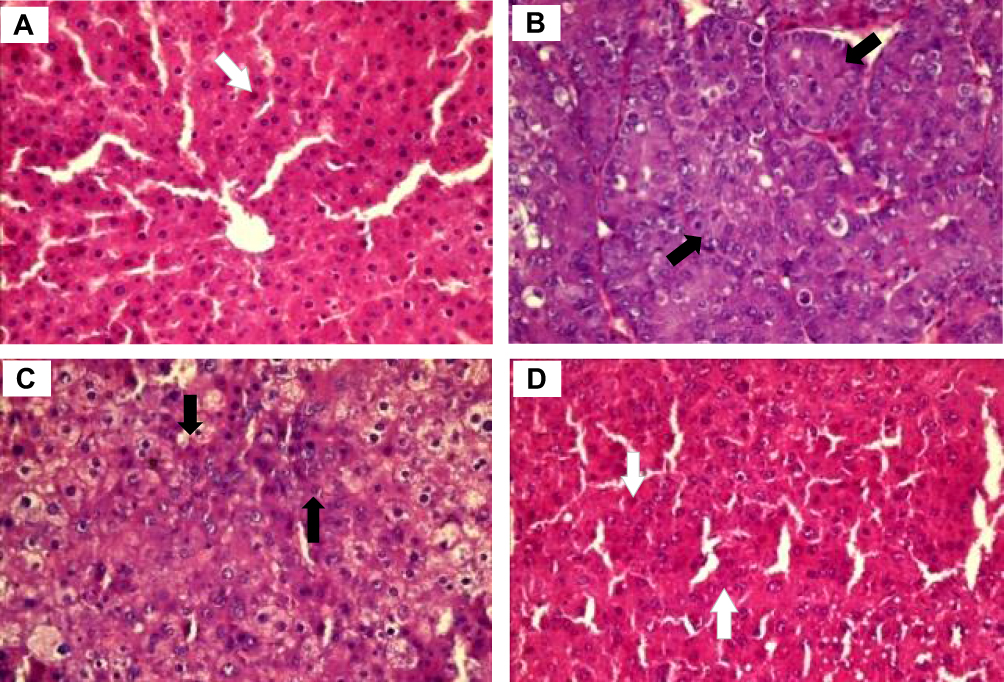 |
Figure 14 Sections of liver tissue obtained from untreated control (A), DENA (B), SFN (C), and CNTs-SFN-MCs-treated rats (D). The white arrows refer to normal hepatic cords, and the black arrows refer to trabeculae formation. The magnification power is x400. |
In contrast, the tissue sections of DENA treated rats exhibited distorted lobulation, thick hepatic cording with trabeculae and focal acini formation. The cells are pleomorphic with an increase in the nucleocytoplasmic ratio and hyperchromatism (Figure 14B, and Figures 8SB and 9SB of the supplementary data). These features are in parallel with numerous previously reported histological findings in which DENA-exposure induced severe histopathological alteration of hepatic tissue architecture.87,88 The histological findings reflect the neoplastic changes in hepatocytes with unlimited and uncontrolled malignant cell proliferation, which induced abnormal mitotic figures, giant tumour cells and genetic alterations associated with malignant changes.
The sections of hepatic tissue obtained from SFN-treated rats revealed residual nodules with low-grade HCC. The hepatic cords are thick with focal formation of trabeculae and focus necrosis. The hepatocytes are pleomorphic and have prominent nucleoli (Figure 14C and Figures 8SC and 9SC of the supplementary data). Visibly, these residual histopathological alterations reflect the minor efficacy of free SFN in withstanding DENA-enforced hepatic carcinogenesis.
In contrast to those from SFN-treated rats, the sections of liver tissue obtained from CNTs-SFN-MCs-treated rats showed a rather homogenous hepatic tissue structure with no or rare nodule formation. The lobular pattern of liver tissue could be identified (retained normal architecture), and the hepatocytes tended to form two-cell-thick cords separated by vascular sinusoids. Few scattered cells with nucleomegaly were observed in a few sections, but no obvious malignant nodules, tissue necrosis or tissue haemorrhage could be recorded (Figure 14D and Figures 8SD and 9SD of the supplementary data). Preferentially, these results firmly suggest the distinctive cancer-suppressive nature of CNTs-SFN-MCs in DENA-induced HCC.
Conclusion
In conclusion, our results have confirmed the distinctive cancer-suppressive nature of the newly designed SFN-loaded CNTs, both against HepG2 cells in vitro and in a DENA-induced HCC rat model in vivo, with an eminent superiority over the conventional SFN. These promising results may shed new light on a novel therapeutic strategy for patients with HCC. Moreover, in agreement with several published reports,89–92 co-delivery of SFN, in its newly designed formula, with another anti-cancer drug could be our next step to further enhance their therapeutic efficacy to efficiently fight HCC.
Acknowledgments
We are deeply thankful to Santa Cruz Biotechnology, Inc. (Texas, USA) for offering us the rabbit polyclonal antibodies of CTGF, FGF-2, HIF-1α and mTOR as a gift.
Disclosure
The authors report no conflicts of interest in this work.
References
1. Prajapati SK, Jain A, Shrivastava C, Jain AK. Hyaluronic acid conjugated multi-walled carbon nanotubes for colon cancer targeting. Int J Biol Macromol. 2019;123:691–703. doi:10.1016/j.ijbiomac.2018.11.116
2. Siegel RL, Miller KD, Jemal A. Cancer statistics, 2019. CA Cancer J Clin. 2019;69(1):7–34. doi:10.3322/caac.21551
3. Mendez-Blanco C, Fondevila F, Garcia-Palomo A, Gonzalez-Gallego J, Mauriz JL. Sorafenib resistance in hepatocarcinoma: role of hypoxia-inducible factors. Exp Mol Med. 2018;50(10):134. doi:10.1038/s12276-018-0159-1
4. Siegel RL, Miller KD, Jemal A. Cancer Statistics, 2017. CA Cancer J Clin. 2017;67(1):7–30. doi:10.3322/caac.21387
5. Baecker A, Liu X, La Vecchia C, Zhang ZF. Worldwide incidence of hepatocellular carcinoma cases attributable to major risk factors. Eur J Cancer Prev. 2018;27(3):205–212. doi:10.1097/CEJ.0000000000000428
6. Baig B, Halim SA, Farrukh A, Greish Y, Amin A. Current status of nanomaterial-based treatment for hepatocellular carcinoma. Biomed Pharmacother. 2019;116:108852. doi:10.1016/j.biopha.2019.108852
7. McGuire S. World cancer report 2014. Geneva, Switzerland: World Health Organization, International Agency for Research on Cancer, WHO Press, 2015. Adv Nutr. 2016;7(2):418–419. doi:10.3945/an.116.012211
8. Tsuchiya N, Sawada Y, Endo I, Saito K, Uemura Y, Nakatsura T. Biomarkers for the early diagnosis of hepatocellular carcinoma. World J Gastroenterol. 2015;21(37):10573–10583. doi:10.3748/wjg.v21.i37.10573
9. El-Houseini ME, Mohammed MS, Elshemey WM, Hussein TD, Desouky OS, Elsayed AA. Enhanced detection of hepatocellular carcinoma. Cancer Control. 2005;12(4):248–253. doi:10.1177/107327480501200407
10. Elsadek B, Mansour A, Saleem T, Warnecke A, Kratz F. The antitumor activity of a lactosaminated albumin conjugate of doxorubicin in a chemically induced hepatocellular carcinoma rat model compared to sorafenib. Dig Liver Dis. 2017;49(2):213–222. doi:10.1016/j.dld.2016.10.003
11. Hu B, Sun D, Sun C, et al. A polymeric nanoparticle formulation of curcumin in combination with sorafenib synergistically inhibits tumor growth and metastasis in an orthotopic model of human hepatocellular carcinoma. Biochem Biophys Res Commun. 2015;468(4):525–532. doi:10.1016/j.bbrc.2015.10.031
12. Lang L. FDA approves sorafenib for patients with inoperable liver cancer. Gastroenterology. 2008;134(2):379. doi:10.1053/j.gastro.2008.01.074
13. Yurdacan B, Egeli U, Guney Eskiler G, Eryilmaz IE, Cecener G, Tunca B. Investigation of new treatment option for hepatocellular carcinoma: a combination of sorafenib with usnic acid. J Pharm Pharmacol. 2019;71:7. doi:10.1111/jphp.13097
14. Arrondeau J, Mir O, Boudou-Rouquette P, et al. Sorafenib exposure decreases over time in patients with hepatocellular carcinoma. Invest New Drugs. 2012;30(5):2046–2049. doi:10.1007/s10637-011-9764-8
15. Giglio V, Viale M, Bertone V, Maric I, Vaccarone R, Vecchio G. Cyclodextrin polymers as nanocarriers for sorafenib. Invest New Drugs. 2018;36(3):370–379. doi:10.1007/s10637-017-0538-9
16. Truong DH, Tran TH, Ramasamy T, et al. Preparation and characterization of solid dispersion using a novel amphiphilic copolymer to enhance dissolution and oral bioavailability of sorafenib. Powder Technol. 2015;283:260–265. doi:10.1016/j.powtec.2015.04.044
17. Truong D, Tran T, Ramasamy T, et al. Preparation and characterization of solid dispersion using a novel amphiphilic copolymer to enhance dissolution and oral bioavailability of sorafenib. Powder Technol. 2015;283(3):260–265. doi:10.1016/j.powtec.2015.04.044
18. Wang XQ, Fan JM, Liu YO, Zhao B, Jia ZR, Zhang Q. Bioavailability and pharmacokinetics of sorafenib suspension, nanoparticles and nanomatrix for oral administration to rat. Int J Pharm. 2011;419(1–2):339–346. doi:10.1016/j.ijpharm.2011.08.003
19. Zhang Z, Niu B, Chen J, et al. The use of lipid-coated nanodiamond to improve bioavailability and efficacy of sorafenib in resisting metastasis of gastric cancer. Biomaterials. 2014;35(15):4565–4572. doi:10.1016/j.biomaterials.2014.02.024
20. Blanco E, Hsiao A, Mann AP, Landry MG, Meric-Bernstam F, Ferrari M. Nanomedicine in cancer therapy: innovative trends and prospects. Cancer Sci. 2011;102(7):1247–1252. doi:10.1111/j.1349-7006.2011.01941.x
21. Marcazzan S, Varoni EM, Blanco E, Lodi G, Ferrari M. Nanomedicine, an emerging therapeutic strategy for oral cancer therapy. Oral Oncol. 2018;76:1–7. doi:10.1016/j.oraloncology.2017.11.014
22. Scheinberg DA, Villa CH, Escorcia FE, McDevitt MR. Carbon Nanotubes Vol 2. Wiley-VCH Verlag GmbH & Co. KGaA; 2012.
23. He H, Pham-Huy L, Dramou P, Xiao D, Zuo P, Pham-Huy C. Carbon nanotubes: applications in pharmacy and medicine. Biomed Res Int. 2013;2013(2–3):1–12.
24. Kumar S, Prathibha D, Shankar N, Parthibarajan R, Mastyagiri L, Shankar M. Pharmaceutical application of carbon nanotube-mediated drug delivery system. Int J Pharm Sci Nanotech. 2012;5(3):1685–1696.
25. Usui Y, Haniu H, Tsuruoka S, Saito N. Carbon nanotubes innovate on medical technology. Med Chem. 2012;2(1):1–6. doi:10.4172/2161-0444.1000105
26. Choudhury H, Pandey M, Chin PX, et al. Transferrin receptors-targeting nanocarriers for efficient targeted delivery and transcytosis of drugs into the brain tumors: a review of recent advancements and emerging trends. Drug Deliv Transl Res. 2018;8(5):1545–1563. doi:10.1007/s13346-018-0552-2
27. Gao X, Guo L, Li J, Thu HE, Hussain Z. Nanomedicines guided nanoimaging probes and nanotherapeutics for early detection of lung cancer and abolishing pulmonary metastasis: critical appraisal of newer developments and challenges to clinical transition. J Control Release. 2018;292:29–57. doi:10.1016/j.jconrel.2018.10.024
28. Mahajan S, Patharkar A, Kuche K, et al. Functionalized carbon nanotubes as emerging delivery system for the treatment of cancer. Int J Pharm. 2018;548(1):540–558. doi:10.1016/j.ijpharm.2018.07.027
29. Singh B, Baburao C, Pispati V, et al. Carbon nanotubes. A novel drug delivery system. Int J of Res Pharm Chem. 2012;2(2):523–532.
30. Wang L-D, Zhou F-Y, Li X-M, et al. Genome-wide association study of esophageal squamous cell carcinoma in Chinese subjects identifies a susceptibility locus at PLCE1. Nat Genet. 2010;42:759. doi:10.1038/ng.648
31. Khalili S, Tamim H, Khalili A, Rashidi MM. Unsteady convective heat and mass transfer in pseudoplastic nanofluid over a stretching wall. Adv Powder Technol. 2015;26(5):1319–1326. doi:10.1016/j.apt.2015.07.006
32. Wu W, Li R, Bian X, et al. Covalently combining carbon nanotubes with anticancer agent: preparation and antitumor activity. ACS Nano. 2009;3(9):2740–2750. doi:10.1021/nn9005686
33. Dhar S, Liu Z, Thomale J, Dai H, Lippard SJ. Targeted single-wall carbon nanotube-mediated Pt(IV) prodrug delivery using folate as a homing device. J Am Chem Soc. 2008;130(34):11467–11476. doi:10.1021/ja803036e
34. Hussain Z, Khan S, Imran M, Sohail M, Shah SWA, de Matas M. PEGylation: a promising strategy to overcome challenges to cancer-targeted nanomedicines: a review of challenges to clinical transition and promising resolution. Drug Deliv Transl Res. 2019. doi:10.1007/s13346-019-00631-4
35. Hashemzadeh H, Raissi H. The functionalization of carbon nanotubes to enhance the efficacy of the anticancer drug paclitaxel: a molecular dynamics simulation study. J Mol Model. 2017;23(8):222. doi:10.1007/s00894-017-3391-z
36. Koupaei Malek S, Gabris MA, Hadi Jume B, et al. Adsorption and in vitro release study of curcumin form polyethyleneglycol functionalized multi walled carbon nanotube: kinetic and isotherm study. Daru. 2018.
37. Lay CL, Liu HQ, Tan HR, Liu Y. Delivery of paclitaxel by physically loading onto poly(ethylene glycol) (PEG)-graft-carbon nanotubes for potent cancer therapeutics. Nanotechnology. 2010;21(6):065101. doi:10.1088/0957-4484/21/6/065101
38. Zhang HE, Henderson JM, Gorrell MD. Animal models for hepatocellular carcinoma. Biochim Biophys Acta (BBA). 2019;1865(5):993–1002. doi:10.1016/j.bbadis.2018.08.009
39. Abel EL, DiGiovanni J. 7 - environmental carcinogenesis. In: Mendelsohn J, Gray JW, Howley PM, Israel MA, Thompson CB, editors. The Molecular Basis of Cancer.
40. Lohan S, Raza K, Mehta SK, Bhatti GK, Saini S, Singh B. Anti-Alzheimer’s potential of berberine using surface decorated multi-walled carbon nanotubes: a preclinical evidence. Int J Pharm. 2017;530(1):263–278. doi:10.1016/j.ijpharm.2017.07.080
41. Zidan DW, Elmasry MS, Hassan WS, Shalaby AA. Utility of cremophor RH 40 as a micellar improvement for spectrofluorimetric estimation of sorafenib in pure form, commercial preparation, and human plasma. Luminescence. 2018;33(2):326–335. doi:10.1002/bio.3417
42. Kondo N, Iwao T, Hirai K, et al. Improved oral absorption of enteric coprecipitates of a poorly soluble drug. J Pharm Sci. 1994;83(4):566–570. doi:10.1002/jps.2600830425
43. Sobottka SB, Berger MR. Assessment of antineoplastic agents by MTT assay: partial underestimation of antiproliferative properties. Cancer Chemother Pharmacol. 1992;30(5):385–393. doi:10.1007/bf00689967
44. Zhang H, Zhang FM, Yan SJ. Preparation, in vitro release, and pharmacokinetics in rabbits of lyophilized injection of sorafenib solid lipid nanoparticles. Int J Nanomed. 2012;7:2901–2910. doi:10.2147/IJN.S32415
45. Di Stefano G, Fiume L, Baglioni M, et al. Efficacy of doxorubicin coupled to lactosaminated albumin on rat hepatocellular carcinomas evaluated by ultrasound imaging. Dig Liver Dis. 2008;40(4):278–284. doi:10.1016/j.dld.2007.10.008
46. Wilhelm S, Adnane L, Newell P, Villanueva A, Llovet J, Lynch M. Preclinical overview of sorafenib, a multikinase inhibitor that targets both Raf and VEGF and PDGF receptor tyrosine kinase signaling. Mol Cancer Ther. 2008;7(10):3129–3140. doi:10.1158/1535-7163.MCT-08-0013
47. Banchroft JD, Stevens A, Turner DR. Theory and Practice of Histoloicl Techniques.
48. Saleh IG, Ali Z, Hammad MA, et al. Stem cell intervention ameliorates epigallocatechin-3-gallate/lipopolysaccharide-induced hepatotoxicity in mice. Hum Exp Toxicol. 2015;34(11):1180–1194. doi:10.1177/0960327115572707
49. Azqhandi MHA, Farahani BV, Dehghani N. Encapsulation of methotrexate and cyclophosphamide in interpolymer complexes formed between poly acrylic acid and poly ethylene glycol on multi-walled carbon nanotubes as drug delivery systems. Mater Sci Eng C Mater Biol Appl. 2017;79:841–847. doi:10.1016/j.msec.2017.05.089
50. Grøndahl L, Lawrie G, Jejurikar A. 9 - Alginate-based drug delivery devices. In: Sharma CP, editor. Biointegration of Medical Implant Materials. Woodhead Publishing; 2010:236–266.
51. Lopes M, Abrahim B, Veiga F, et al. Preparation methods and applications behind alginate-based particles. Expert Opin Drug Deliv. 2017;14(6):769–782. doi:10.1080/17425247.2016.1214564
52. Pasparakis G, Bouropoulos N. Swelling studies and in vitro release of verapamil from calcium alginate and calcium alginate-chitosan beads. Int J Pharm. 2006;323(1–2):34–42. doi:10.1016/j.ijpharm.2006.05.054
53. Zhang L, Guo J, Peng X, Jin Y. Preparation and release behavior of carboxymethylated chitosan/alginate microspheres encapsulating bovine serum albumin. J Appl Polym Sci. 2004;92(2):878–882. doi:10.1002/(ISSN)1097-4628
54. Zhang X, Hui Z, Wan D, et al. Alginate microsphere filled with carbon nanotube as drug carrier. Int J Biol Macromol. 2010;47(3):389–395. doi:10.1016/j.ijbiomac.2010.06.003
55. Farahani B, Behbahani G, Javadi N. Functionalized multi walled carbon nanotubes as a carrier for doxorubicin: drug adsorption study and statistical optimization of drug loading by factorial design methodology. J Braz Chem Soc. 2016;27(4):694–705.
56. Habibizadeh M, Rostamizadeh K, Dalali N, Ramazani A. Preparation and characterization of PEGylated multiwall carbon nanotubes as covalently conjugated and non-covalent drug carrier: a comparative study. Mater Sci Eng C Mater Biol Appl. 2017;74(3):1–9. doi:10.1016/j.msec.2016.12.023
57. Dash S, Murthy PN, Nath L, Chowdhury P. Kinetic modeling on drug release from controlled drug delivery systems. Acta Pol Pharm. 2010;67(3):217–223.
58. Chen J, Chen S, Zhao X, Kuznetsova LV, Wong SS, Ojima I. Functionalized single-walled carbon nanotubes as rationally designed vehicles for tumor-targeted drug delivery. J Am Chem Soc. 2008;130(49):16778–16785. doi:10.1021/ja805570f
59. Sajid MI, Jamshaid U, Jamshaid T, Zafar N, Fessi H, Elaissari A. Carbon nanotubes from synthesis to in vivo biomedical applications. Int J Pharm. 2016;501(1):278–299. doi:10.1016/j.ijpharm.2016.01.064
60. Zakaria AB, Picaud F, Rattier T, et al. Nanovectorization of TRAIL with single wall carbon nanotubes enhances tumor cell killing. Nano Lett. 2015;15(2):891–895. doi:10.1021/nl503565t
61. Tang S, Li Y. Sorafenib-loaded ligand-functionalized polymer-lipid hybrid nanoparticles for enhanced therapeutic effect against liver cancer. J Nanosci Nanotechnol. 2019;19(11):6866–6871. doi:10.1166/jnn.2019.16936
62. Tang X, Chen L, Li A, et al. Anti-GPC3 antibody-modified sorafenib-loaded nanoparticles significantly inhibited HepG2 hepatocellular carcinoma. Drug Deliv. 2018;25(1):1484–1494. doi:10.1080/10717544.2018.1477859
63. Zhao Z-B, Long J, Zhao -Y-Y, et al. Adaptive immune cells are necessary for the enhanced therapeutic effect of sorafenib-loaded nanoparticles. Biomater Sci. 2018;6(4):893–900. doi:10.1039/c8bm00106e
64. Bansal AK, Bansal M, Soni G, Bhatnagar D. Protective role of Vitamin E pre-treatment on N-nitrosodiethylamine induced oxidative stress in rat liver. Chem Biol Interact. 2005;156(2–3):101–111. doi:10.1016/j.cbi.2005.08.001
65. Di Stefano G, Fiume L, Baglioni M, et al. A conjugate of doxorubicin with lactosaminated albumin enhances the drug concentrations in all the forms of rat hepatocellular carcinomas independently of their differentiation grade. Liver Int. 2006;26(6):726–733. doi:10.1111/j.1478-3231.2006.01289.x
66. Di Stefano G, Fiume L, Baglioni M, et al. Doxorubicin coupled to lactosaminated albumin: effect of heterogeneity in drug load on conjugate disposition and hepatocellular carcinoma uptake in rats. Eur J Pharm Sci. 2008;33(2):191–198. doi:10.1016/j.ejps.2007.11.005
67. Fiume L, Bolondi L, Busi C, et al. Doxorubicin coupled to lactosaminated albumin inhibits the growth of hepatocellular carcinomas induced in rats by diethylnitrosamine. J Hepatol. 2005;43(4):645–652. doi:10.1016/j.jhep.2005.02.045
68. Sayed-Ahmed MM, Aleisa AM, Al-Rejaie SS, et al. Thymoquinone attenuates diethylnitrosamine induction of hepatic carcinogenesis through antioxidant signaling. Oxid Med Cell Longev. 2010;3(4):254–261. doi:10.4161/oxim.3.4.12714
69. Sivaramakrishnan V, Shilpa PN, Praveen Kumar VR, Niranjali Devaraj S. Attenuation of N-nitrosodiethylamine-induced hepatocellular carcinogenesis by a novel flavonol-Morin. Chem Biol Interact. 2008;171(1):79–88. doi:10.1016/j.cbi.2007.09.003
70. Behne T, Copur MS. Biomarkers for hepatocellular carcinoma. Int J Hepatol. 2012;2012:859076. doi:10.1155/2012/962183
71. Cheng J, Wang W, Zhang Y, et al. Prognostic role of pre-treatment serum AFP-L3% in hepatocellular carcinoma: systematic review and meta-analysis. PLoS One. 2014;9(1):e87011. doi:10.1371/journal.pone.0087011
72. Gan Y, Liang Q, Song X. Diagnostic value of alpha-L-fucosidase for hepatocellular carcinoma: a meta-analysis. Tumour Biol. 2014;35(5):3953–3960. doi:10.1007/s13277-013-1563-8
73. Jain D. Tissue diagnosis of hepatocellular carcinoma. J Clin Exp Hepatol. 2014;4(Suppl 3):S67–S73. doi:10.1016/j.jceh.2014.03.047
74. Lagana SM, Salomao M, Bao F, Moreira RK, Lefkowitch JH, Remotti HE. Utility of an immunohistochemical panel consisting of glypican-3, heat-shock protein-70, and glutamine synthetase in the distinction of low-grade hepatocellular carcinoma from hepatocellular adenoma. Appl Immunohistochem Mol Morphol. 2013;21(2):170–176. doi:10.1097/PAI.0b013e31825d527f
75. Shi M, Huang Z, Yang Y, Zhao B. [Diagnostic value of serum Golgi protein-73 (GP73) combined with AFP-L3% in hepatocellular carcinoma: a meta-analysis]. Zhonghua Gan Zang Bing Za Zhi. 2015;23(3):189–193. doi:10.3760/cma.j.issn.1007-3418.2015.03.007
76. Vora SR, Zheng H, Stadler ZK, Fuchs CS, Zhu AX. Serum alpha-fetoprotein response as a surrogate for clinical outcome in patients receiving systemic therapy for advanced hepatocellular carcinoma. Oncologist. 2009;14(7):717–725. doi:10.1634/theoncologist.2009-0038
77. Wang NY, Wang C, Li W, et al. Prognostic value of serum AFP, AFP-L3, and GP73 in monitoring short-term treatment response and recurrence of hepatocellular carcinoma after radiofrequency ablation. Asian Pac J Cancer Prev. 2014;15(4):1539–1544. doi:10.7314/apjcp.2014.15.4.1539
78. Kin M, Sata M, Ueno T, et al. Basic fibroblast growth factor regulates proliferation and motility of human hepatoma cells by an autocrine mechanism. J Hepatol. 1997;27(4):677–687. doi:10.1016/s0168-8278(97)80085-2
79. Lin D, Wu J. Hypoxia inducible factor in hepatocellular carcinoma: a therapeutic target. World J Gastroenterol. 2015;21(42):12171–12178. doi:10.3748/wjg.v21.i42.12171
80. Luo D, Wang Z, Wu J, Jiang C, Wu J. The role of hypoxia inducible factor-1 in hepatocellular carcinoma. BioMed Research International. 2014;2014:409272.
81. Mazzocca A, Fransvea E, Dituri F, Lupo L, Antonaci S, Giannelli G. Down-regulation of connective tissue growth factor by inhibition of transforming growth factor beta blocks the tumor-stroma cross-talk and tumor progression in hepatocellular carcinoma. Hepatology. 2010;51(2):523–534. doi:10.1002/hep.23285
82. Poon RT, Ng IO, Lau C, Yu WC, Fan ST, Wong J. Correlation of serum basic fibroblast growth factor levels with clinicopathologic features and postoperative recurrence in hepatocellular carcinoma. Am J Surg. 2001;182(3):298–304. doi:10.1016/s0002-9610(01)00708-5
83. Sandhu DS, Baichoo E, Roberts LR. Fibroblast growth factor signaling in liver carcinogenesis. Hepatology. 2014;59(3):1166–1173. doi:10.1002/hep.26679
84. Xiang ZL, Zeng ZC, Fan J, et al. The expression of HIF-1alpha in primary hepatocellular carcinoma and its correlation with radiotherapy response and clinical outcome. Mol Biol Rep. 2012;39(2):2021–2029. doi:10.1007/s11033-011-0949-1
85. Liu L, Cao Y, Chen C, et al. Sorafenib blocks the RAF/MEK/ERK pathway, inhibits tumor angiogenesis, and induces tumor cell apoptosis in hepatocellular carcinoma model PLC/PRF/5. Cancer Res. 2006;66(24):11851–11858. doi:10.1158/0008-5472.CAN-06-1377
86. Zhang CZ, Wang XD, Wang HW, Cai Y, Chao LQ. Sorafenib inhibits liver cancer growth by decreasing mTOR, AKT, and PI3K expression. J Buon. 2015;20(1):218–222.
87. Afzal M, Kazmi I, Gupta G, Rahman M, Kimothi V, Anwar F. Preventive effect of Metformin against N-nitrosodiethylamine-initiated hepatocellular carcinoma in rats. Saudi Pharm J. 2012;20(4):365–370. doi:10.1016/j.jsps.2012.05.012
88. Golla K, Bhaskar C, Ahmed F, Kondapi AK. A target-specific oral formulation of Doxorubicin-protein nanoparticles: efficacy and safety in hepatocellular cancer. J Cancer. 2013;4(8):644–652. doi:10.7150/jca.7093
89. Cao H, Wang Y, He X, et al. Codelivery of sorafenib and curcumin by directed self-assembled nanoparticles enhances therapeutic effect on hepatocellular carcinoma. Mol Pharm. 2015;12(3):922–931. doi:10.1021/mp500755j
90. Ma L, Li G, Zhu H, et al. 2-Methoxyestradiol synergizes with sorafenib to suppress hepatocellular carcinoma by simultaneously dysregulating hypoxia-inducible factor-1 and −2. Cancer Lett. 2014;355(1):96–105. doi:10.1016/j.canlet.2014.09.011
91. Sui J, Cui Y, Cai H, et al. Synergistic chemotherapeutic effect of sorafenib-loaded pullulan-Dox conjugate nanoparticles against murine breast carcinoma. Nanoscale. 2017;9(8):2755–2767. doi:10.1039/c6nr09639e
92. Zhao R, Li T, Zheng G, Jiang K, Fan L, Shao J. Simultaneous inhibition of growth and metastasis of hepatocellular carcinoma by co-delivery of ursolic acid and sorafenib using lactobionic acid modified and pH-sensitive chitosan-conjugated mesoporous silica nanocomplex. Biomaterials. 2017;143:1–16. doi:10.1016/j.biomaterials.2017.07.030
 © 2019 The Author(s). This work is published and licensed by Dove Medical Press Limited. The full terms of this license are available at https://www.dovepress.com/terms.php and incorporate the Creative Commons Attribution - Non Commercial (unported, v3.0) License.
By accessing the work you hereby accept the Terms. Non-commercial uses of the work are permitted without any further permission from Dove Medical Press Limited, provided the work is properly attributed. For permission for commercial use of this work, please see paragraphs 4.2 and 5 of our Terms.
© 2019 The Author(s). This work is published and licensed by Dove Medical Press Limited. The full terms of this license are available at https://www.dovepress.com/terms.php and incorporate the Creative Commons Attribution - Non Commercial (unported, v3.0) License.
By accessing the work you hereby accept the Terms. Non-commercial uses of the work are permitted without any further permission from Dove Medical Press Limited, provided the work is properly attributed. For permission for commercial use of this work, please see paragraphs 4.2 and 5 of our Terms.