")
Back to Journals » Journal of Pain Research » Volume 14
Derivation of a Risk Assessment Tool for Prediction of Long-Term Pain Intensity Reduction After Physical Therapy
Authors Horn ME , George SZ , Li C, Luo S, Lentz TA
Received 9 February 2021
Accepted for publication 28 April 2021
Published 28 May 2021 Volume 2021:14 Pages 1515—1524
DOI https://doi.org/10.2147/JPR.S305973
Checked for plagiarism Yes
Review by Single anonymous peer review
Peer reviewer comments 2
Editor who approved publication: Dr Michael A Ueberall
Maggie E Horn,1 Steven Z George,2 Cai Li,3 Sheng Luo,4 Trevor A Lentz2
1Duke University, Department of Orthopaedic Surgery, Durham, NC, 27701, USA; 2Duke University, Department of Orthopaedic Surgery and Duke Clinical Research Institute, Durham, NC, 27701, USA; 3Yale University, Department of Biostatistics, New Haven, CT, USA; 4Duke University, Department of Biostatistics and Bioinformatics, Duke University School of Medicine, Durham, NC, USA
Correspondence: Maggie E Horn
Duke University, Department of Orthopaedic Surgery, Box 100402, Durham, NC, 27701, USA
Tel +1 9196841365
Email [email protected]
Rationale: Risk assessment tools can improve clinical decision-making for individuals with musculoskeletal pain, but do not currently exist for predicting reduction of pain intensity as an outcome from physical therapy.
Aims and Objective: The objective of this study was to develop a tool that predicts failure to achieve a 50% pain intensity reduction by 1) determining the appropriate statistical model to inform the tool and 2) select the model that considers the tradeoff between clinical feasibility and statistical accuracy.
Methods: This was a retrospective, secondary data analysis of the Optimal Screening for Prediction of Referral and Outcome (OSPRO) cohort. Two hundred and seventy-nine individuals seeking physical therapy for neck, shoulder, back, or knee pain who completed 12-month follow-up were included. Two modeling approaches were taken: a longitudinal model included demographics, presence of previous episodes of pain, and regions of pain in addition to baseline and change in OSPRO Yellow Flag scores to 12 months; two comparison models included the same predictors but assessed only baseline and early change (4 weeks) scores. The primary outcome was failure to achieve a 50% reduction in pain intensity score at 12 months. We compared the area under the curve (AUC) to assess the performance of each candidate model and to determine which to inform the Personalized Pain Prediction (P3) risk assessment tool.
Results: The baseline only and early change models demonstrated lower accuracy (AUC=0.68 and 0.71, respectively) than the longitudinal model (0.79) but were within an acceptable predictive range. Therefore, both baseline and early change models were used to inform the P3 risk assessment tool.
Conclusion: The P3 tool provides physical therapists with a data-driven approach to identify patients who may be at risk for not achieving improvements in pain intensity following physical therapy.
Keywords: persistent pain, risk assessment tool, musculoskeletal pain, risk prediction, psychological factors
Introduction
In the United States, musculoskeletal pain is increasingly prevalent and is a leading contributor to disability.1 The causes of musculoskeletal pain and its continued persistence are multifactorial,2 with sociodemographic, psychological, and health-related factors being known contributors.3 Given the multidimensional nature of pain, predicting outcomes is difficult but integral to improving clinical decision-making at the point of care. This is especially important in emerging value-based care models that emphasize minimizing the risks of unwarranted care escalation, high costs, and poor outcomes.
Preliminary research on the use of predictive modeling techniques to enable healthcare providers to make more data-driven clinical decisions has been promising.4–7 But integrating predictive modeling into the clinical workflow remains a challenge due to difficulties in translating predictive model results efficiently and meaningfully for the clinician and patient. The gold standard for implementation of predictive models in clinical care is through the use of risk assessment tools embedded in the electronic health record and available for use within the clinical workflow. Risk assessment tools quantify the risk or benefit of treatment using information known to predict clinically relevant outcomes. These tools are ideally informed by predictive models with variables that are routinely collected.
Existing risk assessment tools that take into account the multidimensionality of persistent musculoskeletal pain tend to incorporate pain-related psychological distress.6,8 This is because psychological factors have a strong influence on treatment outcomes, particularly the development of persistent pain. The Optimal Screening for Prediction of Referral and Outcome Yellow Flag (OSPRO-YF) screening tool9 was developed with this purpose in mind. It concisely and accurately estimates how patients will score on 11 different full-length psychological questionnaires that represent a broad range of pain-related vulnerability and resilience constructs. Emerging evidence also suggests that prediction of pain-related outcomes may be enhanced by considering change in health and mental status such as psychological distress over time. Such an approach can improve prediction accuracy but must be weighed against the additional administrative burden of serial assessment of measures. Existing outcome prediction or risk assessment tools predicting persistent musculoskeletal pain do not incorporate change in psychological distress and dynamic nature of risk assessment over time.8 This limits the potential of risk assessment tools to quantify how risk changes as a result of treatment, not just risk assessment at baseline.
Risk assessment tools encourage probabilistic thinking, which is well suited for prognosis decisions, compared to deterministic thinking, which is better suited for diagnostic decisions. Within the context of musculoskeletal pain, one key outcome is whether pain reduction occurs after an episode of physical therapy care (ie, multiple treatment sessions). A risk assessment tool that can concisely and accurately communicate the probability of pain reduction while carefully weighing model accuracy against a manageable number of predictors is desired to increase the likelihood of clinical uptake. Therefore, the purpose of this analysis was to develop a multidimensional risk assessment tool—the Personalized Pain Prediction (P3) risk assessment tool—to quantify the risk of not achieving a 50% reduction in pain intensity 12 months after an episode of physical therapy. We selected a 12 month reduction because it would allow for prediction of risk for longer term outcomes that might be reflective of longer term treatment effects. The P3 tool is intended for physical therapists to improve decision-making for patients presenting with musculoskeletal complaints. Existing predictive approaches have estimated the risk of persistent disability from low back pain (STarT Back Screening Tool),8 chronic low back pain (PICKUP tool),6 persistent musculoskeletal pain10 (Beneciuk et al) and days to recovery from acute low back pain,11 but have not included pain intensity reduction (ie, change in pain) as an endpoint. We speculate the prior focus of prediction tools on disability and persistence of pain is because these endpoints are of importance to the patient and often are used as primary endpoints in clinical trials. Similarly, pain intensity reduction is an endpoint that is important to the patient and is also used as a primary endpoint in clinical trials. Therefore, we chose a 50% reduction in pain intensity as our primary outcome to reflect a meaningful benchmark to represent a favorable treatment response.12 We had the following primary aims: (1) to determine the predictive accuracy of two different approaches to model development—a longitudinal predictor approach that included modeling a set of predictors to optimize predictive accuracy that includes all possible OSPRO follow-up scores, and a reduced follow-up predictor approach that included a modeling of pain-related predictors and short-term OSPRO follow-up score that is most consistent with timing of care episodes—and (2) to compare the accuracy and clinical feasibility of these models to determine which model would best inform the P3 tool.
Methods
This was a secondary analysis from the Optimal Screening for Prediction of Referral and Outcome (OSPRO) validation cohort, which has been previously described.13 The purpose of the current analysis is to select a risk prediction model for 50% reduction in pain intensity, with the purpose of incorporating this model into risk assessment tool and associated interface to be used by clinicians to aid in clinical decision-making. This study was approved by Duke University institutional review board (Pro00104774). All participants provided written informed consent to participate. This study was conducted in compliance with the Declaration of Helsinki.
Participants and Eligibility
Participants seeking physical therapy treatment for a primary complaint of neck, low back, knee, or shoulder pain were recruited from the Orthopaedic Physical Therapy Investigators Network, a nationwide network of clinics participating in the OSPRO cohort study. Specific eligibility criteria have been detailed elsewhere14 and were set to be broadly inclusive of patients seeking physical therapy for common musculoskeletal pain complaints. In this cohort study, all data were collected electronically directly from patients via a Research Electronic Data Capture (REDCap) website.
Candidate Predictive Measures
Participants completed a standard intake form that included information on factors known to be prognostic for musculoskeletal pain and/or pertinent to clinical care.15–18 These factors included age, sex, race, ethnicity, income, employment, education, insurance, geographic region, anatomical region of pain, pain duration, pain onset type, and history of surgery. Comorbidity burden was determined using a composite count of conditions included in the Charlson and Functional Comorbidity Indices.19,20 These measures were collected only at baseline.
We included a tool developed through the OSPRO development cohort study: the OSPRO Yellow flag (OSPRO-YF).14 The OSPRO-YF tool includes items from pain vulnerability (negative affect and fear-avoidance) and pain resilience domains (positive affect and self-efficacy) to aid with efficient identification of pain-associated psychological distress and coping.21 The OSPRO-YF tool estimates scores for full-length psychological questionnaires and identifies the presence of yellow flags, which are psychological indicators for poor prognosis.14 We used the 10-item tool in this analysis and followed the simple summary score method, which involves summing all item responses from the tool, with pain resilience items (questions 14, 15, and 17 on the original full-length OSPRO-YF) reverse scored. Simple summary scores range from 3–53 for the 10-item version, with higher simple summary scores indicating higher psychological distress. We have used this method extensively in previous analyses to predict clinical and healthcare utilization outcomes.9,10,13,22,23 In those analyses, the 10-item version of the tool performed better than or similarly compared to the longer 17-item version. The OSPRO-YF is valid and reliable, with additional information on psychometric properties and scoring provided in a recent publication by Butera et al.24 This measure was collected at baseline, 4 weeks, 6 months, and 12 months.
Primary Outcome
Pain is known to be a significant driver of seeking healthcare and increased healthcare utilization.25 Pain intensity is one of the most commonly collected pain measures across clinical settings,26 therefore pain intensity was chosen as the primary outcome in the analyses. Pain intensity was assessed with the 0–10 numeric rating scale, and participants rated their current pain intensity as well as their best (lowest) and worst (highest) pain intensity over the past 24 hours.19,27,28 We used the average of these three measures to establish overall pain intensity. The outcome of interest, persistent pain, was defined as not achieving a 50% reduction in pain intensity from baseline to 12 months. A 50% reduction was selected because it exceeded commonly recommended minimal change criterion (eg, 30% reduction)29 and represented a larger change indicative of successful outcomes.12 This criterion was used because it represented a stringent categorization, closer in magnitude to patient-centered definitions for pain and disability recovery.30–32
Data Analysis
Descriptive analyses were conducted for all covariates, including demographic, clinical, and symptom characteristics of the sample at baseline. The simple summary score of OSPRO-YF at baseline and 4-week, 6-month, and 12-month follow-up was calculated.33 Continuous variables were summarized using mean with standard deviation, median with interquartile range, and range where appropriate. Categorical variables were summarized using frequency with percentage.
For our primary analysis, we developed candidate predictive models and determined which would best inform a risk assessment tool to predict a failure to achieve a 50% reduction in pain intensity at 12 months. We took two approaches to model development. The first was a longitudinal follow-up approach. The model derived from this approach was designed to maximize predictive accuracy and model fit with the most full item set considering all available predictors in the OSPRO cohort, therefore representing the “optimal case” scenario for prediction. The second approach was to develop short-term follow-up models informed by variables commonly measured during most care episodes, as well as OSPRO-YF change score between baseline and 4 weeks only. We compared short-term models to determine the extent to which accuracy was reduced from the optimal statistical case (ie, Full predictor model). All models were fitted for the same complete dataset with 279 subjects.
Longitudinal Model Approach
We built the longitudinal model using a stepwise algorithm with both forward and backward selection that included all candidate predictors: demographic covariates (Table 1), baseline clinical covariates (Table 2). This model included all change scores in the OSPRO simple summary score up to 12 months (baseline score, baseline to 4 weeks, 4 weeks to six months, six months to 12 months). The algorithm terminated when no improvement in model fit according to the Akaike Information Criterion was achieved. This model was used as the comparison standard for the comparison models as we viewed this approach as providing the optimal prediction accuracy given all available predictors.
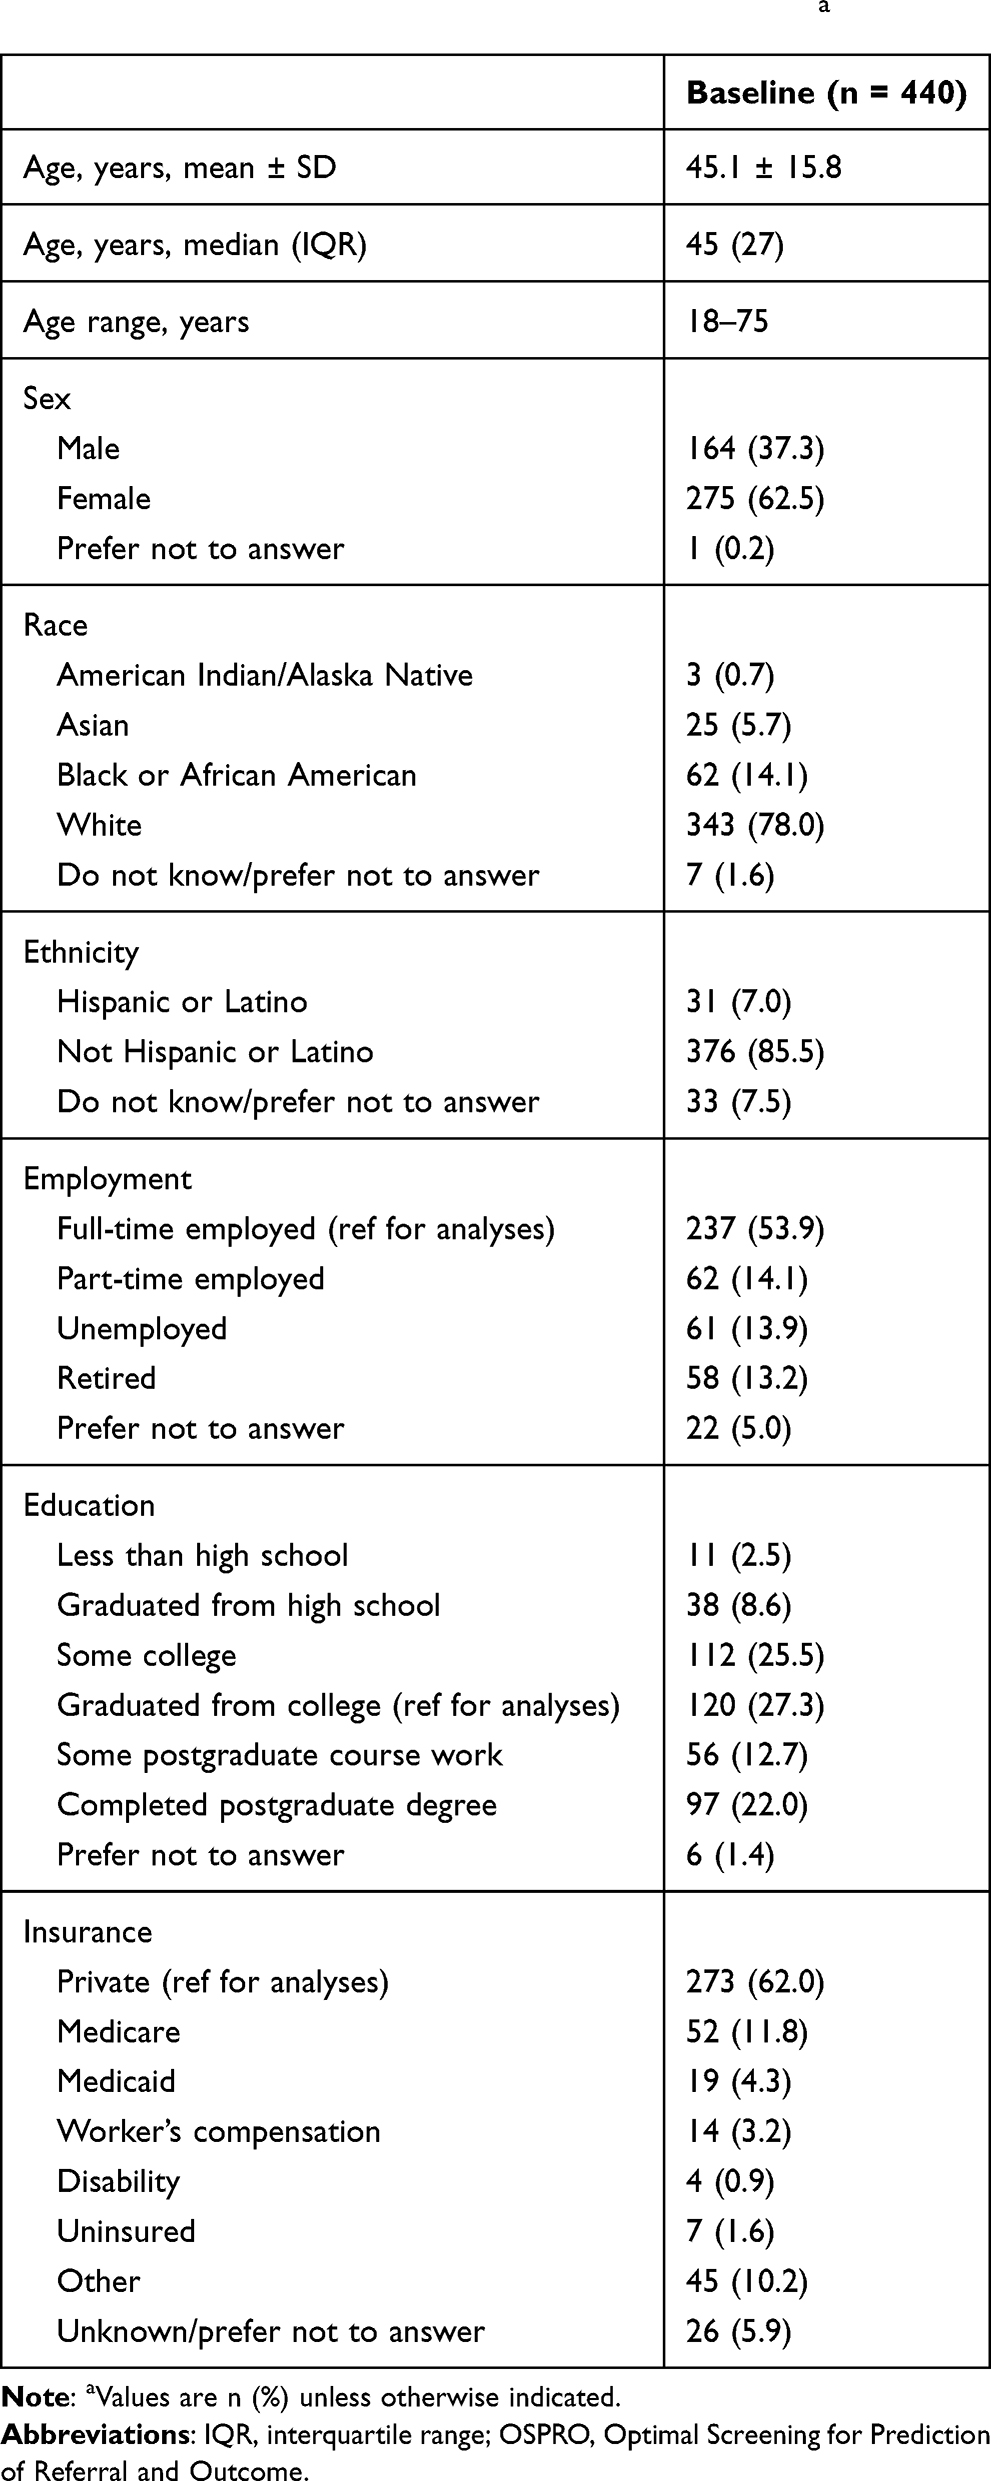 |
Table 1 Demographics of OSPRO Validation Cohorta |
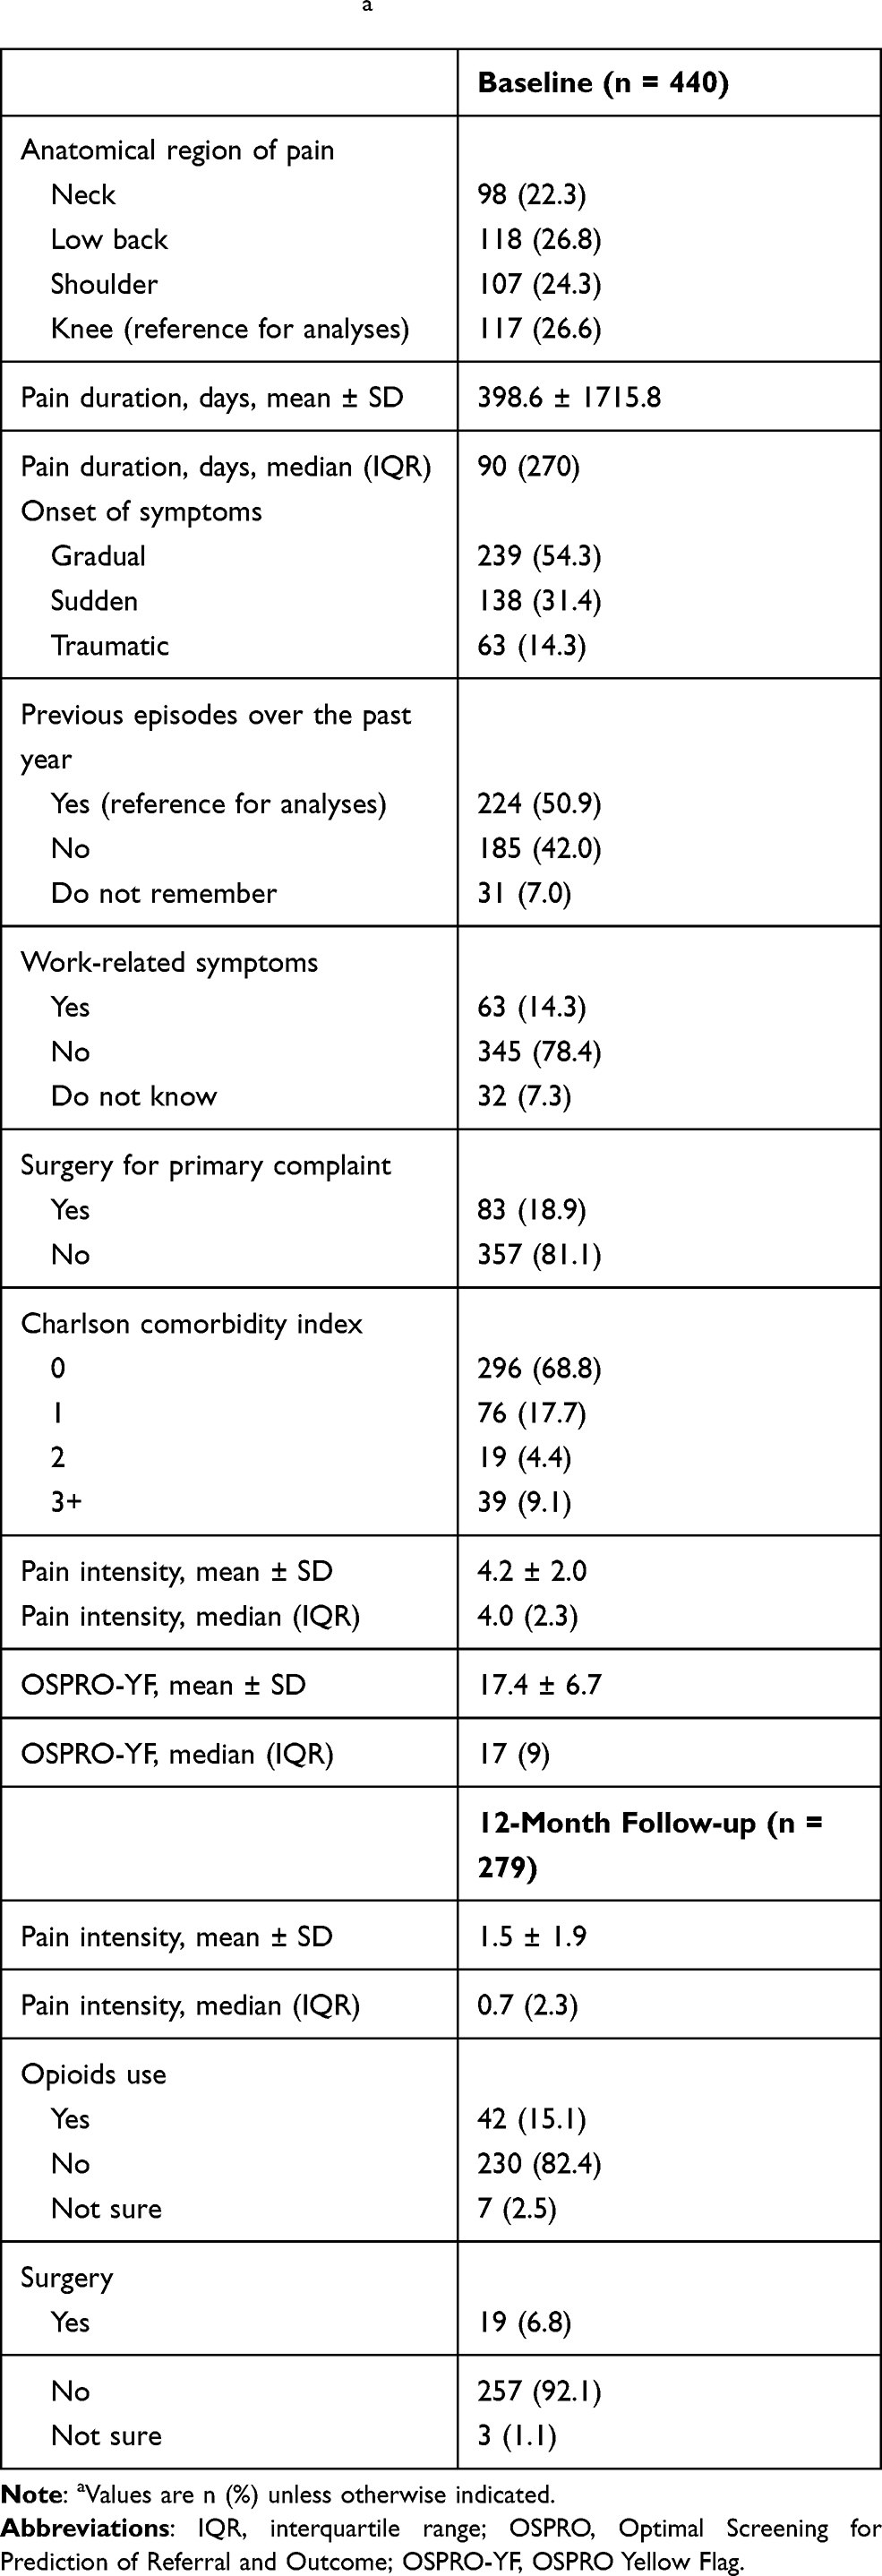 |
Table 2 Clinical Characteristics and Pain Intensity Outcomes for OSPRO Validation Cohorta |
Comparison Short-Term Predictor Models
The comparison predictor models were built with pain-related variables that could be routinely collected during the clinical encounter chosen a priori based on available variables in the dataset. The predictors selected in the logistic regression models included the presence of previous episodes of musculoskeletal pain, anatomical region of pain, baseline OSPRO-YF simple summary score and 4-week change score, and baseline pain intensity score. Compared to the full predictor model, the reduced predictor models did not include follow-up OSPRO scores past 4 weeks as potential predictors. We developed two different types of reduced predictor set models. The first was a “baseline only” model that included baseline predictors only. The second included baseline predictors plus change in OSPRO-YF summary score between baseline and 4 weeks (ie, “early change” model). The early change model would clarify the prediction value added by considering early change in psychological distress and provide an option to update prognosis based on early response to treatment. However, this model would not be suitable for use at initial evaluation since it would include a 4-week change score. This modeling approach focused on developing models with clinical utility that align with treatment planning; therefore, follow-up time change scores past 4 weeks were not included. Previous analyses have demonstrated only modest improvement in accuracy for clinically oriented models past 4 weeks.33
Comparison of Models
Estimates of individual parameters and the corresponding area under the curve (AUC), a measure of prediction accuracy, were reported for each model and were compared to determine the ideal model (or models) for use in developing the P3 tool that weighs predictive accuracy and pragmatic implementation considerations. Sensitivity analyses were performed for all models to consider the applicability of our cut-off for reduction in pain intensity. We found that using 30% reduction in pain intensity was similar to the models for 50% reduction in pain; therefore, only models with 50% pain reduction are presented. We reported the model parameter estimates, standard error, and p-values for each model. All analyses were performed using R version v3.7.0. We used pROC 1.15.3 R package for calculating AUC.34
Results
Patient Characteristics
A total of 440 participants completed baseline measures with primary complaints of neck (n = 98, 22.3%), shoulder (n = 107, 24.3%), low back (n = 118, 26.8%), or knee (n = 117, 26.6%) pain. Demographics of the sample are reported in Table 1.
Baseline patient characteristics and 12-month outcomes for pain intensity, opioid use, and surgery are reported in Table 2. A total of 279 (63.4%) participants completed the 12-month follow-up, with primary complaints of neck (n = 59, 21.1%), shoulder (n = 66, 23.7%), low back (n = 72, 25.8%), or knee (n = 82, 29.4%) pain. A previous study on this cohort reported minimal differences between the total participants and the cohort of patients completing all follow-up.23 We did not conduct imputation for missing data because previous outcomes prediction analyses using the OSPRO cohort have demonstrated no meaningful differences between imputed and complete case analyses.9,10,23
Statistical Modeling of 50% Reduction in Pain Intensity at 12 Months
After the completion of the stepwise regression, the predictors included in the final longitudinal model were the presence of previous episodes of musculoskeletal pain, anatomical region of pain, baseline OSPRO-YF simple summary score, baseline average pain intensity score, and changes in OSPRO-YF simple summary score from baseline to 4 weeks, 4 weeks to 6 months, and 6 to 12 months. Full model parameters and results of the longitudinal predictor set and comparison short-term predictor set models are reported in Table 3. The longitudinal model yielded an AUC of 0.79. The baseline-only OSPRO model yielded an AUC of 0.68, while the early change model yielded a slightly higher AUC of 0.71 and improved model fit compared to the baseline-only model. Because the lean predictor models achieved acceptable levels of accuracy and model fit, they were used to develop the final versions of the P3 tool.
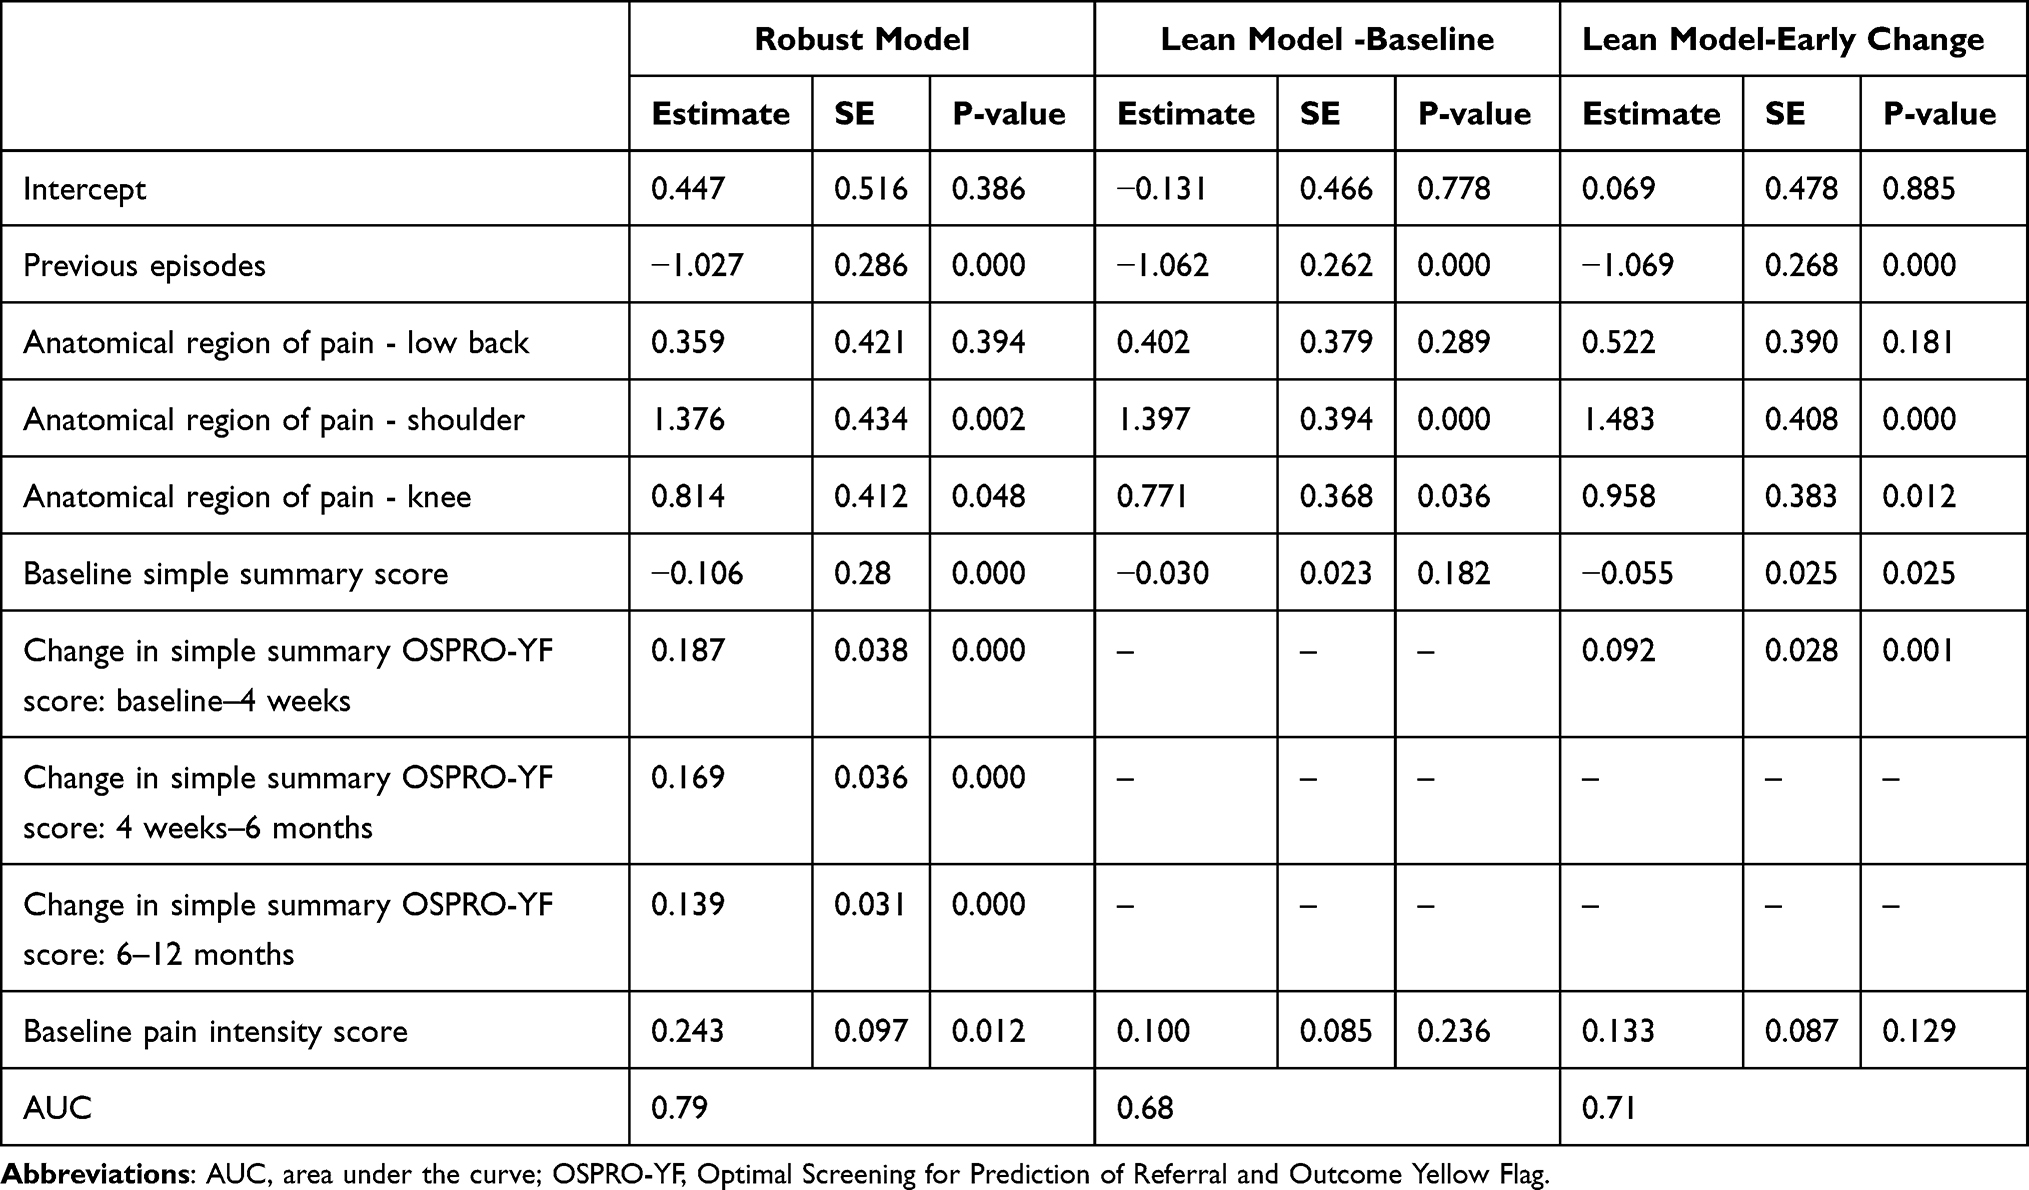 |
Table 3 All Model Estimates with Individual Parameters for Predicting 12-Month 50% Pain Reduction |
P3 Tool Calculation of Predicted Probability for Not Achieving a 50% Reduction in Pain Intensity
The probability of not achieving a 50% reduction in pain intensity at 12 months can be calculated using the steps outlined in Table 4. Two models inform the tool: the baseline only model with baseline variables that is used at baseline or initial assessment to predict probability of not achieving a 50% reduction in pain intensity, and the early change model that includes baseline-4 week change in OSPRO-YF and is to be used as a follow-up measure at 4 weeks to update prediction probabilities and communicate the change in risk. Inputting patient-specific values into the logistic regression equations will produce the log odds of not achieving a 50% reduction in pain intensity (step 1); the log odds must then be transformed into a probability estimate (step 2) and then the percentage probability of not achieving a 50% reduction in pain intensity at 12 months is estimated (step 3):
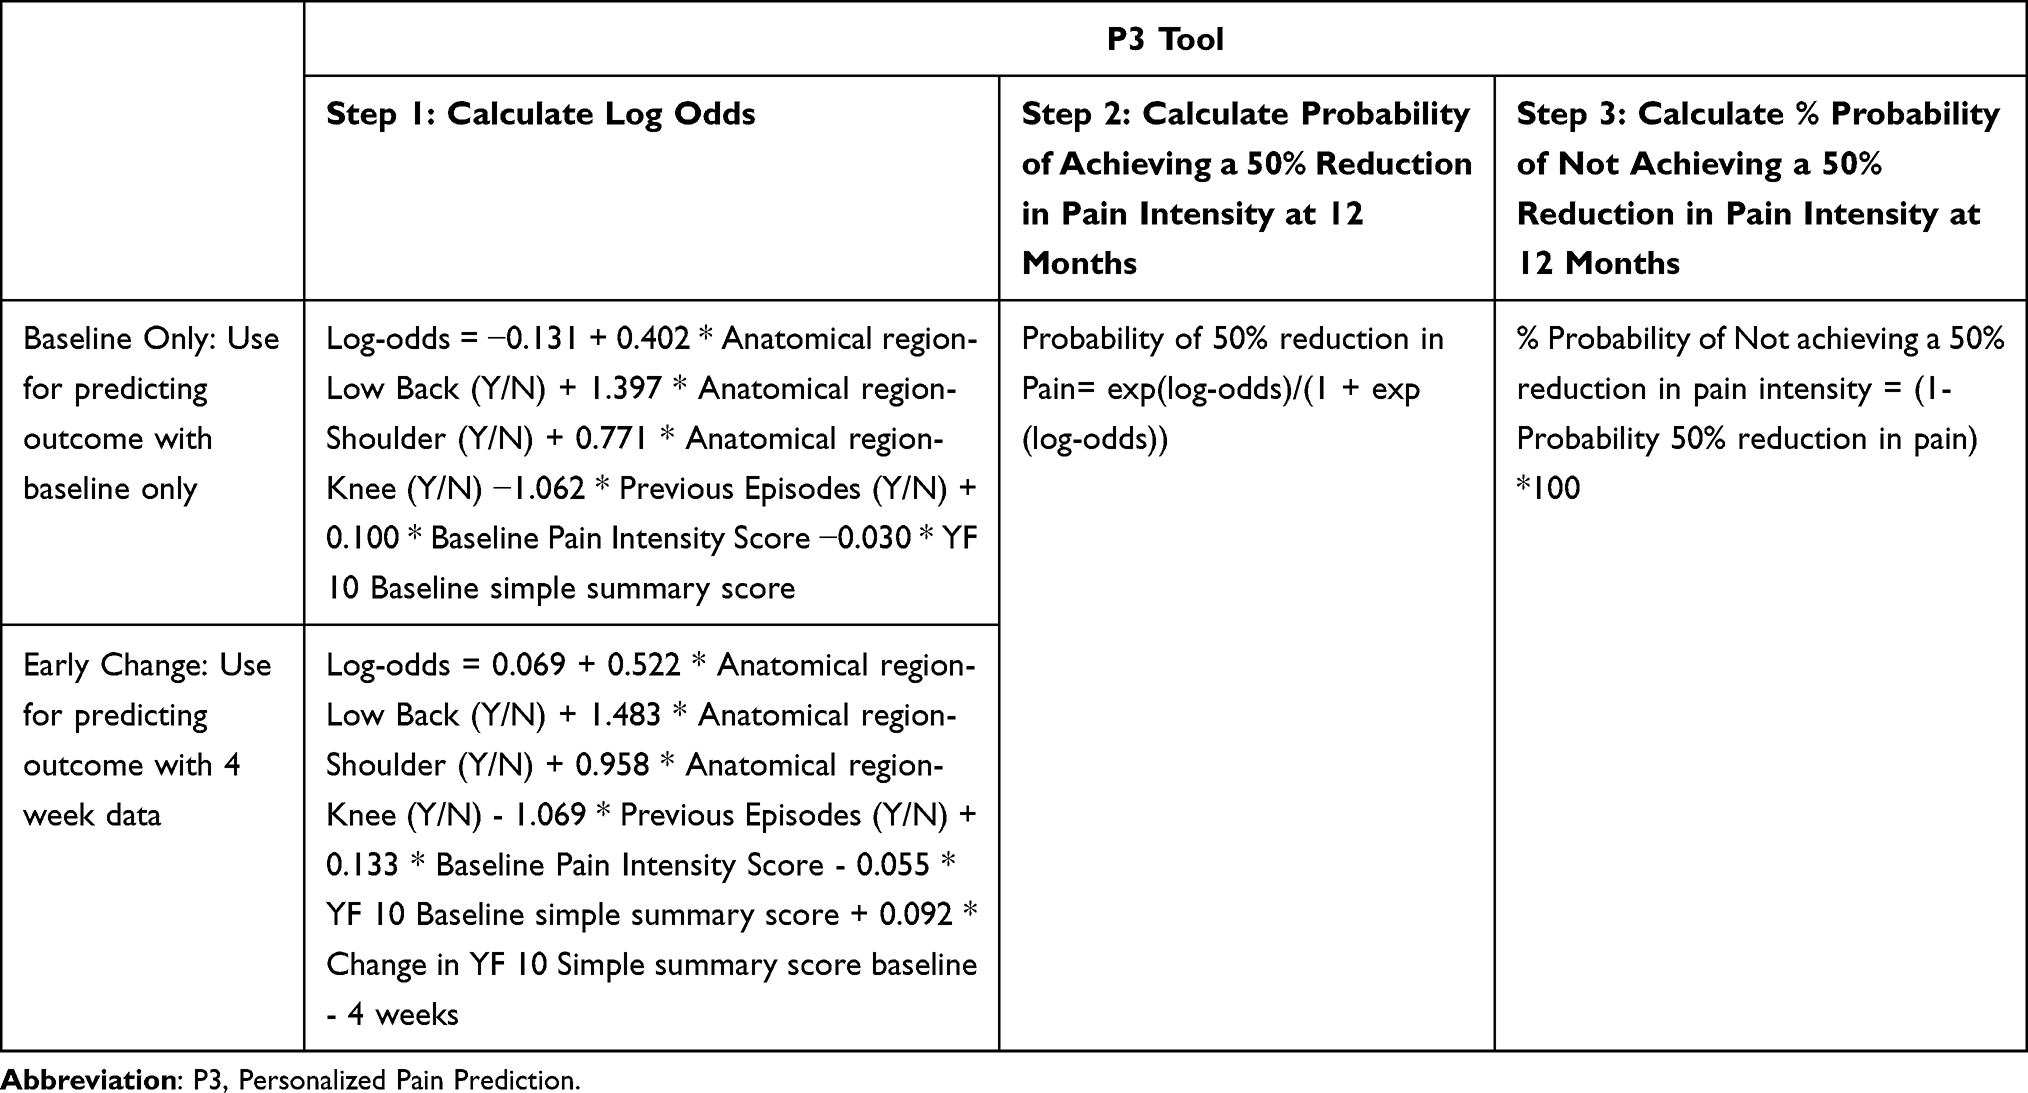 |
Table 4 Personalized Pain Prediction (P3) Tool Manual Calculations |
Step 1: Baseline: Log-odds = −0.131 + 0.402 * Anatomical region-Low Back (Y/N) + 1.397 * Anatomical region-Shoulder (Y/N) + 0.771 * Anatomical region- Knee (Y/N) −1.062 * Previous Episodes (Y/N) + 0.100 * Baseline Pain Intensity Score −0.030 * YF 10 Baseline simple summary score
Early Change: Log-odds = 0.069 + 0.522 * Anatomical region-Low Back (Y/N) + 1.483 * Anatomical region-Shoulder (Y/N) + 0.958 * Anatomical region- Knee (Y/N) - 1.069 * Previous Episodes (Y/N) + 0.133 * Baseline Pain Intensity Score - 0.055 * YF 10 Baseline simple summary score + 0.092 * Change in YF 10 Simple summary score baseline - 4 weeks
Step 2: Probability of 50% reduction in Pain= exp(log-odds)/(1 + exp(log-odds))
Step 3: % Probability of Not achieving a 50% reduction in pain intensity = (1-Probability 50% reduction in pain)*100
To demonstrate the use of the P3 tool, three hypothetical patient cases can be found in Table 5. A user-friendly mock-up of the tool in Microsoft Excel is provided in the Supplemental Material.
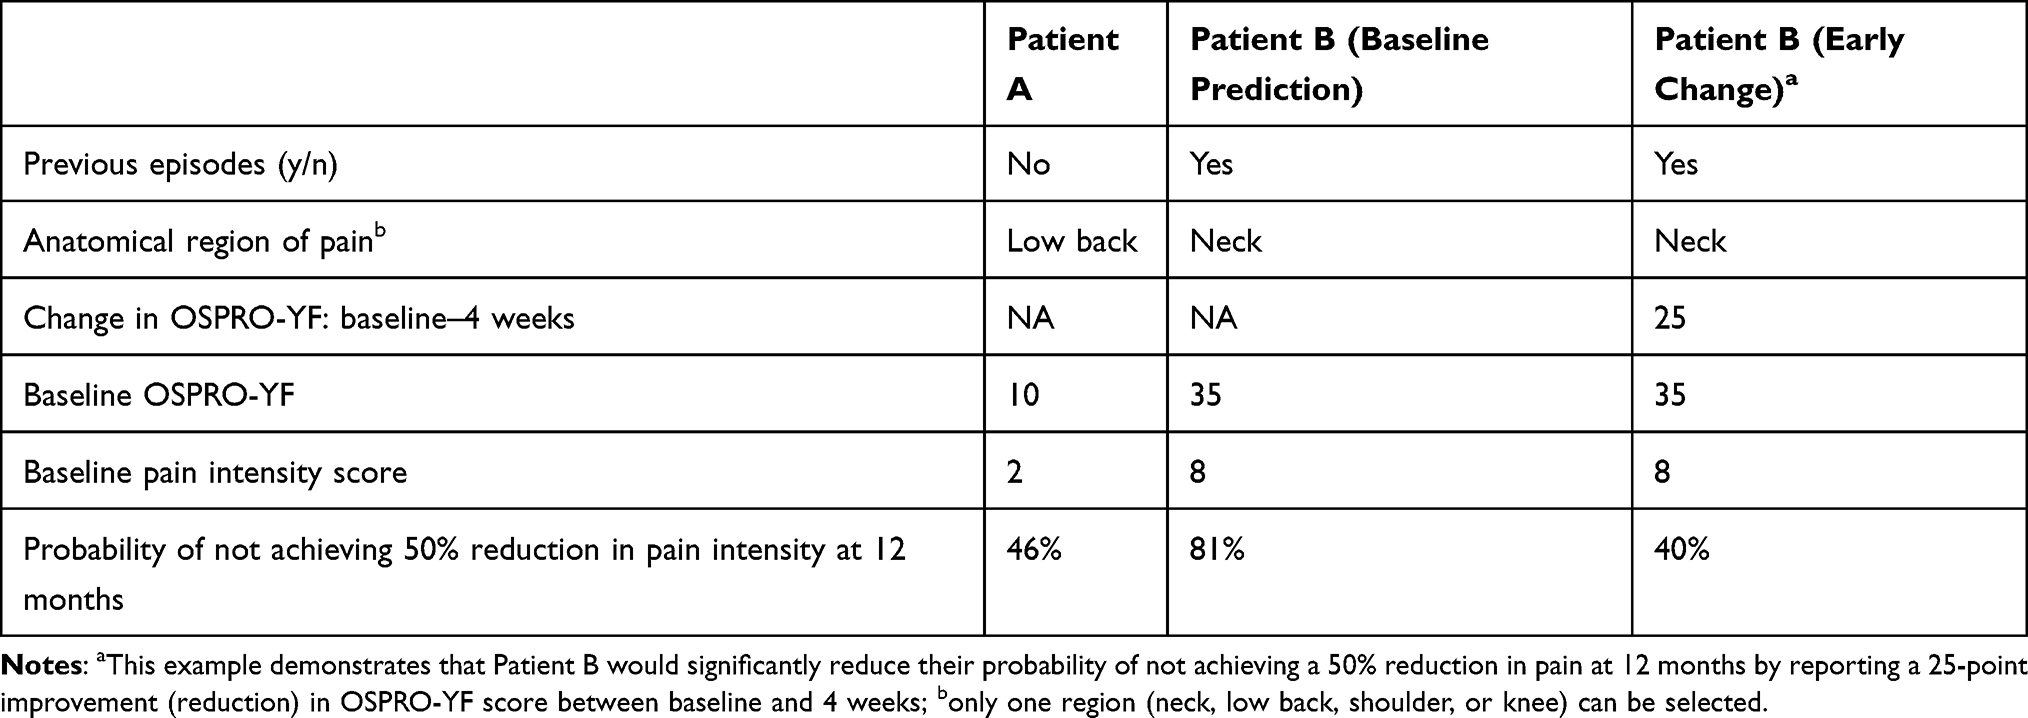 |
Table 5 Simulated Patient Cases Using P3 Tool |
Discussion
In this study, we examined two modeling techniques to build a multidimensional prediction tool that estimates risk of not achieving a 50% reduction in pain intensity at 12 months after an episode of physical therapy. This analysis adds to existing literature by reporting a tool to predict outcomes defined by change in pain intensity, complimenting predictive approaches that include prolonged disability and chronic or persistent pain states as endpoints.6,8,10 When examining candidate predictive models in this analysis, the longitudinal model represented the “optimal case” level of predictive accuracy against which the comparison short-term predictor models could be compared. Both baseline only and early change models had lower accuracy than the longitudinal model but were within an acceptable accuracy range for predictive models.35,36 Compared to the baseline-only predictive model, the early change model demonstrated modestly higher accuracy, suggesting psychological distress monitoring in the first 4 weeks of treatment can improve accuracy of prediction for pain intensity outcomes, but not drastically above assessments that consider baseline values only. Therefore, we used both short-term models to inform the P3 tool so clinicians have the option of using this tool at baseline only or administering it again 4 weeks later to update prognosis.
Serial assessment of risk is not a common paradigm in physical therapy but does hold promise for improving clinical decision-making.37 The additional 4-week assessment of psychological distress using the P3 tool might be most beneficial with those patients demonstrating high risk at baseline to determine whether early responses to treatment has improved the initial prognosis. For those who do not show improvement, a change in the current physical therapy approach to include psychologically informed approaches38 or additional referral for multidisciplinary care might be indicated. The P3 tool using the 4-week change model may also be helpful in determining how much a patient will need to reduce his or her psychological distress to improve the probability of achieving a 50% reduction in pain intensity. For instance, a patient with chronic low back pain who reports 7/10 pain intensity and OSPRO-YF summary score of 35 at baseline would have a 76% probability of not having a 50% reduction in pain intensity at 12 months. With the P3 tool it can be estimated that the patient will need to achieve a 4-week improvement of approximately 20 points in OSPRO-YF summary score to decrease that probability to 40%. These target values could be very helpful in goal-setting, treatment decision-making, and longitudinal monitoring.
The derivation version of the P3 tool has similar statistical accuracy for 12 month pain intensity reduction compared to validation versions of other related risk assessment tools that included disability or pain persistence as endpoints, such as the STarT Back Screening Tool (SBST),8 the PICKUP tool,39 and the Pain Belief Screening Instrument.40 However, the P3 tool has yet to be externally validated in an independent sample so it is likely that accuracy of the tool may vary. Even when this limitation is considered it is still relevant to consider that the existing validated tools did not report pain intensity endpoints so additional tools, like the P3 tool, still merit further investigation for those interested in predicting pain intensity endpoints. The use of prediction tools like the SBST, the PICKUP tool, and now the P3 provides advantages over clinician judgement alone for predicting outcomes in patients with musculoskeletal pain.39 Similarly, the P3 tool advances risk assessment in musculoskeletal pain by directly considering pain resilience domains (positive affect and self-efficacy) while estimating risk of 12-month pain intensity outcomes. The P3 tool also delivers value by enabling clinicians and their patients to better account for the dynamic nature of prognosis by incorporating early treatment responses and its impact on psychological distress. This capability is not possible with “static” prediction tools that were designed to inform prognosis at a single point in time, typically at the beginning of a care episode.
Strengths and Limitations
Our study’s strengths include that we were able to evaluate the performance of short-term follow-up models against a longitudinal “optimal case” predictor model to inform a risk assessment tool. In addition, we incorporated a brief but comprehensive psychological screening tool to complement other health-related and patient-reported variables in our models. We also acknowledge some limitations readers should consider when interpreting our results. This was further analysis of the OSPRO cohort; therefore, we were limited in the variables collected, the time points at which they were collected, and results can only be generalized to this cohort. The sample size was adequate to perform the planned analyses, but we have yet to validate the models in a separate cohort or validation dataset. Independent validation of this risk assessment tool, comparison to other existing tools, and strategies for clinical implementation, should be the goal of future research. Additional limitations that are important to consider when interpreting these results include the lack of details on the type of physical therapy treatments received and the lack of diagnostic categories. The lack of this information means that this risk calculator cannot be used to generate estimates for specific treatment approaches or specific diagnostic conditions.
Conclusion
We have developed the P3 tool to identify patients at risk for not achieving a 50% reduction in pain intensity 12 months after physical therapy. The P3 tool is a highly clinically useful tool as it provides a feasible approach to concisely predict risk for patients with musculoskeletal complaints seeking care from physical therapists. The P3 tool can be tailored for use at baseline or initial assessment only, or in conjunction with a follow-up assessment at 4 weeks to refine and update the initial prognosis. The P3 tool’s focus on prediction of pain intensity reduction adds to existing tools that have focused on disability or chronic pain outcomes. More research is needed to independently validate the tool in a prospective cohort of patients, compare it with existing tools, and identify best strategies for clinical implementation.
Acknowledgments
This study was funded by the Orthopaedic Academy (formerly Orthopaedic Section) of the American Physical Therapy Association through a Clinical Research Network award (2012–2016). The funder played no role in the design, conduct, or reporting of this study.
Disclosure
Dr Steven Z George reports his institution received salary support from Orthopaedic Academy of the American Physical Therapy Association for a grant 2012–2016 related to this project, during the conduct of the study; grants from NIH for his institution for work done as the PI and co-PI, personal fees from Med Risk, LLC serving as the Scientific Board Membership, royalties for an online pain management module from Rehab Essentials, Inc, outside the submitted work. The authors report no other conflicts of interest in this work.
References
1. Forouzanfar MH, Alexander L, Anderson HR, et al. GBD 2013 risk factors collaborators global, regional, and national comparative risk assessment of 79 behavioural, environmental and occupational, and metabolic risks or clusters of risks in 188 countries, 1990–2013: a systematic analysis for the Global Burden of Disease Study 2013. Lancet. 2015;386(10010):2287–2323.
2. Crofford LJ. Chronic pain: where the body meets the brain. Trans Am Clin Climatol Assoc. 2015;126:167–183.
3. Crofford LJ. Psychological aspects of chronic musculoskeletal pain. Best Pract Res Clin Rheumatol. 2015;29(1):147–155. doi:10.1016/j.berh.2015.04.027
4. Feldstein DA, Hess R, McGinn T, et al. Design and implementation of electronic health record integrated clinical prediction rules (iCPR): a randomized trial in diverse primary care settings. Implement Sci. 2017;12(1):37. doi:10.1186/s13012-017-0567-y
5. Gulliford MC, van Staa T, Dregan A, et al. Electronic health records for intervention research: a cluster randomized trial to reduce antibiotic prescribing in primary care (eCRT study). Ann Fam Med. 2014;12(4):344–351. doi:10.1370/afm.1659
6. Traeger AC, Henschke N, Hübscher M, et al. Estimating the risk of chronic pain: development and validation of a prognostic model (PICKUP) for patients with acute low back pain. PLoS Med. 2016;13(5):e1002019. doi:10.1371/journal.pmed.1002019
7. Campbell JM, O’Callaghan ME, Raymond E, et al. Tools for predicting clinical and patient-reported outcomes in prostate cancer patients undergoing androgen deprivation therapy: a systematic review of prognostic accuracy and validity. Clin Genitourin Cancer. 2017;15(6):629–634.e8. doi:10.1016/j.clgc.2017.03.011
8. Hill JC, Dunn KM, Lewis M, et al. A primary care back pain screening tool: identifying patient subgroups for initial treatment. Arthritis Rheum. 2008;59(5):632–641. doi:10.1002/art.23563
9. George SZ, Beneciuk JM, Lentz TA, et al. Optimal screening for prediction of referral and outcome (OSPRO) for musculoskeletal pain conditions: results from the validation cohort. J Orthop Sports Phys Ther. 2018;48(6):460–475. doi:10.2519/jospt.2018.7811
10. Beneciuk JM, Lentz TA, He Y, Wu SS, George SZ. Prediction of persistent musculoskeletal pain at 12 months: a secondary analysis of the optimal screening for prediction of referral and outcome (OSPRO) validation cohort study. Phys Ther. 2018;98(5):290–301. doi:10.1093/ptj/pzy021
11. da Silva T, Macaskill P, Mills K, et al. Predicting recovery in patients with acute low back pain: a clinical prediction model. Eur J Pain. 2017;21(4):716–726. doi:10.1002/ejp.976
12. Fritz JM, Hebert J, Koppenhaver S, Parent E. Beyond minimally important change: defining a successful outcome of physical therapy for patients with low back pain. Spine. 2009;34(25):2803–2809. doi:10.1097/BRS.0b013e3181ae2bd4
13. George SZ, Beneciuk JM, Lentz TA, Wu SS. The optimal screening for prediction of referral and outcome (OSPRO) in patients with musculoskeletal pain conditions: a longitudinal validation cohort from the USA. BMJ Open. 2017;7(6):e015188. doi:10.1136/bmjopen-2016-015188
14. Lentz TA, Beneciuk JM, Bialosky JE, et al. Development of a yellow flag assessment tool for orthopaedic physical therapists: results from the optimal screening for prediction of referral and outcome (OSPRO) cohort. J Orthop Sports Phys Ther. 2016;46(5):327–343. doi:10.2519/jospt.2016.6487
15. Artus M, Campbell P, Mallen CD, Dunn KM, van der Windt DAW. Generic prognostic factors for musculoskeletal pain in primary care: a systematic review. BMJ Open. 2017;7(1):e012901. doi:10.1136/bmjopen-2016-012901
16. Green DJ, Lewis M, Mansell G, et al. Clinical course and prognostic factors across different musculoskeletal pain sites: a secondary analysis of individual patient data from randomised clinical trials. Eur J Pain. 2018;22(6):1057–1070. doi:10.1002/ejp.1190
17. Henschke N, Ostelo RWJG, Terwee CB, van der Windt DAWM. Identifying generic predictors of outcome in patients presenting to primary care with nonspinal musculoskeletal pain. Arthritis Care Res. 2012;64(8):1217–1224. doi:10.1002/acr.21665
18. Mallen CD, Peat G, Thomas E, Dunn KM, Croft PR. Prognostic factors for musculoskeletal pain in primary care: a systematic review. Br J General Pract. 2007;57(541):655–661.
19. Childs JD, Piva SR, Fritz JM. Responsiveness of the numeric pain rating scale in patients with low back pain. Spine. 2005;30(11):1331–1334. doi:10.1097/01.brs.0000164099.92112.29
20. Irrgang JJ, Anderson AF, Boland AL, et al. Development and validation of the international knee documentation committee subjective knee form. Am J Sports Med. 2001;29(5):600–613. doi:10.1177/03635465010290051301
21. Karran EL, McAuley JH, Traeger AC, et al. Can screening instruments accurately determine poor outcome risk in adults with recent onset low back pain? A systematic review and meta-analysis. BMC Med. 2017;15(1):13. doi:10.1186/s12916-016-0774-4
22. Butera KA, Lentz TA, Beneciuk JM, George SZ. Preliminary evaluation of a modified STarT back screening tool across different musculoskeletal pain conditions. Phys Ther. 2016;96(8):1251–1261. doi:10.2522/ptj.20150377
23. Lentz TA, Beneciuk JM, George SZ. Prediction of healthcare utilization following an episode of physical therapy for musculoskeletal pain. BMC Health Serv Res. 2018;18(1):648. doi:10.1186/s12913-018-3470-6
24. Butera KA, George SZ, Lentz TA. Psychometric evaluation of the optimal screening for prediction of referral and outcome yellow flag (OSPRO-YF) tool: factor structure, reliability, and validity. J Pain. 2019. doi:10.1016/j.jpain.2019.09.003
25. Lentz TA, Harman JS, Marlow NM, Beneciuk JM, Fillingim RB, George SZ. Factors associated with persistently high-cost health care utilization for musculoskeletal pain. PLoS One. 2019;14(11):e0225125. doi:10.1371/journal.pone.0225125
26. Younger J, McCue R, Mackey S. Pain outcomes: a brief review of instruments and techniques. Curr Pain Headache Rep. 2009;13(1):39–43. doi:10.1007/s11916-009-0009-x
27. Bolton JE. Accuracy of recall of usual pain intensity in back pain patients. Pain. 1999;83(3):533–539. doi:10.1016/s0304-3959(99)00161-x
28. Jensen MP, Turner JA, Romano JM, Fisher LD. Comparative reliability and validity of chronic pain intensity measures. Pain. 1999;83(2):157–162. doi:10.1016/s0304-3959(99)00101-3
29. Ostelo RWJG, Deyo RA, Stratford P, et al. Interpreting change scores for pain and functional status in low back pain: towards international consensus regarding minimal important change. Spine. 2008;33(1):90–94. doi:10.1097/BRS.0b013e31815e3a10
30. Robinson ME, Brown JL, George SZ, et al. Multidimensional success criteria and expectations for treatment of chronic pain: the patient perspective. Pain Med. 2005;6(5):336–345. doi:10.1111/j.1526-4637.2005.00059.x
31. Thorne FM, Morley S. Prospective judgments of acceptable outcomes for pain, interference and activity: patient-determined outcome criteria. Pain. 2009;144(3):262–269. doi:10.1016/j.pain.2009.04.004
32. Zeppieri G, George SZ. Patient-defined desired outcome, success criteria, and expectation in outpatient physical therapy: a longitudinal assessment. Health Qual Life Outcomes. 2017;15(1):29. doi:10.1186/s12955-017-0604-1
33. George SZ, Li C, Luo S, Horn ME, Lentz TA. Longitudinal monitoring of pain associated distress with the optimal screening for prediction of referral and outcome yellow flag (OSPRO-YF) tool: predicting reduction pain intensity and disability. Arch Phys Med Rehabil. 2020;101(10):1763–1770. doi:10.1016/j.apmr.2020.05.025
34. Display and analyze ROC curves [R package pROC version 1.17.0.1]. 2021. Available from: https://cran.r-project.org/web/packages/pROC/index.html.
35. Lemeshow S, Hosmer DW. Logistic regression. Wiley Encyclopedia Clin Trials. 2007. doi:10.1002/9780471462422.eoct964
36. Mandrekar JN. Receiver operating characteristic curve in diagnostic test assessment. J Thorac Oncol. 2010;5(9):1315–1316. doi:10.1097/JTO.0b013e3181ec173d
37. George SZ, Lentz TA, Beneciuk JM, Bhavsar NA, Mundt JM, Boissoneault J. Framework for improving outcome prediction for acute to chronic low back pain transitions. Pain Rep. 2020;5(2):e809. doi:10.1097/PR9.0000000000000809
38. Keefe FJ, Main CJ, George SZ. Advancing psychologically informed practice for patients with persistent musculoskeletal pain: promise, pitfalls, and solutions. Phys Ther. 2018;98(5):398–407. doi:10.1093/ptj/pzy024
39. Kongsted A, Andersen CH, Hansen MM, Hestbaek L. Prediction of outcome in patients with low back pain–A prospective cohort study comparing clinicians’ predictions with those of the Start Back Tool. Man Ther. 2016;21:120–127. doi:10.1016/j.math.2015.06.008
40. Sandborgh M, Lindberg P, Denison E. Pain belief screening instrument: development and preliminary validation of a screening instrument for disabling persistent pain. J Rehabil Med. 2007;39(6):461–466. doi:10.2340/16501977-0072
 © 2021 The Author(s). This work is published and licensed by Dove Medical Press Limited. The full terms of this license are available at https://www.dovepress.com/terms.php and incorporate the Creative Commons Attribution - Non Commercial (unported, v3.0) License.
By accessing the work you hereby accept the Terms. Non-commercial uses of the work are permitted without any further permission from Dove Medical Press Limited, provided the work is properly attributed. For permission for commercial use of this work, please see paragraphs 4.2 and 5 of our Terms.
© 2021 The Author(s). This work is published and licensed by Dove Medical Press Limited. The full terms of this license are available at https://www.dovepress.com/terms.php and incorporate the Creative Commons Attribution - Non Commercial (unported, v3.0) License.
By accessing the work you hereby accept the Terms. Non-commercial uses of the work are permitted without any further permission from Dove Medical Press Limited, provided the work is properly attributed. For permission for commercial use of this work, please see paragraphs 4.2 and 5 of our Terms.