")
Back to Journals » International Journal of General Medicine » Volume 14
Derivation and Validation of a Risk Score to Predict Mortality of Early Neonates at Neonatal Intensive Care Unit: The END in NICU Score
Authors Belsti Y , Nigussie ZM , Tsegaye GW
Received 24 September 2021
Accepted for publication 2 November 2021
Published 12 November 2021 Volume 2021:14 Pages 8121—8134
DOI https://doi.org/10.2147/IJGM.S336888
Checked for plagiarism Yes
Review by Single anonymous peer review
Peer reviewer comments 2
Editor who approved publication: Dr Scott Fraser
Yitayeh Belsti,1 Zelalem Mehari Nigussie,2 Gebeyaw Wudie Tsegaye2
1Department of Physiology, School of Medicine, College of Medicine and Health Science, University of Gondar, Gondar, Ethiopia; 2Department of Epidemiology and Biostatistics, School of Public Health, College of Medicine and Health Science, Bahir Dar University, Bahir Dar, Ethiopia
Correspondence: Yitayeh Belsti
Department of Physiology, School of Medicine, College of Medicine and Health Science, University of Gondar, Gondar, Ethiopia
Email [email protected]
Background: Early neonatal death is death of infants in the first week of life. And 34% to 92% of neonatal deaths happen within 7 days of postnatal period. Thus, the early neonatal period is the most critical time for an infant, requiring different strategies to prevent mortality. Among strategies, deriving and implementing early warning scores is crucial to predict early neonatal mortality earlier upon hospital admission.
Objective: To derive and validate a risk score to predict mortality of early neonates at Felege Hiwot Specialized Hospital neonatal intensive care unit, Bahir Dar, 2021.
Methods: The document review was conducted from February 24, to April 08, 2021, on all early neonates admitted to neonatal intensive care unit from January 1, 2018 to December 31, 2020. The total number of early neonates included in the derivation study was 1100. Data were collected by using checklists prepared on EpiCollect5 software. After exporting the data to R version 4.0.5 software, variables with (p < 0.25) from the simple binary regression were entered into a multiple logistic regression model, and significant variables (p < 0.05) were kept in the model. The discrimination and calibration were assessed. The model was internally validated using bootstrapping technique.
Results: Admission weight, birth Apgar score, perinatal asphyxia, respiratory distress syndrome, mode of delivery, sepsis, and gestational age at birth remained in the final multiple logistic regression prediction model. The area under curve of receiver operating characteristic curve for early neonatal mortality score was 90.7%. The model retained excellent discrimination under internal validation. The sensitivity, specificity, and positive predictive value, negative predictive value of the model was 89.4%, 82.5%, 55.5%, and 96.9%, respectively.
Conclusion: The derived score has an excellent discriminative ability and good prediction performance. This is an important tool for predicting early neonatal mortality in neonatal intensive care units at admission.
Keywords: derivation, validation, risk score, early neonatal mortality, NICU, Ethiopia
Background
World Health Organization (WHO) defined neonatal death as “deaths among live births during the first 28 completed days of life”.1 It can be further subdivided into deaths between 0 and 7 completed days of birth (early neonatal deaths) and deaths after 7 days to 28 completed days of birth (late neonatal deaths).2 Grouping of a child’s lifetime into well-defined ages has become a vital standardization to determine the care and interventions necessary to increase the chances of child survival. The neonatal age which is globally accepted as beginning at birth and ending at 28 completed days of life1 is recognized as the most susceptible time in an infant’s life.
Early neonatal death (END) is affected by maternal factors, neonatal-related factors, maternal health services, and obstetrics-related factors. It can be caused by obstetric causes during pregnancy, labor, or delivery and also by neonatal causes, commonly immaturity related, perinatal hypoxia, Infection, congenital abnormalities. Less common causes include birth trauma, hemorrhagic disease of the newborn, Rhesus disease, and sudden infant death syndrome (cot death).3–6 Among these, prematurity, asphyxia, infections, congenital abnormalities, and other causes are the four preventable causes of early neonatal mortality.7–10
In 2018, the neonatal mortality rate was estimated as 18 deaths per 1000 live births globally. About half (47%) of the under-five deaths occurred in the neonatal period (2.5 million), of which 34–92% of neonatal death happen within 7 days of the postnatal period showing significant variation across different regions and countries,10–23 46–62% of neonatal mortality happens within 3 days of postnatal life,15,18,24,25 and 11.4–58.6% of neonatal death occurs within 24 hours of birth.11–13,26–28 Therefore, the first 7 days are the most critical period of a neonate’s life,29 which warrants close observation.
The majority of these newborn deaths occurred in low- and middle-income countries.30–32 South Asia and sub-Saharan Africa (SSA) account for 79% of the total burden of neonatal deaths.32 Sub-Saharan Africa has the highest burden of neonatal mortality with one death in every 38 newborns before the age of 1 month.33 Sub-Saharan Africa had the highest neonatal mortality rate in 2018 at 28 deaths per 1000 live births, followed by Central and Southern Asia with 25 deaths per 1000 live births. The risk of dying for a newborn in sub-Saharan Africa is about 33 times higher than in the lowest mortality country.8 Tanzania, Ethiopia, and Nigeria are the countries with the highest neonatal mortality rate in SSA.33,34 Thus, the early neonatal period is among the major public health challenges in low- and middle-income countries3,5–7 and the most critical time for an infant.8
Strategies have been implemented with given emphasis on the packages of care provided at the prenatal, antenatal, intra-natal, and post-natal periods to reduce early neonatal mortality. As a result, though it is not satisfactory as under-five and neonatal mortality, little improvement is there to reduce early neonatal mortality. Ethiopia has implemented different strategies targeting at reduction of neonatal mortality through governmental and non-governmental organizations. However, it has among the highest neonatal mortality rates of any country, even when compared to the regional average for Africa.35 In 2019, the neonatal mortality rate for Ethiopia was 27.6 deaths per 1000 live births.
Among strategies that have been implemented to address the global burden of neonatal mortality, one strategy is to improve the early identification of patients at risk of dying, by deriving and implementing early warning scores in hospitals.36 Early warning scores in neonatal intensive care unit (NICU) assign a number to maternal and neonatal parameters to derive a composite score that identifies patients who need additional interventions and monitoring. Implementation of evidence-based practices would decrease early neonatal deaths both in high-income countries and in low- and middle-income countries (LMICs).37
Studies have demonstrated the usefulness of early warning scores in adult and pediatric patient populations.38–40 Among available scores, the Apgar score provides an accepted and convenient method for reporting the status of the newborn infant immediately after birth and the response to resuscitation if needed. However, the Apgar score alone does not predict individual neonatal mortality or neurologic outcome, and should not be used for that purpose.41
The assessment of the severity of illness is very important to determine prognosis, including predicting mortality in neonates hospitalized in neonatal intensive care unit.42 Mortality risk and illness severity measurement in newborns admitted to NICUs is gaining increasing attention. In 1993 three scores were developed for measuring illness severity and neonatal mortality among infants admitted to NICUs: CRIB (Clinical Risk Index for Babies),43,44 SNAP (Score for Neonatal Acute Physiology),45 and SNAP-PE (Score for Neonatal Acute Physiology - Perinatal Extension).45 The SNAP score is developed based on 34 variables, assessed during the first 24 hours after admission; SNAP-PE adds to SNAP birth weight, small size for gestational age (SSGA), and low Apgar score at 5 minutes after delivery. The CRIB score evaluates six factors during the first 12 hours of life but is appropriate only for newborns with gestational age 31 weeks or less and/or birth weight up to 1500 gm.
Although the above and other prognostic scores have been implemented in neonates,44,46–50 all include laboratory tests that are not available in low-resource settings, include ventilator support metrics, and require trained providers for scoring, and does not consider maternal factors as a prognostic indicator. Derivation of a simple, easily applicable score for LMICs would allow over-burdened health care personnel to rapidly identify at-risk neonates. However, there are no validated early neonatal mortality prediction tools for low- and middle-income countries (LMICs) like Ethiopia. Therefore, by considering the above limitations this study aimed to derive and validate a risk score that provides clues for screening high-risk early neonates at admission to NICU using easily measurable and accessible maternal and neonatal variables to estimate, forecast, and predict early neonatal death.
A convenient and easily applicable prognosis is a very crucial tool to predict early neonatal mortality earlier upon admission. Therefore, the END NICU score that was derived can be used by clinicians (especially, pediatricians, pediatric residents, neonatal nurses, and neonatologists) and public health professionals working on maternal and child health unit to predict early neonatal mortality earlier at admission using easily measurable and accessible maternal neonatal variables. END in NICU score will also inform early neonatal parents about the future course of their neonate (or their risk of deriving early neonatal death) and guide doctors and neonatal parents in joint decisions on further treatment.
Methods
Study Design/Setting/Area/Period
This risk score was derived and validated from a retrospective cohort document review at Felege Hiwot Specialized Hospital in Bahir Dar, Ethiopia, from February 24 to April 08, 2021.
Variables of the Study
Dependent Variable (Outcome Variable)
Early neonatal death (Yes/No).
Prognostic Determinants (Independent Variables)
Neonatal-Related Factors
Temperature, respiratory rate, heart rate, birth size, birth asphyxia, prematurity, congenital anomaly, initiation breastfeeding,neonatal sepsis (infection), respirators distress syndrome, Jaundice.
Maternal and Obstetrics Factors
Parity, number of ANC visits, tetanus toxoid vaccine, place of delivery, mode of delivery, onset of labor, PNC, maternal comorbidity (HIV, HTN, DM).
Socio Economic and Demographic Variables
Mother’s age at birth, place of residence, neonatal age, neonatal sex.
Operational Definitions
Early neonates: early neonates are neonates whose age are within 7 completed days of birth and late neonates are neonates whose age are between 7 days and 28 completed days of birth.
Sample Size Determination and Sampling Techniques
Sample Size Determination
There are no direct methods for sample size calculation for prognostic studies. Various studies have suggested that for each candidate predictor studied at least 10 events are required.51–55 Additionally, no prior estimates were available to calculate the sample size for the derivation study. Hence, as the rule of thumb of at least 10 events per candidate variable for logistic regression prediction models was used to estimate the sample size55–58 in line with by Hosmer and Lemeshow recommendation.59 Since there are 23 candidate prognostic determinants considered, by taking 10 events per predictor parameter, the estimated number of outcome events for the derivation study becomes 230. Taking into account that early neonatal death itself happens in 21% of early neonates in NICU60 an initial model of 23 independent variables would require a minimum of 1095 early neonates admitted in NICU to get estimated events (230) (early neonatal death). Therefore, the required final sample size for the derivation dataset was 1095.
Sampling Techniques
All early neonates fulfilling the inclusion criteria were recruited from the NICU registry for derivation datasets. It includes all early neonates admitted from January 1, 2018, to December 31, 2020.
Data Extraction Procedure
Data were collected using structured checklists prepared from studies that have been conducted on related topics.13,22,61–63 The checklist consists of socio-demographic information, maternal or obstetrics, and neonatal risk factors of early neonatal deaths. All required variables were entered on the EpiCollect5 form builder. EpiCollect5 software platform was used to extract data for this study.
Infant records and registers were requested and reviewed for data including gestational age at birth, sex, birth weight, and complications during the first hospitalization of life, and early neonatal outcome at discharge. Maternal records and registers were requested and reviewed for demographic data, medical and obstetrical histories, and course of pregnancy and delivery.
Four data collectors and two supervisors were participated in the data collection. Before the actual data collection, training was given for data collectors and supervisors for 1 day about data collection and recording. Data were collected using a data extraction form prepared to extract the necessary information for the study based on the World Health Organization (WHO) standard neonatal and maternal register.
Data Quality Control
To ensure data quality, training was given to all data collectors before data collection. The investigators and assigned supervisors have supervised the overall activities of data extraction, and 5% of the data collected were randomly selected and checked with the neonatal register by the principal investigator. Tool Validity was checked by doing a pretest on 110 early neonates at the University of Gondar Hospital (out of the study area). Modification of the tool (the order and content of questionnaires) was made based on the pre-test result. To confirm the questions are internally and externally consistent, we validated by Cronbach’s Alpha test and pilot testing. We did Cronbach’s Alpha test for all questions, and the result was greater than 0.7, indicating excellent internal consistency in the responses.
Data Processing and Analysis
Data Exporting and Cleaning
The data were exported to R version 4.0.5 software for analysis. Data were checked for missing values. Multi-collinearity between each predictor was assessed and if strongly correlated (VIF > 10) the variable most strongly associated with the outcome measure, or the measure that is easiest to measure was selected.64 Descriptive statistics including mean, standard deviations (SD), median, interquartile range (IQR), percentages, and rates were conducted. Then, results were presented in tables and graphs as necessary.
Missing Data Handling
Variables were admission weight 69(6.3%); age of mother 67(6.1%); gravidity 66(6.0%); parity 65(5.9%) RR 61(5.5%); gestational age 59(5.4%); birth APGAR score 57(5.2%); birth weight 55 (5.0%); heart rate 50(4.5%); temperature 47(4.3%); neonatal age at admission 42(3.8%); place of delivery 16(1.5%) missing values. Missing data pattern was assessed and we assumed data were missing at random, and we, therefore, implemented a multiple imputations by creating up to 10 imputed datasets via chained equations65 was considered.55 However, since maternal TT vaccination status and number of ANC attended had more than 30% of missing values, we excluded from imputation and further consideration.
Derivation of Score
Variable Selection
To select variables for the final model, the statistical method p-value of <0.25 from simple logistic regression, the correlation between each predictor variable, ease of interpretation, their strength of association with the outcome variable, and their clinical relevance were used. Statistically, simple logistic regression was conducted on the derivation dataset to investigate the relationship between each predictor and early neonatal mortality in NICU. Variables with p < 0.25 from the simple binary logistic regression were selected.
Based on the above procedures, eight predictors were selected for the final model, which includes age of mother, admission weight, birth APGAR score, perinatal asphyxia, respiratory distress syndrome, mode of delivery, sepsis, and gestational age.
Building the Model
All selected variables from simple logistic regression and other criteria mentioned above were firstly entered at the same time into a model. Subsequently, the variables with the highest p-values were removed. Then, the model was run. This step was repeated until all variables were left with a p-value smaller than 0.05.66 Among eligible models, those that best fulfilled the following characteristics were chosen: suitable calibration (Hosmer–Lemeshow), area under the ROC curve (AUC of ROC), parsimony (small number of explanatory variables), ease of interpretation, and clinical plausibility. Therefore, based on the above criteria, the model with the following variables: admission weight, birth APGAR score, perinatal asphyxia, respiratory distress syndrome, mode of delivery, sepsis, and gestational age were selected. Using the results, a prediction model was developed, and equation for the prediction model was obtained (Table 1).
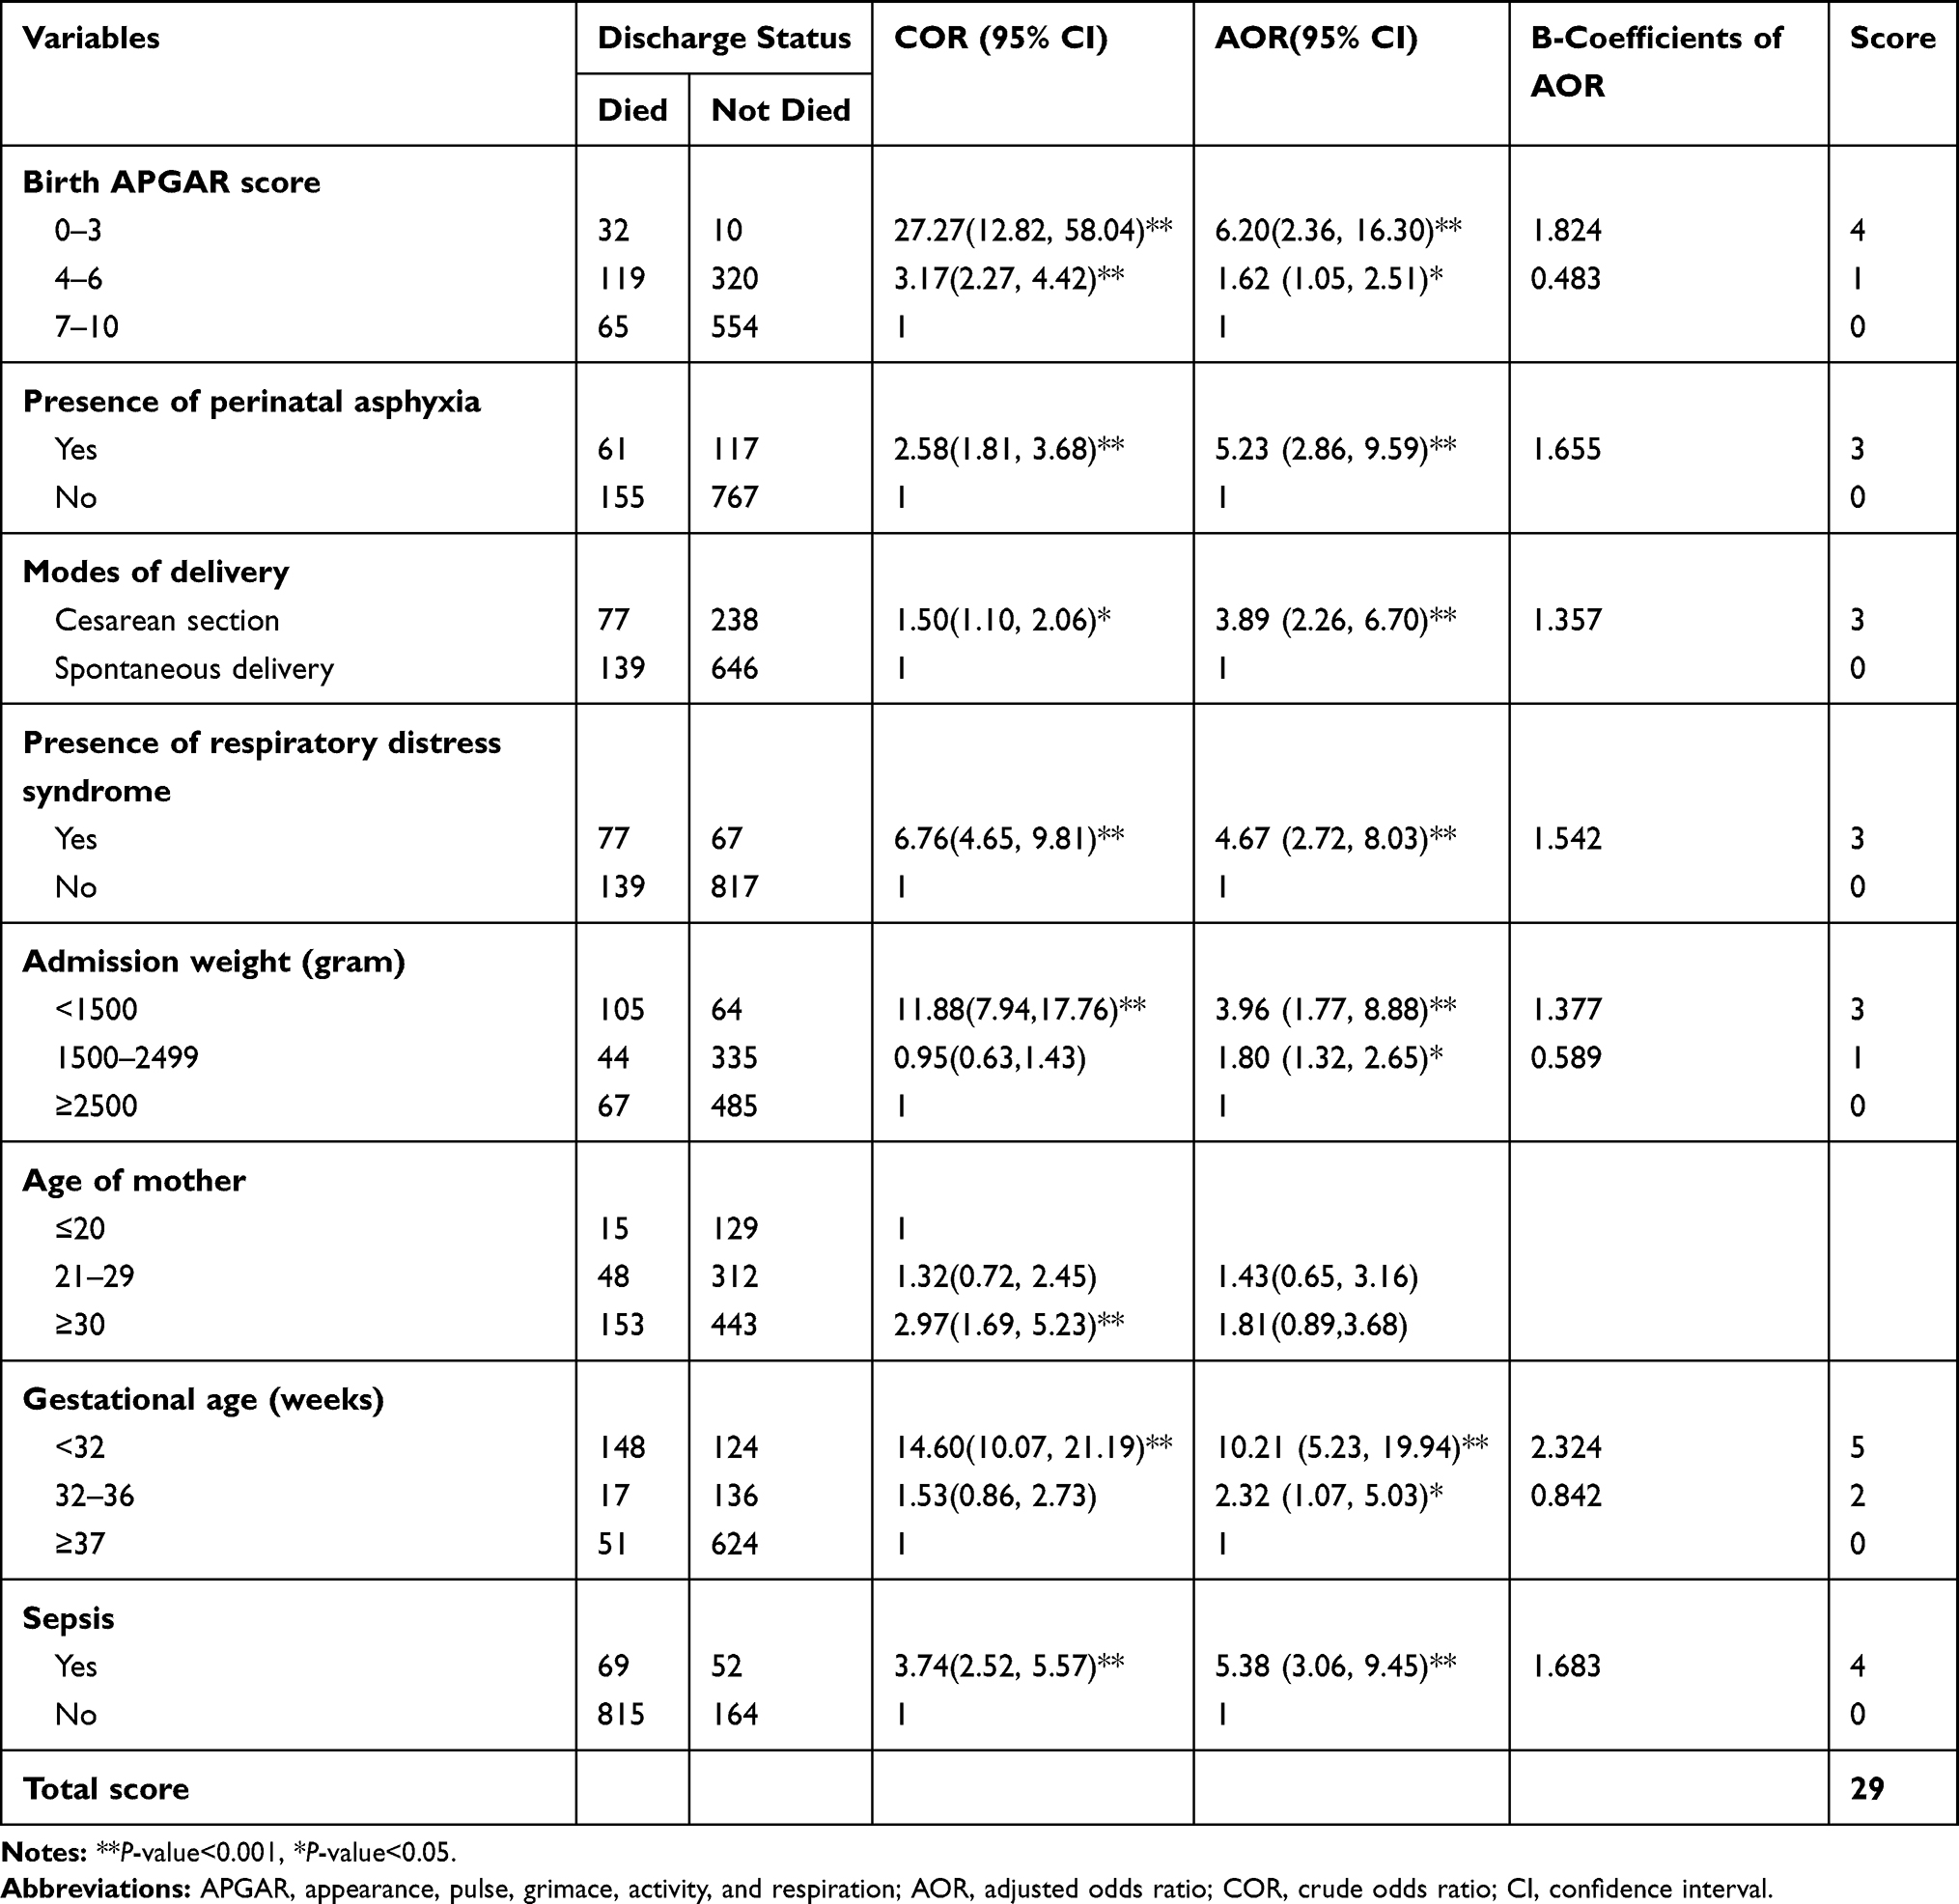 |
Table 1 Simple and Multiple Binary Logistic Regression Between Predictor Variables and Discharge Status for Derivation and Validation of a Risk Score of Early Neonatal Death Among Early Neonates in Neonatal Intensive Care Unit, 2021 |
The Performance of the Prognostic Score
Once a prognostic model is derived, the model was investigated how well it works, how well the model does predicts early neonatal death in NICU.
Calibration
In a calibration plot, groups of predicted probabilities of the outcome were plotted against groups of observed probabilities. Calibration can be used to assess how well the observed probability of the early neonatal death in NICU agrees with the probability predicted by the model. Accordingly, the calibration plot of the END in NICU showed that it has good calibration (Figure 4). The Hosmer–Lemeshow goodness-of-fit test was 0.56 indicating that there is no difference between predicted and observed values.
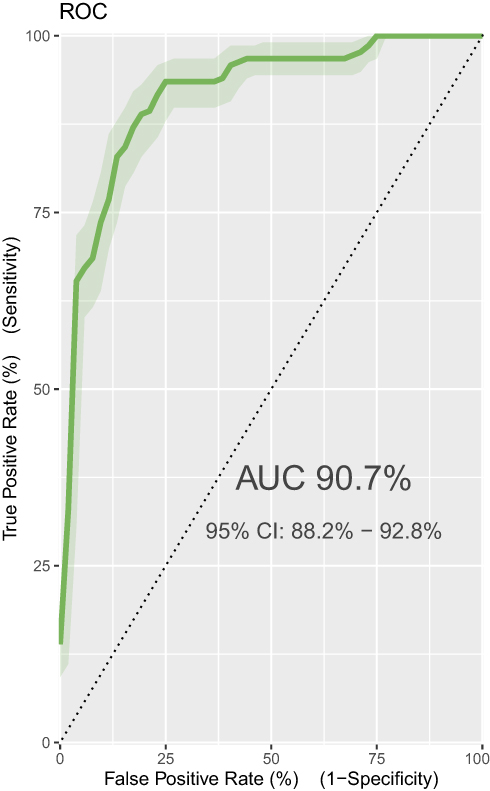 |
Figure 1 The receiver operating curves with the area under the curve of the derivation datasets of the final multiple logistic regression model. (The solid green color shows the area under the curve with surrounding 95% CI. While the dotted line at the middle (a ROC curve close to the y = x or 45-degree line) is an reference line for poor model with no predictive). |
Discrimination
The discriminatory power of the model was assessed by AUC of ROC curve plotting sensitivity against 1-specificity of the model (Figure 1).
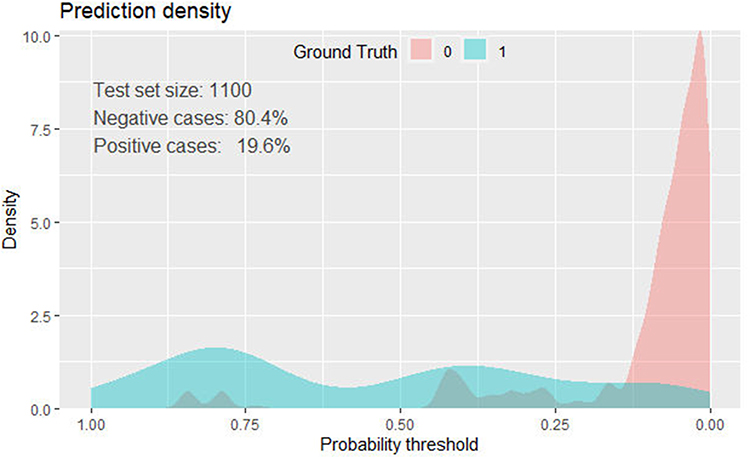 |
Figure 2 The density plots of the derivation datasets of the final multivariate model. (The red one represents early neonates who are at low risk of death and the blue one those who are at high risk of death). |
Creating a Prediction Rule
The regression coefficients were transformed into risk scores to facilitate the use of the prediction rule in practice. To create a clinically useful and accurate Early Neonatal Death Score (END in NICU score), the regression coefficients from the final multiple logistic regression model were used to assign integers to each variable. A frequently used method for this is to divide the regression coefficients by the lowest value. A risk score containing these scores can then be generated to allow the probability of an outcome to be easily calculated for a given individual. The Transparent Reporting of a Multivariable Prediction Model for Individual Prognosis or Diagnosis checklist was followed.67
Internal Validation of the Score
The same dataset used for model derivation was used for internal validation by bootstrapping technique to adjust for optimism. Beta coefficients of logistic regression model, AUC of ROC curve, sensitivity, specificity, positive predictive value, negative predictive value of the model after bootstrapping was compared with the original result before bootstrapping techniques. Then, the level of optimism was assessed.
Results
Result of Descriptive Analyses
The derivation dataset includes 1100 early neonates, of which 617 were males. About 20 (19.6%) neonates aging less than 7 days admitted died in NICU. Half of all admitted neonate’s weight was below 2500gram. Two hundred seventy-two (24.7%) were born before 32 gestational weeks. Cesarean section was used to deliver 28.6% of admitted neonates. The APGAR score of 56.3% of neonates aging less than 7 days was greater than 7. Prematurity and low birth weight were present in 425(38.6%), and 539 (49.0%) of admitted neonates aging less than 7 days respectively. The respective figures for sepsis, RDS, perinatal asphyxia, and congenital malformation were 121(11.0%), 144(13.1%), 178(16.2%), and 37(3.4%) (Table 2).
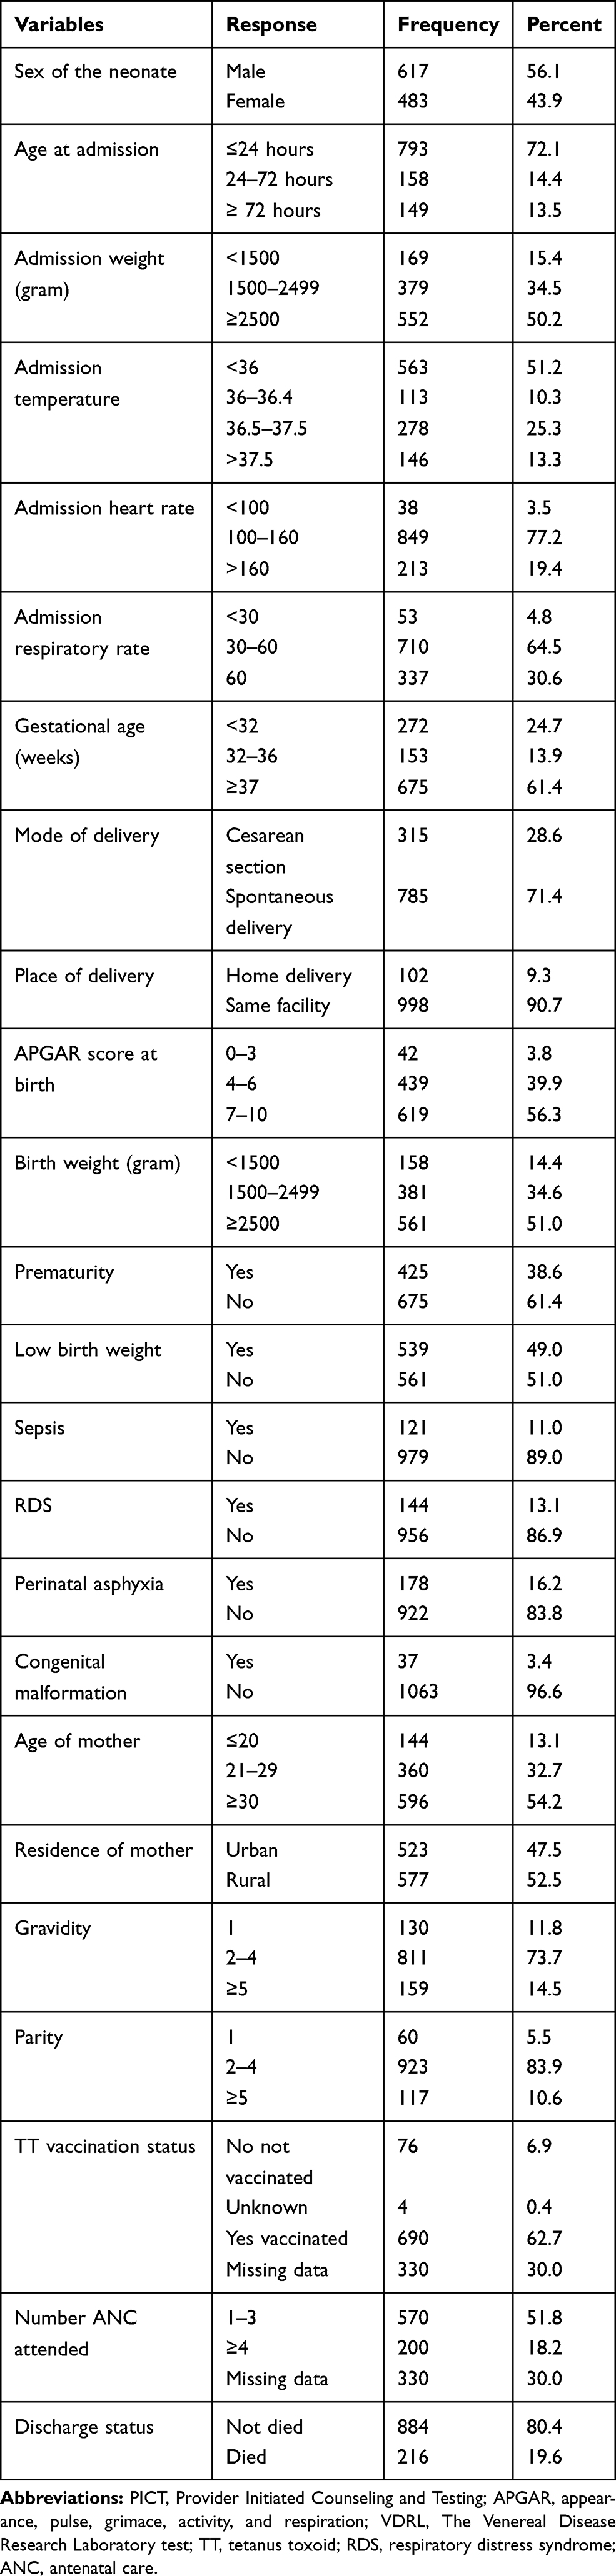 |
Table 2 Baseline Characteristics of Study Participants for Derivation and Validation of a Risk Score of Early Neonatal Death Among Early Neonates in Neonatal Intensive Care Unit 2021 (N= 1100) |
Regression Results and Risk Score
From those variables with p-value<0.25, eight variables were selected for the final model after passing several reduction processes and reiteration process based on a correlation between each predictor variables, ease of interpretation, their strength of association with the outcome variable, and their clinical relevance, which includes age of mother, admission weight, birth APGAR score, perinatal asphyxia, respiratory distress syndrome, mode of delivery, sepsis, and gestational age. The risk score was generated by dividing the regression coefficients by the lowest value and rounding to the nearest integer. Accordingly, the total risk score becomes 29 (Table 1).
Based on Youden Index method, the cutoff point of predicted probabilities was 0.1363. Based on maximizing efficiency method (MaxEfficiency), it was 0.4192, and based on maximizing specificity (MaxSp), it was 0.8560. Based on different methods applied, the cutoff point might vary.
However, we selected the cutoff point of 0.1363, which was based on Youden Index method. The sensitivity of the model was 89.4% and the specificity of the model was 82.5%. The model also has the positive predictive value of 55.5% and negative predictive value of 96.9%. The positive and negative likelihood ratios of the model were also 5.10 and 0.13, respectively. The accuracy was 88.4%.
Similarly, the cutoff point was made for the risk score derived from beta coefficients. Based on the maximum efficiency, the risk score developed from beta coefficients was stratified as low-risk score (<7 score), high-risk score (≥7 score). The risk score has comparable discrimination ability with the model having AUC 0.91(0.89, 0.93). The derived score also has the following comparative measures with original beta coefficients. Sensitivity = 87.5% specificity = 83.6%, positive likelihood ratio = 5.33, negative likelihood ratio = 0.15 Negative predictive value 96.5%, positive predictive value 56.6%. The accuracy of the score was 84.4%.
Performance Measures
Decision Curve of the Model
Figure 3 shows that the model (apparent curve) has the highest net benefit across the entire range of threshold probabilities, which clearly indicates that the model has the highest clinical and public health value.
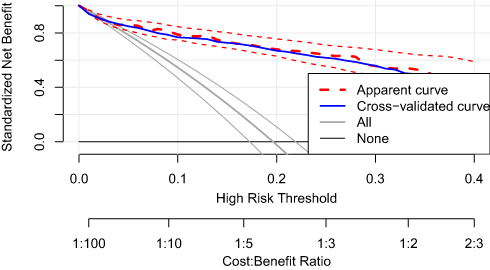 |
Figure 3 Decision curve for a model to predict early neonatal death in early neonates admitted to neonatal intensive care unit. (The apparent curve model (red broken line in the middle) show a curve with variables in the final model; red small broken line in two sides show 95% CI of the apparent curve; Blue line show the cross validated model. Black horizontal line at the bottom is null model without independent variables. While three black line falling from left to right show all model). |
Hence, decision made using the model has a higher net benefit than not using at all regardless of their risk threshold to predict early neonatal death in NICU upon admission (Figure 3).
Calibration Curve
The calibration plot shows the predicted probabilities in X-axis against the observed probabilities in Y-axis. If our model is perfect in calibration it should be in 45-degree line meaning predicted and observed probabilities should be the same. When we look at our model calibration confidence interval, it is good throughout the probabilities. The p-value is 0.138, which is less than 0.05, showing that the predicted probabilities and the observed probabilities are the same null hypothesis is correct. Therefore, the model is well calibrated (Figure 4).
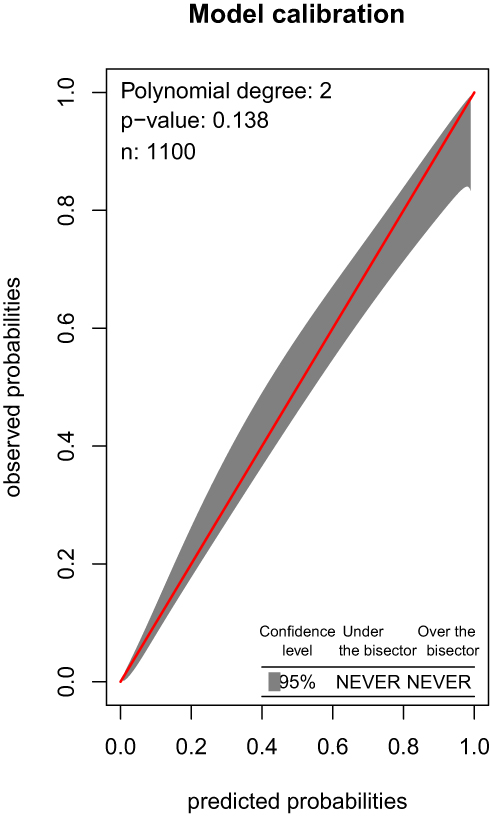 |
Figure 4 Calibration plots of derivation datasets. Calibration plots demonstrating observed versus predicted probability of early neonatal intensive care unit mortality in the derivation dataset from the multiple regression models. (Red line show the calibration of predicted versus the observed probabilities; black area around the red show the 95% CI of the calibration). |
Receiver Operating Curves
The receiver operating characteristic curve shows that the AUC of this model is 90.7% (95% CI: 88.2–92.9%) showing that it is a strong performing model or has excellent discriminatory power. Powerful models have ROC curves that approach the upper left corner, which indicates that the model achieves the maximum of 100% sensitivity and 100% specificity simultaneously. Conversely, a poor model with no predictive value will have a ROC curve close to the y = x or 45-degree line. It shows the probability that the model will give a higher predicted probability to a randomly chosen positive patient than a randomly chosen negative patient (Figure 1).
Density Plot
As shown in the graph, the total sample size is 1100, early neonatal death (positive cases) are 19.6%. The red one represents early neonates who are at low risk of death and the blue one those who are at high risk of death. As we can see, there is some overlap indicating that the model is not 100% perfect (Figure 2).
Internal Validation
Internal validation of the model was conducted on the derivation dataset using bootstrap sampling. Bias-corrected mean, 95% CIs of the receiver operating curve, sensitivity, and specificity were calculated by bootstrapping 2000 samples with replacement. Therefore, after bootstrap internal validation, optimism corrected AUC was 0.904 with 95% CI (0 0.87, 0.92). Model optimism was estimated as 0.003 indicating minimal overfitting of the model to the data. The bootstrap sampling also have 80.5%, 86.6%, 53.2%, 97.4% specificity, sensitivity PPV, and NPV, respectively. The positive and negative likelihood ratio was 4.44 and 0.17, respectively. The bootstrapped sample also has an accuracy of 88.4%. Beta coefficients are also almost similar with minimal variation.
Discussion
This study has derived a predictive model for predicting early neonatal mortality in early neonates who were admitted to neonatal intensive care units that suggests an excellent predictive ability in the derivation cohort AUC: 0.907 (95% CI: 88.2–92.9%). The score was named as END in NICU score, which is a simple tool for a clinical decision that uses seven easily accessible variables for predicting early neonatal mortality just upon admission to neonatal intensive care unit. The developed END in NICU score has excellent discrimination and calibration on the developed dataset. Accordingly, the study identified admission weight, birth Apgar score, perinatal asphyxia, and respiratory distress syndrome, mode of delivery, sepsis, and gestational age during birth as a predictor of mortality just at admission. By using these variables a prediction score was developed and a score for the prediction model was obtained. None of the suggested models put forward so far has revealed such a suitable predictive ability and did not consider maternal factors specifically for early neonates, which are the highest risky period in neonatal age.
No tool was developed to predict specifically early neonatal mortality in NICU. However, there are tools developed to predict the mortality of neonates in NICU in general. In 1989 and 1990 SNAP model was developed based on 28 objective physiologic measurements that occur within the first 24 hours after admission (eg, blood gas pH, mean arterial pressure).45 Later on, SNAP-PE includes the physiologic variables of SNAP and adds birth weight, 5-minute Apgar score, and gestational age.49 However, it needs intensive data collection. In 1993 CRIB was developed which is based on 6 variables less intensive to collect collected within the first 12 hours after birth but still based on physiologic parameters measured laboratory-based.44 The CRIB II was published in 2003 by Parry et al 14 to update the original CRIB.48 Updated SNAP II and SNAP-PE II highly predictive of neonatal mortality and were published in 2001. However, all above mentioned include a laboratory test that is not available in low-resource settings, include ventilator support metrics, and require trained providers for scoring and does not consider maternal factors as a prognostic indicator. The development of such easily applicable scores for LMICs would allow overburdened health care personnel to rapidly identify at-risk neonates. Therefore, this END in NICU score would be used to fulfill this gap for low- and middle-income countries.
There was also an attempt made to develop a tool to predict neonatal mortality in NICU in Ethiopia.62 It was named as neonatal mortality score, which was based on four prognostic determinants. In line with this finding, the study included respiratory distress and gestational age as prognostic determinants of neonatal mortality. The study also included birth weight as prognostic factors, though it was excluded from the final analysis in our study because it correlates with admission weight. Therefore, in our study admission weight was found to be a risk indicator. The discriminatory performance of END in NICU score is higher than that of neonatal mortality score that is 0.88. Even the sensitivity and specificity of END in NICU is more performing than that of neonatal mortality score. This difference might be due to sample size variation, overall approach and design.
Most scores developed before were physiology-based intensive care unit scores68,69 having an AUC of ROC between 0.80 and 0.90 such us SNAP-II, which is lower than END in NICU score discriminative ability of 90.7%. In addition, these physiologic-based scores need intensive training, specialized professionals, and high cost to collect data, which minimizes the utility of the scores. In SNAPE-II,49 however, an attempt was made to include many perinatal risk factors such as gestational age, birth weight, sex, white race, multiple births, and size for gestational age, and Apgar scores as determinants in addition to physiologic factors in SNAP-II. Finally, the model includes birth weight, Apgar score, and gestational age as prognostic determinants of neonatal mortality, which is similar to END in NICU score, though it is still less applicable, cumbersome and expensive to be applied in resource limited countries.
The derived END in NICU score can easily be applied in resource-limited countries like Ethiopia, since it was derived from easily accessible maternal and neonatal variables by health professionals. When we look at some variables included in the model, admission weight was the first. Admission weight might be the best over birth weight in less developed countries where home delivery is still a headache for health service system utilization and difficult to get birth weight. Most studies were developed considering birth weight.49
The score which is converted to an integer will ease easy interpretation and implementation in the neonatal intensive care unit and can result in more similar accuracy with the multiple logistic regression coefficients. Additionally, the study was based on a large sample size and tried to include multiple variables of maternal obstetric characteristics and neonatal characteristics. Additionally, after external validation, the finding can be applicable in NICU of hospitals in Ethiopia.
The Early Neonatal Mortality Score may be utilized by bedside nurses and clinicians in understaffed NICUs in low-resource settings to quickly identify sick neonates needing additional interventions. These results provide an opportunity to improve the identification of neonates at risk of dying, guide triage decisions within and between NICUs, and allow for the appropriate allocation of personnel resources. Furthermore, at-risk neonates identified by the score may benefit from a prioritized bundle of interventions that are part of NICU care.
In LMICs, there are barriers in obtaining supporting laboratory data for all admitted early neonates. The END in NICU Score may lead to a paradigm shift of identifying early neonatal mortality without laboratory evaluation before death. A nurse in our setting will easily be caring for 5–20 patients in any given shift. Therefore, having a score that allows rapid assessment of the neonates to identify the babies at risk of mortality with only seven easily accessible parameters can prove to be an incredible tool at the bedside. Once identified, at-risk neonates can quickly receive the required interventions. Moreover, such a score can also allow for appropriation of limited devices such as a bubble-CPAP to be used only on those patients that require it. The score may help prioritize the early neonates needing limited resources.
Limitations of the Study
The findings have limitations that should be considered while using the study. This study excluded maternal TT vaccination status and number of ANC attended from further analysis because these variables had more than 30% of missing values. These variables might influence early neonatal mortality. Categorizing continuous variables for ease of clinical application might affect its predictive power and accuracy.
Conclusion and Recommendations
Conclusion
This study shows the possibility of predicting early neonatal mortality using a simple prediction model constructed from easily accessible and applicable maternal and neonatal characteristics, including admission weight, birth Apgar score, perinatal asphyxia, and respiratory distress syndrome, mode of delivery, sepsis, and gestational age at birth. The derived END in NICU score has good sensitivity for predicting early neonatal mortality. It has an excellent discriminative ability (accuracy) with the area under the curve of 0.907. This new and relatively simple early neonatal mortality risk score had a good prediction performance in Ethiopia Hospitals having similar setup infrastructure. Therefore, the prediction score will help to do a risk stratification of early neonates and to identify those at higher risk of death at admission. Subsequently, high-risk groups linked to a center, which is equipped with good facilities for further assessment and better management. Hence, this feasible prediction score would offer an opportunity to decrease early neonatal complications and hence improving the overall child health care.
Recommendation
This is an important tool for predicting early neonatal mortality in NICU just at admission. Therefore, this score may prove to be a better model for application in low- and middle-income countries also after external validation. We strongly recommend for researchers validating the prediction tool in another context before introducing it to clinical and public health practices, preferably using real-world data through prospective validation studies.
Abbreviations
ANC, anti-natal care; APGAR, appearance pulse grimace activity respiration; CPAP, continuous positive airway pressure; CRIB, clinical risk index for babies; DM, diabetes mellitus; END, early neonatal death; ETB, Ethiopian birr; HIV, human immune deficiency; HTN, hypertension; KMC, Kangaroo Mother Care; LMICs, low- and middle-income countries; NICU, neonatal intensive care unit; NMR, neonatal mortality rate; NNJ, neonatal jaundice; NPV, negative predictive value; PNC, post natal care; PPV, positive predictive value; ROC, receiver operating curve; SDI, socio-demographic index; SGA, small for gestational age; SNAP, Score for Neonatal Acute Physiology; SNAP-II, Score for Neonatal Acute Physiology; Version II; SNAP-PE, Score for Neonatal Acute Physiology; Perinatal Extension; SNAPPE-II, Score for Neonatal Acute Physiology, Perinatal Extension, Version II; SSA, sub-Saharan Africa.
Data Sharing Statement
The data will be available upon request from the corresponding author.
Ethical Consideration
The study was conducted following the ethical principles set by the declaration of Helsinki. Ethical clearance was obtained from the Institutional Review Board of the Institute of Public Health, Bahir Dar University (letter Reference number/11302/1.4.4 and Protocol number 086/2021) on February 26, 2021. Individual identifiers were removed to maintain the anonymity of patients by assigning a unique number to each questionnaire. All data were collected from the register, which was kept in a secure place and all data were fully anonymized before we access them. After collection of data, all the patient records and patients’ cards were placed back into a secure place. Data were not shared with anybody other than authors for ethical reasons. All data were entered into password-protected computer. Only the investigators had access to the data.
Acknowledgments
We would like to thank the Bahir Dar University for its support. We would also forward our acknowledgement for data collectors, Felege Hiwot Referral Hospital administrations, and NICU health professionals and supporting staffs.
Author Contributions
All authors made a significant contribution to the work reported, whether that is in the conception, study design, execution, acquisition of data, analysis and interpretation, or in all these areas; took part in drafting, revising or critically reviewing the article; gave final approval of the version to be published; have agreed on the journal to which the article has been submitted; and agree to be accountable for all aspects of the work.
Disclosure
The authors report no conflicts of interest in this work.
References
1. Harding EBM, Harrington LT, Lockwood CM, et al. Perinatal and neonatal mortality. Br Med J. 1980;281(6254):1567. doi:10.1136/bmj.281.6254.1567-b
2. UNICEF, WHO, Bank W, Division U-DP. Child Mortality Report 2015 Organizations and Individuals Involved in Generating Country-Specific Estimates of Child Mortality Special Thanks to the Technical Advisory Group of the UN IGME for Providing Technical Guidance on Methods for Child Mortality Es. WHO; 2015.
3. Joint Committee on Reducing Maternal and Neonatal Mortality in Indonesia; Development, Security, and Cooperation; Policy and Global Affairs; National Research Council; Indonesian Academy of Sciences. Reducing Maternal and Neonatal Mortality in Indonesia: Saving Lives, Saving the Future. Washington (DC): National Academies Press (US); 2013. doi:10.17226/18437
4. World Health Organisation (WHO). Making Every Baby Count: Audit and Review of Stillbirths and Neonatal Deaths. WHO Libr Cat Data;2016:144.
5. WHO. The WHO Application of ICD-10 to Deaths During the Perinatal Period: ICD-PM. World Heal Organ;2016:1–88.
6. Pathirana J, Muñoz FM, Abbing-Karahagopian V, et al. Neonatal death: case definition & guidelines for data collection, analysis, and presentation of immunization safety data. Vaccine. 2016;34(49):6027–6037. doi:10.1016/j.vaccine.2016.03.040
7. UNICEF. United Nations Inter-agency Group for Child Mortality Estimation (UN IGME), ‘levels & trends in child mortality: report 2018. Estim dev by United Nations inter-agency gr child mortal estim; 2018:1–44. Available from: https://data.unicef.org/wp-content/uploads/2018/09/UN-IGME-Child-Mortality-Report-2018.pdf.
8. WHO. Child Mortality 2019. Levels Trends Child Mortal; 2019:1–52.
9. Oestergaard MZ, Inoue M, Yoshida S, et al. Neonatal mortality levels for 193 countries in 2009 with trends since 1990: a systematic analysis of progress, projections, and priorities. PLoS Med. 2011;8(8):e1001080. doi:10.1371/journal.pmed.1001080
10. Debelew GT, Afework MF, Yalew AW. Determinants and causes of neonatal mortality in Jimma Zone, Southwest Ethiopia: a multilevel analysis of prospective follow up study. PLoS One. 2014;9(9):e107184.
11. Gizaw M, Molla M, Mekonnen W. Trends and risk factors for neonatal mortality in Butajira District, South Central Ethiopia, (1987–2008): a prospective cohort study. BMC Pregnancy Childbirth. 2014;14(1):1. doi:10.1186/1471-2393-14-64
12. Wardlaw T, You D, Hug L, et al. UNICEF report enormous progress in child survival but greater focus on newborns urgently needed. Health J BioMed Cent. 2014;1–4. Available from: https://reproductive-health-journal.biomedcentral.com/articles/10.1186/1742-4755-11-82. Accessed November 5, 2021.
13. Yismaw AE, Gelagay AA, Sisay MM. Survival and predictors among preterm neonates admitted at University of Gondar comprehensive specialized hospital neonatal intensive care unit, Northwest Ethiopia. Ital J Pediatr. 2019;45(1):1–11. doi:10.1186/s13052-018-0597-3
14. Lahariya C, Paul VK. Burden, differentials, and causes of child deaths in India. Indian J Pediatr. 2010;77(11):1312–1321. doi:10.1007/s12098-010-0185-z
15. Welaga P, Moyer CA, Aborigo R, et al. Why are babies dying in the first month after birth? A 7-year study of neonatal mortality in Northern Ghana. PLoS One. 2013;8(3):e58924. doi:10.1371/journal.pone.0058924
16. Eshete A, Abiy S. When do newborns die? Timing and cause-specific neonatal death in neonatal intensive care unit at referral hospital in Gedeo Zone: a Prospective Cohort Study. Int J Pediatr. 2020;2020:1–8. doi:10.1155/2020/8707652
17. Oza S, Lawn JE, Hogan DR, Mathers C, Cousens SN. Neonatal cause-of-death estimates for the early and late neonatal periods for 194 countries: 2000–2013. Bull World Health Organ. 2015;93(1):19–28. doi:10.2471/BLT.14.139790
18. Sankar MJ, Natarajan CK, Das RR, Agarwal R, Chandrasekaran A, Paul VK. When do newborns die? A systematic review of timing of overall and cause-specific neonatal deaths in developing countries. J Perinatol. 2016;36(S1):S1–S11. doi:10.1038/jp.2016.27
19. Rai SK, Kant S, Srivastava R, et al. Causes of and contributors to infant mortality in a rural community of North India: evidence from verbal and social autopsy. BMJ Open. 2017;7(8):1–10. doi:10.1136/bmjopen-2016-012856
20. Assefa N, Lakew Y, Belay B, et al. Neonatal mortality and causes of death in Kersa Health and Demographic Surveillance System (Kersa HDSS), Ethiopia, 2008–2013. Matern Fetal Neonatal Perinatol. 2016;2(1):1–10. doi:10.1186/s40748-016-0035-8
21. Mengesha HG, Sahle BW. Cause of neonatal deaths in Northern Ethiopia: a prospective cohort study. BMC Public Health. 2017;17(1):1–8. doi:10.1186/s12889-016-3979-8
22. Roro EM, Tumtu MI, Gebre DS, Ameh CA. Predictors, causes, and trends of neonatal mortality at nekemte referral hospital, east Wollega Zone, western Ethiopia (2010–2014). Retrospective cohort study. PLoS One. 2019;14(10):1–13. doi:10.1371/journal.pone.0221513
23. Amadi HO, Kawuwa MB. Reducing early neonatal mortality in Nigeria—the solution. In: Selected Topics in Neonatal Care; 2018.
24. Liu L, Johnson HL, Cousens S, et al. Global, regional, and national causes of child mortality: an updated systematic analysis for 2010 with time trends since 2000. Lancet. 2012;379(9832):2151–2161. doi:10.1016/S0140-6736(12)60560-1
25. Engmann C, Garces A, Jehan I, et al. Causes of community stillbirths and early neonatal deaths in low-income countries using verbal autopsy: an International, Multicenter Study. J Perinatol. 2012;32(8):585–592. doi:10.1038/jp.2011.154
26. Pasha O, Esamai F, Patel A, et al. Neonatal death in low-middle income countries: a Global Network Study. Am J Perinatol. 2015;29(8):649–656.
27. Nga NT, Hoa DTP, Malqvist M, Persson LA, Ewald U. Causes of neonatal death: results from NeoKIP community-based trial in Quang Ninh province, Vietnam. Acta Paediatr Int J Paediatr. 2012;101(4):368–373. doi:10.1111/j.1651-2227.2011.02513.x
28. Al-sheyab N, Khader Y, Shattnawi K, Alyahya M, Batieha A. Neonatal mortality in Jordan: rate, determinants, and causes using Jordan stillbirth and neonatal surveillance system. 2020:1–22.
29. Hadgu FB, Gebretsadik LG, Mihretu HG, Berhe AH. Prevalence and factors associated with neonatal mortality at ayder comprehensive specialized hospital, Northern Ethiopia. A Cross-Sectional Study. Pediatric Health Med Ther. 2020;11:29–37.
30. Child GBD, Collaborators M. Europe PMC funders group global, regional, national, and selected subnational levels of stillbirths, neonatal, infant, and under-5 mortality, 1980 – 2015: a systematic analysis for the Global Burden of Disease Study 2015. Lancet. 2017;388(10053):1725–1774.
31. Cronan JJ, Yoder IC, Amis ES, Pfister RC. The myth of anechoic renal sinus fat. Radiology. 1982;144(1):149–152. doi:10.1148/radiology.144.1.7089246
32. Hug L, Alexander M, You D, Alkema L. National, regional, and global levels and trends in neonatal mortality between 1990 and 2017, with scenario-based projections to 2030: a systematic analysis. Lancet Glob Health. 2019;7(6):e710–e720. doi:10.1016/S2214-109X(19)30163-9
33. Grady SC, Frake AN, Zhang Q, et al. Neonatal mortality in East Africa and West Africa: a geographic analysis of district-level demographic and health survey data. Geospat Health. 2017;12(1). doi:10.4081/gh.2017.501
34. Mangu CD, Rumisha SF, Lyimo EP, et al. Trends, patterns and cause-specific neonatal mortality in Tanzania: a hospital-based retrospective survey. Int Health. 2021;13(4):334–343.
35. Lee AC, Cousens S, Darmstadt GL, et al. Care during labor and birth for the prevention of intrapartum-related neonatal deaths: a systematic review and Delphi estimation of mortality effect. BMC Public Health. 2011;11(SUPPL. 3):1–23.
36. Parshuram CS, Duncan HP, Joffe AR, et al. Multicentre validation of the bedside paediatric early warning system score: a severity of illness score to detect evolving critical illness in hospitalised children. Crit Care. 2011;15(4):R184. doi:10.1186/cc10337
37. Lehtonen L, Gimeno A, Parra-Llorca A, Vento M. Early neonatal death: a challenge worldwide. Semin Fetal Neonatal Med. 2017;22(3):153–160. doi:10.1016/j.siny.2017.02.006
38. Moore CC, Hazard R, Saulters KJ, et al. Derivation and validation of a universal vital assessment (UVA) score: a tool for predicting mortality in adult hospitalised patients in Sub-Saharan Africa. BMJ Glob Health. 2017;2(2):1–12.
39. Lambert V, Matthews A, MacDonell R, Fitzsimons J. Paediatric early warning systems for detecting and responding to clinical deterioration in children: a systematic review. BMJ Open. 2017;7(3):e014497. doi:10.1136/bmjopen-2016-014497
40. Berkley JA, Ross A, Mwangi I, et al. Prognostic indicators of early and late death in children admitted to district hospital in Kenya: cohort study. Br Med J. 2003;326(7385):361–364. doi:10.1136/bmj.326.7385.361
41. Stark AR, Adamkin DH, Batton DG, et al. The apgar score. Pediatrics. 2006;117(4):1444–1447.
42. Thimoty J, Hilmanto D, Yuniati T. Score for Neonatal Acute Physiology Perinatal Extension II (SNAPPE II) as the predictor of neonatal mortality hospitalized in neonatal intensive care unit. Paediatr Indones. 2009;49(3):155–159. doi:10.14238/pi49.3.2009.155-9
43. de Courcy-wheeler RHB, Wolfe CDA, Fitzgerald A, Spencer M, Goodman JDS, Gamsu HR. Use of the CRIB (clinical risk index for babies) score in prediction of neonatal mortality and morbidity. Arch Dis Child Fetal Neonatal Ed. 1995;1:32–36. doi:10.1136/fn.73.1.F32
44. The International Neonatal Network. The CRIB (clinical risk index for babies) score: a tool for assessing initial neonatal risk and comparing performance of neonatal intensive care units. Lancet. 1993;342(8865):193–198. doi:10.1016/0140-6736(93)92296-6
45. Richardson DK, Gray JE, McCormick MC, Workman K, Goldmann DA. Score for Neonatal Acute Physiology: a physiologic severity index for neonatal intensive care. Pediatrics. 1993;91(3):617–623.
46. Mortensen N, Augustsson JH, Ulriksen J, Hinna UT, Schmölzer GM, Solevåg AL. Early warning- and track and trigger systems for newborn infants: a review. J Child Health Care. 2017;21(1):112–120. doi:10.1177/1367493516689166
47. Dorling JS, Field DJ, Manktelow B. Neonatal diseases severity scoring systems. Arch Dis Child Fetal Neonatal Ed. 2005;90(1):11–16. doi:10.1136/adc.2003.048488
48. Parry G, Tucker J, Tarnow-Mordi W. CRIB II: an update of the clinical risk index for babies score. Lancet. 2003;361(9371):1789–1791. doi:10.1016/S0140-6736(03)13397-1
49. Richardson DK, Corcoran JD, Escobar GJ, Lee SK. SNAP-II and SNAPPE-II: simplified newborn illness severity and mortality risk scores. J Pediatr. 2001;138(1):92–100. doi:10.1067/mpd.2001.109608
50. Ahmed M, Phillips I, Karupaih A, Kamireddy H, Manzoor A. Newborn Observation Track and Trigger (NOTT) chart. J Coll Physicians Surg Pak. 2016;26(3):234–237.
51. Harrell FE, Lee KL, Mark DB. Prognostic/clinical prediction models: multivariable prognostic models: issues in developing models, evaluating assumptions and adequacy, and measuring and reducing errors. Tutorials Biostat Stat Methods Clin Stud. 2005;1:223–249.
52. Laupacis A, Sekar N, Stiell G. Clinical Prediction rules a review and suggested modifications of methodological standards background.\p=m-\Clinicalprediction rules are decision-making tools for clinicians, containing variables from the history, physical examination, or simple diagnostic; 1994. Available from: www.jama.com.
53. Concato J, Peduzzi P, Holford TR, Feinstein AR. Importance of events per independent variable in proportional hazards analysis I. Background, goals, and general strategy. J Clin Epidemiol. 1995;48(12):1495–1501. doi:10.1016/0895-4356(95)00510-2
54. Peduzzi P, Concato J, Feinstein AR, Holford TR. Importance of events per independent variable in proportional hazards regression analysis II. J Clin Epidemiol. 1995;48(12):1503–1510. doi:10.1016/0895-4356(95)00048-8
55. Daines L, Bonnett LJ, Boyd A, et al. Protocol for the derivation and validation of a clinical prediction model to support the diagnosis of asthma in children and young people in primary care. Wellcome Open Res. 2020;5:1–15. doi:10.12688/wellcomeopenres.15751.1
56. Collins GS, Reitsma JB, Altman DG, Moons KGM. Transparent Reporting of a Multivariable Prediction Model for Individual Prognosis or Diagnosis (TRIPOD) the TRIPOD statement. Ann Intern Med. 2015;162(1):W1–W73.
57. Pavlou M, Ambler G, Seaman SR, et al. How to develop a more accurate risk prediction model when there are few events. BMJ. 2015;351:h3868.
58. Moons KGM, de Groot JAH, Bouwmeester W, Vergouwe Y, Mallett S. Critical appraisal and data extraction for systematic reviews of prediction modelling studies: the CHARMS checklist. PLoS Med. 2014;11(10):e1001744.
59. Hosmer DW
60. Mengistu BA, Yismaw AE, Azene ZN, Mihret MS. Incidence and predictors of neonatal mortality among neonates admitted in Amhara regional state referral hospitals, Ethiopia: prospective follow up study. BMC Pediatr. 2020;20(1):1–14. doi:10.1186/s12887-020-02031-x
61. Tewabe T, Mehariw Y, Negatie E, Yibeltal B. Neonatal mortality in the case of felege hiwot referral hospital, Bahir Dar, Amhara Regional State, North West Ethiopia 2016: a one year retrospective chart review. Ital J Pediatr. 2018;44(1):1–5. doi:10.1186/s13052-018-0498-5
62. Mediratta RP, Amare AT, Behl R, et al. Derivation and validation of a prognostic score for neonatal mortality in Ethiopia: a case-control study. BMC Pediatr. 2020;20(1):1–11. doi:10.1186/s12887-020-02107-8
63. Worku B, Kassie A, Mekasha A, Tilahun B, Worku A. Predictors of early neonatal mortality at a neonatal intensive care unit of a specialized referral teaching hospital in Ethiopia. Ethiop J Health Dev. 2012;26(3):200–207.
64. Harrell FE. With applications to linear models, logistic regression, and survival analysis (Book section). In: Regression modeling strategies; 2001:106–107.
65. Saxton GD, Oh O, Kishore R. Rules of crowdsourcing: models, issues, and systems of control. Inf Syst Manag. 2013;30(1):2–20. doi:10.1080/10580530.2013.739883
66. Technometrics S, Aug N. American society for quality why stepdown procedures in variable selection author (s): Nathan Mantel American society for quality stable. 2016;12(3):621–625. Linked references are available on JSTOR for this article: why Stepdown P. Available from: http://www.jstor.org/stable/1267207. Accessed November 5, 2021.
67. Moons KGM, Altman DG, Reitsma JB, et al. Transparent reporting of a multivariable prediction model for individual prognosis or diagnosis (TRIPOD): explanation and elaboration. Ann Intern Med. 2015;162(1):W1–W73. doi:10.7326/M14-0698
68. Pollack AA, Pate KAL, Ruttimann UE. The pediatric risk of mortality III Acute physiology score (PRISM III-APS): a method of assessing physiologic instability for pediatric intensive care unit patients. J Pediatr. 1997;131(4):575–581. doi:10.1016/S0022-3476(97)70065-9
69. Pollack MM, Koch MA, Bartel DA, et al. A comparison of neonatal mortality risk prediction models in very low birth weight infants. Pediatrics. 2000;105(5):1051–1057. doi:10.1542/peds.105.5.1051
 © 2021 The Author(s). This work is published and licensed by Dove Medical Press Limited. The full terms of this license are available at https://www.dovepress.com/terms.php and incorporate the Creative Commons Attribution - Non Commercial (unported, v3.0) License.
By accessing the work you hereby accept the Terms. Non-commercial uses of the work are permitted without any further permission from Dove Medical Press Limited, provided the work is properly attributed. For permission for commercial use of this work, please see paragraphs 4.2 and 5 of our Terms.
© 2021 The Author(s). This work is published and licensed by Dove Medical Press Limited. The full terms of this license are available at https://www.dovepress.com/terms.php and incorporate the Creative Commons Attribution - Non Commercial (unported, v3.0) License.
By accessing the work you hereby accept the Terms. Non-commercial uses of the work are permitted without any further permission from Dove Medical Press Limited, provided the work is properly attributed. For permission for commercial use of this work, please see paragraphs 4.2 and 5 of our Terms.