")
Back to Journals » Clinical Interventions in Aging » Volume 11
Density abnormalities in normal-appearing gray matter in the middle-aged brain with white matter hyperintense lesions: a DARTEL-enhanced voxel-based morphometry study
Authors Peng Y, Li S, Zhuang Y, Liu X, Wu L, Gong H, Liu D, Zhou F
Received 15 October 2015
Accepted for publication 31 January 2016
Published 12 May 2016 Volume 2016:11 Pages 615—622
DOI https://doi.org/10.2147/CIA.S98409
Checked for plagiarism Yes
Review by Single anonymous peer review
Peer reviewer comments 3
Editor who approved publication: Dr Zhi-Ying Wu
Yan Peng,1,* Shenhong Li,2,* Ying Zhuang,3,* Xiaojia Liu,4 Lin Wu,2 Honghan Gong,2 Dewu Liu,1 Fuqing Zhou2
1Burn Center, 2Department of Radiology, The First Affiliated Hospital, Nanchang University, 3Department of Oncology, The Second Hospital of Nanchang, Nanchang, Jiangxi Province, 4Department of Orthopaedics and Traumatology, Li Ka Shing Faculty of Medicine, The University of Hong Kong, Pokfulam, Hong Kong, People’s Republic of China
*These authors contributed equally to this work
Background and purpose: Little is known about the structural alterations within gray matter (GM) in middle-aged subjects with white matter hyperintense (WMH) lesions. Here, we aimed to examine the anatomical changes within the GM and their relationship to WMH lesion loads in middle-aged subjects.
Participants and methods: Twenty-three middle-aged subjects with WMH lesions (WMH group) and 23 demographically matched healthy control subjects participated in the study. A Diffeomorphic Anatomical Registration Through Exponentiated Liealgebra-enhanced voxel-based morphometry was used to measure the GM density, and the correlations between WMH lesion volume and extracted GM values in abnormal regions were identified by voxel-based morphometry analysis.
Results: Compared with the healthy control subjects, the WMH group had a significantly decreased GM density in the left middle frontal gyrus, bilateral anterior cingulate cortex, left and right premotor cortex, and left and right middle cingulate cortex and an increased GM density in the bilateral cerebellum anterior lobe, left middle temporal gyrus, right temporoparietal junction, left and right prefrontal cortex (PFC), and left inferior parietal lobule. A relationship was observed between the normalized WMH lesion volume and the decreased GM density, including the left middle frontal gyrus (ρ=-0.629, P=0.002), bilateral anterior cingulate cortex (ρ=-0.507, P=0.019), right middle cingulate cortex (ρ=-0.484, P=0.026), and right premotor cortex (ρ=-0.438, P=0.047). The WMH lesion loads also negatively correlated with increased GM density in the right temporoparietal junction (ρ=-0.484, P=0.026), left PFC (ρ=-0.469, P=0.032), and right PFC (ρ=-0.438, P=0.047).
Conclusion: We observed that lesion load-associated structural plasticity corresponds to bidirectional changes in regional GM density in the WMH group.
Keywords: white matter hyperintense lesion, voxel-based morphometry, normal-appearing gray matter, aging
Introduction
White matter hyperintensities (WMHs) of presumed vascular origin are a common finding in brain T2-weighted imaging (T2WI) and fluid attenuated inversion recovery (FLAIR) imaging in older individuals and in patients with dementia and stroke and can be considered cognitive impairment-related features.1,2 In aging, numerous neuroimaging studies have shown that WMH is associated with neuronal loss, demyelination, and gliosis on neuropathologic examination3 and have been linked to cerebral hypoperfusion4 and reduced WM integrity.5 However, in fact, WMH is not very common in the healthy middle-aged brain. Furthermore, it is unknown whether earlier compromised density abnormalities of normal-appearing gray matter (NAGM) or the underlying pathology responsible for the WMH lesions produces subtle changes in NAGM, which are invisible on conventional magnetic resonance imaging (MRI).
Morphological changes in gray mater have been identified in aging6 and Alzheimer’s disease7 using a Diffeomorphic Anatomical Registration Through Exponentiated Liealgebra (DARTEL)-enhanced voxel-based morphometry (VBM) analysis of high-resolution T1-weighted images (T1WI). DARTEL-enhanced VBM has been demonstrated to provide improved anatomical precision in measuring the relative amount (or “density”) of gray matter (GM).8 The goal of the present study was, thus, to investigate the total GM volume and regional GM density alterations in WMH subjects and compare then to healthy middle-aged brains without WMH. We hypothesized that the density abnormalities in NAGM are influenced by the presence of WMH in middle-aged subjects (WMH group) (the flowchart of analysis shown in Figure 1).
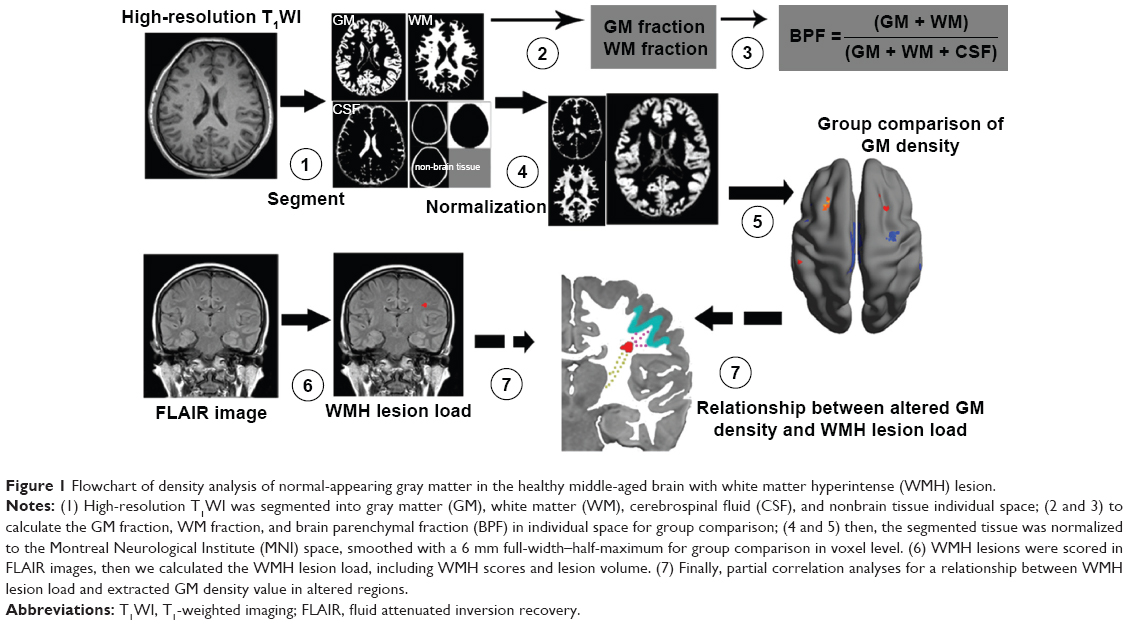 | Figure 1 Flowchart of density analysis of normal-appearing gray matter in the healthy middle-aged brain with white matter hyperintense (WMH) lesion. |
Participants and methods
Subjects
This study was performed according to the approved guidelines of the Medical Research Ethics Committee and the institutional review board of the First Affiliated Hospital of Nanchang University and was conducted in compliance with the principles of the Declaration of Helsinki. Written informed consent was obtained from all subjects in the study.
Participants were randomly recruited based on the presence of a WMH finding in T2WI and FLAIR imaging from August 2012 to July 2014. All participants with WMH were sporadic cases undergoing a health examination at the First Affiliated Hospital of Nanchang University. The inclusion criteria were as follows: 1) age from 45 years to 59 years; 2) predominantly local community individuals who agreed to follow-up with cognitive and other medical tests; and 3) no history of neurologic and laboratory screening. The exclusion criteria were as follows: 1) a probable Alzheimer’s disease diagnosis; 2) history of overt stroke (cortical infarcts), hypertension (systolic >140 mmHg or diastolic >90 mmHg), diabetes, small vessel disease, and the notch-3 mutation in those with suspected cerebral autosomal dominant arteriopathy with subcortical infarcts and leukoencephalopathy (CADASIL) as determined by testing; 3) cognitive irregularities; or 4) unsafe for an MRI scan. All healthy control subjects (HCSs) demographically matched by sex, age, and education level were recruited from the local community and lacked a history of neurological or psychiatric disorders. Finally, 23 middle-aged subjects with WMH (WMH group) and 23 well-matched HCS participants were chosen for the study.
MRI scan protocol
All MRI scans were performed on a 3-TeslaTrio MR imaging scanner system (Trio Tim; Siemens Medical Systems, Erlangen, Germany). Patients received a conventional MRI (including T2WI) for diagnosis and FLAIR imaging for radiological evaluation as well as high-resolution T1WI for DARTEL-enhanced VBM analysis. The main imaging sequences are as follows: 1) Turbo spin echo imaging sequence for T2WI scans: repetition time/echo time =5,100/117 ms, field of view =240×240 mm, matrix =416×416, number of excitations =3, and echo train length =11, 22 axial slices with 6.5 mm thickness; 2) FLAIR imaging: repetition time/echo time/inversion time =7,000/79/2,500 ms, 50 slices, 240×217 matrix, 0.43×0.43×2 mm3 voxels, and 3 minutes 42 seconds; and 3) three-dimensional high-resolution T1WI: repetition time/echo time =1,900/2.26 ms, field of view =215×230 mm, matrix =240×256, number of excitations =1, 176 sagittal slices, and 1.0 mm thickness.
Structural image processing
DARTEL-enhanced VBM was analyzed using statistical parametric mapping (SPM8, http://www.fil.ion.ucl.ac.uk/spm) running on Matlab 2014b (Mathworks, Inc., Natick, MA, USA). The preprocessing included the following steps: 1) high-resolution T1WI was realigned and then manually reoriented so that the anterior commissure was positioned at coordinate [0, 0, 0]. 2) Then, nonbrain tissue pixels were removed from the reoriented T1WI, and brain tissues were then segmented into GM, WM, and cerebrospinal fluid (CSF) in native space. 3) To adjust for head size, GM and WM were normalized by individual intracranial volume (ICV; where ICV = GM + WM + CSF) as the GM fraction and WM fraction for group comparison, respectively. In addition, the brain parenchymal fraction (BPF) was the ratio of brain parenchymal volume to the ICV (BPF = [GM + WM]/ICV), and it was used to calculate brain atrophy. 4) To improve registration accuracy, the DARTEL algorithm was used to create a group-specific template and calculate the individual nonlinear transformation to this template in SPM8.8 5) Then, each participant’s GM image was transformed from each native to the Montreal Neurological Institute space. 6) Finally, the resulting normalized images were smoothed with a 6 mm full-width–half-maximum Gaussian kernel. After spatial preprocessing, the normalized and smoothed GM data sets were subjected to statistical analysis.
Measurement of WMH
WMH scores
WMH lesions were scored in FLAIR images using the Age-Related White Matter Changes (ARWMC) scale (range 0–30).9,10 The ARWMC records five different regions (frontal, parieto-occipital, temporal, infratentorial area, and basal ganglia) from the right and left hemispheres and uses a 4-score range (0–3). To ensure the reliability of the measurements, one expert neuroradiologist (FZ) performed all of the ratings after training on a standard data set. Another senior neuroradiologist (HG) cross-checked a random sample of 30% of ratings.
Volumetric assessment
The procedure for the volumetric measurement of WMH lesions has been previously described.11,12 The main process includes: individual WMH lesions were manually delineated on the FLAIR images (FZ), and the lesion faction was the ratio between the lesion volume of individual space and the ICV. Then, we obtained a binary lesion mask normalized to Montreal Neurological Institute space to remove the head size for lesion volume calculation, which was remeasured on two separate occasions (at least three months apart) for quality control. The interrater reliability was 92.3%.
Statistical analysis
To determine whether there were significant differences in density abnormalities of NAGM between the groups, the normalized and smoothed GM image segments from each group were entered into a general linear model implemented in SPM8. A one-way analysis of covariance with age, sex, and education level as covariates was performed, followed by post hoc two-sample t-tests. Our statistical threshold was P<0.05 (false discovery rate corrected).
A two-sample t-test was performed to compare the group differences in age, sex, normalized WM volume, normalized GM volume, and BPF using Statistical Product and Service Solutions Version 13.0 (SPSS Inc., Chicago, IL, USA).
We assessed the relationship between WMH lesion load and GM density values extracted in abnormalities from the NAGM in the WMH group by partial correlation analysis in SPSS, with age, sex, and education level as covariates of no interest. The threshold was set at a significance level of P<0.05 and was corrected for multiple comparisons using the Bonferroni correction.
Results
Clinical data and WMH lesion characteristic
We reported 23 subjects in the WMH group and a well-matched HCS group, and the two groups had a similar education level and handedness (Table 1).
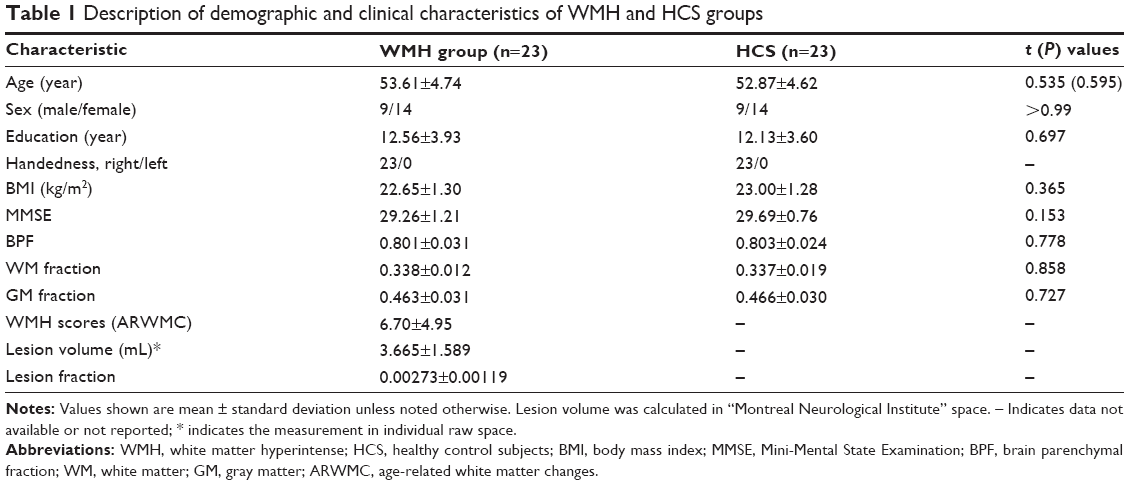 | Table 1 Description of demographic and clinical characteristics of WMH and HCS groups |
Density abnormalities of NAGM
DARTEL-enhanced VBM analysis revealed that the WMH group had a significant GM density decrease in brain regions, including the left middle frontal gyrus (MFG), bilateral anterior cingulate cortex (ACC), left premotor cortex (PMC), left middle cingulate cortex (MCC), right MCC, and the right PMC, which had the highest negative value (Figure 2 and Table 2). The WMH group also had a significant GM increase in brain regions, including the bilateral cerebellum anterior lobe (CAL), left middle temporal gyrus, right temporoparietal junction (TPJ), left inferior parietal lobule (IPL), left prefrontal cortex (PFC), and right PFC, which had the highest positive value (Figure 2 and Table 2).
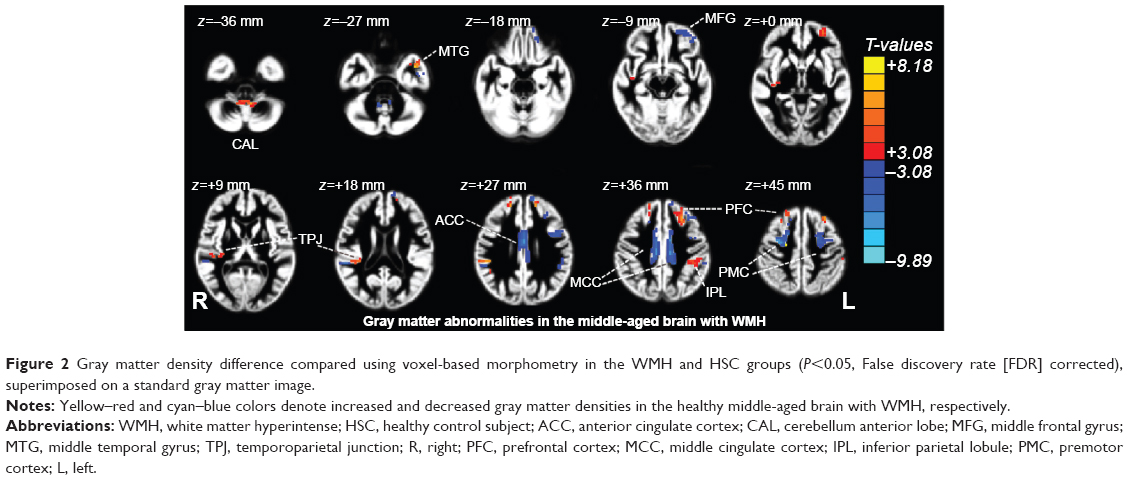 | Figure 2 Gray matter density difference compared using voxel-based morphometry in the WMH and HSC groups (P<0.05, False discovery rate [FDR] corrected), superimposed on a standard gray matter image. |
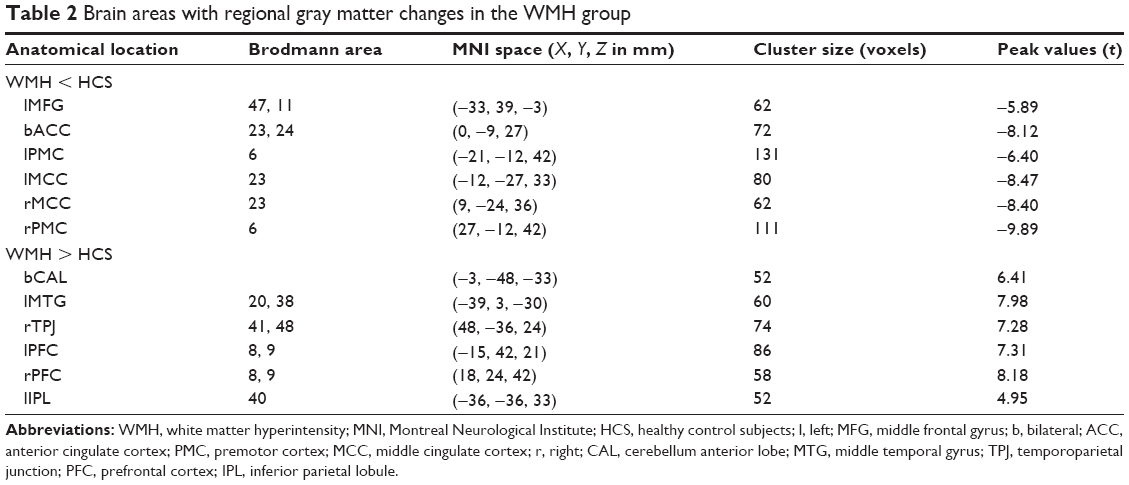 | Table 2 Brain areas with regional gray matter changes in the WMH group |
The relationship between the WMH lesion load and the density abnormalities of NAGM
In the WMH group, partial correlation analyses of the WMH lesion volume, WMH score (ARWMC), and the regional density abnormalities of NAGM revealed significant group differences. Only the decreased GM densities in the left MFG (ρ=−0.629, P=0.002), bilateral ACC (ρ=−0.507, P=0.019), right MCC (ρ=−0.484, P=0.026), and right PMC (ρ=−0.438, P=0.047) were negatively correlated with lesion fraction. Increased GM densities in the right TPJ (ρ=−0.484, P=0.026), left PFC (ρ=−0.469, P=0.032), and right PFC (ρ=−0.438, P=0.047) were negatively correlated with lesion fraction (Figure 3). By contrast, no significant relationship was found between the WMH score (ARWMC) and the altered regional density of NAGM (P: 0.210−0.878) for the middle-aged subject with WMH (Table S1).
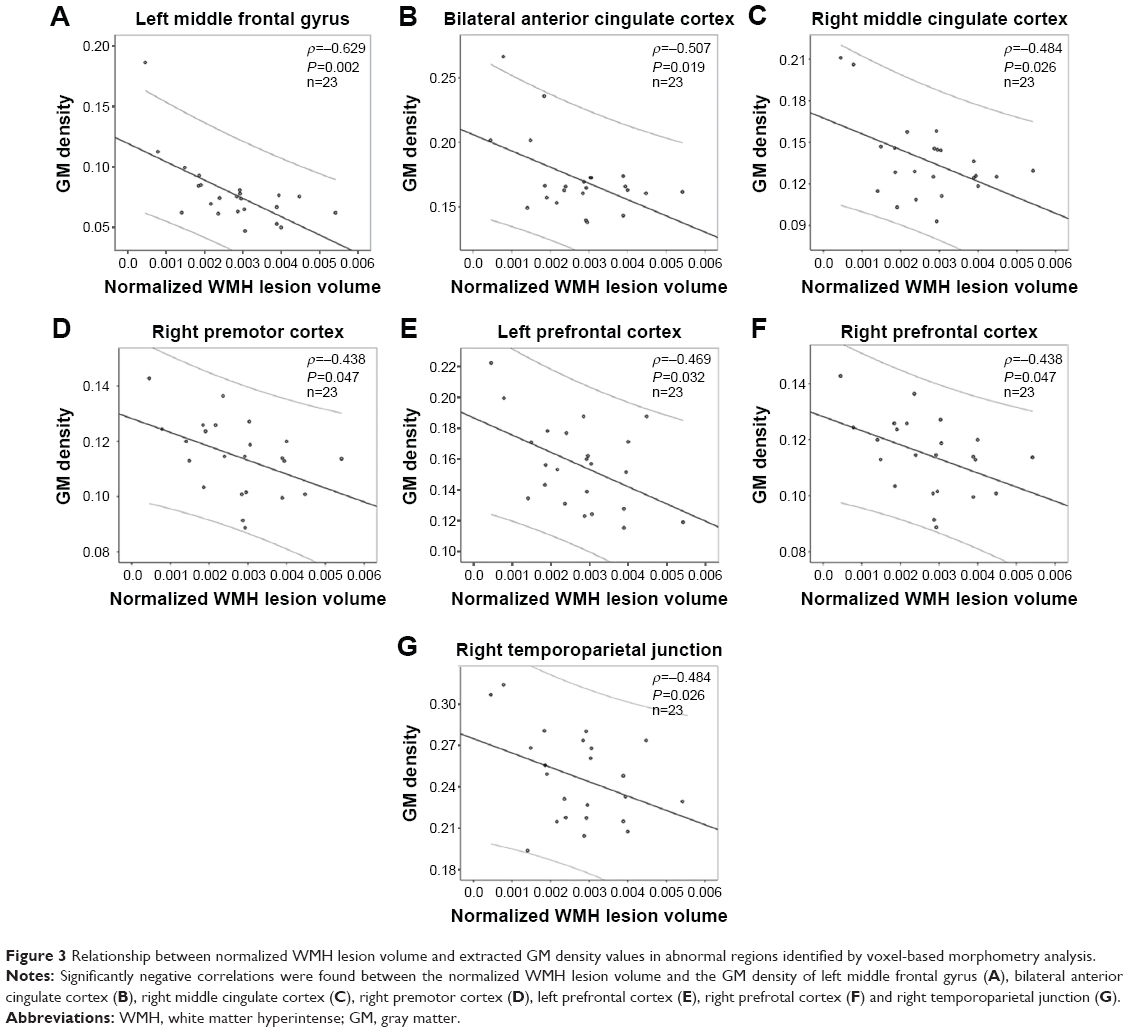 | Figure 3 Relationship between normalized WMH lesion volume and extracted GM density values in abnormal regions identified by voxel-based morphometry analysis. |
Discussion
We showed regional alterations in GM density in the WMH group and significant correlations between WMH lesion fraction and extracted GM density values in abnormal regions identified by DARTEL-enhanced VBM analysis. Together, these findings suggest that during WM demyelination and axonal degeneration, the structural plasticity of GM responds to WMH lesion load.
Decreased GM density indicates structural atrophy in NAGM
Our primary findings were significant decreases in GM density in various brain regions, including the left MFG, bilateral ACC, and left and right MCC, and left and right PMC. In the case of the left MFG, bilateral ACC, and left MCC, these regions had a reduced GM density that was related to the severity of the WMH lesion load. These regions with structural atrophy are primarily involved with cognitive (MFG and ACC) and motor (MCC and PMC) functions. GM density reductions have been demonstrated in healthy aging in the MFG and are associated with age-related declines in memory.6,13–15 Age-related decrease in functional connectivity in the ACC has also been demonstrated in middle-aged normal adults and correlates with age-related cognitive decline in normal subjects.16 The ACC contributes to higher order cognitive processes but is susceptible to WMH-related GM loss,17 and its atrophy potentially contributes to important aspects of cognitive decline. In aging studies, the MCC also frequently shows GM loss.18 The MCC and the PMC are involved in motor function, and age-related motor function decline has been recognized.19,20 These findings demonstrate that regional cortical thinning occurs in middle-aged subjects with WMH.
Bunce et al21 reported that cognitive deficits were associated with WMH in a community sample aged 44–48 years but that WMH seems to reverse these deficits in depression and dementia. Although we observed a WMH lesion-related decrease in GM density in the WMH group, these subjects did not report a decline in cognition. The finding of decreased GM density in the left MFG, bilateral ACC, left and right MCC, and left and right PMC is earliest and most easily effected cortical structures, and these structures show age-related deterioration in elderly participants. A WMH lesion is an important sign indicating regional GM atrophy in NAGM in middle-aged subjects.
Increased GM density indicates a structural reconstruction in NAGM
Our results suggest a significantly increased GM density in brain regions, including the bilateral CAL, right TPJ, left middle temporal gyrus, left and right PFC, and left IPL. The CAL is the portion of the cerebellum responsible for mediating unconscious proprioception. The TPJ is an “association area” that integrates information from the external environment and within the body and incorporates information from the thalamus and the limbic system, as well as from the sensory system.22 In this study, the area of the PFC with increased GM density was near a region with reduced GM density, and this PFC area exhibits cognitive and executive functions. The IPL is part of the default-mode network, which is involved in the perception of emotions in facial stimuli and the interpretation of sensory information.23,24 Our study found GM regions with density increase near the area with the most serious damage, which reflects structural plasticity during adaptation to the environment. Cerebral plasticity includes neurodegeneration and structural reconstruction. Very interestingly, neurodegeneration coexists with GM reconstruction, which may be a compensatory mechanism in a brain region with mild damage. If confirmed, this finding could be used to help prevent aging-related degeneration. Moreover, structural reconstruction of the age-related cortex has been rarely reported, so this study should provide opportunities to improve understanding of the pathogenetic mechanism of age-related small vessel disease.
We also observed a negative association between WMH and increased GM density in the right TPJ, left PFC, and right PFC. Earlier pathology reports focused on demyelination and axonal loss in WMH and described the changes as “ischemic”.5,25 Extensive WMH was also associated with a reduced density of glia and vacuolation, a loosening of the WM fibers, and myelin loss. According to previous studies, an increased GM density could correspond to slight structural damage,26 learning, or training.27 In the present study, a lesion load-related increase in regional GM density in the WMH group suggests a possible explanation for cortical GM remodeling. The increased GM density could be triggered by mild white matter damage (WMH lesion). The increased GM density in the earliest stages of WMH development could provide important opportunities to prevent (or even reverse) brain damage during middle age and prevent its consequences in cognitive, motor function, and even dementia.
Only middle-aged subjects with slight WMH lesion loads were recruited in the DARTEL-enhanced VBM analysis of this study, and these participants did not have any cognitive disorders. Thus, we were unable to investigate associations between GM density measures and cognition. Additionally, our sample size was small, which precluded our ability to perform analyses on additional patient differences, for example, regional WMH distribution in topological space and correlations with regional GM density abnormalities. Finally, we did not perform a longitudinal analysis of GM density.
Conclusion
This study demonstrates WMH-related reductions in GM density and increased GM densities in NAGM as well as a relationship between lesion loads and bi-directional changes in regional GM density in a WMH group. Longitudinal noninvasive neuroimaging approaches may help explain how and why the progression of WMH lesions contributes to cognitive or motor changes.
Acknowledgments
The authors thank their patients and volunteers for participating in this study. This study was supported by the National Science Foundation of China (grant nos 81101041 and 81560284), the Natural Science Foundation of Jiangxi, People’s Republic of China (grant no 2013BAB215008), the Science and Technology Project of Jiangxi Provincial Education Department, People’s Republic of China (grant no GJJ13136), and also by the Science and Technology Project of Jiangxi Provincial Health and Family Planning Commission (grant no 20143071).
Author contributions
FZ contributed to study concept and design and manuscript writing. LW, YP, and SL contributed to data acquisition. YP, SL, XL, and YZ contributed to analysis and interpretation of the data. YP, FZ, XL, and SL contributed to manuscript edits. FZ and DL contributed to study supervision. All authors contributed toward data analysis, drafting and critically revising the paper and agree to be accountable for all aspects of the work.
Disclosure
The authors report no conflicts of interest in this work. None of the authors have any personal or financial involvement with organizations that have a financial interest in its content.
References
Wardlaw JM, Allerhand M, Doubal FN, et al. Vascular risk factors, large-artery atheroma, and brain white matter hyperintensities. Neurology. 2014;82(15):1331–1338. | ||
Valdés Hernández Mdel C, Booth T, Murray C, et al. Brain white matter damage in aging and cognitive ability in youth and older age. Neurobiol Aging. 2013;34(12):2740–2747. | ||
Fazekas F, Kleinert R, Offenbacher H, et al. Pathologic correlates of incidental MRI white matter signal hyperintensities. Neurology. 1993;43(9):1683–1689. | ||
Grueter BE, Schulz UG. Age-related cerebral white matter disease (leukoaraiosis): a review. Postgrad Med J. 2012;88(1036):79–87. | ||
Maniega SM, Valdes Hernandez MC, Clayden JD, et al. White matter hyperintensities and normal-appearing white matter integrity in the aging brain. Neurobio Aging. 2015;36(2):909–918. | ||
Hutton C, Draganski B, Ashburner J, Weiskopf N. A comparison between voxel-based cortical thickness and voxel-based morphometry in normal aging. Neuroimage. 2009;48(2):371–380. | ||
Lehmann M, Crutch SJ, Ridgway GR, et al. Cortical thickness and voxel-based morphometry in posterior cortical atrophy and typical Alzheimer’s disease. Neurobiol Aging. 2011;32(8):1466–1476. | ||
Goto M, Abe O, Aoki S, et al. Diffeomorphic anatomical registration through exponentiated lie algebra provides reduced effect of scanner for cortex volumetry with atlas-based method in healthy subjects. Neuroradiology. 2013;55(7):869–875. | ||
Kapeller P, Barber R, Vermeulen R, et al. Visual rating of age-related white matter changes on magnetic resonance imaging scale comparison, interrater agreement, and correlations with quantitative measurements. Stroke. 2003;34(2):441–445. | ||
Wahlund L, Barkhof F, Fazekas F, et al. A new rating scale for age-related white matter changes applicable to MRI and CT. Stroke. 2001;32(6):1318–1322. | ||
Shu N, Liu Y, Li K, et al. Diffusion tensor tractography reveals disrupted topological efficiency in white matter structural networks in multiple sclerosis. Cereb Cortex. 2011;21(11):2565–2577. | ||
Charil A, Dagher A, Lerch JP, Zijdenbos AP, Worsley KJ, Evans AC. Focal cortical atrophy in multiple sclerosis: relation to lesion load and disability. Neuroimage. 2007;34(2):509–517. | ||
Murray AD, Staff RT, McNeil CJ, et al. Brain lesions, hypertension and cognitive ageing in the 1921 and 1936 Aberdeen birth cohorts. Age. 2012;34(2):451–459. | ||
Raz N, Gunning-Dixon F, Head D, Rodrigue KM, Williamson A, Acker JD. Aging, sexual dimorphism, and hemispheric asymmetry of the cerebral cortex: replicability of regional differences in volume. Neurobiol Aging. 2004;25(3):377–396. | ||
Rajah MN, Languay R, Grady CL. Age-related changes in right middle frontal gyrus volume correlate with altered episodic retrieval activity. J Neurosci. 2011;31(49):17941–17954. | ||
He X, Qin W, Liu Y, et al. Age-related decrease in functional connectivity of the right fronto-insular cortex with the central executive and default-mode networks in adults from young to middle age. Neurosci Lett. 2013;544:74–79. | ||
Westlye LT, Walhovd KB, Dale AM, et al. Differentiating maturational and aging-related changes of the cerebral cortex by use of thickness and signal intensity. Neuroimage. 2010;52(1):172–185. | ||
Mann SL, Hazlett EA, Byne W, et al. Anterior and posterior cingulate cortex volume in healthy adults: effects of aging and gender differences. Brain Res. 2011;1401:18–29. | ||
Rajah MN, Languay R, Valiquette L. Age-related changes in prefrontal cortex activity are associated with behavioural deficits in both temporal and spatial context memory retrieval in older adults. Cortex. 2010;46(4):535–549. | ||
Ni Z, Isayama R, Castillo G, Gunraj C, Saha U, Chen R. Reduced dorsal premotor cortex and primary motor cortex connectivity in older adults. Neurobiol Aging. 2015;36(1):301–303. | ||
Bunce D, Anstey KJ, Cherbuin N, et al. Cognitive deficits are associated with frontal and temporal lobe white matter lesions in middle-aged adults living in the community. PLoS One. 2010;5(10):e13567. | ||
Mars RB, Sallet J, Schüffelgen U, Jbabdi S, Toni I, Rushworth MF. Connectivity-based subdivisions of the human right “temporoparietal junction area”: evidence for different areas participating in different cortical networks. Cereb Cortex. 2012;22(8):1894–1903. | ||
Buckner RL, Andrews-Hanna JR, Schacter DL. The brain’s default network: anatomy, function, and relevance to disease. Ann NY Acad Sci. 2008;1124:1–38. | ||
Andrews-Hanna JR, Reidler JS, Sepulcre J, Poulin R, Buckner RL. Functional-anatomic fractionation of the brain’s default network. Neuron. 2010;65(4):550–562. | ||
Wardlaw JM, Valdes Hernandez MC, Munoz-Maniega S. What are white matter hyperintensities made of? Relevance to vascular cognitive impairment. J Am Heart Assoc. 2015;4(6):001140. | ||
Li C, Cai P, Shi L, et al. Voxel-based morphometry of the visual-related cortex in primary open angle glaucoma. Curr Eye Res. 2012;37(9):794–802. | ||
Vahdat S, Darainy M, Milner TE, Ostry DJ. Functionally specific changes in resting-state sensorimotor networks after motor learning. J Neurosci. 2011;31(47):16907–16915. |
Supplementary materia.
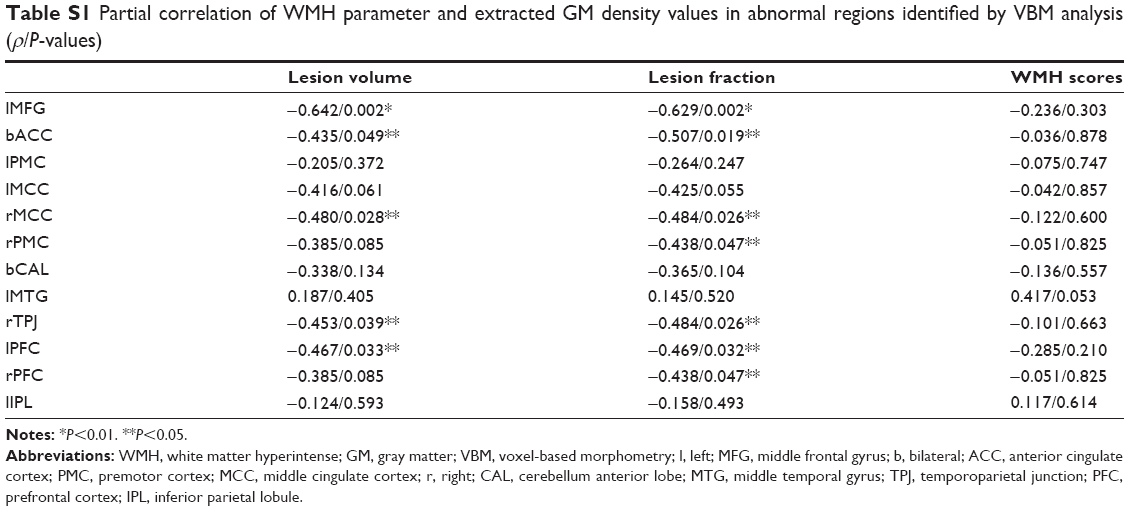 | Table S1 Partial correlation of WMH parameter and extracted GM density values in abnormal regions identified by VBM analysis (ρ/P-values) |
 © 2016 The Author(s). This work is published and licensed by Dove Medical Press Limited. The full terms of this license are available at https://www.dovepress.com/terms.php and incorporate the Creative Commons Attribution - Non Commercial (unported, v3.0) License.
By accessing the work you hereby accept the Terms. Non-commercial uses of the work are permitted without any further permission from Dove Medical Press Limited, provided the work is properly attributed. For permission for commercial use of this work, please see paragraphs 4.2 and 5 of our Terms.
© 2016 The Author(s). This work is published and licensed by Dove Medical Press Limited. The full terms of this license are available at https://www.dovepress.com/terms.php and incorporate the Creative Commons Attribution - Non Commercial (unported, v3.0) License.
By accessing the work you hereby accept the Terms. Non-commercial uses of the work are permitted without any further permission from Dove Medical Press Limited, provided the work is properly attributed. For permission for commercial use of this work, please see paragraphs 4.2 and 5 of our Terms.