")
Back to Journals » OncoTargets and Therapy » Volume 12
Demethylation and Overexpression of CSF2 are Involved in Immune Response, Chemotherapy Resistance, and Poor Prognosis in Colorectal Cancer
Authors Xu Z, Zhang Y, Xu M, Zheng X, Lin M, Pan J, Ye C, Deng Y, Jiang C, Lin Y , Lu X, Chi P
Received 23 May 2019
Accepted for publication 13 September 2019
Published 19 December 2019 Volume 2019:12 Pages 11255—11269
DOI https://doi.org/10.2147/OTT.S216829
Checked for plagiarism Yes
Review by Single anonymous peer review
Peer reviewer comments 4
Editor who approved publication: Dr William C. Cho
Zongbin Xu,1,* Yiyi Zhang,1,* Meifang Xu,2,* Xin Zheng,2 Mengxin Lin,3 Jie Pan,4 Chengwei Ye,1 Yu Deng,1 Caiyun Jiang,1 Yu Lin,1 Xingrong Lu,1 Pan Chi1
1Department of Colorectal Surgery, Fujian Medical University Union Hospital, Fuzhou, People’s Republic of China; 2Department of Pathology, Fujian Medical University Union Hospital, Fuzhou, People’s Republic of China; 3Department of Oncology, Fujian Medical University Union Hospital, Fuzhou, People’s Republic of China; 4Department of Emergency Surgery, Fujian Medical University Union Hospital, Fuzhou, People’s Republic of China
*These authors contributed equally to this work
Correspondence: Xingrong Lu; Pan Chi
Department of Colorectal Surgery, Fujian Medical University Union Hospital, 29 Xinquan Road, Fuzhou City 350001, Fujian, People’s Republic of China
Tel +86-591-83357896-8410
Fax +86-591-87113828
Email [email protected]; [email protected]
Purpose: This study aimed to evaluate the role of colony-stimulating factor 2 (CSF2) in chemotherapy resistance, prognosis, and immune response and to identify its possible mechanisms underlying drug resistance.
Methods: Drug-resistant cell lines were obtained by successively increasing drug concentration. RNA-Seq was performed to screen hub genes. CSF2 expression was analyzed via immunohistochemistry. Moreover, The Cancer Genome Atlas (TCGA), Tumor Immune Estimation Resource (TIMER) dataset, and R2 platform were used to explore the correlations among CSF2 expression, prognosis, and immune response.
Results: RNA-Seq indicated that microRNAs in cancer, P53 signaling pathway, and cell cycle were associated with FOLFOX chemotherapy resistance. Protein-protein interaction (PPI), molecular complex detection (MOCDE), and qRT-PCR analysis verified CSF2 as the hub gene in chemotherapy resistance. Moreover, CSF2 expression was lower in the normal tissue than in the cancerous tissue (P<0.05). Higher expression of CSF2 was associated with poor OS and DFS in colon cancer patients (P<0.05). We further found similar results in the Oncomine database and R2 platform (P<0.05). A higher expression of CSF2 in the CRC tissue may be caused by demethylation, which was verified using the TCGA datasets. Moreover, GSEA demonstrated that CSF2 was associated with immune response, which was consistent with results reported using TIMER datasets.
Conclusion: CSF2 is a novel biomarker and a prognostic factor for the survival of CRC patients affecting the immune response, and an overexpression of CSF2 in CRC patients may be caused by DNA demethylation.
Keywords: colorectal cancer, FOLFOX, prognosis, CSF2, immune response
Introduction
Colorectal cancer (CRC) is the third most common cancer and the second leading cause of cancer-related death worldwide.1 Chemotherapy is one of the most commonly used treatments for CRC. Unfortunately, approximately 50% of CRC patients could develop drug resistance, thus resulting in failure of chemotherapy.2 Therefore, it is highly important to better understand the mechanisms underlying drug resistance to chemotherapy. Recently, tumor-associated macrophages (TAMs), a major component of inflammatory cellular infiltrates in tumors, have been verified to be associated with chemotherapy resistance in many cancers, including CRC. TAMs-based therapy has been widely explored in several cancer types (e.g., melanoma and pancreatic cancer) to conquer chemotherapy resistance.3–6 Therefore, exploring potential TAMs targets is of great clinical importance to offer individualized therapeutic strategies for patients who have developed chemotherapy resistance.
Colony-stimulating factor 2 (CSF2, also known as granulocyte macrophage-colony stimulating factor, GM-CSF), is a cytokine functioning as a hematologic cell growth factor that stimulates stem cells to produce granulocytes and monocytes.7,8 In addition, CSF2 induces protective immunity, mainly by stimulating the recruitment, maturation, and functioning of dendritic cells (DCs). This effect of CSF2 on DCs leads to the activation of the immune system against specific antigens. Therefore, CSF2 has been considered to exert anti-tumor effects in the systemic immune response. In contrast, a recent study has revealed that CSF2 plays a different role in the solid tumor microenvironment, wherein CSF2 upregulation may suppress the immune response and result in poor prognosis in several tumors.9,10 TAMs play an important role in the tumor microenvironment by differential polarization to M1 and M2 macrophages, and differential polarization involved in the anti-inflammatory/pro-tumorigenic and pro-inflammatory/anti-tumorigenic.11–13 CSF2 acts as a mediator of macrophage polarization affecting the immune response in the tumor microenvironment.11–13 However, the exact role of CSF2 in CRC remains unclear.
In the present study, we comprehensively analyzed mRNA expression profiling in parental and chemotherapy-resistant cells using RNA-Seq. Subsequently, differential gene expression analysis was performed and protein-protein interaction (PPI) network and molecular complex detection (MCODE) algorithm were determined to screen for relevant hub genes for chemoresistance in our expression profile. The correlation of hub genes with peripheral immune cells in different tumor microenvironments was investigated via Tumor Immune Estimation Resource (TIMER). Finally, the hub genes were verified by multiple bioinformatics analysis and immunohistochemical analysis of our data.
Materials and Methods
Patient Tissue Samples
Based on our prospective maintained database, colon cancer patients undergoing surgical resection from June to December 2010 at Fujian Medical University Union Hospital (Fujian, China) were enrolled. The inclusion criteria were: (1) pathologically proven colon adenocarcinomas, (2) tumors located in the ascending, transverse, descending, or sigmoid colon, and (3) an Eastern Cooperative Oncology Group (ECOG) performance status score of 0–1. The exclusion criteria were as follows: (1) aged < 18 years, (2) severe comorbidities, (3) familial adenomatous polyposis (FAP) or Lynch syndrome, (4) multiple primary neoplasms, (5) loss to postoperative follow-up, and (6) incomplete medical records. Finally, 114 patients with colon cancer were included in this study.
Cancerous and the matched adjacent non-cancerous tissues were collected, frozen and stored in liquid nitrogen for further assay. The clinicopathologic features of patients were obtained from our prospective database, including age, gender, body mass index (BMI), gross type, histologic differentiation, pretreatment carcinoembryonic antigen (CEA) level, pretreatment carbohydrate antigen 199 (CA199) level, T classification, lymph node invasion, distant metastasis, tumor stage, tumor location and etc. Survival outcomes were obtained from the postoperative follow-up. The study protocol was conducted in accordance with the Declaration of Helsinki and approved by the Medical Ethics Committee of Fujian Medical University Union Hospital (Fujian, China). All patients provided and written informed consent.
Follow-Up
Postoperative follow-up was conducted every 3 months for the first 3 years, then every 6 months for the next 2 years, and annually thereafter. During each visit, a physical examination, serum CEA test, chest X-ray or CT scan, and abdominopelvic MRI or CT scans were performed. A colonoscopy was performed annually after surgery. Positron emission tomography (PET) was performed when needed. Overall survival (OS) was defined as the time from surgery to death or the last follow-up. Disease-free survival (DFS) was caculated as the time from surgery to tumor relapse. Patient follow-up lasted until death or the cut-off date of September 30, 2018.
Immunohistochemical Analysis
The concentration of CFS2 protein in biopsy samples embedded in paraffin wax was measured using immunohistochemical streptavidin-biotin complex method. Phosphate-buffered saline (PBS) was used as anegative control and the image of a positive control was obtained from GE Healthcare Life Sciences. The following criteria were used: the percentage of positive cells for each section and colored shade was scored semi-quantitatively, and the fields were randomly selected from five directions (up, center, down, left, and right) under high magnification (×400). All analyses were performed in a double-blind manner.
Cell Culture and Reagents
Human colon cancer HCT-8 cell lines were purchased from Shanghai Genechem Co. Ltd (Shanghai, China). Resistance to 5-FU was induced in a colonic cancer cell line (HCT-8/5-FU) created from the parental HCT-8 cell line as described below. Development of resistance to L-OHP cell line has already reported in our previous study.14 Parental and HCT-8/5-FU were cultured with RPMI 1640 (Invitrogen; Thermo Fisher Scientific, Inc., Carlsbad, CA, USA) supplemented with 10% fetal bovine serum (FBS, Hangzhou Sijiqing Bio-Engineering Material Ltd. Co, Hangzhou, China), 100 U/mL penicillin, and 100 mg/mL streptomycin (Invitrogen; Thermo Fisher Scientific, Inc., Carlsbad, CA, USA) in 5% CO2 at 37°C.
The human colon cancer cell line HCT-8 were seeded in a 25mL culture flask and 100 μmol/L (1/3 IC50) 5-FU solution was added into the medium, and the medium was changed after incubation for 48 h. When cells recovered to normal growth and subculture, the same drug concentration was repeated. The cell culture added with 5-FU was repeated 60 times (5-FU concentration increased by 100 μmol/L every three subculture). The HCT-8 cell line from the last subculture, which was resistant to 2000 μmol/L 5-FU, was cultured in complete culture medium containing 500 μmol/L 5-FU and was defined as HCT-8/5-FU. The period of establishing the drug-resistant cell line lasted for 9 months.
Cell Viability Assay
Drug sensitivity was evaluated using a CCK-8 Kit (Dojindo Laboratories, Japan), according to the manufacturer’s instructions. Briefly, cells were plated in 96-well plates in a concentration of 3×10³ cells per well. When the cells reached 60% confluence, the medium was removed and replaced with fresh medium containing varying concentrations of L-OHP and 5-fluoro-2,4(1h, 3h) pyrimidinedione (5-FU) and incubated for 48 h. The optical density was then measured and the cell viability was calculated.
RNA Sequencing Library Construction and Illumina sequencing
Total RNA from each sample of paternal and drug-resistant cell was extracted separately using TRIzol RNA reagent (Invitrogen), according to the manufacturer’s protocol. For each sample, equal amounts of RNA (30 μg) extracted from the three repeats were pooled for the construction of cDNA library and quantitative reverse transcription-polymerase chain reaction (qRT-PCR) analysis. cDNA library construction and RNA-Seq were performed by Genedenovo Bio-Tech Co., Ltd. (Guangzhou, China). The library was sequenced on an Illumina HiSeq™ 2500 platform with paired-end sequencing reads.
Bioinformatic Analysis of Transcriptome Data
Raw sequences with adaptors and unknown nucleotides above 5% or those that were of low quality were removed to obtain clean reads. The clean reads were used for transcript assembly and abundance estimation by Cufflinks v2.2.1.15 The raw gene expression data were normalized using fragments per kilobase of exon per million mapped fragments (FPKM). Genes were considered significantly differentially expressed if the absolute log2-fold change >1 and the false discovery rate (FDR) < 0.05. Gene Ontology (GO) terms and Kyoto Encyclopedia of Genes and Genomes (KEGG) pathways with corrected P-value < 0.05 were considered significantly enriched. Pearson correlation coefficient analysis and principal component analysis (PCA) on all samples were performed by using R software (Version 2.15.3).
Reverse Transcription-Quantitative Polymerase Chain Reaction (RT-qPCR) Assay
Total RNA from cells was isolated using TRIzol reagent (Invitrogen) according to the manufacturer’s instruction. And 1 μg total RNA was used for reverse transcription reaction using M-MLV Reverse Transcriptase Product (Promega). qPCR was performed using an ABI 7500 real-time PCR system (Applied Biosystems; Thermo Fisher Scientific, Inc., Foster City, CA, USA). CSF2, IL15, and CXCL8 mRNA levels were assessed by RT-qPCR with GAPDH used as an internal control. The relative expression levels of genes were calculated using the ΔΔCq method. All PCR amplification was performed in triplicate and repeated in three independent experiments.
PPI Network and MCODE
To identify real hub genes, we analyzed the correlation among the differential expression genes in our data by the PPI network, which was constructed by uploading all differential expression genes to the Search Tool for the Retrieval of Interacting Genes (STRING). Cytoscape was used to perform PPI network analysis and MCODE algorithm in Cytoscape software was conducted to screen hub gene in the maximum specific weigh modules within the PPI network. Finally, we chose the top 50 of the maximum score in MCODE, PPI degree and fold change of differential expression genes (score = 50) to screen the intersection genes defined as the real hub gene.
Identification of the Relationship Between CSF2 Expression, Prognosis, and Methylation
To further verify whether high expression of CSF2 was associated with worse prognosis in CRC, Oncomine database (https://www.oncomine.org) was used to investigate the differential expression of CSF2 in the colon cancerous and normal tissues. Next, we analyzed the prognostic value of hub gene in CRC patients by using the R2: Genomics Analysis and Visualization Platform (http://r2.amc.nl). Additionally, methylation data from The Cancer Genome Atlas (TCGA, MethHC database, http://methhc.mbc.nctu.edu.tw) were used to compare the methylation levels of hub genes between CRC and normal colon tissues.16
Gene Set Enrichment Analysis (GSEA) and Co-Expression Gene Analysis
To figure out the potential function of CSF2 in CRC, GSEA was conducted in CRC parental and FOLFOX resistant cells with the top and last 25% of the expression levels from our datasets. Annotated gene sets c2. cp.kegg. v5.2. symbols. GMT pathways database was chosen as the reference gene sets. P < 0.05 and |enrichment score (ES)| > 0.3 were set as the cut-off criteria. We further used the TCGA data set to identify the co-expression gene of CSF2 in the Gene Expression Profiling Interactive Analysis (GEPIA, http://gepia.cancer-pku.cn/).
Correlation Analysis Between CSF2 Expression and Peripheral Immune Cells
To further explore the association between CSF2 expression and peripheral immune cells, we evaluated whether CSF2 expression was correlated with peripheral immune cells in TIMER (https://cistrome.shinyapps.io/timer/).17,18 In addition, the association between CSF2 expression and peripheral immune cells was further validated in our data.
Statistical Analysis
Statistical analysis was performed using SPSS software version 20.0 (SPSS, Inc., Chicago, IL, USA). Categorical variables were expressed as numbers with percentages and compared using Chi-square test or Fisher’s exact test, when appropriate. Continuous data were described as means ± standard deviations and analyzed using Student’s t-tests. Survival outcomes were assessed using the Kaplan–Meier method and the log rank test. P < 0.05 was considered statistically significant.
Results
Characterization of Paternal and Drug-Resistant Cell Lines
Cell lines resistant to L-OHP (HCT-8/L-OHP cells) were characterized in our previous study.14 To verify resistance to L-OHP and 5-FU, we exposed cells to different concentrations of L-OHP and 5-FU. The results revealed that the resistant cells (HCT-8/L-OHP and HCT-8/5-FU cells) presented continuous propagation at the final stages. Further, HCT-8/5-FU cells were more resistant to 5-FU than HCT-8 cells (P < 0.01, Figure 1A and B). As shown in Figure 1C, the half maximal inhibitory concentration (IC50) and drug resistance index (RI) to 5-FU were significantly lower for parental HCT-8 cells than for HCT-8/5-FU cells (IC50: 296.45 ± 10.63 vs 3064.46 ± 18.92 μmol/mL, RI: 1.60 vs 10.90, both P < 0.01), indicating that HCT-8/5-FU cells showed remarkable resistance to 5-FU. However, HCT-8/5-FU cells did not show increased resistance to L-OHP compared with HCT-8 cells (IC50: 7.07 ± 0.85 vs 5.78 ± 0.05 μmol/mL, P =0.07). These results suggested that a combination of HCT-8/5-FU and HCT-8/L-OHP cells could be used to explore mechanisms underlying resistance to the FOLFOX/CapeOX regimen.
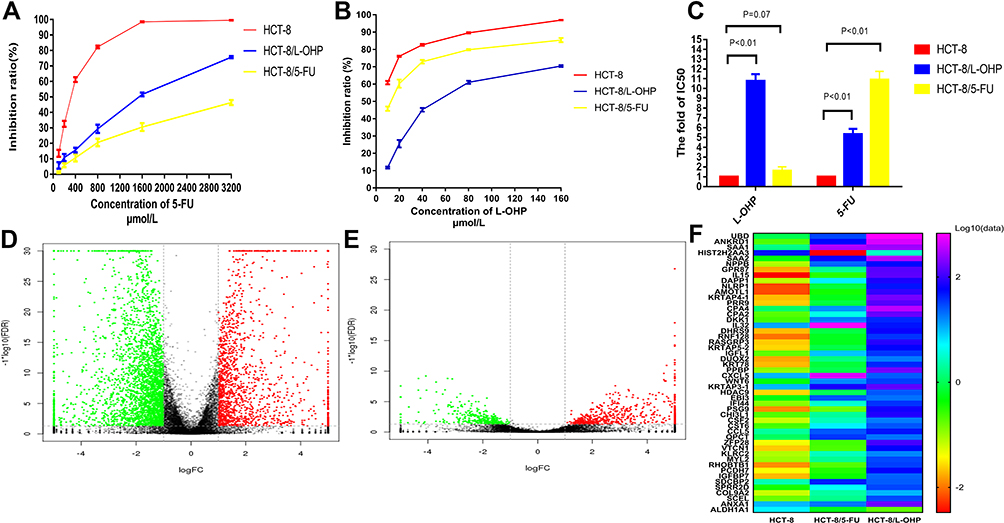 |
Figure 1 Establishment of FOLFOX-resistant HCT-8 cell line and RNA-Seq analysis. Notes: (A and B) Cells were treated with various concentrations of 5-Fu and L-OHP for 48h and analyzed by CCK-8 analysis. (C) IC50 values of on the parental HCT-8 cells, HCT-8/L-OHP and HCT-8/5-FU cells exposed to L-OHP and 5-Fu. (D and E) The volcano plot of differential expression genes expression between HCT-8 and HCT-8/5-FU (D); HCT-8 and HCT-8/L-OHP (E). (F) The heat map among the three groups. |
Cluster Analysis
RNA-Seq was used to examine gene expression profiles in parental cells, drug resistant cells, HCT-8/5-FU and HCT-8/L-OHP. Supervised hierarchical cluster analysis of gene expression profiling data showed a clustering trend between groups (HCT-8 vs HCT-8/5-FU cells; HCT-8 vs HCT-8/L-OHP cells), as demonstrated in Figure 1D–F. The significance analysis of microarrays (SAM) for differentially expressed genes (DEGs) revealed that tumor cell biology differed significantly between the two groups, among which the expression of 630 genes was significantly up- and down-regulated (all P < 0.05).
GO Enrichment and KEGG Analysis
GO enrichment analysis was performed for investigating the molecular mechanism of DEGs involved in resistance to FOLFOX regimen in the parental and drug-resistant cells. We listed the GO terms enriched in the significantly upregulated and downregulated genes in HCT-8 cells and those in HCT-8/5-FU and HCT-8/L-OHP cells (Figure 2A and B). Further, we selected the significant GO terms in both 5-FU and L-OHP resistant cell lines (Figure 2C). The results showed that the top three significant GO terms were enriched for response to stress, cellular component organization, and cell cycle. Additionally, we analyzed differential genes in the parental and drug-resistant cells by KEGG analysis (Figure 2E and F). Subsequently, we selected significant KEGG pathways in both 5-FU- and L-OHP-resistant cell lines (Figure 2D). The results demonstrated that the top three KEGG pathways were related to microRNAs in cancer, P53 signaling pathway, and cell cycle.
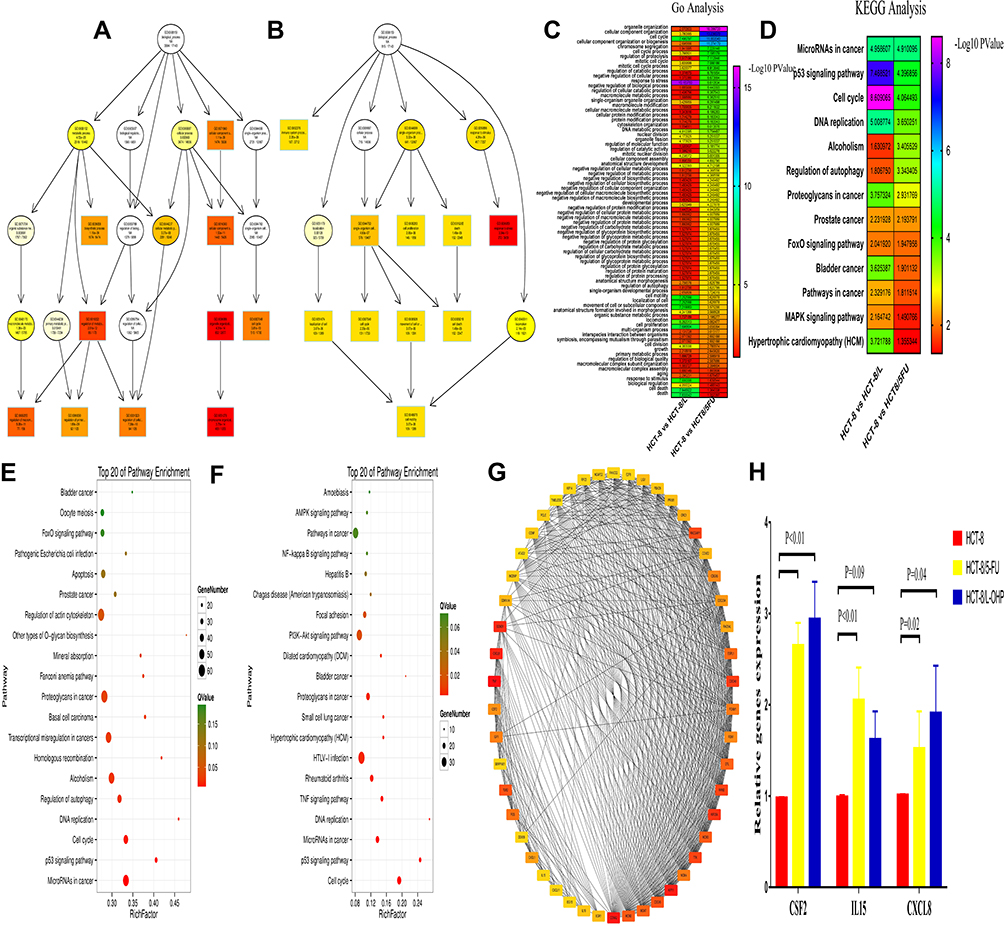 |
Figure 2 Gene Ontology (GO) functional and Kyoto Encyclopedia of Genes and Genomes (KEGG) pathway analysis of the differentially expressed genes. Notes: (A and B) GO functional analysis of the top ten functional classifications of the differential expression genes between HCT-8 and HCT-8/5-FU (A); HCT-8 and HCT-8/L-OHP (B). (C and D) The heat map between the two group analysis of the GO (C) and KEGG (D) (HCT-8 and HCT-8/5-FU; HCT-8 and HCT-8/L-OHP). (E and F) KEGG pathway analysis of the top 20 significant pathways of the differential expression genes between HCT-8 and HCT-8/5-FU (E); HCT-8 and HCT-8/L-OHP (F). (G) PPI (protein-protein interaction) network analysis of the differential expression genes. The color intensity in each node was proportional to the degree of connectivity in the network. (H) The mRNA expression of CSF2, IL15 and CXCL8 in HCT-8, HCT-8/5-FU and HCT-8/L-OHP cells. |
Hub Gene Identification and Validation
For DEG analysis, all the DEGs in the three groups were included and analyzed based on the PPI network, and the PPI degree was calculated. Finally, 463 genes were chosen as hub genes in the PPI network and analyzed using MCODE algorithm in Cytoscape. Following this, 50 genes with highest scores in the MCODE algorithm and highest PPI degrees were chosen as candidates for hub genes. The 50 genes underwent degree score analysis in Cytoscape (Figure 2G). Finally, after analyzing the fold change of DEGs, PPI degree, and MCODE score, the most associated genes, CSF2, IL15, and CXCL8, were chosen as hub genes.
To further validate the hub genes obtained from our RNA-Seq data, we analyzed the expression levels of CSF2, IL15, and CXCL8 in HCT-8, HCT-8/5-FU, and HCT-8/L-OHP cells. As shown in Figure 2H, the expressions of CSF2 and CXCL8 were significantly increased in drug-resistant cells compared with those in the parental cells (5-FU P < 0.01, P = 0.02; L-OHP P < 0.01, P = 0.04). Moreover, IL15 expression was significantly increased in 5-FU-resistant cells compared with that in HCT-8 cells (P < 0.05), whereas the expression of IL15 in L-OHP-resistant cells was similar to that in the parental cells (P = 0.09). Moreover, we found that CSF2 had a higher fold change and a lower P-value when compared with CXCL8. Thus, CSF2 was selected as the “real” hub gene for further analysis.
CSF2 Validation in the Oncomine Database and R2 Platform
To independently validate the hub genes obtained from our data set, we analyzed the expression level of CSF2 by comparing CRC tissues and adjacent normal tissues based on a meta-analysis of 13 GEO-sourced datasets mined from the Oncomine database. The results showed that CSF2 mRNA levels were significantly higher in CRC tissues than in the normal tissue (P < 0.001; Figure 3A). R2: Genomics Analysis and Visualization Platform was used to generate Kaplan–Meier overall survival curves using the “Tumor Colon-Sieber-290-MAS5.0-u133p2,” “Tumor Colon CIT (Combat)-Marisa-566- rma-u133p2,” “Tumor Colon MVRM-SieberSmith-345-fRMA (bc)-u133p2,” “Tumor Colon -SieberSmith-355-u133p2,” “Tumor Colon MSI-status (Core Exon)-Sveen-95-rma-sketch-huex10p,” and “Tumor Colon (Core-Exon)-Sveen-333-rma-sketch-huex10p” datasets. The results showed that high CSF2 expression was correlated with a significantly worse event- and relapse-free survival (all P < 0.05; Figure 3B–G). Moreover, we found that in other datasets, e.g., “Tumor Colon (KRAS mut)-Hase-59-MAS5.0-u133p2” dataset (P = 0.109), although the P value was higher than 0.05 observed in R2, high CSF2 expression was associated with worse disease-free survival compared with low CSF2 expression (Figure 3H).
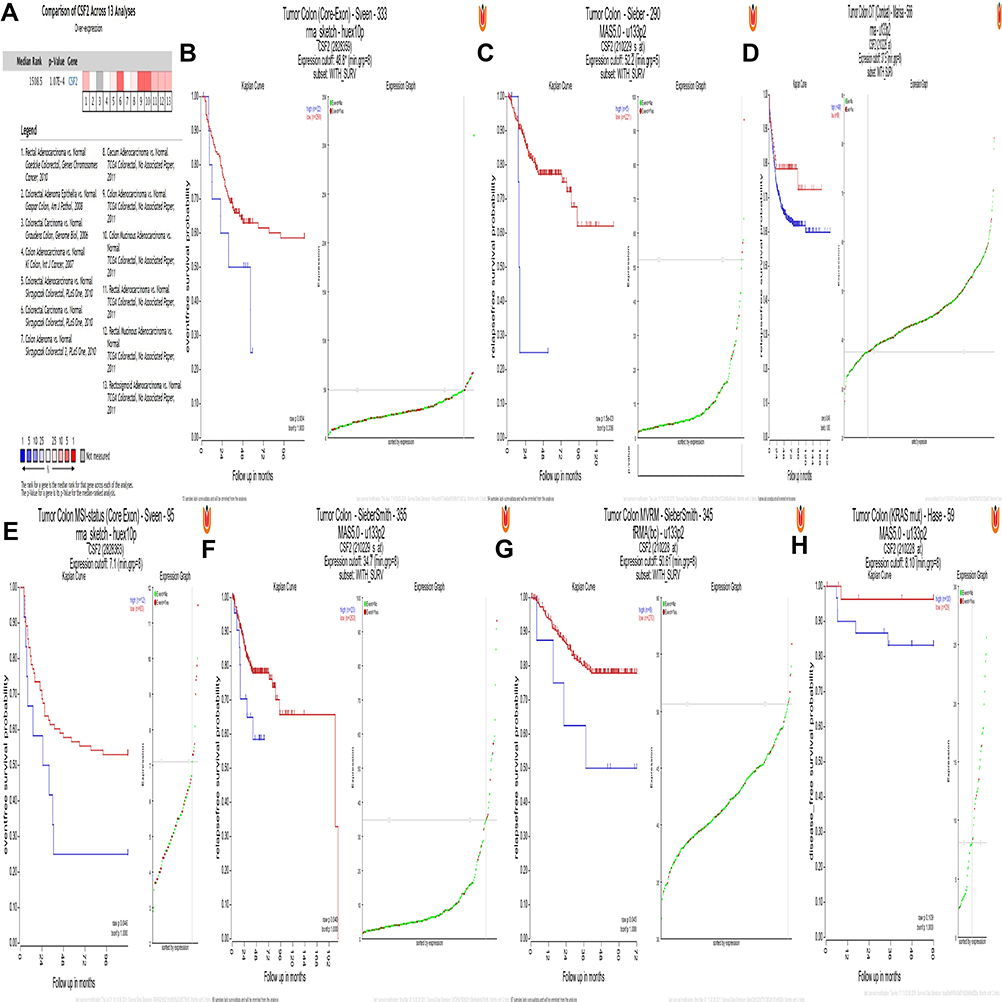 |
Figure 3 CSF2 expression and prognosis. Notes: (A) Meta-analysis of 13 GEO-sourced data sets mined from the Oncomine database showed that CSF2 mRNA levels were significantly higher in CRC tissues than in normal colon tissues (P <0.001). (B–G) Low CSF2 expression was correlated with a significantly better event-, disease- and relapse-free survival (P < 0.05). (H) High CSF2 expression was correlated with a worse disease-free survival (P = 0.109). |
Analysis of DNA Promoter Region Methylation and CSF2 Expression in CRC Patients
To explore whether high CSF2 expression was regulated by demethylation, we analyzed the promoter region methylation data of CSF2 between CRC and normal colorectal tissues. Based on MethHC database, CSF2 was found to be significantly upregulated in both colon and rectal cancer tissues compared with paired normal colon and rectal tissues (colon cancer vs paired normal colon tissue: 7.37 ± 1.68 vs 1.28 ± 0.45, P < 0.01, Figure 4A; rectal cancer vs paired normal rectal tissue: 11.93 ± 2.56 vs 1.22 ± 0.56, P < 0.01, Figure 4E). Further, these results were validated by all colon and rectal cancer vs normal tissues (colon cancer tissue vs normal colon tissue: 10.50 ± 1.32 vs 1.25 ± 0.44, P = 0.02, Figure 4C; rectal cancer vs normal rectal tissue: 10.09 ± 1.32 vs 1.18 ± 0.44, P < 0.01, Figure 4G. With regard to promoter methylation, CSF2 was found to have a decreased methylation degree at the promoter in colon and rectal cancer tissues compared with that in paired normal colon and rectal tissues (colon cancer tissue vs paired normal colon tissue: 0.50 ± 0.01 vs 0.69 ± 0.00, P < 0.01, Figure 4B; rectal cancer tissue vs paired normal rectal tissue: 0.48 ± 0.04 vs 0.70 ± 0.01, P < 0.01, Figure 4F). Similarly, we evaluated the approximate result of the CSF2 promoter methylation in all colon and rectal cancer tissues and normal tissue (colon cancer tissue vs paired normal colon tissue: 0.52 ± 0.01 vs 0.69 ± 0.00, P < 0.01, Figure 4D; rectal cancer tissue vs paired normal rectal tissue: 0.51 ± 0.01 vs 0.70 ± 0.01, P < 0.01, Figure 4H).
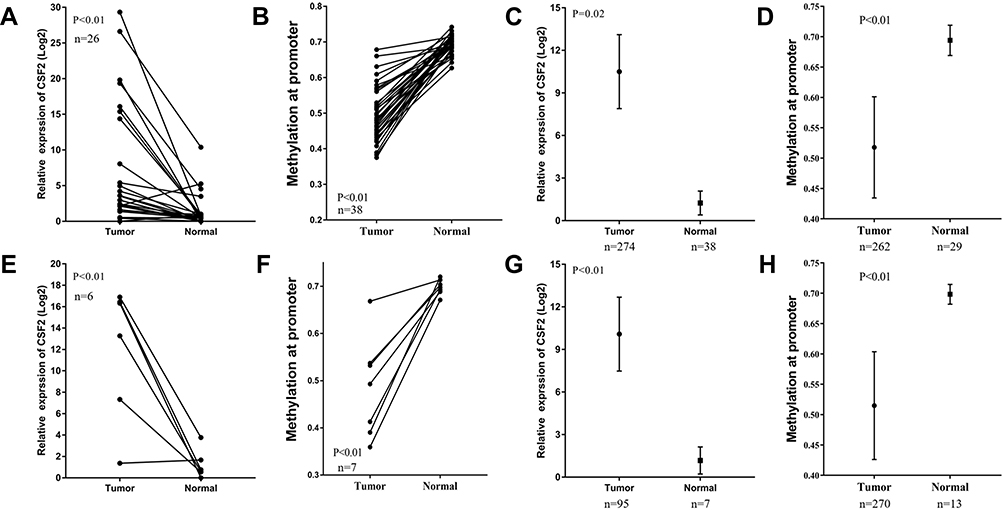 |
Figure 4 CSF2 was upregulated in CRC and had decreased promoter hypermethylation. Notes: (A and E) CSF2 expression was significantly increased in CRC tissues compared with paired adjacent normal tissues in colon cancer (n=26) (A) and rectal cancer (n=6) (E) from the TCGA database. (B and F) CSF2 had decreased promoter hypermethylation compared with paired adjacent normal tissues in colon cancer (n=38) (B) and rectal cancer (n=7) (F) from TCGA database. (C and G) CSF2 expression was significantly increased in colon cancer (n=274 in tumor group, n=38 in normal group) (C) and rectal cancer (G) from the TCGA database (n=95 in tumor group, n=7 in normal group). (D and H) CSF2 had decreased promoter hypermethylation in colon cancer (n=262 in tumor group, n=29 in normal group) (D) and rectal cancer (H) from TCGA database (n=270 in tumor group, n=13 in normal group). |
GSEA, Tumor-Infiltrating Lymphocytes (TILs), And Co-Expression Analysis
GSEA was conducted to determine the potential mechanism underlying CSF2 involvement in chemotherapy resistance in CRC. Our data demonstrated that the enriched KEGG pathways included intestinal immune network, NOD receptor signaling pathway, WNT signaling pathway, and TGF beta signaling pathway (Figure 5A–D). We further analyzed the correlation between CSF2 expression and TILs in TIMER. As shown in Figure 5E, CSF2 expression was significantly associated with TILs (P = 0.02). Moreover, CSF2 expression was found to be associated with B cells, neutrophils, and dendritic cells (P < 0.05). Additionally, co-expression analysis based on TCGA datasets indicated that CSF2 expression was associated with T lymphocyte biomarkers (CD3, R = 0.27, P < 0.01; CD4, R = 0.29, P < 0.01; CD8, R = 0.20, P < 0.01; Figure 5F–H).
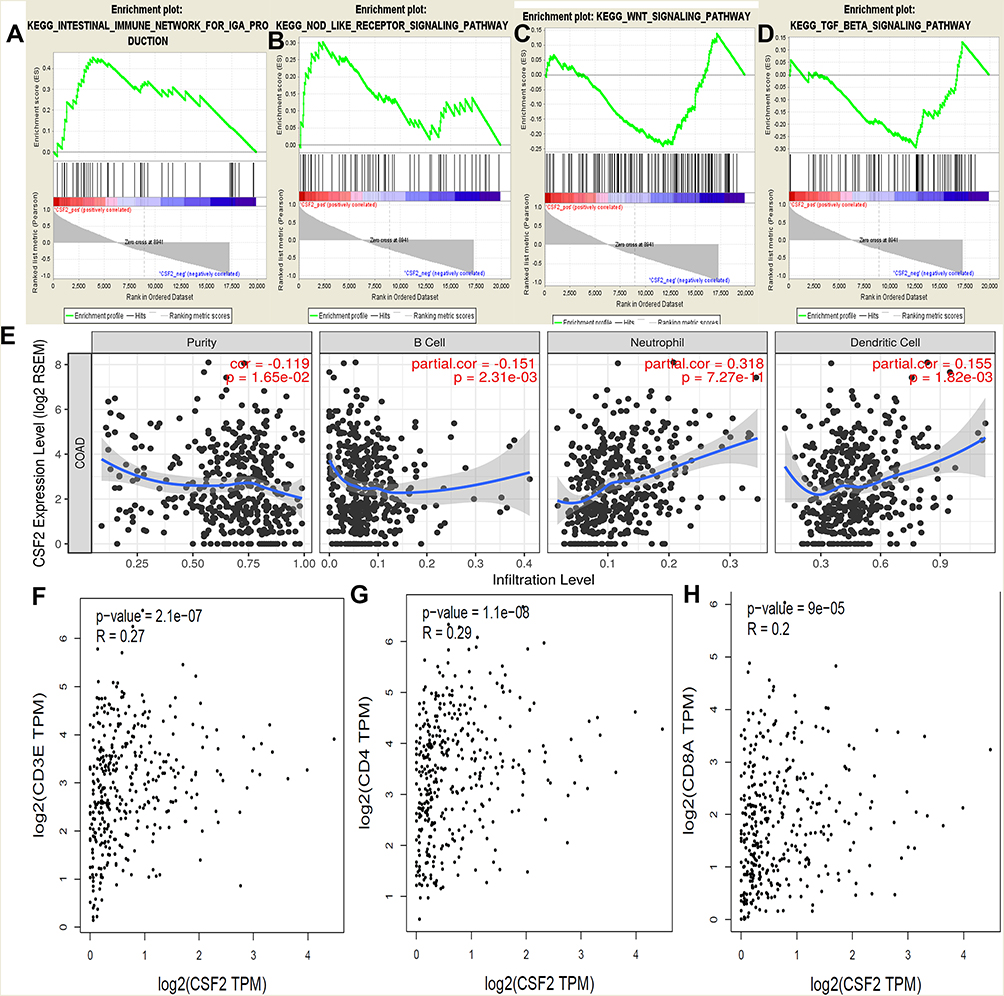 |
Figure 5 GSEA using our data, TIMER analysis and co-expression analysis by the TCGA data sets. Notes: GSEA analysis of our RNA-Seq data, (A) Intestinal immune network; (B) NOD receptor signal pathway; (C) WNT signal pathway; (D) TGF beta signal pathway; and (E) the CSF2 expression correlation with the immune cells analysis by the TIMER data sets, purity, B cells, Neutrophil cells and Dendritic cells (P < 0.05). Co-expression analysis between CSF2 and CD3 (F), CD4 (G) and CD8 (H) in the TCGA data sets (P < 0.05). |
CSF2 Validation in Our Data
To further validate CSF2 expression between colon cancer and paired adjacent normal tissues, we analyzed patients who underwent radical surgery. A total of 111 patients were included in the analysis, and the characteristics of patients are described in Table 1. Immunohistochemical analysis demonstrated that CSF2 protein was observed in the cytoplasm (Figure 6A–H) in tumor tissues and adjacent normal tissues (Figure 6I). The result demonstrated that CSF2 expression was high in the tumor tissue compared with that in the adjacent normal tissues.
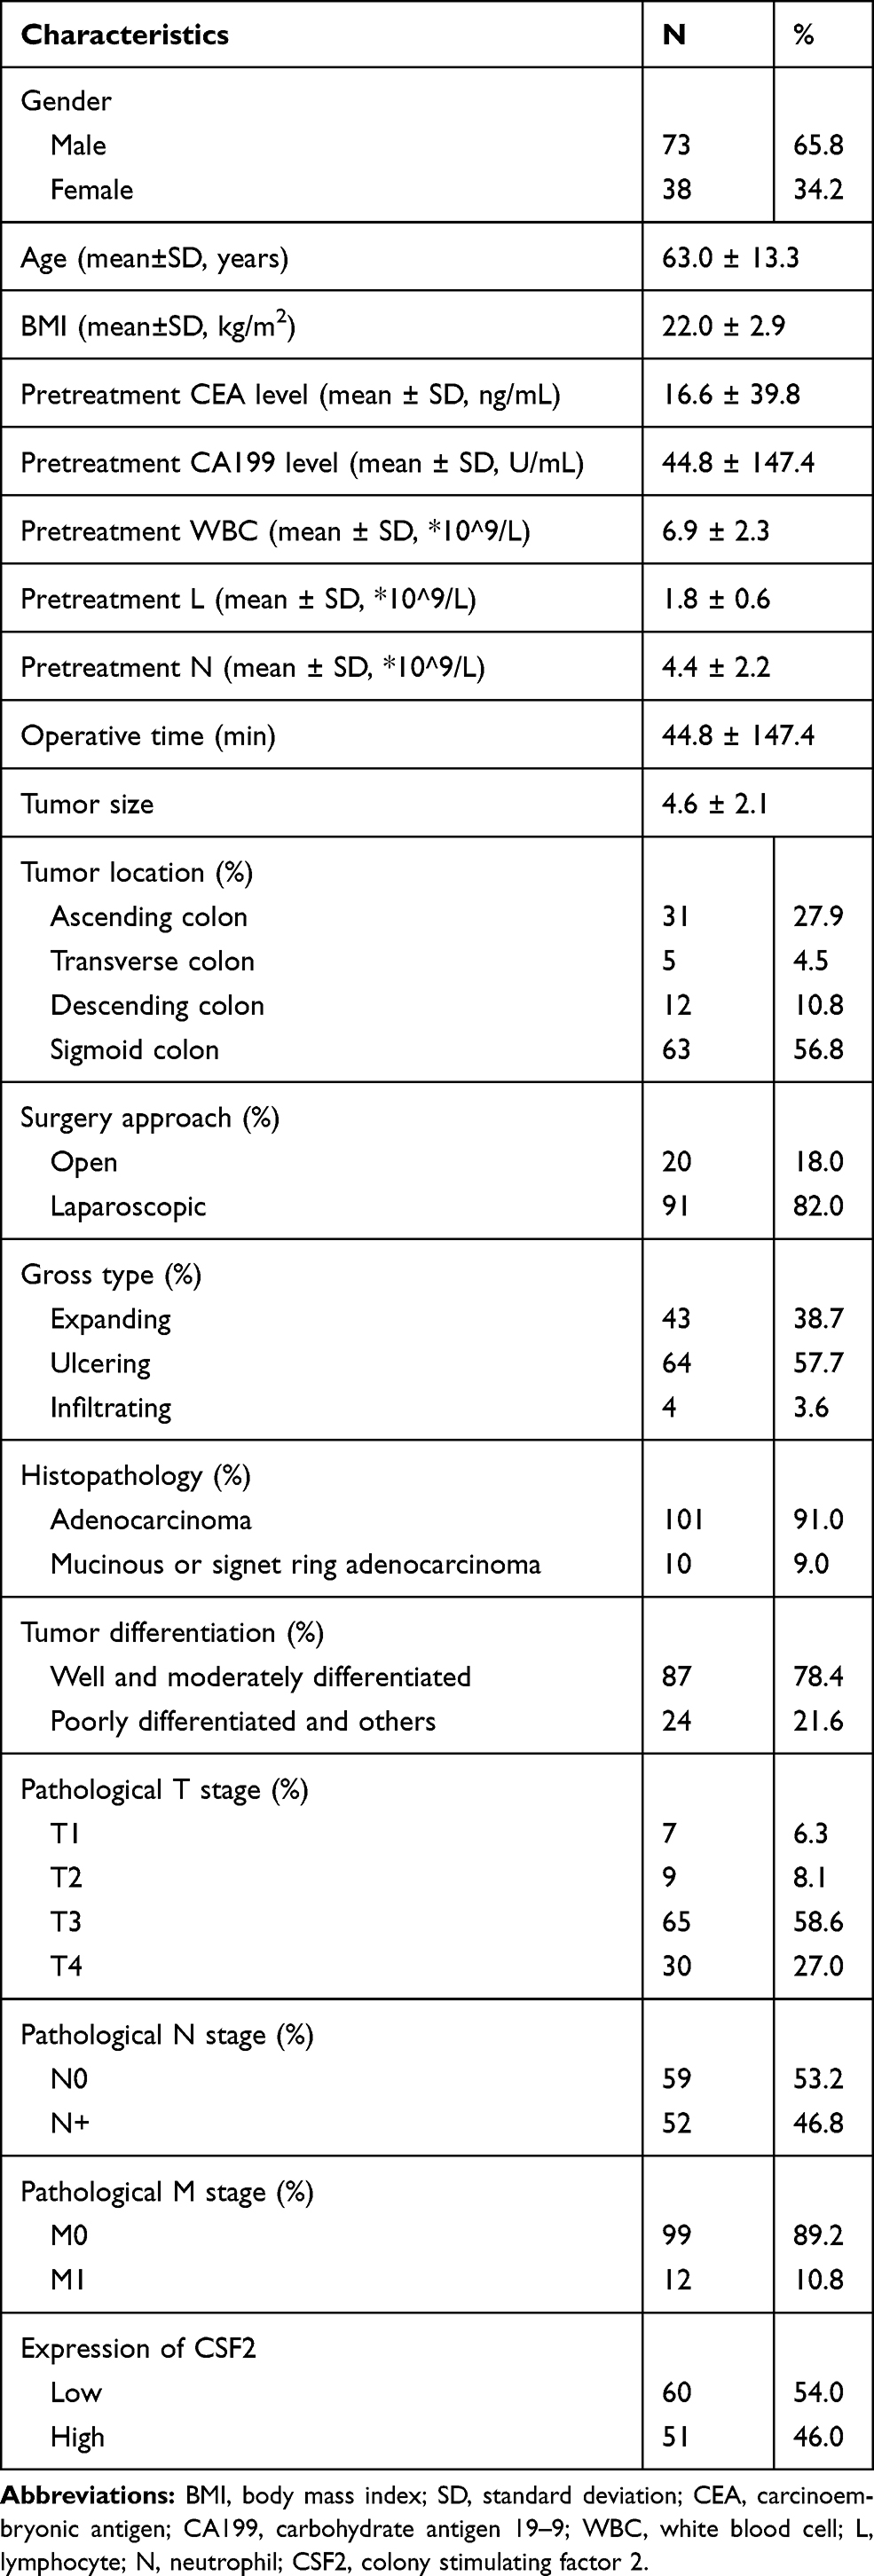 |
Table 1 Baseline Characteristics of Patients with Colon Cancer |
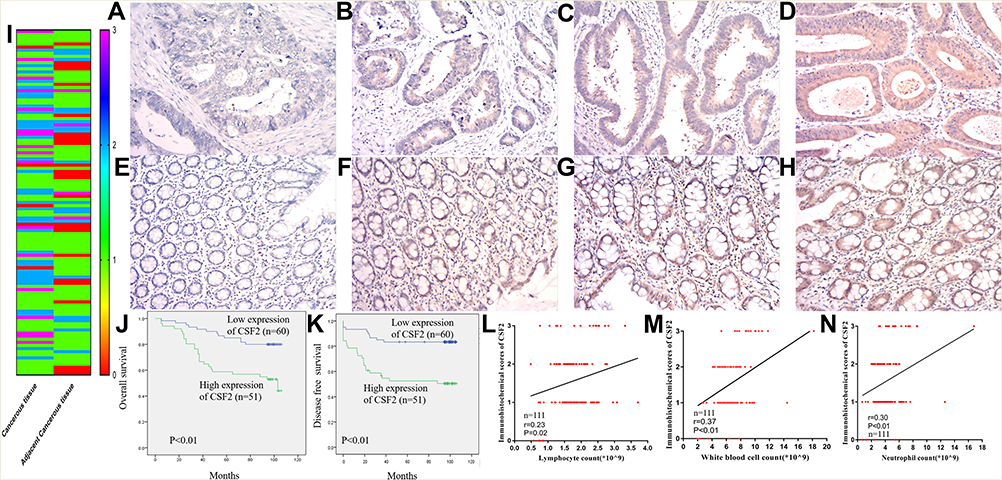 |
Figure 6 CSF2 expression and prognosis in our data. Notes: Representative figures of CSF2 expression cancerous (A–D) and adjacent cancerous (E–H) colon tissues. The immunohistochemical score of FZD7 in cancerous and adjacent cancerous tissue (I) (n=111). Kaplan-Meier curves for colon cancer patients stratified by the expression level of CSF2 (n=60 in low expression of CSF2, n=51 in high expression of CSF2), (J) overall survival; (K) disease-free survival. Co-expression analysis between CSF2 expression and lymphocytes count (L), white blood cell count (M) and neutrophils count (N) (n=111). |
We further explored the association between the CSF2 expression and clinicopathological characteristics of colon cancer patients, as demonstrated in Table 1. Low CSF2 expression was more often observed in non-lymph node metastatic colon cancer patients (65%), compared with CSF2 expression (41.2%, P = 0.014). High CSF2 expression was significantly associated with older age, higher CEA level, and higher CA199 level in colon cancers (P = 0.038; P = 0.023; P = 0.036). However, CSF2 expression had no significant association with gender, BMI, preoperative white blood cell (WBC) count, neutrophil count, lymphocyte count, tumor location, gross type, histopathology, histologic differentiation, tumor size, surgery approach, operative time, and pathological stage (all P > 0.05), as shown in Table 2.
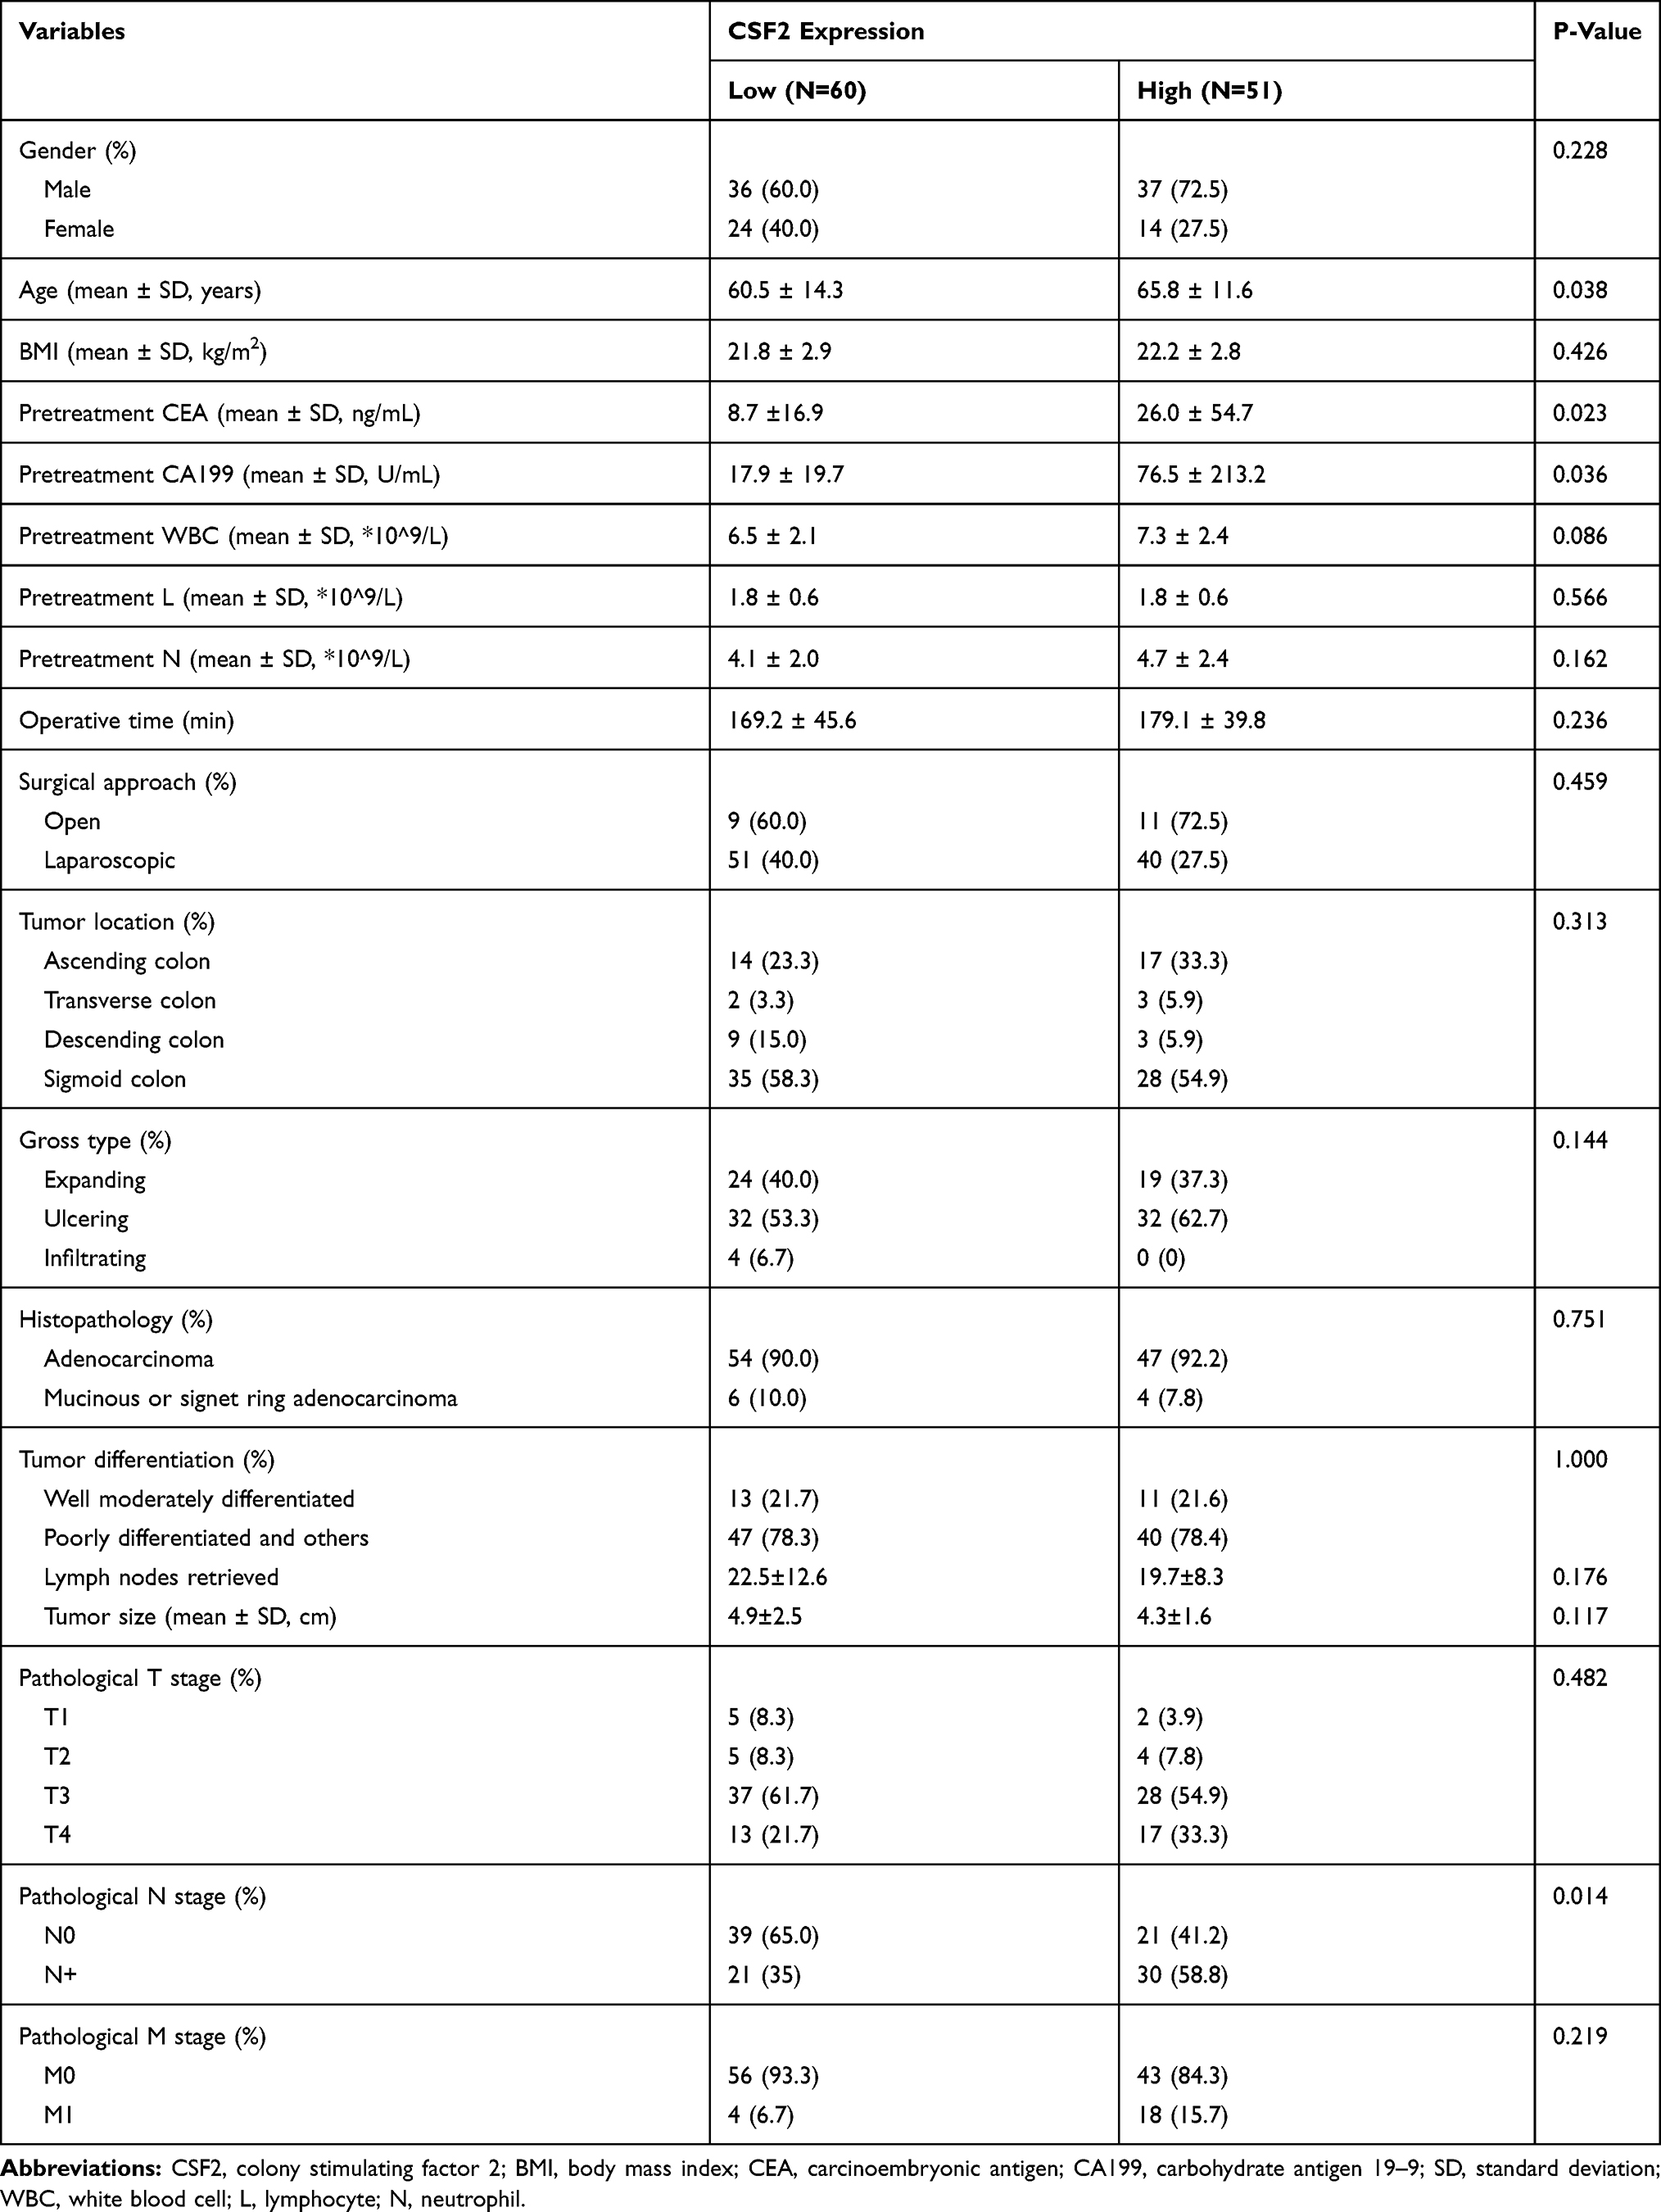 |
Table 2 Association Between CSF2 Expression and Clinicopathological Characteristics in Colon Cancer Patients |
Kaplan–Meier survival analysis demonstrated that colon cancer patients with high CSF2 expression showed significantly poorer OS (P < 0.01) and DFS (P < 0.01) rates than those with low CSF2 expression, as shown in Figure 6J and K. Following this, univariate and multivariate analyses were performed to identify independent predictive factors for DFS and OS in patients with colon cancer using a Cox proportional-hazard model (Table 2). On univariate analysis, BMI (P = 0.046) and preoperative CEA level (P < 0.01) were found to be independent prognostic factors for DFS. The pathological N stage (DFS: HR 2.869, P < 0.01; OS: HR 2.049, P < 0.01), pathological T stage (DFS: HR 1.832, P = 0.021; OS: HR 2.459, P < 0.01), and CSF2 expression level (DFS: HR 2.459, P = 0.017; OS: HR, 3.073, P < 0.01) were prognostic factors for both DFS and OS. On multivariate analyses, CSF2 expression remained to be an independent prognostic factor for DFS (P = 0.034) and OS (P = 0.013), as shown in Table 3.
 |
Table 3 Univariate and Multivariate Analyses of the Risk Factors of DFS and OS in Patients with Colon Cancer |
We further validated the relationship between CSF2 expression and peripheral blood inflammatory cell count. We performed Pearson correlation analysis to explore the correlations between CSF2 immunohistochemical score and preoperative WBC count, neutrophil count, and lymphocyte count. As shown in Figure 6L–N, CSF2 expression was significantly associated with immune response in colon cancer patients (WBC, R = 0.37, P < 0.01; N, R=0.30, P < 0.01; L, R = 0.23, P = 0.02).
Discussion
To the best of our knowledge, this study for the first time identified CSF2 as a novel biomarker for FOLFOX/CapeOX resistance by RNA-Seq and multiple bioinformatics analysis. In addition, CSF2 was validated using our dataset. We demonstrated that the mechanism underlying CSF2-mediated chemotherapy resistance may be involved in the immune response.
Reliable molecular markers for FOLFOX/CapeOX regimen resistance in CRC patients are currently unavailable. In the present study, we first established and characterized L-OHP- and 5-FU-resistant cell lines, and performed RNA-Seq to identify reliable molecular markers for FOLFOX/CapeOX resistance. To further explore reliable molecular markers, CSF2 was selected by PPI network and MOCDE analyses, and verified by qRT-PCR. Then, CSF2 was defined as the hub gene in FOLFOX/CapeOX chemotherapy resistance. CSF2 is a cytokine functioning as a hematologic cell growth factor, stimulating stem cells to produce granulocytes and monocytes.7,8 Previous studies have demonstrated that the CSF2 signaling pathway plays a role in tumor progression via immunoreaction.9,10 However, results regarding the role of CSF2 in tumor progression were conflicting in the literature. Some studies have shown an anti-proliferative effect of CSF2 on tumors, whereas others have revealed that CSF2 could promote tumor growth.19–22 Some reports have indicated that CSF2 activates the immune response in response to systemic inflammation and acts as an anti-tumor factor in severe tumors, including skin cancer, melanoma, and CRC.19–21,23 Current evidence has revealed different roles of CSF2 in the tumor microenvironment.9,24,25 By using immunohistochemical analysis, we demonstrated that CSF2 expression was higher in the tumor tissue than in the adjacent normal tissue. Moreover, high expression of CSF2 indicated worse OS and DFS in colon cancer patients, which was further verified by analyzing data from the Oncomine database and R2 platform. In addition, previous studies have demonstrated that increased CSF2 expression promoted tumor growth, epithelial-mesenchymal transition, and metastasis in several cancers.26,27 Together, these findings suggest that CSF2 acts as an oncogene in colon cancer.
DNA methylation is a major epigenetic modification in the mammalian genome, and may affect sensitivity to chemotherapy.28–31 Several studies have reported that dysregulation of DNA methylation can promote oncogene expression and chemotherapy resistance.32–34 In the present study, we found CSF2 demethylation in the promoter sites in both colon and rectal cancer tissues. These results suggested that CSF2 demethylation resulted in increased CSF2 expression in CRC. Similarly, a previous study has demonstrated that CSF2 demethylation promotes high CSF2 expression in the tumor tissue in a mouse colon cancer model.20 Taken together, these results indicate that CSF2 may act as an oncogene in colon cancer and this might result from CSF2 demethylation.
Several studies have reported that TAM enrichment in the cancer microenvironment and polarization to M2 macrophages may act as a pro-tumorigenic factor.35–37 CSF2 plays an important role in the polarization and activation of TAMs and affects the immune response in the cancer microenvironment in several cancers.11–13 To further verify whether CSF2 can act as an oncogene in colon cancer, GSEA was performed and the potential mechanism was evaluated. The results demonstrated that CSF2 was associated with the immune response, which was in accordance with the finding that CSF2 can act as an immune mediator in cancer patients.9,10 In addition, by using co-expression and immune cell analysis, we found similar results in the TCGA and TIMER datasets. Similar results were also obtained in our data; we revealed that CSF2 expression was associated with WBC, lymphocyte, and neutrophil counts. In addition, there are several ongoing clinical trials using CSF2 as therapeutic target against immune diseases.37–39 Collectively, these results demonstrate that high CSF2 expression affects the immune response to tumor cells and tumor microenvironment, thereby indicating chemotherapy resistance and worse prognosis.
There were some limitations to the current study. The function and involved pathways of CSF2 were evaluated by RNA-Seq and bioinformatics methods; however; they needed to be further validated by in vitro and in vivo experimental studies in future research, such as gain-of-function and loss-of-function experiments and xenograft animal studies. Additionally, the sample size was relatively small in some datasets in the R2 analysis. Nevertheless, our study may provide insights that help understanding the potential role of CSF2 in immune response, chemotherapy resistance, and poor prognosis in CRC.
In conclusion, we analyzed the mRNA expression of L-OHP- and 5-FU-resistant cell lines by RNA-Seq and revealed the real hub gene via PPI degree, MOCDE score, and DEGs analyses. We also identified and validated CSF2 as a novel biomarker and a prognostic factor for the survival of CRC patients, and demonstrated that CSF2 overexpression in CRC patients may be cause by DNA demethylation. These results were of great clinical significance to identify CRC patients suitable for FOLFOX/CapeOX chemotherapy. The mechanism behind CSF2-mediated chemotherapy resistance may be associated with the immune response. Nevertheless, research focused on more insightful molecular mechanisms is warranted in future studies. Based on our study, CSF2 was associated with chemotherapy resistance and immune response in the colon cancer patients.
Ethics Statement
The Fujian Medical University Union Hospital Ethics Committee approved this study (2013051), and all patients provided written informed consent for the scientific use of the clinical tissue samples.
Disclosure
The authors report no conflicts of interest in this work.
References
1. Edwards BK, Noone AM, Mariotto AB, et al. Annual report to the nation on the status of cancer, 1975–2010, featuring prevalence of comorbidity and impact on survival among persons with lung, colorectal, breast, or prostate cancer. Cancer. 2014;120(9):1290–1314. doi:10.1002/cncr.28509
2. Weitz J, Koch M, Debus J, Höhler T, Galle PR, Büchler MW. Colorectal cancer. Lancet. 2005;365(9454):153–165. doi:10.1016/S0140-6736(05)17706-X
3. Binnemars-Postma K, Bansal R, Storm G, Prakash J. Targeting the Stat6 pathway in tumor-associated macrophages reduces tumor growth and metastatic niche formation in breast cancer. FASEB J. 2018;32(2):969–978. doi:10.1096/fj.201700629R
4. Georgoudaki AM, Prokopec KE, Boura VF, et al. Reprogramming tumor-associated macrophages by antibody targeting inhibits cancer progression and metastasis. Cell Rep. 2016;15(9):2000–2011. doi:10.1016/j.celrep.2016.04.084
5. Silva VL, Al-Jamal WT. Exploiting the cancer niche: tumor-associated macrophages and hypoxia as promising synergistic targets for nano-based therapy. J Control Release. 2017;253:82–96. doi:10.1016/j.jconrel.2017.03.013
6. Farajzadeh VS, Keshavarz-Fathi M, Silvestris N, Argentiero A, Rezaei N. The role of inflammatory cytokines and tumor associated macrophages (TAMs) in microenvironment of pancreatic cancer. Cytokine Growth Factor Rev. 2018;39:46–61. doi:10.1016/j.cytogfr.2018.01.007
7. Metcalf D, Begley CG, Johnson GR, et al. Biologic properties in vitro of a recombinant human granulocyte-macrophage colony-stimulating factor. Blood. 1986;67(1):37–45. doi:10.1182/blood.V67.1.37.37
8. Smith BR. Regulation of hematopoiesis. Yale J Biol Med. 1990;63(5):371–380.
9. Lee YY, Wu WJ, Huang CN, et al. CSF2 overexpression is associated with STAT5 phosphorylation and poor prognosis in patients with urothelial carcinoma. J Cancer. 2016;7(6):711–721. doi:10.7150/jca.14281
10. Hong IS. Stimulatory versus suppressive effects of GM-CSF on tumor progression in multiple cancer types. Exp Mol Med. 2016;48(7):e242. doi:10.1038/emm.2016.64
11. Mantovani A, Sozzani S, Locati M, Allavena P, Sica A. Macrophage polarization: tumor-associated macrophages as a paradigm for polarized M2 mononuclear phagocytes. Trends Immunol. 2002;23(11):549–555. doi:10.1016/S1471-4906(02)02302-5
12. Joshi S, Singh AR, Zulcic M, et al. Rac2 controls tumor growth, metastasis and M1-M2 macrophage differentiation in vivo. PLoS One. 2014;9(4):e95893. doi:10.1371/journal.pone.0095893
13. Zhang W, Zhu XD, Sun HC, et al. Depletion of tumor-associated macrophages enhances the effect of sorafenib in metastatic liver cancer models by antimetastatic and antiangiogenic effects. Clin Cancer Res. 2010;16(13):3420–3430. doi:10.1158/1078-0432.CCR-09-2904
14. Zhang Y, Xu Z, Sun Y, Chi P, Lu X. Knockdown of KLK11 reverses oxaliplatin resistance by inhibiting proliferation and activating apoptosis via suppressing the PI3K/AKT signal pathway in colorectal cancer cell. Onco Targets Ther. 2018;11:809–821. doi:10.2147/OTT
15. Trapnell C, Williams BA, Pertea G, et al. Transcript assembly and quantification by RNA-Seq reveals unannotated transcripts and isoform switching during cell differentiation. Nat Biotechnol. 2010;28(5):511–515. doi:10.1038/nbt.1621
16. Huang WY, Hsu SD, Huang HY, et al. MethHC: a database of DNA methylation and gene expression in human cancer. Nucleic Acids Res. 2015;43(Database issue):D856–D861. doi:10.1093/nar/gku1151
17. Li T, Fan J, Wang B, et al. TIMER: a web server for comprehensive analysis of tumor-infiltrating immune cells. Cancer Res. 2017;77(21):e108–108e110. doi:10.1158/0008-5472.CAN-17-0307
18. Li B, Severson E, Pignon JC, et al. Comprehensive analyses of tumor immunity: implications for cancer immunotherapy. Genome Biol. 2016;17(1):174. doi:10.1186/s13059-016-1028-7
19. Obermueller E, Vosseler S, Fusenig NE, Mueller MM. Cooperative autocrine and paracrine functions of granulocyte colony-stimulating factor and granulocyte-macrophage colony-stimulating factor in the progression of skin carcinoma cells. Cancer Res. 2004;64(21):7801–7812. doi:10.1158/0008-5472.CAN-03-3301
20. Urdinguio RG, Fernandez AF, Moncada-Pazos A, et al. Immune-dependent and independent antitumor activity of GM-CSF aberrantly expressed by mouse and human colorectal tumors. Cancer Res. 2013;73(1):395–405. doi:10.1158/0008-5472.CAN-12-0806
21. Aliper AM, Frieden-Korovkina VP, Buzdin A, Roumiantsev SA, Zhavoronkov A. A role for G-CSF and GM-CSF in nonmyeloid cancers. Cancer Med. 2014;3(4):737–746. doi:10.1002/cam4.2014.3.issue-4
22. Roda JM, Wang Y, Sumner LA, Phillips GS, Marsh CB, Eubank TD. Stabilization of HIF-2α induces sVEGFR-1 production from tumor-associated macrophages and decreases tumor growth in a murine melanoma model. J Immunol. 2012;189(6):3168–3177. doi:10.4049/jimmunol.1103817
23. Meyer C, Sevko A, Ramacher M, et al. Chronic inflammation promotes myeloid-derived suppressor cell activation blocking antitumor immunity in transgenic mouse melanoma model. Proc Natl Acad Sci U S A. 2011;108(41):17111–17116. doi:10.1073/pnas.1108121108
24. Lee JS, Leem SH, Lee SY, et al. Expression signature of E2F1 and its associated genes predict superficial to invasive progression of bladder tumors. J Clin Oncol. 2010;28(16):2660–2667. doi:10.1200/JCO.2009.25.0977
25. Sanchez-Carbayo M, Socci ND, Lozano J, Saint F, Cordon-Cardo C. Defining molecular profiles of poor outcome in patients with invasive bladder cancer using oligonucleotide microarrays. J Clin Oncol. 2006;24(5):778–789. doi:10.1200/JCO.2005.03.2375
26. Mueller MM, Peter W, Mappes M, et al. Tumor progression of skin carcinoma cells in vivo promoted by clonal selection, mutagenesis, and autocrine growth regulation by granulocyte colony-stimulating factor and granulocyte-macrophage colony-stimulating factor. Am J Pathol. 2001;159(4):1567–1579. doi:10.1016/S0002-9440(10)62541-2
27. Su S, Liu Q, Chen J, et al. A positive feedback loop between mesenchymal-like cancer cells and macrophages is essential to breast cancer metastasis. Cancer Cell. 2014;25(5):605–620. doi:10.1016/j.ccr.2014.03.021
28. Wilting RH, Dannenberg JH. Epigenetic mechanisms in tumorigenesis, tumor cell heterogeneity and drug resistance. Drug Resist Updat. 2012;15(1–2):21–38. doi:10.1016/j.drup.2012.01.008
29. Ivanova T, Zouridis H, Wu Y, et al. Integrated epigenomics identifies BMP4 as a modulator of cisplatin sensitivity in gastric cancer. Gut. 2013;62(1):22–33. doi:10.1136/gutjnl-2011-301113
30. Baylin SB, Esteller M, Rountree MR, Bachman KE, Schuebel K, Herman JG. Aberrant patterns of DNA methylation, chromatin formation and gene expression in cancer. Hum Mol Genet. 2001;10(7):687–692. doi:10.1093/hmg/10.7.687
31. Herman JG, Baylin SB. Gene silencing in cancer in association with promoter hypermethylation. N Engl J Med. 2003;349(21):2042–2054. doi:10.1056/NEJMra023075
32. Liang G, Weisenberger DJ. DNA methylation aberrancies as a guide for surveillance and treatment of human cancers. Epigenetics. 2017;12(6):416–432. doi:10.1080/15592294.2017.1311434
33. Zeller C, Dai W, Steele NL, et al. Candidate DNA methylation drivers of acquired cisplatin resistance in ovarian cancer identified by methylome and expression profiling. Oncogene. 2012;31(42):4567–4576. doi:10.1038/onc.2011.611
34. Wang W, Li X, Wang F, Sun XY. Effect of TET1 regulating MGMT on chemotherapy resistance of oral squamous cell carcinoma stem cells. J Cell Biochem. 2018;119(1):723–735. doi:10.1002/jcb.26236
35. Jia JB, Wang WQ, Sun HC, et al. High expression of macrophage colony-stimulating factor-1 receptor in peritumoral liver tissue is associated with poor outcome in hepatocellular carcinoma after curative resection. Oncologist. 2010;15(7):732–743. doi:10.1634/theoncologist.2009-0170
36. Goswami S, Sahai E, Wyckoff JB, et al. Macrophages promote the invasion of breast carcinoma cells via a colony-stimulating factor-1/epidermal growth factor paracrine loop. Cancer Res. 2005;65(12):5278–5283. doi:10.1158/0008-5472.CAN-04-1853
37. Wyckoff J, Wang W, Lin EY, et al. A paracrine loop between tumor cells and macrophages is required for tumor cell migration in mammary tumors. Cancer Res. 2004;64(19):7022–7029. doi:10.1158/0008-5472.CAN-04-1449
38. Taylor PC, Saurigny D, Vencovsky J, et al. Efficacy and safety of namilumab, a human monoclonal antibody against granulocyte-macrophage colony-stimulating factor (GM-CSF) ligand in patients with rheumatoid arthritis (RA) with either an inadequate response to background methotrexate therapy or an inadequate response or intolerance to an anti-TNF (tumour necrosis factor) biologic therapy: a randomized, controlled trial. Arthritis Res Ther. 2019;21(1):101.
39. Sterner RM, Sakemura R, Cox MJ, et al. GM-CSF inhibition reduces cytokine release syndrome and neuroinflammation but enhances CAR-T cell function in xenografts. Blood. 2019;133(7):697–709. doi:10.1182/blood-2018-10-881722
 © 2019 The Author(s). This work is published and licensed by Dove Medical Press Limited. The full terms of this license are available at https://www.dovepress.com/terms.php and incorporate the Creative Commons Attribution - Non Commercial (unported, v3.0) License.
By accessing the work you hereby accept the Terms. Non-commercial uses of the work are permitted without any further permission from Dove Medical Press Limited, provided the work is properly attributed. For permission for commercial use of this work, please see paragraphs 4.2 and 5 of our Terms.
© 2019 The Author(s). This work is published and licensed by Dove Medical Press Limited. The full terms of this license are available at https://www.dovepress.com/terms.php and incorporate the Creative Commons Attribution - Non Commercial (unported, v3.0) License.
By accessing the work you hereby accept the Terms. Non-commercial uses of the work are permitted without any further permission from Dove Medical Press Limited, provided the work is properly attributed. For permission for commercial use of this work, please see paragraphs 4.2 and 5 of our Terms.