")
Back to Journals » OncoTargets and Therapy » Volume 13
Deficiency of PTEN and CDKN2A Tumor-Suppressor Genes in Conventional and Chondroid Chordomas: Molecular Characteristics and Clinical Relevance
Authors Yang C , Sun J, Yong L, Liang C, Liu T, Xu Y, Yang J, Liu X
Received 8 March 2020
Accepted for publication 11 May 2020
Published 25 May 2020 Volume 2020:13 Pages 4649—4663
DOI https://doi.org/10.2147/OTT.S252990
Checked for plagiarism Yes
Review by Single anonymous peer review
Peer reviewer comments 3
Editor who approved publication: Dr Federico Perche
Chenlong Yang, 1,* Jianjun Sun, 2,* Lei Yong, 1 Chen Liang, 1 Tie Liu, 3 Yulun Xu, 3 Jun Yang, 2 Xiaoguang Liu 1
1Department of Orthopedics, Peking University Third Hospital, Beijing 100191, People’s Republic of China; 2Department of Neurosurgery, Peking University Third Hospital, Beijing 100191, People’s Republic of China; 3Department of Neurosurgery, China National Clinical Research Center for Neurological Diseases, Beijing Tiantan Hospital, Capital Medical University, Beijing 100070, People’s Republic of China
*These authors contributed equally to this work
Correspondence: Xiaoguang Liu; Jun Yang Email [email protected]; [email protected]
Introduction: Chordoma is a malignant tumor predominantly involving the skull base and vertebral column. This study aimed to investigate the molecular characteristics of PTEN and CDKN2A in conventional and chondroid chordomas and their correlation with clinical prognosis.
Materials and Methods: A total of 42 patients were enrolled, including 26 patients with conventional chordoma and 16 patients with chondroid chordoma. Clinicopathological profiles and tissue specimens were collected. Gene sequencing and fluorescence in situ hybridization were performed to identify genetic alterations in the PTEN and CDKN2A genes. Immunohistochemical staining was used for semiquantitative evaluation of PTEN and CDKN2A expression.
Results: Gene sequencing revealed an intron SNP (c.80– 96A>G) and a missense mutation (c.10G>A; p.Gly4Arg) in the PTEN gene and a missense mutation (c.442G>A; p.Ala148Thr) in the CDKN2A gene. Loss of the PTEN locus was identified in 25 (59.5%) cases, and loss of the CDKN2A locus was found in 28 (66.7%) cases. There was no significant correlation between progression-free survival (PFS)/overall survival (OS) and loss of PTEN or CDKN2A. The patients with lower PTEN expression showed significantly shorter PFS and OS than those with higher expression, while there was no significant difference in PFS or OS between patients with lower CDKN2A expression and those with higher CDKN2A expression.
Conclusion: Our findings delineated the genetic landscape and expression of PTEN and CDKN2A in chordomas. PTEN expression may serve as a prognostic and predictive biomarker for chordomas.
Keywords: chordoma, PTEN, CDKN2A, gene sequencing, fluorescence in situ hybridization, prognosis
Introduction
Chordoma is a rare, slow-growing, and locally invasive malignant skeletal tumor that occurs most commonly at the skull base and vertebral column.1 This entity is presumed to derive from remnants of the embryonic notochord, and the annual incidence is estimated to range from 0.51 to 8 per million population.2 Surgical resection is the mainstay of treatment modalities for chordoma, as chordoma is resistant to conventional chemotherapy and radiotherapy. However, despite aggressive surgical resection, chordoma still has a high local recurrence rate, and the clinical prognosis remains poor. The reported 5-year survival rate of patients with chordoma varies from 47% to 80%,2 and the overall median survival is approximately only 6 years.3 To date, the molecular and genetic mechanisms of chordoma have not been fully elucidated; in particular, there is a paucity of research on the genetic aberrations in distinct histological subtypes (conventional, chondroid, and dedifferentiated). Identification of molecular hallmarks in these subtypes may provide insight into potential novel therapies.
In 2001, Scheil et al raised the first human chordoma cell line (U‐CH1), and they found that U-CH1 had del(9) and del(10) chromosomal abnormalities.4 Subsequently, Kuźniacka et al also noted loss of 9p and chromosome 10 in chordomas.5 Chromosome 9p harbors the tumor-suppressor gene CDKN2A (cyclin-dependent kinase inhibitor 2A; located on chromosome 9p21), which encodes the cell cycle regulatory protein p16; PTEN (phosphatase and tensin homolog), another tumor-suppressor gene, is located on chromosome 10q23.3. In the last decade, accumulating evidence indicates that deficiency of PTEN and CDKN2A is common in chordomas.6–9 However, the genetic alterations of PTEN and CDKN2A in distinct histological subtypes of chordoma remain unclear, and the correlation between loss of these tumor-suppressor genes and clinical prognosis is still controversial. In this study, we aimed to investigate the molecular characteristics of PTEN and CDKN2A in conventional and chondroid chordomas and their clinical relevance.
Materials and Methods
Patients and Tumor Specimens
This study was approved by the Institutional Review Board (IRB) of Peking University Third Hospital. A total of 42 patients with chordoma were enrolled. All patients underwent surgical resection at our department, and the histopathological diagnosis was conventional chordoma in 26 patients and chondroid chordoma in 16 patients. Individual clinical and pathological profiles were collected, and histopathological sections were reviewed by two pathologists independently. Tissue specimens were obtained from all patients.
Immunohistochemical (IHC) Staining
IHC staining for PTEN and CDKN2A was performed in formalin-fixed and paraffin-embedded tissue specimens. After baking at 60°C for 30 min, the sections (4 μm) were deparaffinized with dimethylbenzene and hydrated in a graded ethanol series. Antigen retrieval was performed in Tris-EDTA buffer, and then the slides were treated with 0.3% H2O2 to block endogenous peroxide. After incubation with the primary antibody (anti-PTEN antibody, ab31392, 1:100 dilution; anti-CDKN2A antibody, ab54210, 1:500 dilution; Abcam, Cambridge, MA, USA) at 4°C overnight, visible staining was developed using the DAB Horseradish Peroxidase Color Development Kit (Beyotime Institute of Biotechnology, Shanghai, China) according to the manufacturer’s protocol. Finally, the slides were counterstained with hematoxylin, dehydrated, cleared and mounted. Breast and ovarian carcinoma tissues with known positivity for the antibodies were used as positive controls. For negative controls, the primary antibodies were replaced with phosphate-buffered saline.
IHC results were evaluated according to the scoring method proposed by Sinicrope et al,10 based on both the percentage of immunoreactive tumor cells and the intensity of staining. The percentage of tumor cells positive for PTEN or CDKN2A was scored as follows: 0 (no specific staining or staining in <10% of tumor cells); 1 (staining in 11%~25% of tumor cells); 2 (staining in 26%~50% of tumor cells); 3 (staining in 51%~75% of tumor cells); and 4 (staining in >75% of tumor cells). The intensity of immunoreactivity was graded as follows: 0 (no staining); 1 (weak staining); 2 (moderate staining); and 3 (strong staining). The final immunoreactivity score was the product of these two indices, with values ranging from 0 to 12. The median immunoreactivity score was set as the cutoff value for the classification of low and high expression.
Gene Sequencing
Genomic DNA was extracted from frozen tissue samples using a QIAamp DNA Mini Kit (Qiagen, Hilden, Germany) or from paraffin-embedded samples using a GeneRead DNA FFPE Kit (Qiagen) according to the manufacturer’s instructions. Primers were designed using OLIGO Primer Analysis Software (version 7, Molecular Biology Insights, Cascade, CO, USA) and synthesized by Sangon Biological Technology (Shanghai, China). All annotated exons and adjacent introns of PTEN (OMIM: 601728) and CDKN2A (OMIM: 600160) were amplified, and Sanger sequencing was performed. The single-nucleotide polymorphism (SNP) information of detected genetic variations was retrieved from the NCBI dbSNP database (http://www.ncbi.nlm.nih.gov/snp/). Known disease-associated mutations in the PTEN and CDKN2A genes were retrieved from the Human Gene Mutation Database (HGMD; http://www.hgmd.cf.ac.uk/ac/index.php).
Fluorescence in situ hybridization (FISH)
Dual-color interphase FISH was conducted on 4-μm paraffin-embedded tissue sections. The sections were pretreated with the FFPE FISH PreTreatment Kit (Abnova, Taipei, Taiwan). FISH was performed using the PTEN/CEN10p or CDKN2A/CEN9q probe (Abnova) according to the instructions of the manufacturer. Then, the sections were counterstained with 0.1 μM 4.6-diamidino-2-phenylindole (DAPI) for fluorescence microscopy observation, and a total of 200 interphase nuclei were analyzed for each specimen.
Follow-Up
Follow-up data for all patients were obtained during individual office visits or telephone interviews, with a mean follow-up time of 71.5±44.0 months (range 8–156 months). Radiological images, clinical symptoms, and survival status were evaluated. Progression-free survival (PFS) was defined as the interval between the first surgery to the date of tumor progression or tumor-related death. Overall survival (OS) was defined as the interval between the first surgery and the date of death from any cause.
Statistical Analysis
All statistical analyses were performed using SPSS software 25.0 (IBM, Armonk, NY, USA) and GraphPad Prism 8.0 (GraphPad, La Jolla, CA, USA). Continuous variables were expressed as the mean ± standard deviation (SD) when normally distributed or medians (interquartile ranges, IQR) when nonnormally distributed. Categorical values were presented as frequencies (percentage, %). Median PFS and OS were estimated using the Kaplan–Meier method and compared using the Log rank test. Normal distribution was tested using a D’Agostino and Pearson omnibus normality test. Chi-square tests and independent-sample Student’s t tests were performed to determine the correlation between molecular characteristics and clinicopathological features. All analyses were two-sided, and the statistically significant level was set at 0.05.
Results
Clinicopathological Characteristics
The demographic and clinical characteristics of patients with chordoma are summarized in Table 1. Histopathologically, conventional chordomas were composed of physaliferous cells arranged in nests or clusters embedded in a myxoid matrix, and the tumor cells were separated by fibrous septa into lobules (Figure 1A); chondroid chordomas exhibited islands of hyaline-type chondroid or cartilaginous matrix in addition to conventional chordoma appearance (Figure 1B). There was no significant difference in age (P=0.618), sex (P=0.835), maximal diameter of the tumor (P=0.273), surrounding tissue invasion (P=0.636), or recurrence rate (P=1.000) between patients with conventional chordoma and those with chondroid chordoma. Conventional chordoma was more common in the cervical spine, and chondroid chordoma was more common in the sacrococcygeal region (P=0.031). Kaplan–Meier survival curves revealed no significant difference in PFS or OS between patients with conventional chordoma and those with chondroid chordoma (median PFS: 120 months vs 109 months, P=0.605; median OS: 120 months vs 118 months, P=0.652).
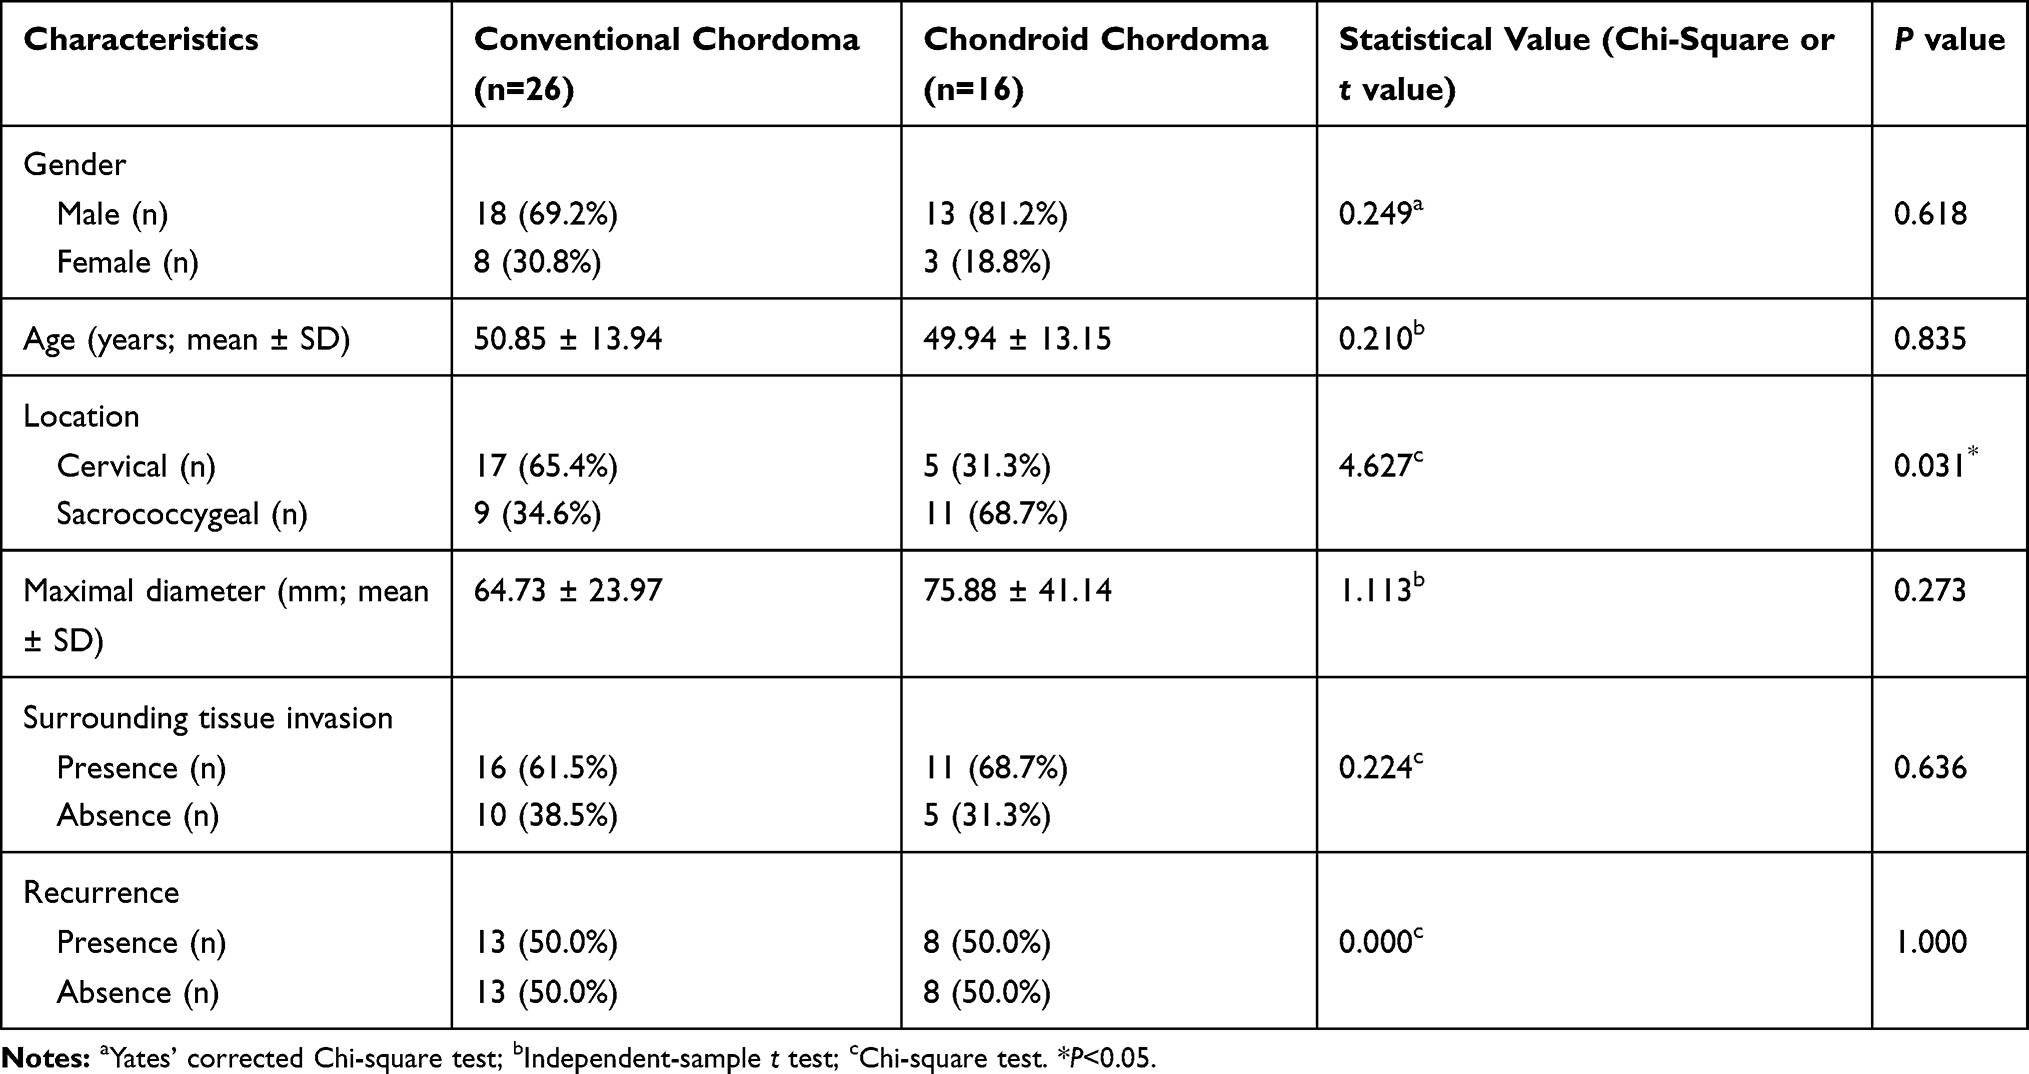 |
Table 1 Clinical Characteristics of Patients with Chordomas |
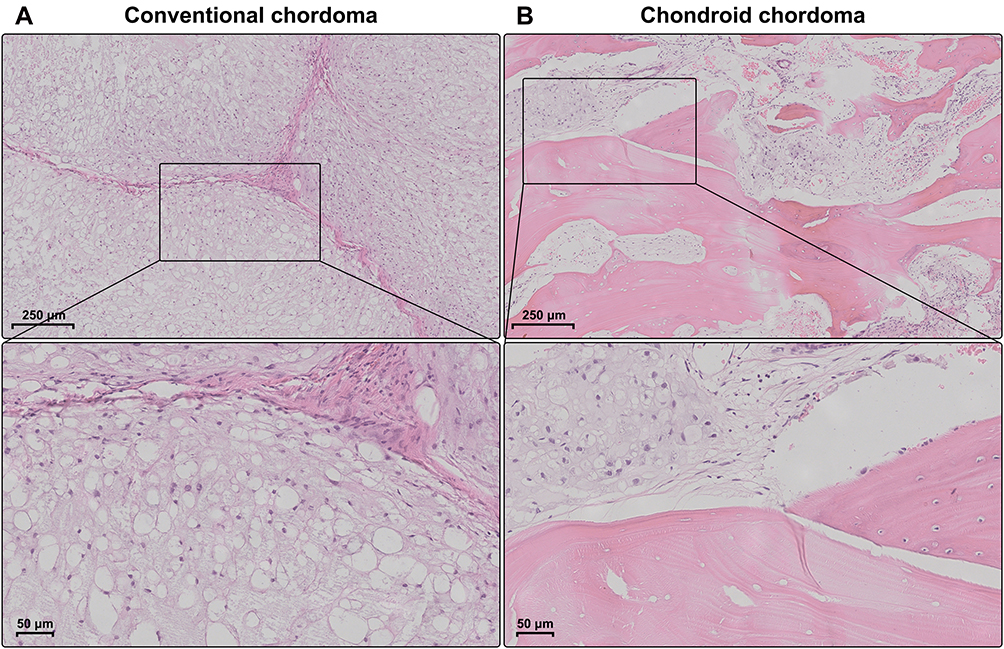 |
Figure 1 Histopathology of chordomas. (A) Conventional chordomas were composed of physaliferous cells that were separated by fibrous septa into lobules. (B) Chondroid chordomas exhibited islands of hyaline-type chondroid or cartilaginous matrix in addition to conventional chordoma appearance. |
Genetic Alterations of PTEN and CDKN2A
Gene sequencing revealed an intron SNP (c.80–96A>G) and a missense mutation (c.10G>A; p.Gly4Arg) in the PTEN gene (Figure 2A and B). The intron SNP was identified in 15 (35.7%) patients; the corresponding allele frequency reported in the dbSNP database is ~38.9% (TOPMed Project; not adjusted for ethnicity). The missense mutation c.10G>A was identified in 18 (42.9%) patients, which was significantly higher than the reported allele frequency (~13.5%; TOPMed Project; not adjusted for ethnicity) in the dbSNP database. Additionally, a missense mutation (c.442G>A; p.Ala148Thr) was identified in the CDKN2A gene in three patients (7.1%) (Figure 2C); the corresponding allele frequency in the dbSNP database was only ~2.1% (TOPMed Project; not adjusted for ethnicity). The mutation c.442G>A in CDKN2A has been identified to be disease-associated in the HGMD database. The genetic landscape was presented in Figure 3.
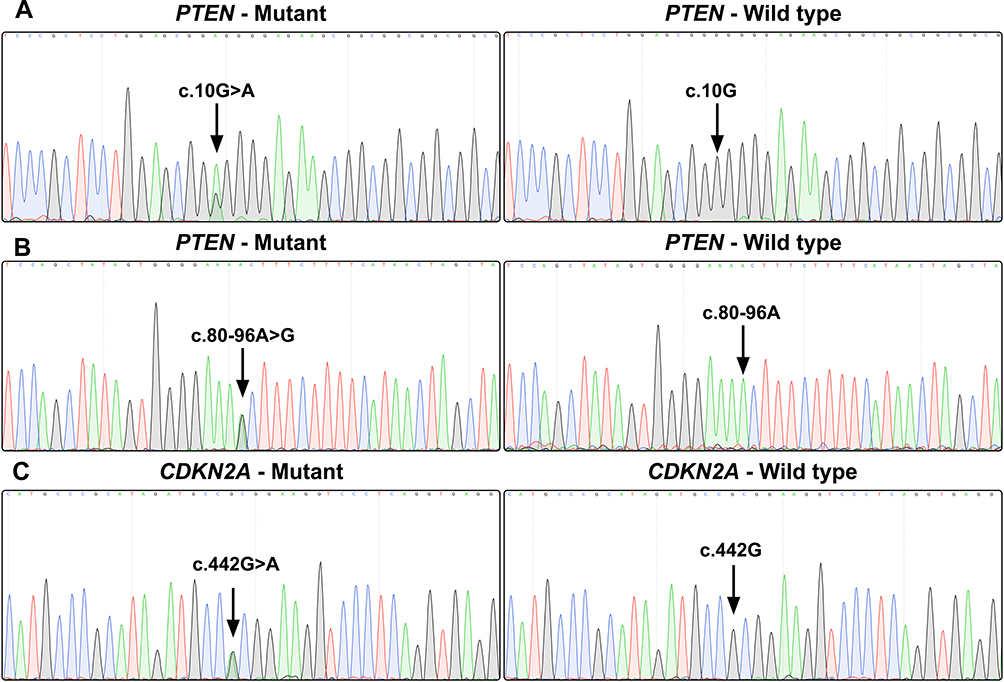 |
Figure 2 Gene sequence chromatograms. Gene sequencing reveals a missense mutation (c.10G>A; p.Gly4Arg) in the PTEN gene (A), an intron SNP (c.80–96A>G) in the PTEN gene (B), and a missense mutation (c.442G>A; p.Ala148Thr) in the CDKN2A gene (C). |
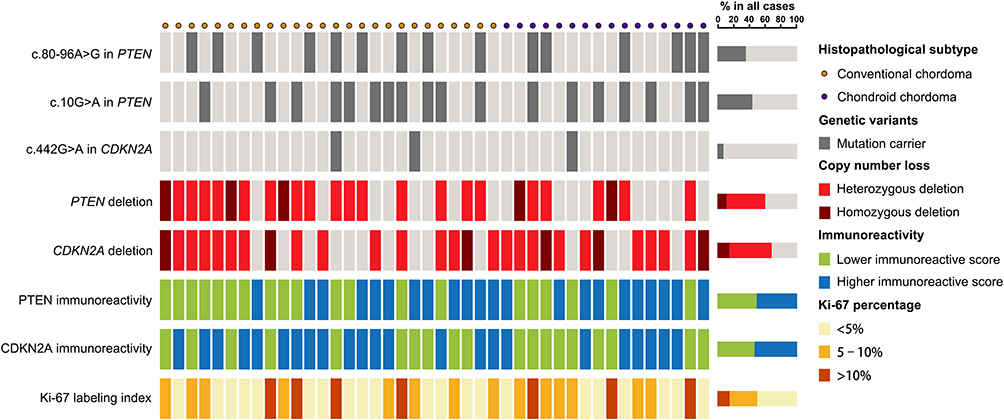 |
Figure 3 Genetic landscape and immunoreactivity. Genetic landscape map shows the distribution of genetic alterations of PTEN and CDKN2A in chordomas as well as the immunoreactivity for PTEN, CDKN2A and Ki-67. |
Copy Number Loss of PTEN and CDKN2A and Clinical Relevance
FISH analysis identified heterozygous loss of the PTEN locus in 20 (47.6%) cases and homozygous deletion of PTEN in 5 (11.9%) cases (Figure 4A-C). Moreover, 22 (52.4%) cases displayed heterozygous loss of the CDKN2A locus, and 6 (14.3%) showed a homozygous deletion of CDKN2A (Figure 4D-F). Copy loss of PTEN and CDKN2A was highly correlated with the low expression level of corresponding proteins (P<0.001 for PTEN and P=0.010 for CDKN2A; Table 2). There was no significant difference in the frequency of PTEN or CDKN2A loss between conventional chordomas and chondroid chordomas (P=0.218 for PTEN and P=0.615 for CDKN2A; Table 3). Kaplan–Meier curves with the Log rank test showed that there was no significant difference in PFS or OS between patients with intact PTEN and patients with PTEN loss (P=0.570 for PFS, and P=0.330 for OS) or between patients with intact CDKN2A and patients with CDKN2A loss (P=0.318 for PFS, and P=0.114 for OS) (Figure 4G-J).
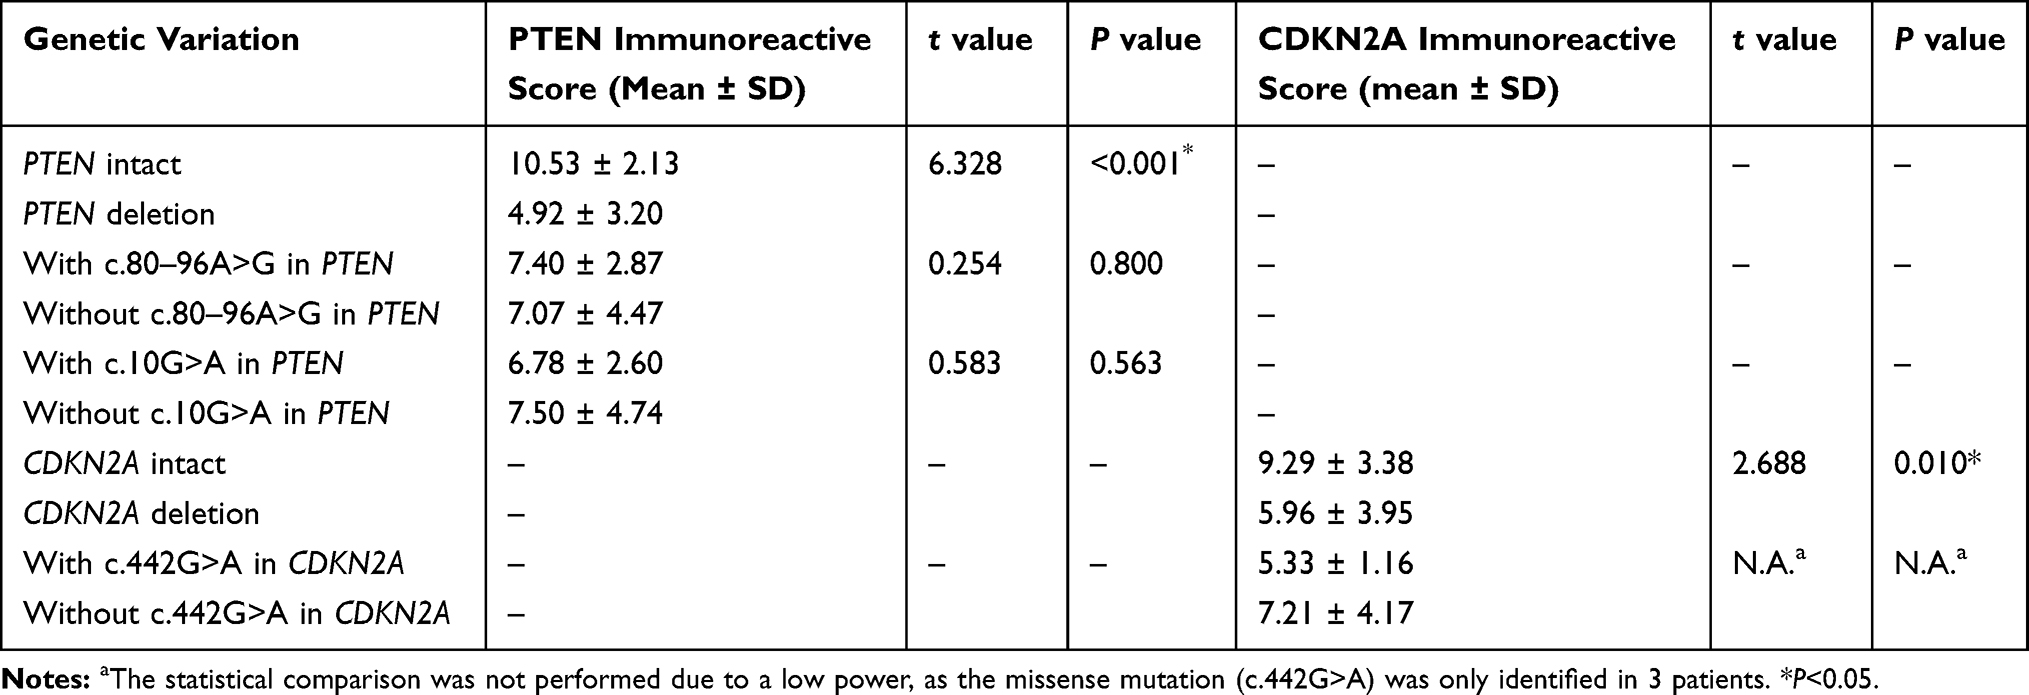 |
Table 2 Correlation Between Genetic Variations of PTEN and CDKN2A and Immunoreactive Scores in Chordomas |
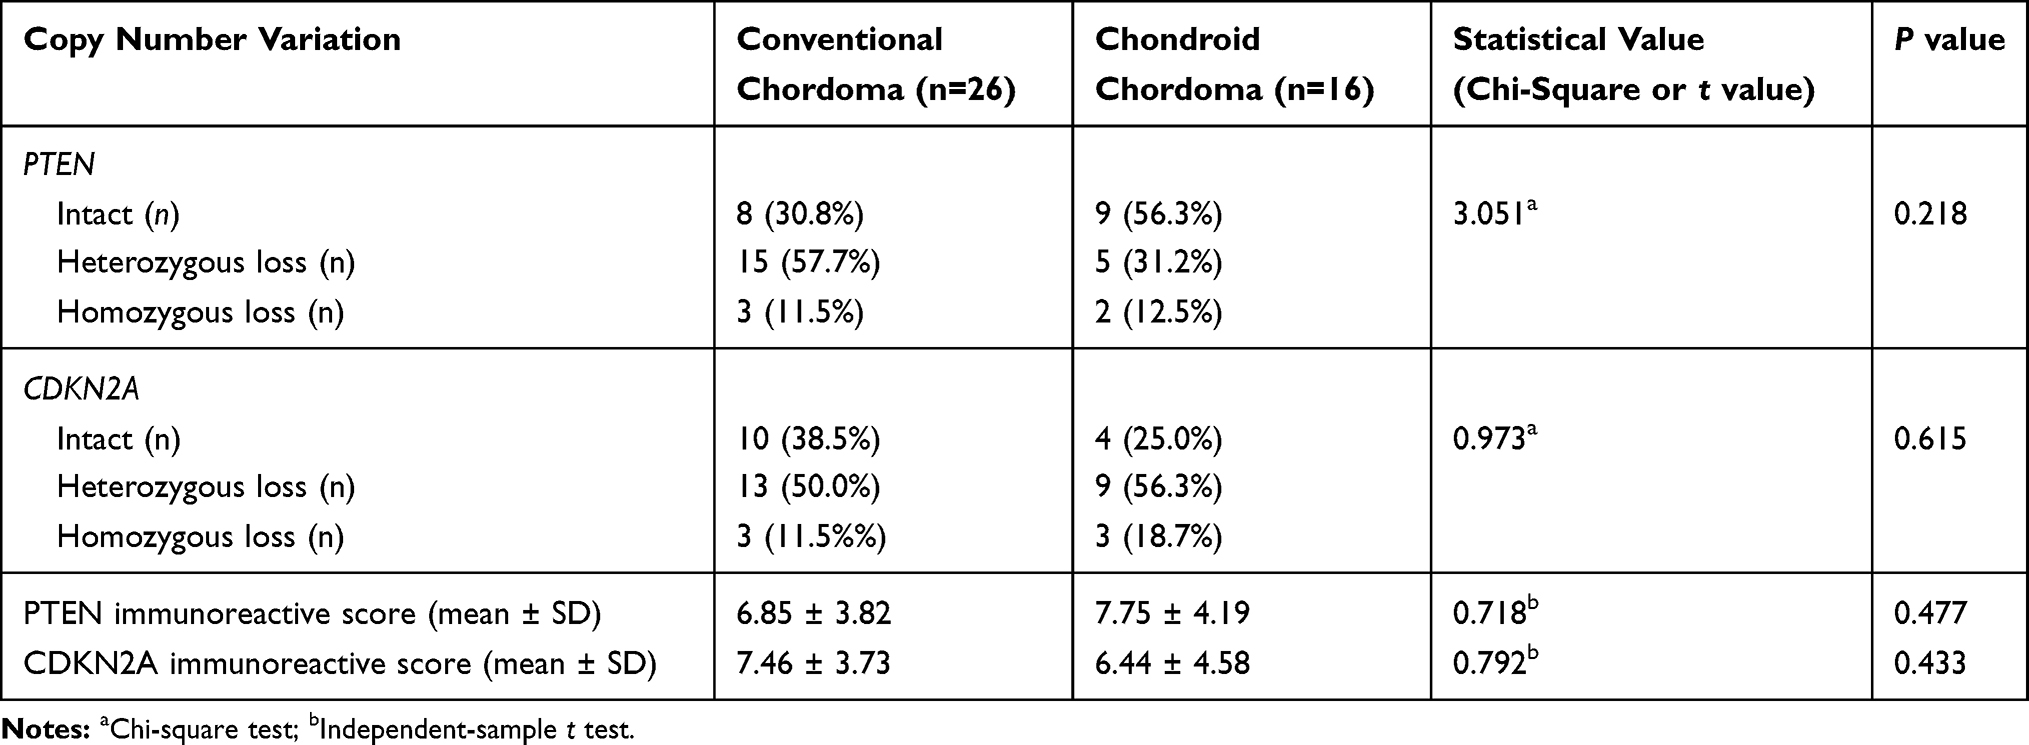 |
Table 3 Copy Number Loss of PTEN and CDKN2A and Immunoreactive Scores in Chordomas |
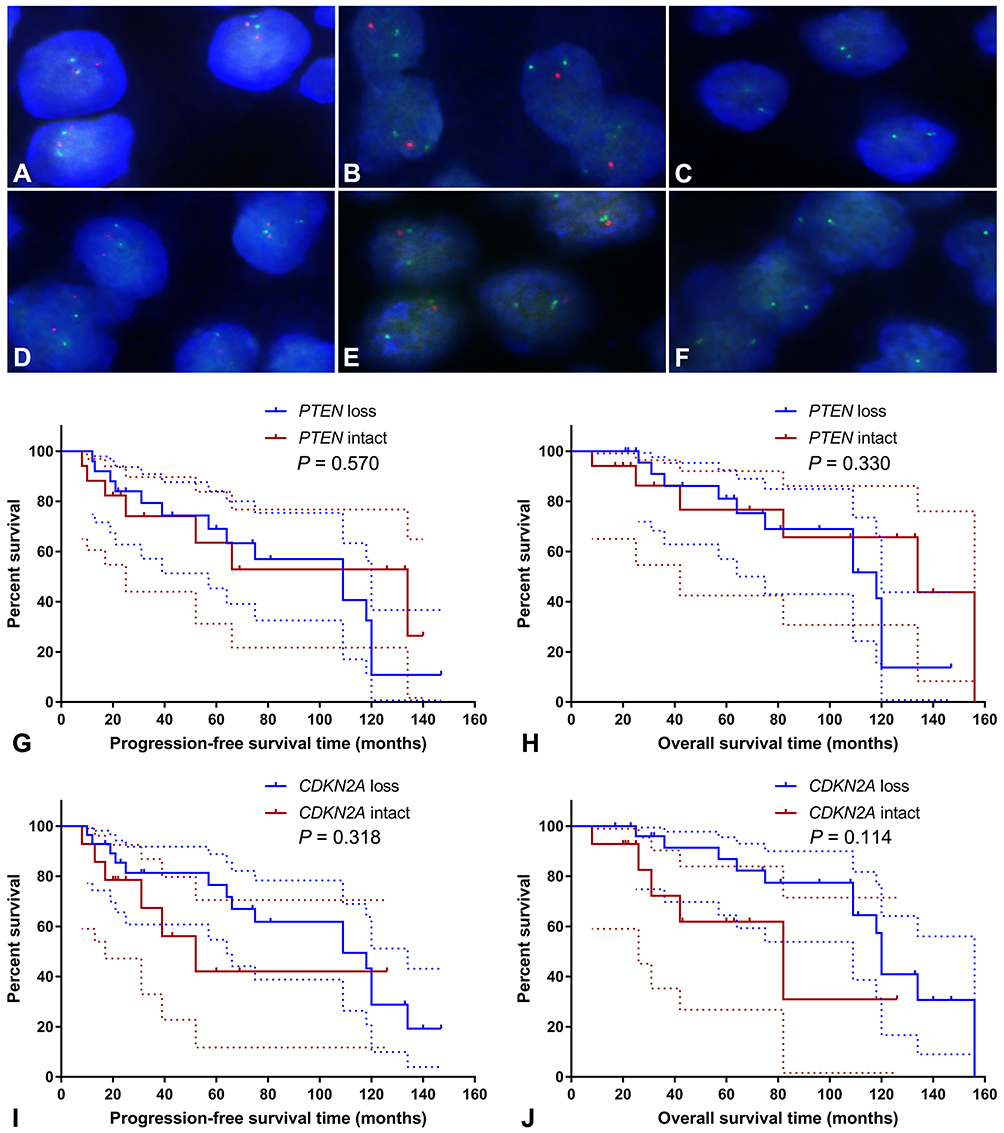 |
Figure 4 Fluorescence in situ hybridization and Kaplan–Meier survival analysis. Fluorescence in situ hybridization showed intact PTEN loci (A), heterozygous loss of the PTEN locus (B), homozygous loss of PTEN (C), intact CDKN2A loci (D), heterozygous loss of the CDKN2A locus (E), and homozygous deletion of CDKN2A (F); (A–C) PTEN and CEN10p were indicated in red and green, respectively; (D–F) CDKN2A and CEN9q were indicated in red and green, respectively. Kaplan–Meier curves showed that there was no significant difference in progression-free survival time (G; P=0.570) or overall survival time (H; P=0.330) between patients with intact PTEN and patients with PTEN loss, and there was no significant difference in progression-free survival time (I; P=0.318) or overall survival time (J; P=0.114) between patients with intact CDKN2A and patients with CDKN2A loss. The dashed lines indicate 95% confidence interval. |
Expression of PTEN and CDKN2A and Clinical Relevance
According to the semiquantitative immunoreactive scores, the patients were divided into two groups based on the average PTEN expression cutoff value of 7.19. The group with lower PTEN expression (immunoreactive score ≤ 6) contained 20 patients (Figure 5A), and the group with higher expression (immunoreactive score ≥ 8) contained 22 patients (Figure 5B). The detailed clinicopathological data are summarized in Table 4. We compared the PFS and OS between these two groups using Kaplan–Meier curves with the Log rank test. The group with lower PTEN expression showed significantly shorter PFS and OS than those of the group with higher expression (median PFS: 75 months vs 134 months, P=0.023; median OS: 109 months vs 156 months, P=0.018) (Figure 5C and D). A low expression level of PTEN was an independent risk factor for PFS (hazard ratio [HR], 2.722; 95% confidence interval [CI], 1.156–6.407; P=0.023) and OS (HR, 2.966; 95% CI, 1.140–7.715; P=0.018).
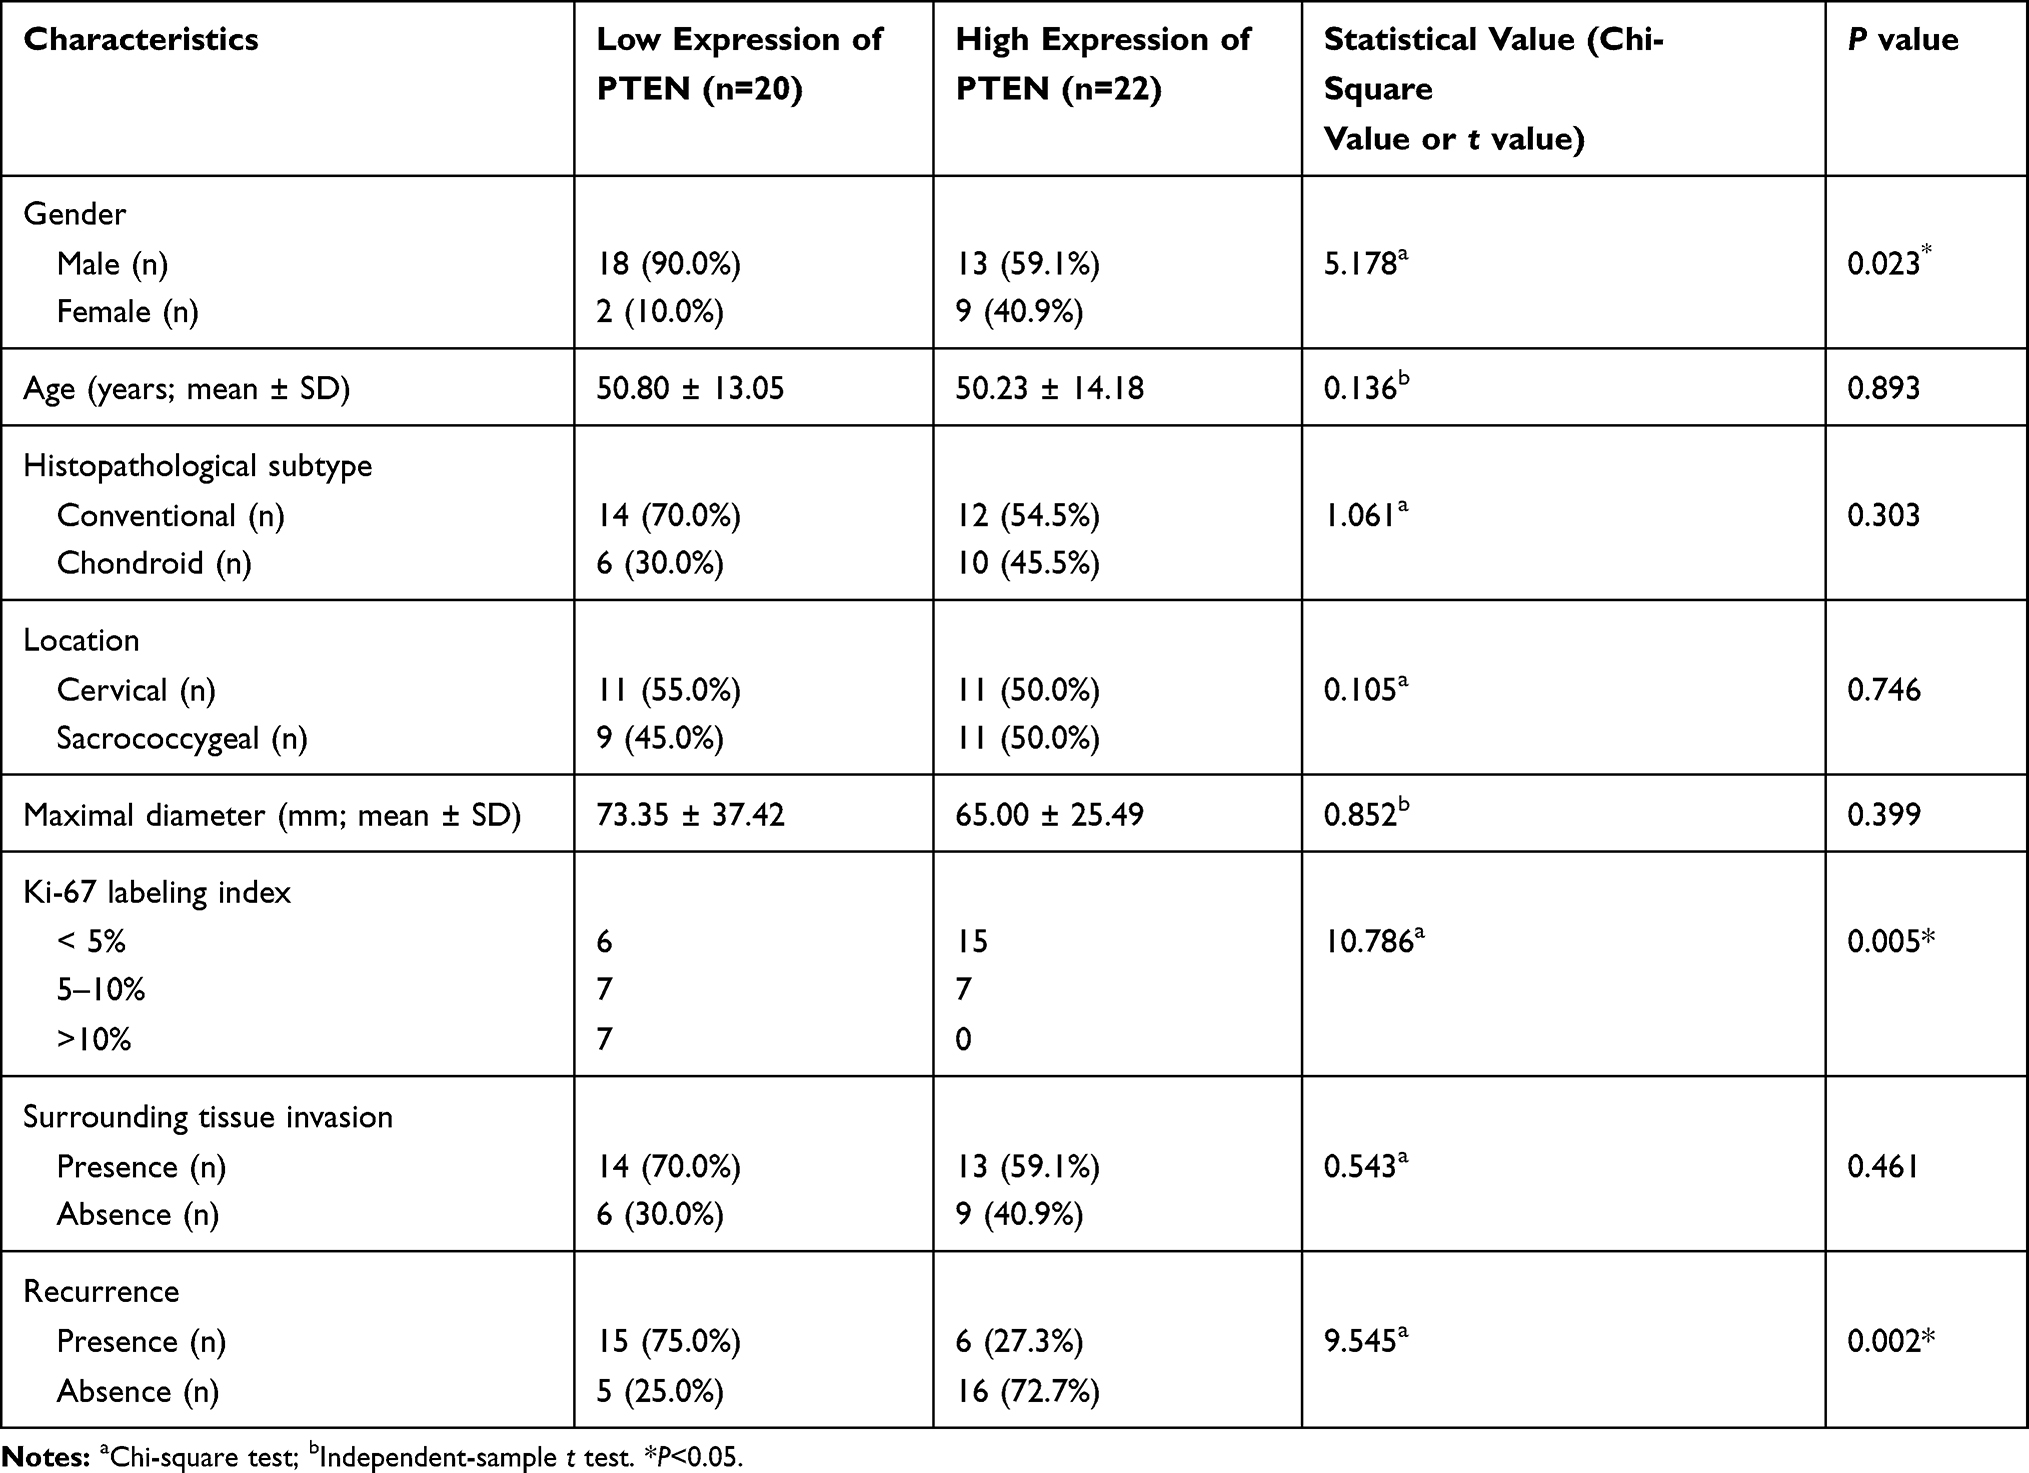 |
Table 4 Clinicopathological Characteristics of Patients with Different PTEN Expressions |
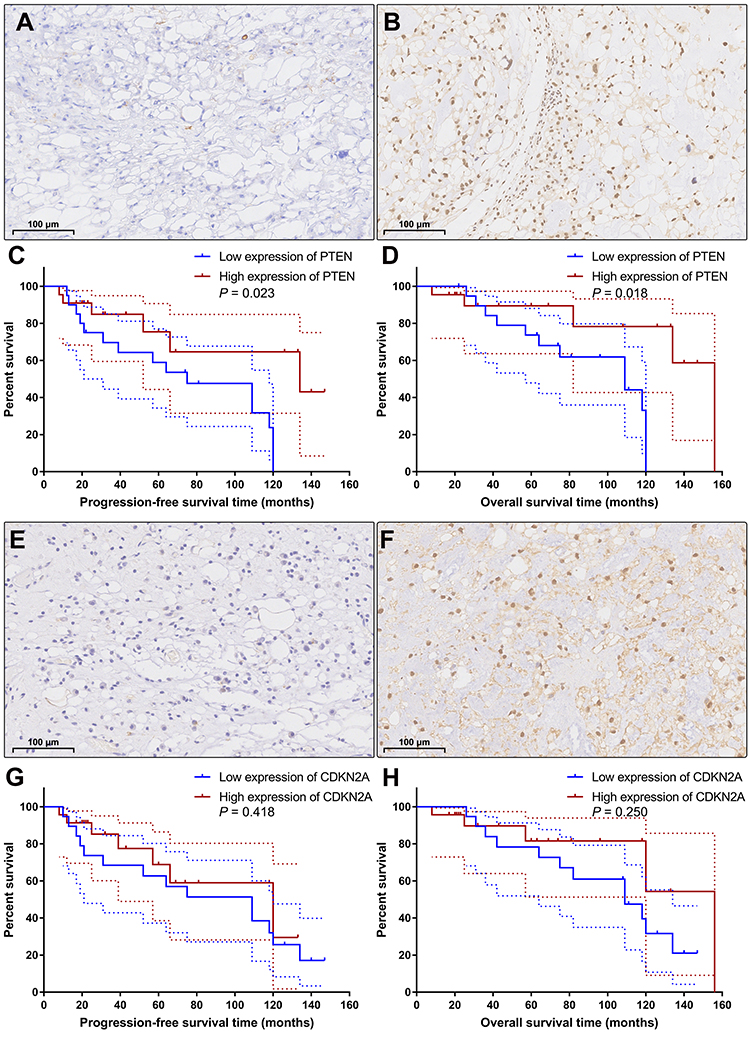 |
Figure 5 Immunohistochemical staining and Kaplan–Meier survival analysis. According to the expression level of PTEN, the patients were categorized into the low expression group (A) and the high expression group (B). Kaplan–Meier curves showed that the patients with low expression of PTEN had significantly shorter progression-free survival time (C; P=0.023) and overall survival time (D; P=0.018) than the patients with high expression of PTEN. Based on the expression level of CDKN2A, the patients were classified into the low CDKN2A expression group (E) and the high CDKN2A expression group (F). Kaplan–Meier curves revealed that there was no significant difference in progression-free survival time (G; P=0.418) or overall survival time (H; P=0.250) between these two groups. The dashed lines indicate 95% confidence interval. |
Then, based on the average CDKN2A expression cutoff value of 7.07, the patients were classified into the low CDKN2A expression group (immunoreactive score ≤ 6; n=19) and the high CDKN2A expression group (immunoreactive score ≥ 8; n=23) (Figure 5E and F). The detailed clinicopathological data are summarized in Table 5. Survival analysis revealed that there was no significant difference in PFS or OS between these two groups (median PFS: 109 months vs 120 months, P=0.418; median OS: 109 months vs 156 months, P=0.250) (Figure 5G and H). Low expression levels of CDKN2A could not serve as an independent risk factor for PFS (HR, 1.423; 95% CI, 0.598–3.390; P=0.418) or OS (HR, 1.758; 95% CI, 0.672–4.601; P=0.250). The detailed statistical data are summarized in Table 6.
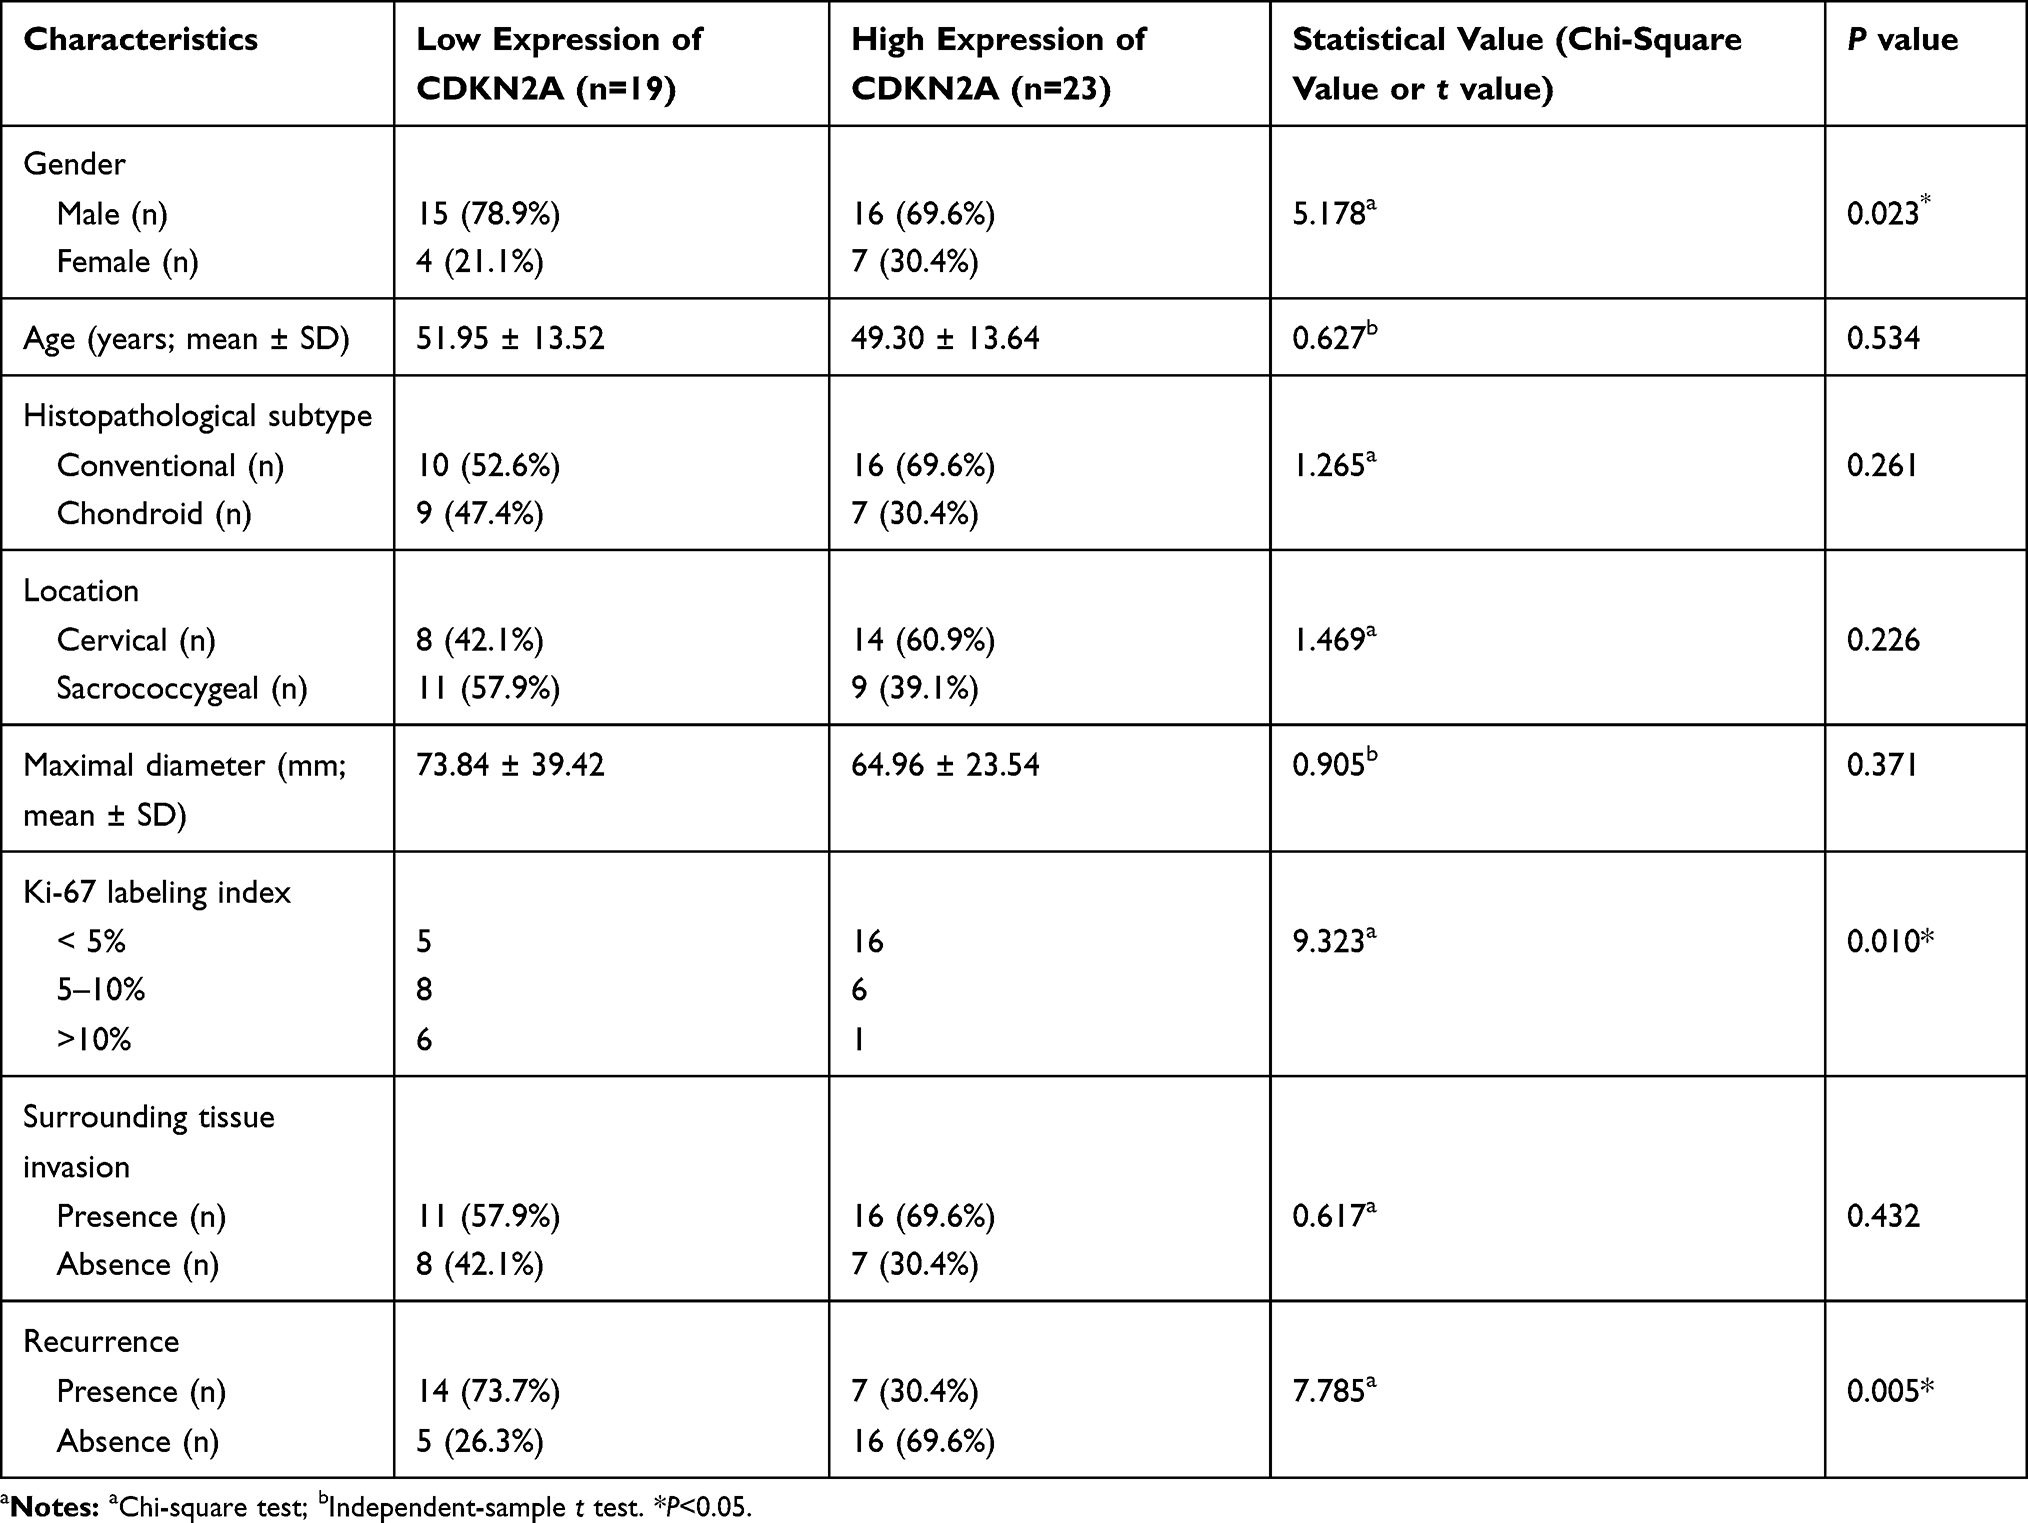 |
Table 5 Clinicopathological Characteristics of Patients with Different CDKN2A Expressions |
 |
Table 6 Kaplan–Meier Analysis of Progression-Free Survival and Overall Survival in Patients with Chordoma |
Discussion
We performed a systematic review on genetic alterations at the PTEN and CDKN2A loci in chordomas. PubMed, Embase, Web of Science, and Google Scholar databases were used for the literature search, and a total of 19 relevant articles were retrieved. The detailed findings are summarized in Table 7. Karyotypic abnormalities involving chromosomes 9 and 10 in chordoma were first reported by Mertens et al in 1994 in which del(9) and –10 were identified in one case with sacral chordoma.11 In 2001, Scheil et al analyzed chromosomal imbalances in a series of 16 chordomas using comparative genomic hybridization in which loss of 9p and 10 chromosome segments was identified in 31% and 19% of chordoma samples, respectively. Additionally, they also established the first chordoma cell line U-CH1 from a recurrent sacrococcygeal chordoma, and U-CH1 exhibited del(9) and del(10) karyotypic abnormalities.4 In 2014, Kuźniacka et al used the conventional G-banding method to analyze chromosomal abnormalities in seven chordoma samples, and they identified loss of 9p and 10 chromosome segments in two and three cases, respectively.5 However, due to the technical limitations of conventional chromosome banding analysis, the locus of chromosomal deletion/loss was not accurately mapped in these studies. In 2008, Hallor et al first used array-based comparative genomic hybridization (aCGH) to analyze the copy number changes in chordomas; these scholars further mapped the chromosomal deletion to the 9p21 segment, and they proposed that this region covered the CDKN2A and CDKN2B loci.12 In the following years, chromosome segments 9p and 10 have become the hotspot regions for studying genetic alterations in chordomas. Many scholars analyzed these chromosomal abnormalities in chordoma tissues and cell lines using various technical platforms, such as aCGH,6,7,13 FISH,13–15 PCR-based microsatellite loss of heterozygosity (LOH) analysis,16 GeneChip array,9 or genome-wide high-resolution SNP-array.17,18 Accumulating evidence has revealed a frequency of PTEN deletion in chordomas ranging from 19% to 80%, and the frequency of CDKN2A deletion in chordomas has been reported to range from 12% to 80%.4–6,12-14,16–18 In our study, loss of PTEN and CDKN2A was identified in 59.5% and 66.7% of all chordoma cases, respectively.
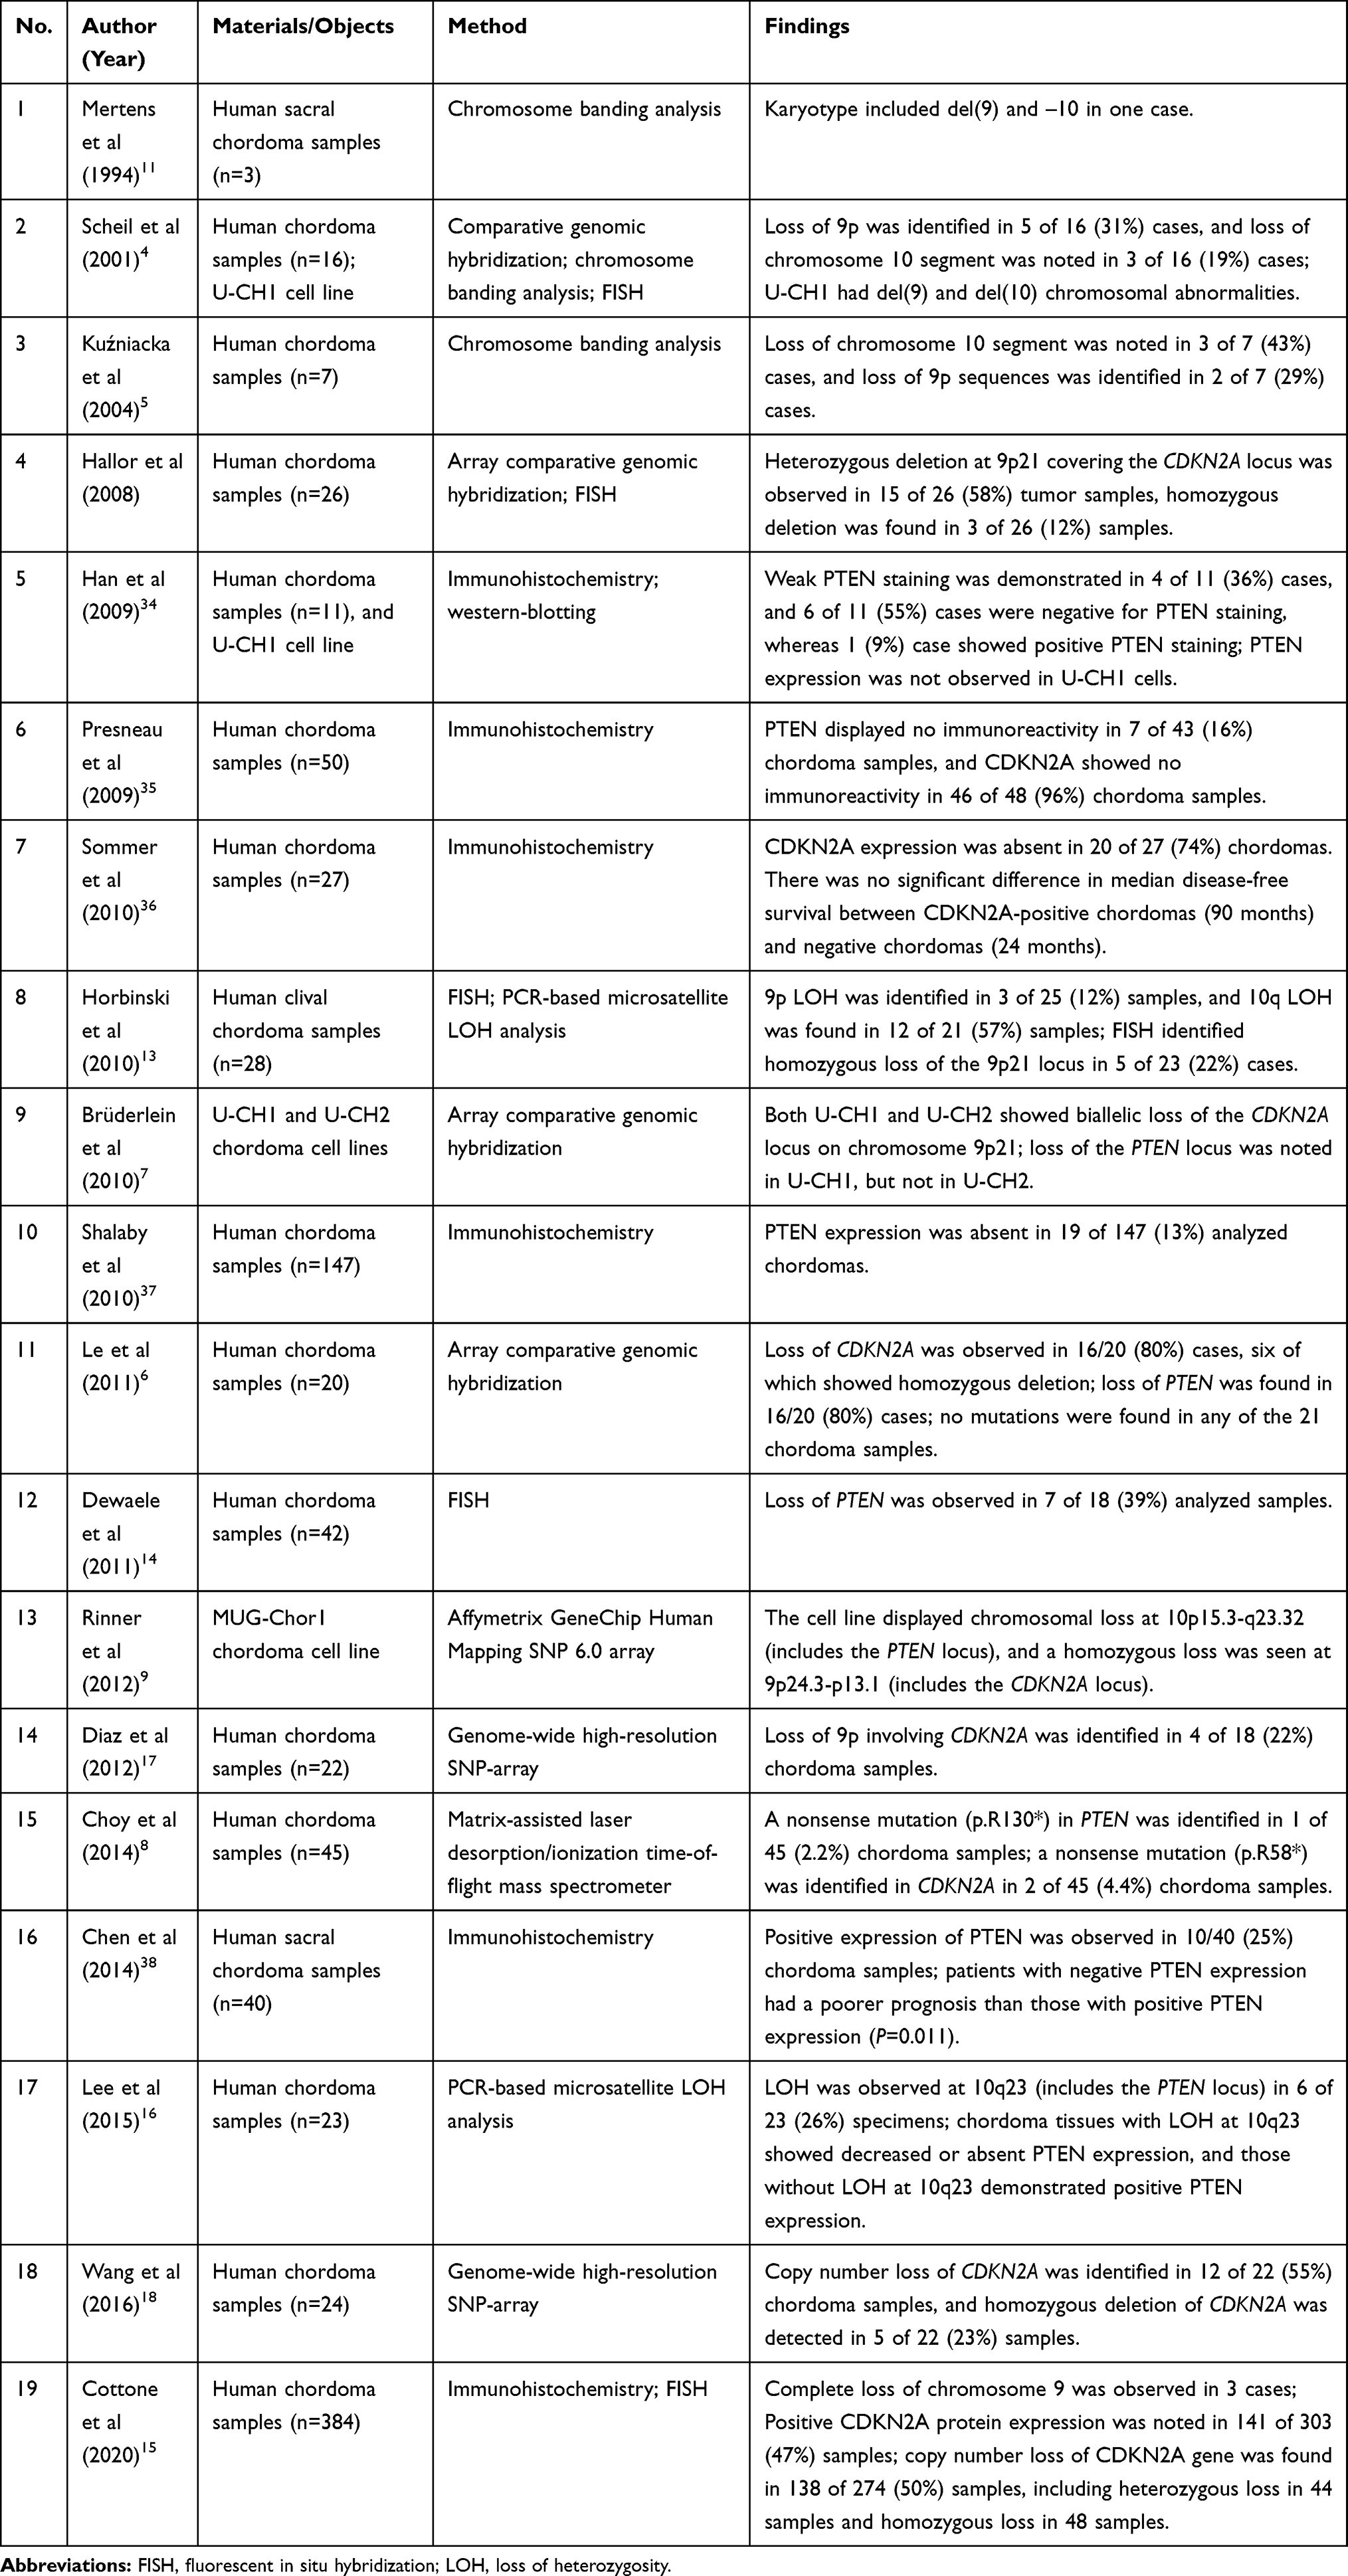 |
Table 7 Systematic Review of Genetic Alterations at the PTEN and CDKN2A Loci in Chordomas |
Point mutations in PTEN and CDKN2A have rarely been studied in the existing literature. In the retrieved articles, only one mutation (p.R130*) in PTEN and one mutation (p.R58*) in CDKN2A were identified by mass spectrometry in chordomas.8 In the current study, three genetic variants were detected, including a missense mutation (c.10G>A; p.Gly4Arg) and an intron mutation (c.80–96A>G) in the PTEN gene and a missense mutation (c.442G>A; p.Ala148Thr) in the CDKN2A gene. There has been no functional validation for these variants. Slattery et al reported that the intron SNP (c.80–96A>G; rs1903858) in PTEN may be associated with breast cancer risk (odds ratio [OR], 0.88; 95% CI, 0.80–0.97; P=0.032),19 while other studies found that this SNP was not associated with primary ovarian insufficiency or prostate cancer.20,21 The missense mutation c.10G>A (rs12573787) in PTEN was found to be associated with an increased risk of chronic myeloid leukemia (OR, 1.71; 95% CI, 1.11–2.63; P=0.016),22 but not with endometrial cancer risk.23 According to the literature, the missense mutation c.442G>A (rs3731249) in CDKN2A was considered to have pathogenicity, and it has been documented as a disease-associated mutation in the HGMD database. A large number of studies have suggested that c.442G>A may contribute to acute lymphoblastic leukemia,24–27 breast cancer,28,29 melanoma,30,31 ovarian cancer,32 and colorectal cancer.33 We found that the frequency of this missense mutation in chordomas (7.1%) was markedly higher than that in the general population (2.2%), which was consistent with the data documented in the above studies. Due to the limited sample size, an accurate OR value could not be calculated in this study.
In addition to chromosomal aberrations in the PTEN and CDKN2A loci, some studies evaluated the expression levels of the PTEN and CDKN2A proteins using immunohistochemistry or Western blotting.15,34-38 Based on the reported results in these previous studies, PTEN staining was negative in 13%~55% of chordomas,34,35,37,38 and immunoreactivity for CDKN2A was absent in 53%~96% of chordomas.15,35,36 However, only two studies analyzed the correlation between the protein expression levels and clinical prognosis.36,38 Sommer et al found no significant difference in median disease-free survival between CDKN2A-positive chordomas (90 months) and CDKN2A-negative chordomas (24 months).36 Chen et al observed that patients with negative PTEN expression had a poorer prognosis than those with positive PTEN expression.38 Notably, a recent study proposed that the absence of CDKN2A protein expression could not be explained by copy number loss of the CDKN2A gene.15 In particular, there has been a paucity of studies concerning genetic alterations of PTEN and CDKN2A in distinct histological subtypes of chordoma. Therefore, we designed this study to investigate the molecular characteristics and expression levels of PTEN and CDKN2A in conventional and chondroid chordomas, and the clinical relevance was analyzed. We found that the copy loss of PTEN and CDKN2A was closely correlated with the low expression level of the corresponding proteins. Additionally, our results indicated that loss of PTEN expression was associated with a poorer prognosis, but loss of CDKN2A expression was not correlated with clinical prognosis, which was highly consistent with the above two studies.36,38
The tumor-suppressor PTEN was first identified in 1997,39 and it has been found to be a negative regulator of the phosphatidylinositol-3-kinase (PI3K)/AKT/mTOR signaling cascade.40 PTEN participates in the regulation of cell division, proliferation, apoptosis, migration, adhesion to surrounding tissues, and neovascularization.41 Increasing evidence indicates that PTEN expression is associated with the prognosis and drug response of several tumors, such as prostate cancer, breast cancer, and endometrial carcinoma.42 Our results suggest that PTEN expression may be a prognostic and predictive biomarker for chordomas; nevertheless, we also noted that there was no significant correlation between copy number loss of PTEN and clinical prognosis. The expression of PTEN can be controlled at the genetic, transcriptional, and posttranscriptional levels,43 which may explain the inconsistent findings regarding the prognostic value of PTEN loss and that of protein expression, while the definitive mechanism still needs further research. CDKN2A, the gene encoding the cell-cycle inhibitor p16CDKN2A (also known as p16, p16,INK4 p16,INK4A or CDK4I), was first identified in 1994.44 The CDKN2A/p16 protein plays an executional role in the cell cycle and senescence by regulating cyclin-dependent kinase (CDK) 4/6 and cyclin D complexes. Previous studies have shown that genetic and epigenetic aberrations of CDKN2A can promote tumorigenesis, recurrence, and metastasis in various cancers, such as lymphoma, melanoma, lung cancer, and gastric cancer.45 In the present study, we failed to find a causal link between CDKN2A deficiency and chordoma prognosis.
There are some limitations to this study. First, although several genetic variants were identified, no functional validation was performed. Second, as chordomas are solitary tumors, no peritumoral parenchyma specimens were available, and peripheral blood samples were not preserved during the hospitalization; we did not classify the genetic variations as somatic or germline. Third, the sample size is still limited. As there were no significant differences in survival time between conventional chordomas and chondroid chordomas, we combined all the patients for further survival analyses. In future studies, we will construct chordoma cell models with site-directed mutagenesis and analyze the potential pathogenic functions of genetic alterations.
Conclusion
This study delineated the genetic characteristics and expression of PTEN and CDKN2A in chordomas. Copy number loss of PTEN and CDKN2A is common and evenly distributed in conventional and chondroid chordomas. PTEN expression may serve as a prognostic and predictive biomarker for chordomas, while no correlation between CDKN2A expression and chordoma prognosis was noted.
Consent for Publication
This study has been approved by the Institutional Review Board. All patients provided written informed consent for their tissue samples to be archived and used for research purposes.
Acknowledgments
The authors would like to thank the patient and her family who trusted us with the care, and all of the physicians and staff who helped in this study. Chenlong Yang and Jianjun Sun are co-first authors for this study.
Disclosure
The authors have no financial interests or potential conflicts of interest.
References
1. Bydon M, Papadimitriou K, Witham T, et al. Novel therapeutic targets in chordoma. Expert Opin Ther Targets. 2012;16(11):1139–1143. doi:10.1517/14728222.2012.714772
2. Diaz RJ, Cusimano MD. The biological basis for modern treatment of chordoma. J Neurooncol. 2011;104(2):411–422. doi:10.1007/s11060-011-0559-8
3. Di Maio S, Yip S, Al Zhrani GA, et al. Novel targeted therapies in chordoma: an update. Ther Clin Risk Manag. 2015;11:873–883. doi:10.2147/TCRM.S50526
4. Scheil S, Bruderlein S, Liehr T, et al. Genome-wide analysis of sixteen chordomas by comparative genomic hybridization and cytogenetics of the first human chordoma cell line, U-CH1. Genes Chromosomes Cancer. 2001;32(3):203–211. doi:10.1002/gcc.1184
5. Kuzniacka A, Mertens F, Strombeck B, Wiegant J, Mandahl N. Combined binary ratio labeling fluorescence in situ hybridization analysis of chordoma. Cancer Genet Cytogenet. 2004;151(2):178–181. doi:10.1016/j.cancergencyto.2003.09.015
6. Le LP, Nielsen GP, Rosenberg AE, et al. Recurrent chromosomal copy number alterations in sporadic chordomas. PLoS One. 2011;6(5):e18846. doi:10.1371/journal.pone.0018846
7. Bruderlein S, Sommer JB, Meltzer PS, et al. Molecular characterization of putative chordoma cell lines. Sarcoma. 2010;2010:630129. doi:10.1155/2010/630129
8. Choy E, MacConaill LE, Cote GM, et al. Genotyping cancer-associated genes in chordoma identifies mutations in oncogenes and areas of chromosomal loss involving CDKN2A, PTEN, and SMARCB1. PLoS One. 2014;9(7):e101283. doi:10.1371/journal.pone.0101283
9. Rinner B, Froehlich EV, Buerger K, et al. Establishment and detailed functional and molecular genetic characterisation of a novel sacral chordoma cell line, MUG-Chor1. Int J Oncol. 2012;40(2):443–451. doi:10.3892/ijo.2011.1235
10. Sinicrope FA, Ruan SB, Cleary KR, Stephens LC, Lee JJ, Levin B. bcl-2 and p53 oncoprotein expression during colorectal tumorigenesis. Cancer Res. 1995;55(2):237–241.
11. Mertens F, Kreicbergs A, Rydholm A, et al. Clonal chromosome aberrations in three sacral chordomas. Cancer Genet Cytogenet. 1994;73(2):147–151. doi:10.1016/0165-4608(94)90199-6
12. Hallor KH, Staaf J, Jonsson G, et al. Frequent deletion of the CDKN2A locus in chordoma: analysis of chromosomal imbalances using array comparative genomic hybridisation. Br J Cancer. 2008;98(2):434–442. doi:10.1038/sj.bjc.6604130
13. Horbinski C, Oakley GJ, Cieply K, et al. The prognostic value of Ki-67, p53, epidermal growth factor receptor, 1p36, 9p21, 10q23, and 17p13 in skull base chordomas. Arch Pathol Lab Med. 2010;134(8):1170–1176. doi:10.1043/2009-0380-OA.1
14. Dewaele B, Maggiani F, Floris G, et al. Frequent activation of EGFR in advanced chordomas. Clin Sarcoma Res. 2011;1(1):4. doi:10.1186/2045-3329-1-4
15. Cottone L, Eden N, Usher I, et al. Frequent alterations in p16/ CDKN2A identified by immunohistochemistry and FISH in chordoma. J Pathol Clin Res. 2020;6(2):113–123. doi:10.1002/cjp2.156
16. Lee DH, Zhang Y, Kassam AB, et al. Combined PDGFR and HDAC inhibition overcomes PTEN disruption in chordoma. PLoS One. 2015;10(8):e0134426. doi:10.1371/journal.pone.0134426
17. Diaz RJ, Guduk M, Romagnuolo R, et al. High-resolution whole-genome analysis of skull base chordomas implicates FHIT loss in chordoma pathogenesis. Neoplasia. 2012;14(9):788–798. doi:10.1593/neo.12526
18. Wang L, Zehir A, Nafa K, et al. Genomic aberrations frequently alter chromatin regulatory genes in chordoma. Genes Chromosomes Cancer. 2016;55(7):591–600. doi:10.1002/gcc.22362
19. Slattery ML, John EM, Torres-Mejia G, et al. Genetic variation in genes involved in hormones, inflammation and energetic factors and breast cancer risk in an admixed population. Carcinogenesis. 2012;33(8):1512–1521. doi:10.1093/carcin/bgs163
20. Zou W, Wang B, Wang J, et al. No association between polymorphisms in PTEN and primary ovarian insufficiency in a Han Chinese population. Reprod Biol Endocrinol. 2015;13(1):62. doi:10.1186/s12958-015-0057-5
21. Xie CC, Lu L, Sun J, et al. Germ-line sequence variants of PTEN do not have an important role in hereditary and non-hereditary prostate cancer susceptibility. J Hum Genet. 2011;56(7):496–502. doi:10.1038/jhg.2011.48
22. Ferri C, Weich N, Gutierrez L, et al. Single nucleotide polymorphism in PTEN-Long gene: a risk factor in chronic myeloid leukemia. Gene. 2019;694:71–75. doi:10.1016/j.gene.2019.01.038
23. Wang LE, Ma H, Hale KS, et al. Roles of genetic variants in the PI3K and RAS/RAF pathways in susceptibility to endometrial cancer and clinical outcomes. J Cancer Res Clin Oncol. 2012;138(3):377–385. doi:10.1007/s00432-011-1103-0
24. Xu H, Zhang H, Yang W, et al. Inherited coding variants at the CDKN2A locus influence susceptibility to acute lymphoblastic leukaemia in children. Nat Commun. 2015;6(1):7553. doi:10.1038/ncomms8553
25. Walsh KM, de Smith AJ, Hansen HM, et al. A heritable missense polymorphism in CDKN2A confers strong risk of childhood acute lymphoblastic leukemia and is preferentially selected during clonal evolution. Cancer Res. 2015;75(22):4884–4894. doi:10.1158/0008-5472.CAN-15-1105
26. Brown AL, de Smith AJ, Gant VU, et al. Inherited genetic susceptibility to acute lymphoblastic leukemia in Down syndrome. Blood. 2019;134(15):1227–1237. doi:10.1182/blood.2018890764
27. Vijayakrishnan J, Kumar R, Henrion MY, et al. A genome-wide association study identifies risk loci for childhood acute lymphoblastic leukemia at 10q26.13 and 12q23.1. Leukemia. 2017;31(3):573–579. doi:10.1038/leu.2016.271
28. Debniak T, Gorski B, Huzarski T, et al. A common variant of CDKN2A (p16) predisposes to breast cancer. J Med Genet. 2005;42(10):763–765. doi:10.1136/jmg.2005.031476
29. Driver KE, Song H, Lesueur F, et al. Association of single-nucleotide polymorphisms in the cell cycle genes with breast cancer in the British population. Carcinogenesis. 2008;29(2):333–341. doi:10.1093/carcin/bgm284
30. Debniak T, Scott RJ, Huzarski T, et al. CDKN2A common variants and their association with melanoma risk: a population-based study. Cancer Res. 2005;65(3):835–839.
31. Debniak T, Gorski B, Scott RJ, et al. Germline mutation and large deletion analysis of the CDKN2A and ARF genes in families with multiple melanoma or an aggregation of malignant melanoma and breast cancer. Int J Cancer. 2004;110(4):558–562. doi:10.1002/ijc.20163
32. Dong Y, Wang X, Yang YW, Liu YJ. The effects of CDKN2A rs3731249, rs11515, and rs3088440 polymorphisms on cancer risk. Cell Mol Biol (Noisy-Le-Grand). 2017;63(3):40–44. doi:10.14715/cmb/2017.63.3.8
33. Polakova V, Pardini B, Naccarati A, et al. Genotype and haplotype analysis of cell cycle genes in sporadic colorectal cancer in the Czech Republic. Hum Mutat. 2009;30(4):661–668. doi:10.1002/humu.20931
34. Han S, Polizzano C, Nielsen GP, Hornicek FJ, Rosenberg AE, Ramesh V. Aberrant hyperactivation of akt and Mammalian target of rapamycin complex 1 signaling in sporadic chordomas. Clin Cancer Res. 2009;15(6):1940–1946. doi:10.1158/1078-0432.CCR-08-2364
35. Presneau N, Shalaby A, Idowu B, et al. Potential therapeutic targets for chordoma: PI3K/AKT/TSC1/TSC2/mTOR pathway. Br J Cancer. 2009;100(9):1406–1414. doi:10.1038/sj.bjc.6605019
36. Sommer J, Itani DM, Homlar KC, et al. Methylthioadenosine phosphorylase and activated insulin-like growth factor-1 receptor/insulin receptor: potential therapeutic targets in chordoma. J Pathol. 2010;220(5):608–617. doi:10.1002/path.2679
37. Shalaby A, Presneau N, Ye H, et al. The role of epidermal growth factor receptor in chordoma pathogenesis: a potential therapeutic target. J Pathol. 2011;223(3):336–346. doi:10.1002/path.2818
38. Chen K, Mo J, Zhou M, et al. Expression of PTEN and mTOR in sacral chordoma and association with poor prognosis. Med Oncol. 2014;31(4):886. doi:10.1007/s12032-014-0886-7
39. Li J, Yen C, Liaw D, et al. PTEN, a putative protein tyrosine phosphatase gene mutated in human brain, breast, and prostate cancer. Science. 1997;275(5308):1943–1947. doi:10.1126/science.275.5308.1943
40. Luongo F, Colonna F, Calapa F, Vitale S, Fiori ME, De Maria R. PTEN tumor-suppressor: the dam of stemness in cancer. Cancers (Basel). 2019;11(8):8. doi:10.3390/cancers11081076
41. Salvatore L, Calegari MA, Loupakis F, et al. PTEN in colorectal cancer: shedding light on its role as predictor and target. Cancers (Basel). 2019;11:11. doi:10.3390/cancers11111765
42. Bazzichetto C, Conciatori F, Pallocca M, et al. PTEN as a prognostic/predictive biomarker in cancer: an unfulfilled promise? Cancers (Basel). 2019;11:4. doi:10.3390/cancers11040435
43. Lee YR, Chen M, Pandolfi PP. The functions and regulation of the PTEN tumour suppressor: new modes and prospects. Nat Rev Mol Cell Biol. 2018;19(9):547–562. doi:10.1038/s41580-018-0015-0
44. Foulkes WD, Flanders TY, Pollock PM, Hayward NK. The CDKN2A (p16) gene and human cancer. Mol Med. 1997;3(1):5–20. doi:10.1007/BF03401664
45. Zhao R, Choi BY, Lee MH, Bode AM, Dong Z. Implications of genetic and epigenetic alterations of CDKN2A (p16(INK4a)) in cancer. EBioMedicine. 2016;8:30–39. doi:10.1016/j.ebiom.2016.04.017
 © 2020 The Author(s). This work is published and licensed by Dove Medical Press Limited. The full terms of this license are available at https://www.dovepress.com/terms.php and incorporate the Creative Commons Attribution - Non Commercial (unported, v3.0) License.
By accessing the work you hereby accept the Terms. Non-commercial uses of the work are permitted without any further permission from Dove Medical Press Limited, provided the work is properly attributed. For permission for commercial use of this work, please see paragraphs 4.2 and 5 of our Terms.
© 2020 The Author(s). This work is published and licensed by Dove Medical Press Limited. The full terms of this license are available at https://www.dovepress.com/terms.php and incorporate the Creative Commons Attribution - Non Commercial (unported, v3.0) License.
By accessing the work you hereby accept the Terms. Non-commercial uses of the work are permitted without any further permission from Dove Medical Press Limited, provided the work is properly attributed. For permission for commercial use of this work, please see paragraphs 4.2 and 5 of our Terms.