")
Back to Journals » Clinical Epidemiology » Volume 14
Deep Learning in Prediction of Late Major Bleeding After Transcatheter Aortic Valve Replacement
Authors Jia Y, Luosang G, Li Y , Wang J, Li P, Xiong T, Li Y, Liao Y, Zhao Z, Peng Y, Feng Y, Jiang W, Li W, Zhang X, Yi Z, Chen M
Received 13 August 2021
Accepted for publication 29 December 2021
Published 12 January 2022 Volume 2022:14 Pages 9—20
DOI https://doi.org/10.2147/CLEP.S333147
Checked for plagiarism Yes
Review by Single anonymous peer review
Peer reviewer comments 7
Editor who approved publication: Dr Eyal Cohen
Yuheng Jia1 *, Gaden Luosang2,3 *, Yiming Li,1 Jianyong Wang,2 Pengyu Li,4 Tianyuan Xiong,1 Yijian Li,1 Yanbiao Liao,1 Zhengang Zhao,1 Yong Peng,1 Yuan Feng,1 Weili Jiang,2 Wenjian Li,2 Xinpei Zhang,2 Zhang Yi,2 Mao Chen1
1Department of Cardiology, West China Hospital, Sichuan University, Chengdu, Sichuan, People’s Republic of China; 2Machine Intelligence Laboratory, College of Computer Science, Sichuan University, Chengdu, Sichuan, People’s Republic of China; 3Department of Information Science and Technology, Tibet University, Lhasa City, People’s Republic of China; 4West China Medical School, Sichuan University, Chengdu, Sichuan, People’s Republic of China
*These authors contributed equally to this work
Correspondence: Mao Chen
Department of Cardiology, West China Hospital, Sichuan University, No. 37 Guoxue Street, Chengdu, 610041, People’s Republic of China
Tel +86-18980602046
Fax +86-28-85423169
Email [email protected]
Zhang Yi
Machine Intelligence Laboratory, College of Computer Science, Sichuan University, Chengdu, 610065, People’s Republic of China
Tel +86-13882217717
Fax +86-28-85466062
Email [email protected]
Purpose: Late major bleeding is one of the main complications after transcatheter aortic valve replacement (TAVR). We aimed to develop a risk prediction model based on deep learning to predict major or life-threatening bleeding complications (MLBCs) after TAVR.
Patients and Methods: This was a retrospective study including TAVR patients from West China Hospital of Sichuan University Transcatheter Aortic Valve Replacement Registry (ChiCTR2000033419) between April 17, 2012 and May 27, 2020. A deep learning-based model named BLeNet was developed with 56 features covering baseline, procedural, and post-procedural characteristics. The model was validated with the bootstrap method and evaluated using Harrell’s concordance index (c-index), receiver operating characteristics (ROC) curve, calibration curve, and Kaplan–Meier estimate. Captum interpretation library was applied to identify feature importance. The BLeNet model was compared with the traditional Cox proportional hazard (Cox-PH) model and the random survival forest model in the metrics mentioned above.
Results: The BLeNet model outperformed the Cox-PH and random survival forest models significantly in discrimination [optimism-corrected c-index of BLeNet vs Cox-PH vs random survival forest: 0.81 (95% CI: 0.79– 0.92) vs 0.72 (95% CI: 0.63– 0.77) vs 0.70 (95% CI: 0.61– 0.74)] and calibration (integrated calibration index of BLeNet vs Cox-PH vs random survival forest: 0.007 vs 0.015 vs 0.019). In Kaplan–Meier analysis, BLeNet model had great performance in stratifying high- and low-bleeding risk patients (p < 0.0001).
Conclusion: Deep learning is a feasible way to build prediction models concerning TAVR prognosis. A dedicated bleeding risk prediction model was developed for TAVR patients to facilitate well-informed clinical decisions.
Keywords: deep learning, transcatheter aortic valve replacement, major or life-threatening bleeding complications, prediction model
Introduction
Transcatheter aortic valve replacement (TAVR) has emerged as an alternative treatment option for severe aortic stenosis patients in the last decade.1,2 However, bleeding is still the main post-procedure complication that largely affects patients’ short- and long-term prognoses.1,3,4 Early bleedings that occur immediately after TAVR were mainly related to procedural factors, and the rate of this type of bleeding had gradually decreased with technical advances.1,3–5 Late-onset bleeding (bleeding occurs 30 days after the procedure), however, has a close relationship with patients’ risk profile, such as age, co-existing comorbidities, and antithrombotic regimens.5,6
The difficulty of balancing bleeding risk against thrombotic risk after TAVR requires clinicians to be more rigorous in deciding on the antithrombotic plans. A few attempts have been made to predict post-TAVR bleeding. Honda et al7 had applied the HAS-BLED score, which was initially designed for patients with atrial fibrillation, to predict bleeding in the TAVR population. Navarese et al8 developed a 6-item bleeding risk score, mainly targeting early bleeding after TAVR, with great discriminative power. However, there still lacks a specifically designed risk model for late major bleedings, whose risk profile is considered to be different from early bleedings post-TAVR.
Machine learning has drawn significant attention in clinical prediction models in recent years, due to its ability to effectively model linear and non-linear relationships and interactions.9 These techniques have been applied to predict in-hospital outcomes,10,11 short-term prognoses12,13 and long-term mortality14 after TAVR. Despite the great performance of traditional machine learning methods (naive Bayes, random forest, support vector machine, etc) in predicting category outcomes (eg dead or alive), it is challenging for them to deal with time-to-event outcomes as in survival analysis.
Deep learning (DL)15 is a branch of machine learning methods that transform information through multiple layers of nodes to learn intricate patterns and connections. DL can more flexibly process high-dimensional datasets and perform time-to-event analysis. Multiple networks, such as Cox-nnet16,17 and DeepSurv,18 have been proposed to predict survival outcomes from various forms of input data. Therefore, we hypothesized that a properly trained DL model could also accurately predict late major bleeding risk after TAVR from a comprehensive set of clinical features. In this study, we developed and internally validated a DL model named BLeNet to evaluate patients’ late major bleeding risk after TAVR. We compared our model with two standard survival analysis models, the traditional Cox proportional hazard (Cox-PH) and the random survival forest models. The study was conducted in accordance with the Transparent Reporting of a Multivariable Prediction Model for Individual Prognosis or Diagnosis (TRIPOD) statement.19
Patients and Methods
Study Population
The study population was drawn from West China Hospital of Sichuan University Transcatheter Aortic Valve Replacement Registry (WATCH, ChiCTR2000033419). This was a prospectively designed registry that sequentially recruited all aortic stenosis patients undergoing TAVR in West China Hospital. Eligibility for TAVR was evaluated in all patients by the multidisciplinary heart team. The valves were chosen according to the availability at the time of treatment. Follow-up was scheduled at 30 days, 3 months, 6 months, 12 months, and yearly thereafter at clinic visits or telephone interviews. Unscheduled visits at the hospital due to adverse events were also recorded. Data were collected and managed through case record form (CRF) and electronic data capture system. A dedicated data management group was responsible for verifying the data.
From the registry, we included patients who underwent TAVR from April 17, 2012 to May 27, 2020 and followed up till January 30, 2021. Exclusion criteria include 1) patients who were died within 30 days after the procedure and 2) patients who were lost to follow-up within the 6 months after the procedure. The study was conducted in accordance with the Declaration of Helsinki and approved by the Ethics Committee on Biomedical Research of West China Hospital.
Endpoint Definition
The primary endpoints were major or life-threatening bleeding complications (MLBCs), which were defined according to the Valve Academic Research Consortium-2 (VARC-2)20 definition and restricted to life-threatening and major bleeding events that occurred after 30 days. Bleeding events that occurred within 30 days after the procedure were recorded as postoperative complications. The multidisciplinary heart team was responsible for adjudicating the bleeding events.
Data Collection and Preparation
From the West China Hospital of Sichuan University Transcatheter Aortic Valve Replacement Registry, we collected the patients’ baseline characteristics, imaging features, procedural details, post-procedural complications, and discharge antithrombotic medications. Lab tests were obtained from the electronic West China Laboratory Information System. Candidate chemical indicators were chosen according to previous studies6,21 and those summarized in clinical practice. Society of Thoracic Surgeons (STS) scores and New York Heart Association (NYHA) class were measured within 1 week before the procedure. All other preprocedural features were obtained within 1 week before the procedure, and postprocedural features were obtained within 1 week after the procedure. Variables with more than 20% of missingness were excluded from the analysis.
Categorical and ordinal variables were coded with discrete values. For continuous variables, the original values were retained. Missingness was imputed with missForest algorithm.22 After data coding and imputation, each patient’s characteristics were summarized as a multi-dimensional vector.
Overall, a triplet value  was used to represent a patient’s complete information. Here
  indicates the total number of patients,
  , which represents the
  -dimensional vector containing the whole clinical features of the patient
  .
.  represents the endpoint event (MLBCs is 1 and no MLBCs is 0), and
  represents the time when patient
  encountered MLBCs or became censored.
Finally, we adopted the synthetic minority over-sampling technique (SMOTE)23 to preprocess the highly imbalanced data and Z-score normalization to normalize the input features.
BLeNet Model
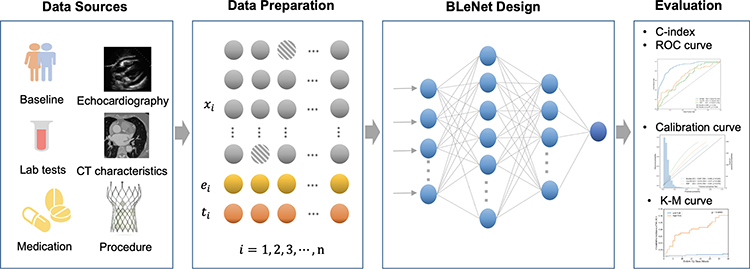
In this study, a deep learning model, namely BLeNet, was proposed to estimate the risk of MLBCs after TAVR, as illustrated in Figure 1. The proposed BLeNet model consisted of an input layer, two fully connected feed-forward hidden layers, and an output layer. Each of the first three layers was followed by a batch-normalization layer and a Tanh activation function. The output layer consisted of a single node to estimate the risk index, which corresponded to the log hazard ratio in the Cox-PH model. To train the proposed BLeNet model, we adopted the partial likelihood function as the loss function:
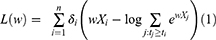


where  is the number of patients,
  indicates the feature vector of patient
  ,
,  is the survival time,
  indicates patient
  ‘s status (0 = no MLBCs, 1 = MLBCs) at time
  , and
, and  indicates patients who had longer MLBCs-free time than patient
  . In this loss function,
  is the hyperparameter that the network needs to learn, and
  is the output risk index.
The training of the BLeNet model is to optimize the loss function by using the Adam optimization algorithm24 with a learning rate of 10−3 and a weight decay of 10−4. Besides, the training epoch and batch size are 100 and 64, respectively.
In an attempt to better interpret the BLeNet model, we applied the model interpretability library Captum25 to identify feature importance.
Model Validation and Evaluation
To fully evaluate the performance of the proposed BLeNet model, we compared it with two survival analysis methods. One was the traditional Cox-PH model, and the other was the random survival forest model. Feature selection was performed using the least absolute shrinkage and selection operator (LASSO), starting with all candidate variables. We also did a comparison study with these two models retaining all the features as in the BLeNet model.
All models were evaluated in the following metrics. Harrell’s concordance index (c-index) and receiver operating characteristics (ROC) curve were used to evaluate the discriminative performance. Sensitivity and specificity were calculated based on the cutoff point on the ROC curve. Calibration curve was used to evaluate the agreement between predicted risk and observed risk,26,27 in which integrated calibration index (ICI) and E50 were used as numerical measures. ICI indicates the weighted difference between observed and predicted probabilities, and E50 indicates the median percentile of absolute difference.27 Hosmer–Lemeshow test was also used to test the goodness of fit. We then stratified the patients into high- and low-bleeding risk groups according to the best cutoff point in the ROC curve. Kaplan–Meier estimate was performed to analyze the cumulative incidence of MLBCs in these two groups, and the Log rank test was used to compare the difference.
All of these models were validated by bootstrapping,28,29 which was recommended by the TRIPOD statement as a preferable validation method in small datasets.19 The key concept of bootstrapping is to approximate the variation in the general population by the variation in bootstrap samples. This method yields an optimism-adjusted estimate of the overall accuracy through multiple re-sampling process.
Statistical and Technical Specifications
In univariate statistical analysis, continuous variables were expressed as mean ± SD or median (interquartile range) and compared using Student’s t test or Wilcoxon rank-sum test. Categorical variables were expressed as numbers (percentages) and compared using the chi-square test or Fisher’s exact test. Two-tailed p-values were reported, with the p-value <0.05 being considered statistically significant. The above analyses were performed using Stata/SE version 15.1.
Features were standardized with the Z-score normalization method. The time-to-event outcome was analyzed based on our available follow-up data using the Kaplan–Meier estimate and compared using the Log rank test. ROC curve was drawn based on the true- and false-positive rates. The above analyses were performed using the python package “sklearn”. The calibration curve was performed based on the predicted risk against the observed risk, with Hosmer–Lemeshow test applied to test the goodness of fit, and this was done using the python package “lifelines”.
Results
Baseline Characteristics and Univariate Analysis
A total of 718 TAVR patients were retrospectively enrolled in the study, 31 patients (4.32%) died within the first month, 19 patients (1.59%) were lost to follow-up within the 6 months after the procedure, and these patients were excluded from the analysis (Figure 2). In the final study cohort of 668 patients, 64 patients (9.58%) died within a median follow-up time of 25 months (interquartile range: 12.7–39.9 months; cardiovascular death: 24 patients), of which 3 patients died from life-threatening bleeding events (intracranial hemorrhage).
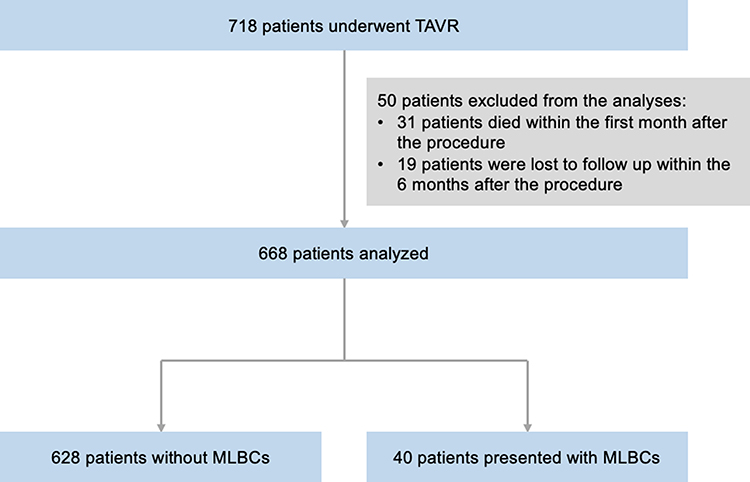 |
Figure 2 Flow chart of the study population. Abbreviations: MLBCs, major or life-threatening bleeding complications; TAVR, transcatheter aortic valve replacement. |
Forty patients (5.99%) were presented with MLBCs within the follow-up period. The median time to the occurrence of MLBCs was 5.5 months (interquartile range: 2.25–14.75 months). Gastrointestinal bleeding was the most frequent type of bleeding (n=32, 80%). Others included intracranial bleeding, intraocular bleeding, and subcutaneous bleeding.
Demographic, echocardiographic, computerized tomographic (CT), biochemical, procedural features and comorbidities of patients stratified according to the occurrence of MLBCs within 3 years are shown in Tables 1 and 2. Univariate analyses in our study population had indicated that patients who developed MLBCs within 3 years were more likely to be of older age (p = 0.003), and had prior peripheral vascular disease (PVD) (p = 0.010) and percutaneous coronary intervention (PCI) history (p = 0.007). They also had relatively lower peri-procedural hemoglobin level (pre-procedural: p = 0.033; post-procedural: p <0.001), higher creatine level (p = 0.046) and higher post-procedural aortic valve (AV) maximal velocity (p = 0.002).
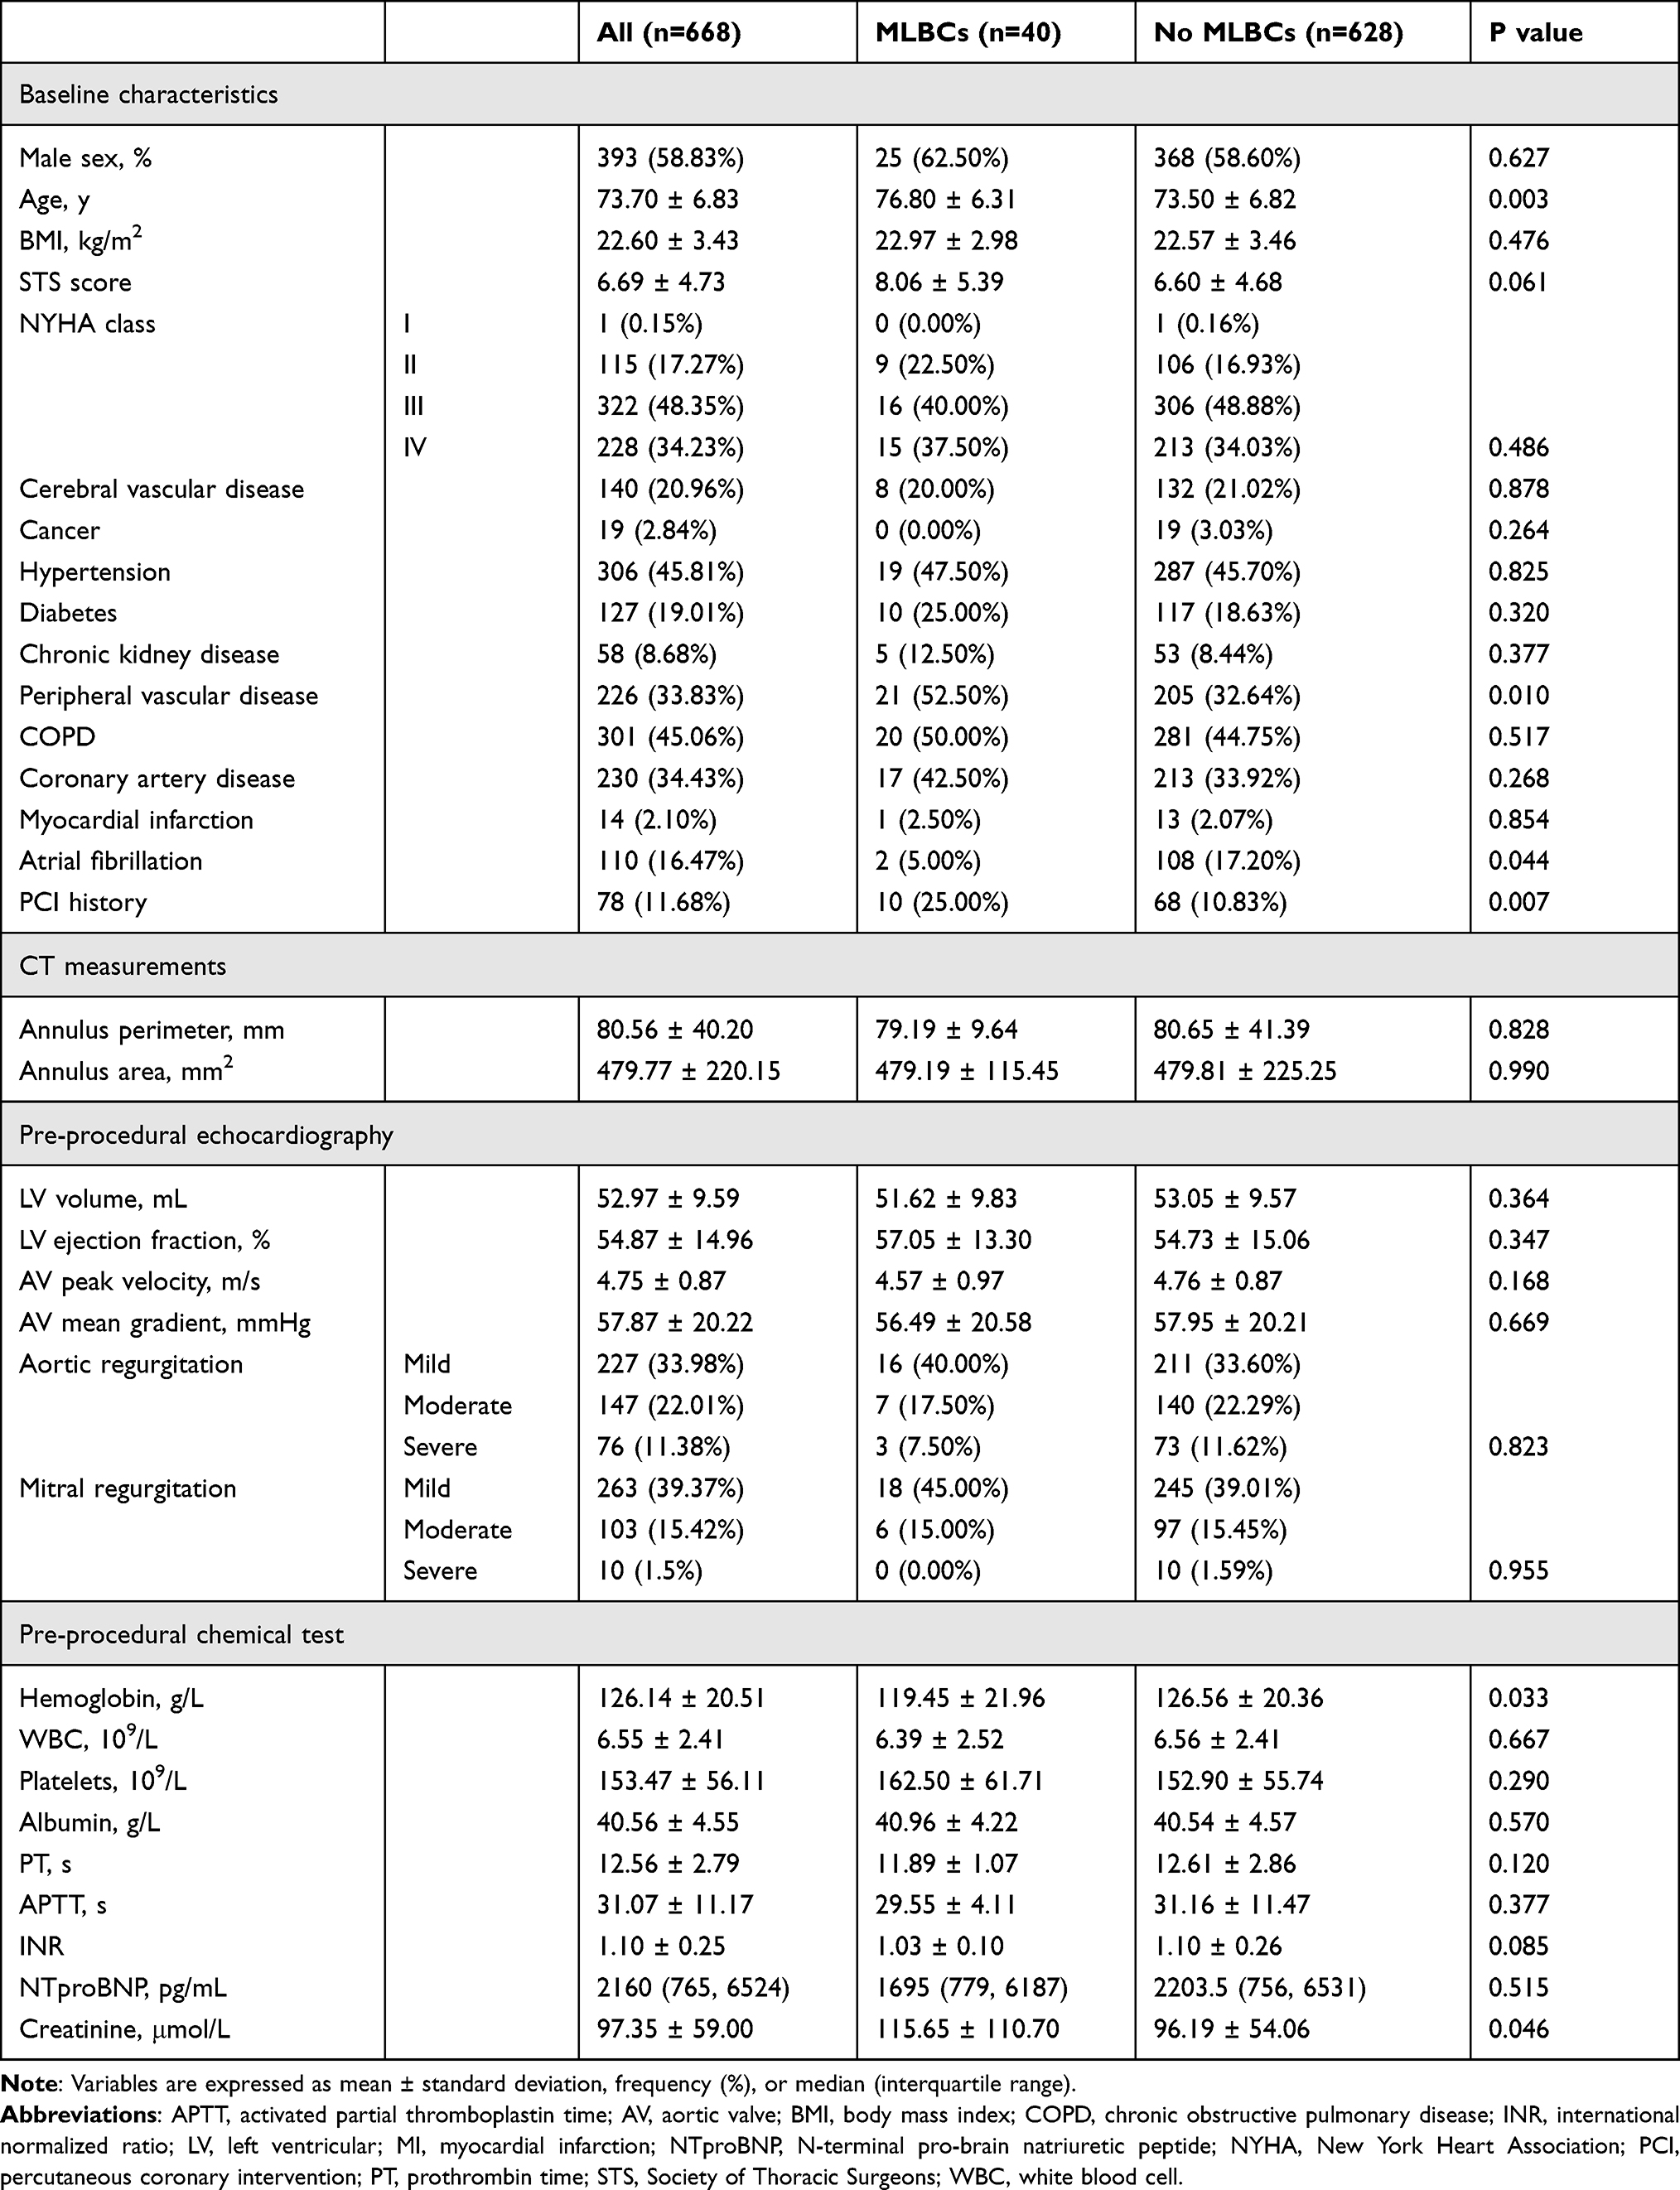 |
Table 1 Baseline Characteristics Stratified According to the Occurrence of MLBCs Within 3 Years |
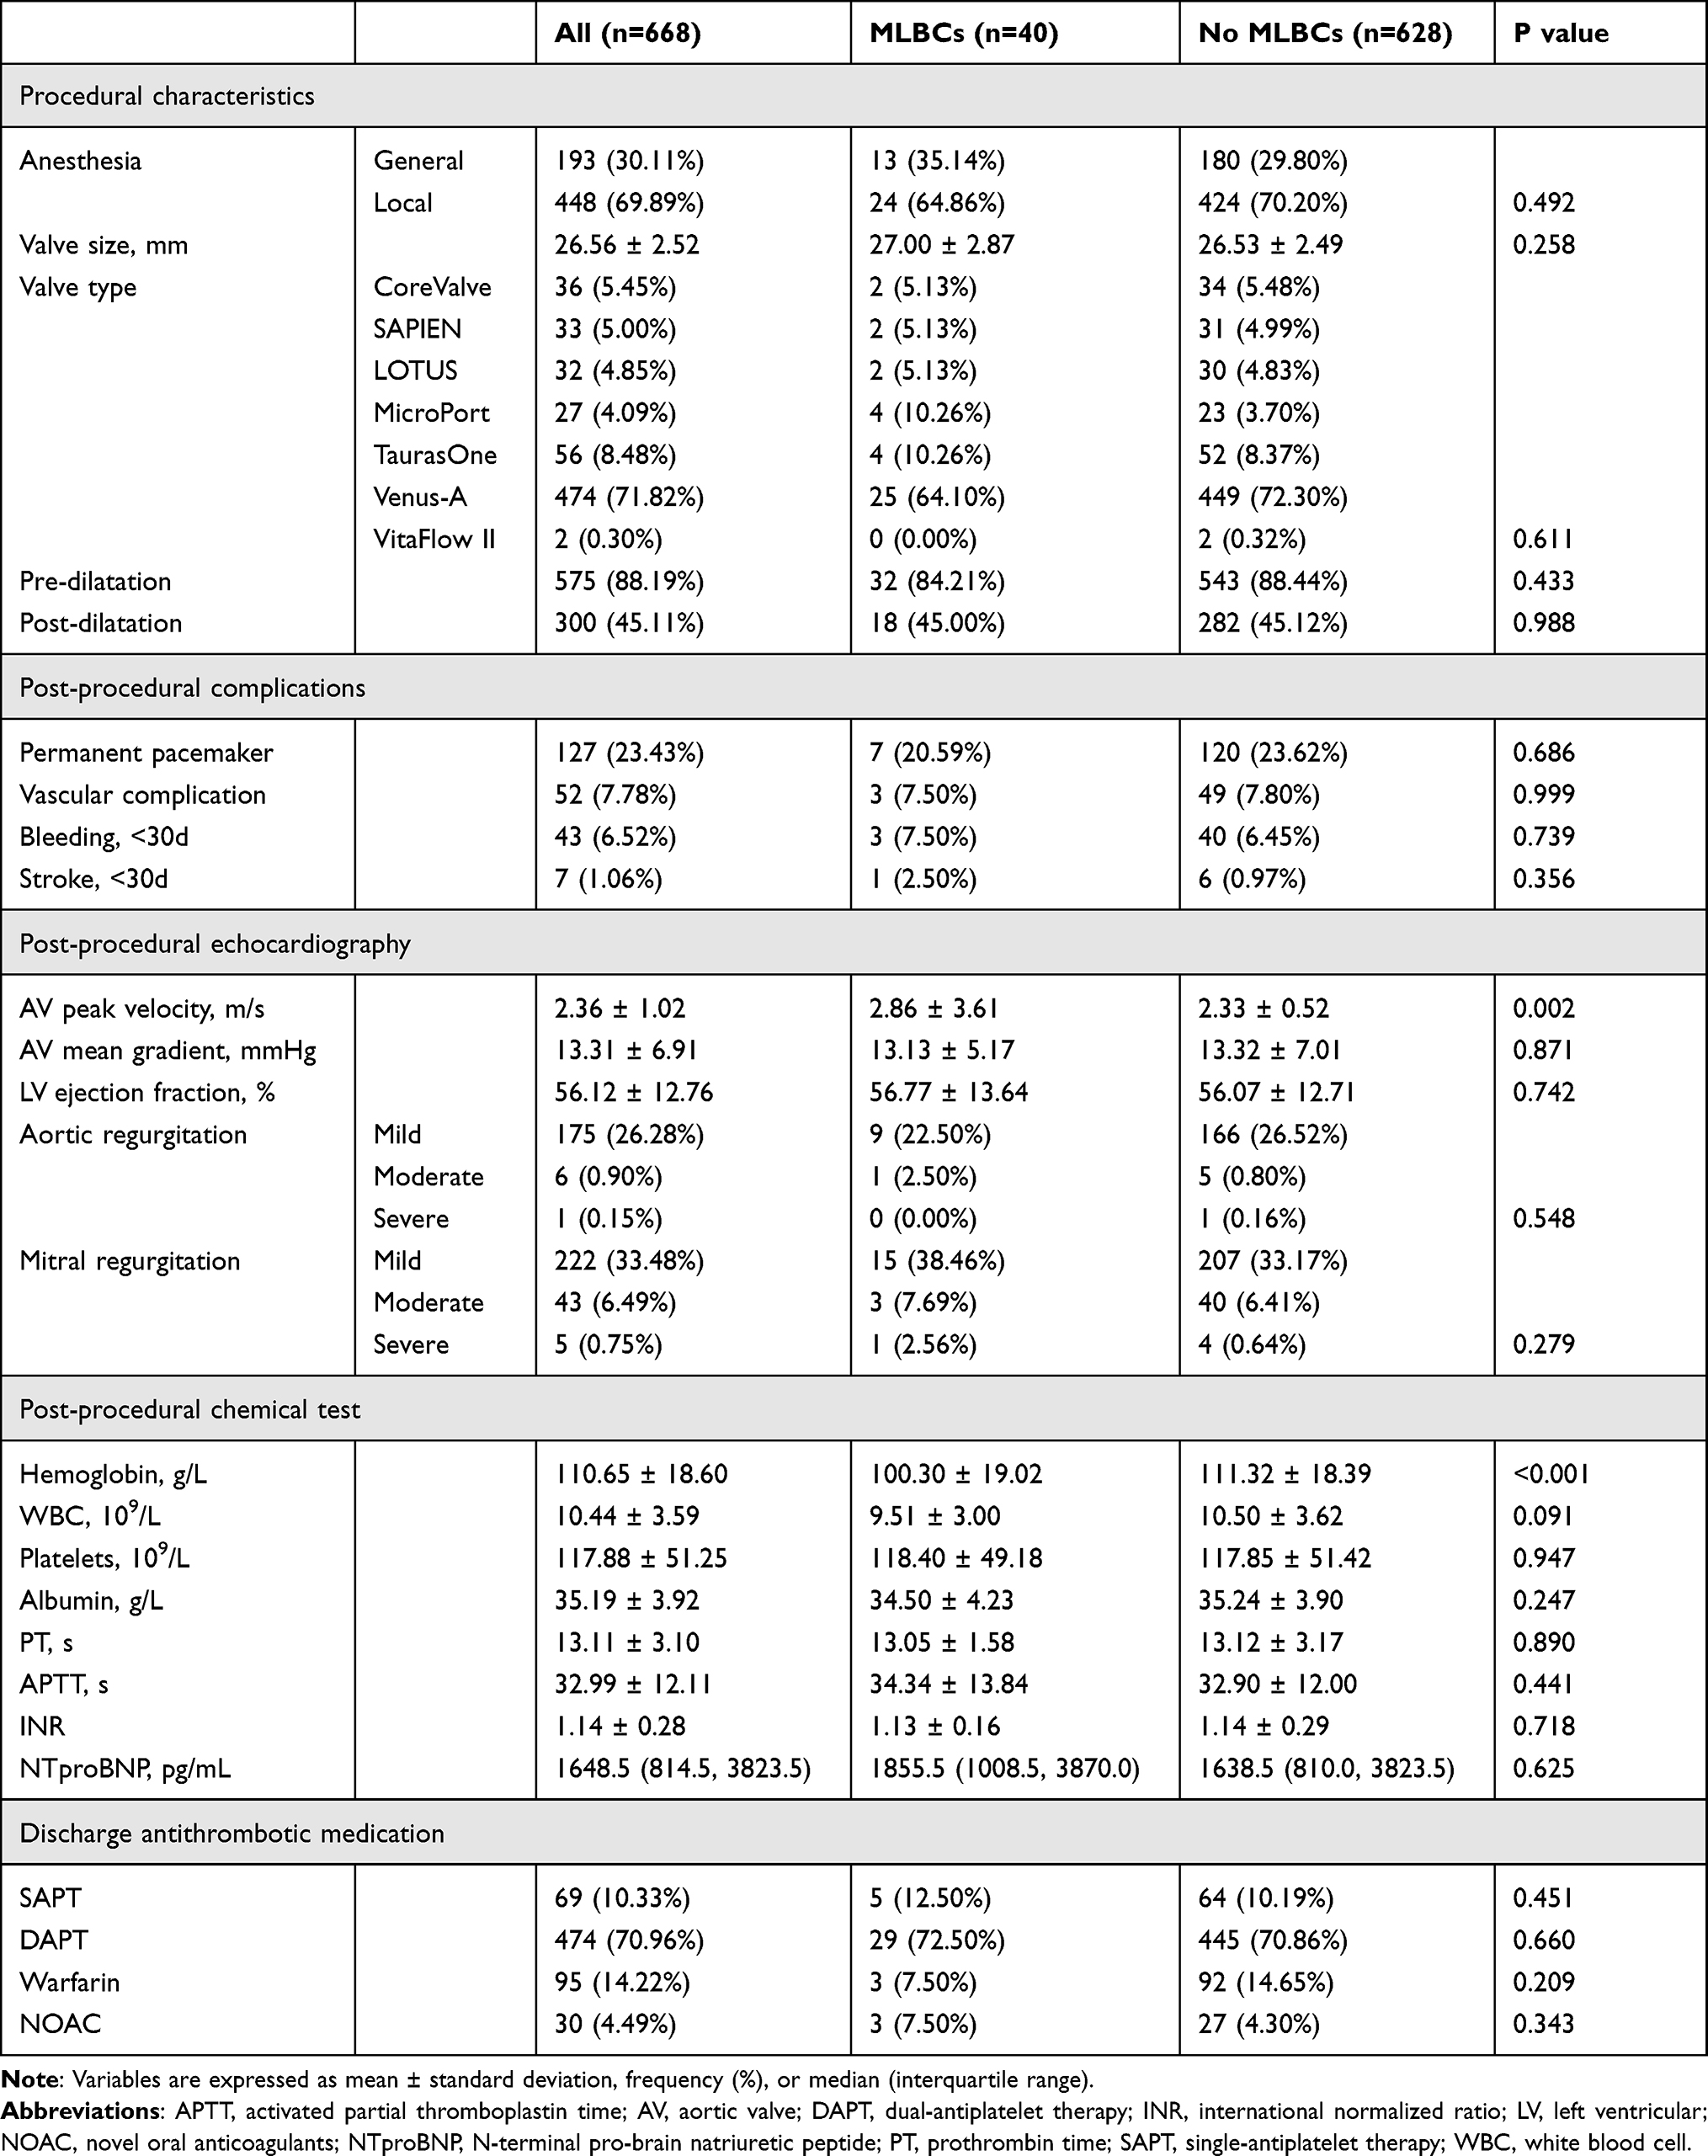 |
Table 2 Procedural and Post-Procedural Characteristics Stratified According to the Occurrence of MLBCs Within 3 Years |
BLeNet Model Performance
After data preparation and imputation, 56 variables were selected to build the model (Tables 1 and 2). All variables had less than 20% of missing rate. The details of missing data are shown in Supplementary Figure 1. In total, 24 variables (42.8%) and 173 patients (25.9%) had at least one missing value.
The proposed BLeNet model achieved great performance both in discrimination and calibration. In terms of discrimination, the optimism-corrected c-index of the BLeNet model was 0.81 (95% CI: 0.79–0.92) (Table 3), and the AUC of this model was 0.84 (95% CI: 0.76–0.91) (Figure 3). In terms of calibration, the predicted risks of BLeNet were largely consistent with the actual results with an ICI of 0.007 and E50 of 0.005 (Figure 4). Then, we stratified the patients into high- and low-risk groups. The cumulative incidence of MLBCs incrementally increases in the high-risk group compared with that in low-risk patients stratified by the BLeNet model (p < 0.0001) (Figure 5A).
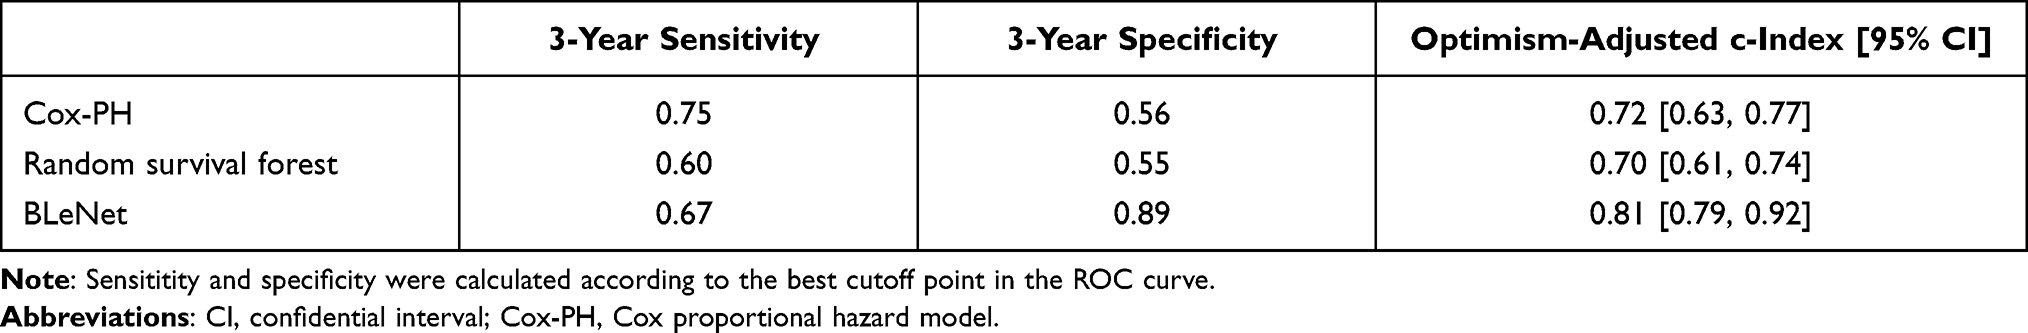 |
Table 3 Comparison of Cox-PH Model and Random Survival Forest Model with the BLeNet Model |
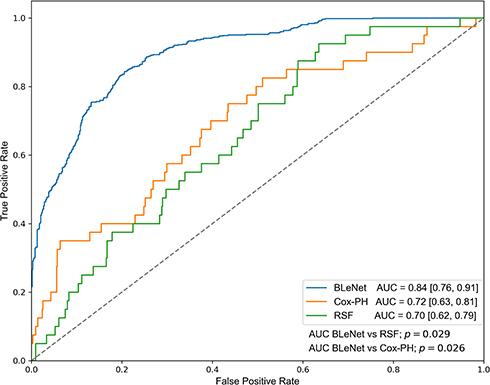 |
Figure 3 Receiver operating characteristics curve based on 3-year incidence of MLBCs. Compared with the Cox-PH model (Orange line) and random survival forest model (green line), the proposed BLeNet model (blue line) reached a higher AUC (0.84, 95% CI: 0.76–0.91), indicating that this model had better discriminative performance than the Cox-PH and random survival forest models. Abbreviations: AUC, area under the curve; Cox-PH, Cox proportional hazard; RSF, random survival forest. |
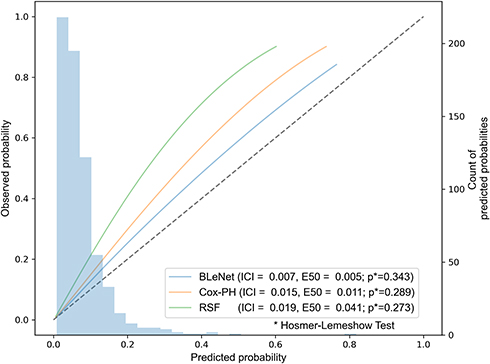 |
Figure 4 Calibration curve for 3-year incidence of MLBCs after TAVR. The calibration curve demonstrates the agreement between predicted risk (x-axis) and observed risk (y-axis). The diagonal line demonstrates perfect calibration. BLeNet model (blue line) was better calibrated than the Cox-PH model (Orange line) and random survival forest model (green line) with a calibration curve closer to the perfect line. ICI indicates the weighted difference between observed and predicted probabilities, and E50 indicates the median percentile of absolute difference. The bar histogram indicates the counts of patients with predicted risk on the x-axis. Abbreviations: Cox-PH, Cox proportional hazard; ICI, integrated calibration index; RSF, random survival forest. |
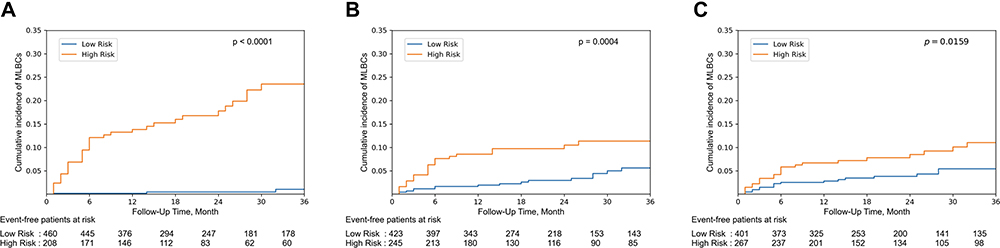 |
Figure 5 Cumulative incidence of MLBCs in high- and low-risk patients stratified by BLeNet, Cox-PH and random survival forest model. (A) Cumulative incidence of MLBCs in high- and low-bleeding risk patients stratified by BLeNet model according to the best cutoff point in the ROC curve. (B) Cumulative incidence of MLBCs in high- and low-bleeding risk patients stratified by Cox-PH model according to the best cutoff point in the ROC curve. (C) Cumulative incidence of MLBCs in high- and low-bleeding risk patients stratified by random survival forest model according to the best cutoff point in the ROC curve. Abbreviations: Cox-PH, Cox proportional hazard; MLBCs, major or life-threatening bleeding complications; ROC, receiver operating characteristics. |
To interpret the BleNet model, we applied the Captum interpretation library for pytorch to evaluate feature importance. The top 10 features identified by the Captum interpretation network were cancer history, preprocedural platelet level, post-procedural international normalized ratio (INR), coronary artery disease, preprocedural INR, postprocedural AV mean gradient, postprocedural aortic regurgitation, postprocedural LV ejection fraction, and preprocedural activated partial thromboplastin time (APTT). The average feature importance of all variables is shown in Supplementary Figure 2.
Comparison of BLeNet Model with Cox-PH and Random Survival Forest Model
We compared the BLeNet model with the Cox-PH and random survival forest models in the metrics mentioned above. Feature selection was performed using LASSO regression for these two models, and the selected predictors are listed in Table 4.
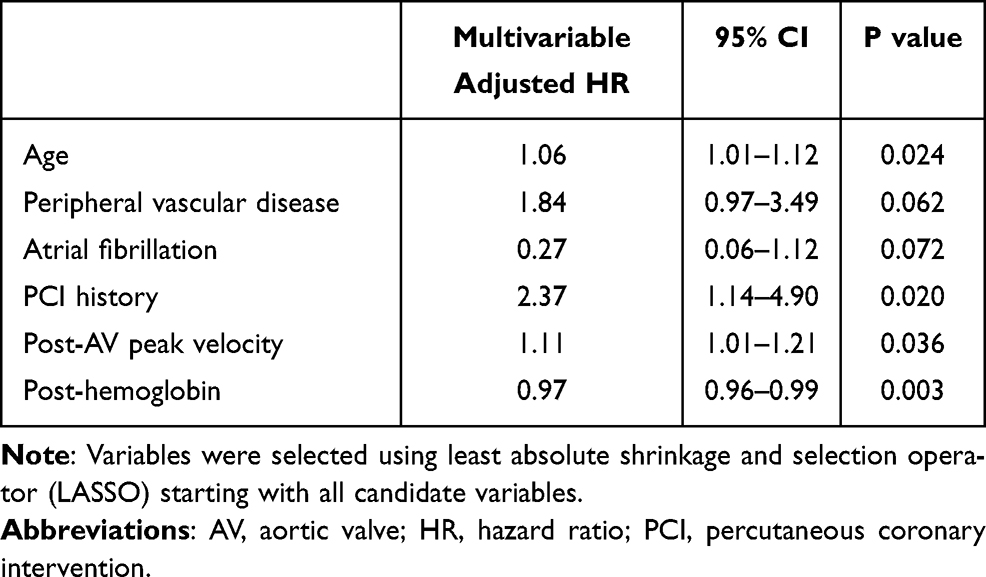 |
Table 4 Variables Selected to Build Cox-PH Model and Random Survival Forest Model |
The results demonstrated that the proposed BLeNet model outperformed the Cox-PH and random survival forest models significantly. In terms of discrimination, BLeNet reached a higher c-index (BLeNet: 0.81; Cox-PH: 0.72; random survival forest: 0.70) (Table 3) and higher AUC (BLeNet: 0.84; Cox-PH: 0.72; random survival forest: 0.70) than other two models (Figure 3). In terms of calibration, BLeNet was better calibrated than Cox-PH and random survival forest models with smaller ICI and E50 (BLeNet: ICI = 0.007, E50 = 0.005; Cox-PH: ICI = 0.015, E50 = 0.011; random survival forest: ICI = 0.019, E50 = 0.041) (Figure 4). BLeNet model also achieved better performance than the Cox-PH model in stratifying patients into high- and low-risk groups, as represented in the Kaplan–Meier estimate (Figure 5). In comparison with Cox-PH and random survival forest models built with all candidate features without selection, the BLeNet model also had better performance (Supplementary Figure 3).
Discussion
We developed and internal validated a DL bleeding risk model to accurately evaluate TAVR patients’ late and major bleeding risk after the procedure. The results of our study demonstrated that deep learning might be a promising method to develop prognostic models from readily available clinical data. This model had incorporated baseline, procedural and post-procedural characteristics to give a comprehensive evaluation of patients’ bleeding susceptibility after TAVR. It outperformed the Cox-PH and random survival forest models significantly in discrimination and calibration, and may serve as a useful tool for major bleeding risk evaluation after TAVR.
Late major bleeding has long been identified as a severe post-TAVR complication. Previous studies6,21,30 found that MLBCs are associated with a two- to fivefold increase in overall mortality, which suggested that controlling bleeding is an important area of improving post-TAVR management.
MLBCs arise from all kinds of complex situations after TAVR. Both the unique hemodynamic features of TAVR patients and the special technical features of TAVR have a role in the pathogenesis pathways.5,31 Previous studies have identified possible risk factors associated with MLBCs after TAVR, such as age, female, chronic kidney disease, paravalvular leak, baseline hemoglobin, atrial fibrillation.6,21,30,32,33 Marion et al revealed CT-ADP, a marker of vWF multimeter proteolysis, as a strong predictor of early and late bleeding events after TAVR. However, the application of CT-ADP is still in the research stage and has not routinely tested in most hospitals yet. Navarese et al8 recently developed a 6-item bleeding risk score named PREDICT-TAVR, mainly targeting early bleedings after TAVR. This score consists of hemoglobin, serum iron, anticoagulation and dual antiplatelet therapy, common femoral artery, and creatinine clearance. It had good discriminative power for early bleedings with an AUC of 0.80. However, the risk profile of late major bleedings is not quite the same as early bleedings, and evaluation of such risk is crucial to determine the long-term management plan.
To the best of our knowledge, the BLeNet model is the first model developed with the DL algorithm to analyze the late major bleeding risk after TAVR. We adopted the time-to-event outcome as the prediction target rather than simple classification, which enable the model to give a more accurate quantification of patients’ late major bleeding risk. The model assimilated risk factors identified by previous studies and combined a large set of periprocedural characteristics, so that a more comprehensive evaluation could be obtained.
Machine learning has drawn great attention in TAVR field in these years. Different types of machine learning techniques have been applied to predict in-hospital outcomes,10,11 short-term prognosis12,13 and long-term mortality14 after TAVR. Evidences have shown that machine learning outperformed traditional linear regression models in these classification tasks. However, most of the traditional machine learning classifiers were not designed to handle risk estimation in right-censored survival data. DL possesses more flexibility in dealing with time-to-event outcomes, as it was already been applied for survival analysis in the cancer research field. She et al34 had combined the Cox-PH model with the DL algorithm to predict survival of non-small cell lung cancer (NSCLC) patients from 127 features. It showed significantly better performance than the traditional TNM (tumour, node, metastases) model. Matsuo et al35 compared the DL algorithm with the Cox-PH model to predict progression-free survival and overall survival in cervical cancer patients and got exceedingly good results. The astonishing performance of the DL method may be explained by its inherent advantages. DL can process the raw clinical data directly without the need for complex feature engineering. It can extract intricate patterns and non-linear interactions through multiple layers of transformation and abstraction, and allow more flexible relationships between the variables and outcomes.15,36 This method can be further extended by combining multi-modality input data. For example, the CT measurements and echocardiographic features in our model can be replaced by raw CT images and echocardiographic videos with sufficient computational power, and surprising findings might be found.
Although interpretation of DL models has always been challenging, we made an attempt with the Captum interpretation library, and some unexpected factors were discovered. Apart from those predictors that have already been found (platelet level, postprocedural AR), cancer history, coronary artery disease and postprocedural ejection fraction were identified as high weight features. However, how specifically these factors contribute to the MLBCs after TAVR still requires further research, both in the clinical aspects and in the interpretation of DL models.
In comparing studies with Cox-PH and random survival forest models, we applied LASSO regression to select high-weight features. Interestingly, atrial fibrillation (AF) was found to be negatively related to MLBCs in this cohort. We speculated that this resulted from the extra attention we paid to those AF patients, since anticoagulation therapy was an established risk factor for bleeding. These patients had a more frequent follow-up schedule, with their antithrombotic regimen consistently adjusted.
Compared with the 6-item PREDICT-TAVR bleeding score,8 the BLeNet model has a comparable performance (optimism-corrected AUC of PREDICT-TAVR vs BLeNet: 0.79 vs 0.84). The major potential utility of this model lies in the accurate quantification of patients’ bleeding risk. The output of the model corresponds to the log hazard ratio in the Cox-PH model, which makes the results interpretable to clinicians. This model can also more accurately stratify low bleeding risk patients than the Cox-PH model, even using a relatively crude stratification method based on the cutoff point in the ROC curve. For these low-bleeding risk patients, dual-antiplatelet therapy or vitamin K antagonist could be considered to reduce the rate of thromboembolic events.
Limitations and Expectations
Our study was based on a single-center registry. Though the West China Hospital of Sichuan University Transcatheter Aortic Valve Replacement Registry represents the largest single-center registry in China, we still need more centres’ participation to update and external validate our model. We also recognized that this was a retrospective observational study. Further validation from prospective studies is required to fully evaluate the model’s utility. There is still room for improvement of this model by expanding the dataset, including more patients with the region and background diversity, and incorporating more potential predictors. We also intend to conduct prospective studies to validate the clinical utility of this model.
Conclusion
Deep learning is a feasible way to build prediction models concerning TAVR prognosis. Based on the largest single-center TAVR registry in China, we developed and internally validated a deep learning risk model named BLeNet to comprehensively evaluate patients’ late major bleeding risk after TAVR. This model outperformed the traditional Cox-PH and random survival forest models in discrimination and calibration. It may serve as a useful evaluative tool to facilitate well-informed clinical decisions.
Abbreviation
AUC, area under the curve; AV, aortic valve; CI, confidential interval; Cox-PH, Cox proportional hazard; DL, deep learning; HR, hazard ratio; ICI, integrated calibration index; MLBCs, major or life-threatening bleeding complications; NYHA, New York Heart Association; ROC, receiver operating characteristics; STS, Society of Thoracic Surgeons; TAVR, transcatheter aortic valve replacement.
Data Sharing Statement
The data that support the findings of this study are available from West China Hospital, but restrictions apply to the availability of these data, which were used under license for the current study, and so are not publicly available. Data are however available from the corresponding authors upon reasonable request and with permission of West China Hospital.
Ethical Approval and Consent to Participate
The patients of this study were drawn from West China Hospital of Sichuan University Transcatheter Aortic Valve Replacement Registry (WATCH TAVR registry, ChiCTR2000033419), which consecutively recruited patients undergoing TAVR in West China Hospital. The study was approved by Ethics Committee on Biomedical Research, West China Hospital of Sichuan University, and conducted in accordance with the Declaration of Helsinki. Written informed consent was obtained from all study participants.
Acknowledgments
The authors thank the TAVR patients and their families for cooperating with this work.
Author Contributions
All authors contributed to data analysis, drafting or revising the article, have agreed on the journal to which the article will be submitted, gave final approval of the version to be published, and agreed to be accountable for all aspects of the work.
Funding
This work was supported by the National Major Science and Technology Projects (grant number 2018AAA0100201) to ZY; the National Natural Science Foundation of China (grant 81970325 to MC; grant number 61906127 to JW); the 1.3.5 project for disciplines of excellence, West China Hospital, Sichuan University to MC; the Science and Technology Achievement Transformation Fund of West China Hospital of Sichuan University (CGZH19009) to MC.
Disclosure
None of the authors declare any conflict of interest in this paper.
References
1. Mack MJ, Leon MB, Thourani VH, et al. Transcatheter aortic-valve replacement with a balloon-expandable valve in low-risk patients. N Engl J Med. 2019;380(18):1695–1705. doi:10.1056/NEJMoa1814052
2. Popma JJ, Deeb GM, Yakubov SJ, et al. Transcatheter aortic-valve replacement with a self-expanding valve in low-risk patients. N Engl J Med. 2019;380(18):1706–1715. doi:10.1056/NEJMoa1816885
3. Leon MB, Smith CR, Mack M, et al. Transcatheter aortic-valve implantation for aortic stenosis in patients who cannot undergo surgery. N Engl J Med. 2010;363(17):1597–1607. doi:10.1056/NEJMoa1008232
4. Leon MB, Smith CR, Mack MJ, et al. Transcatheter or surgical aortic-valve replacement in intermediate-risk patients. N Engl J Med. 2016;374(17):1609–1620. doi:10.1056/NEJMoa1514616
5. Mangieri A, Montalto C, Poletti E, et al. Thrombotic versus bleeding risk after transcatheter aortic valve replacement: JACC review topic of the week. J Am Coll Cardiol. 2019;74(16):2088–2101. doi:10.1016/j.jacc.2019.08.1032
6. Kibler M, Marchandot B, Messas N, et al. Primary hemostatic disorders and late major bleeding after transcatheter aortic valve replacement. J Am Coll Cardiol. 2018;72(18):2139–2148. doi:10.1016/j.jacc.2018.08.2143
7. Honda Y, Yamawaki M, Araki M, et al. Impact of HAS-BLED score to predict trans femoral transcatheter aortic valve replacement outcomes. Catheter Cardiovasc Interv. 2018;92(7):1387–1396. doi:10.1002/ccd.27596
8. Navarese EP, Zhang Z, Kubica J, et al. Development and validation of a practical model to identify patients at risk of bleeding after TAVR. JACC Cardiovasc Interv. 2021;14(11):1196–1206. doi:10.1016/j.jcin.2021.03.024
9. Goldstein BA, Navar AM, Carter RE. Moving beyond regression techniques in cardiovascular risk prediction: applying machine learning to address analytic challenges. Eur Heart J. 2017;38(23):1805–1814. doi:10.1093/eurheartj/ehw302
10. Hernandez-Suarez DF, Kim Y, Villablanca P, et al. Machine learning prediction models for in-hospital mortality after transcatheter aortic valve replacement. J Am Coll Cardiol Intv. 2019;12(14):1328–1338. doi:10.1016/j.jcin.2019.06.013
11. Gomes B, Pilz M, Reich C, et al. Machine learning-based risk prediction of intrahospital clinical outcomes in patients undergoing TAVI. Clin Res Cardiol. 2021;110(3):343–356. doi:10.1007/s00392-020-01691-0
12. Lopes RR, van Mourik MS, Schaft EV, et al. Value of machine learning in predicting TAVI outcomes. Neth Heart J. 2019;27(9):443–450. doi:10.1007/s12471-019-1285-7
13. Agasthi P, Ashraf H, Pujari SH, et al. Artificial intelligence trumps TAVI(2)-SCORE and CoreValve score in predicting 1-year mortality post-transcatheter aortic valve replacement. Cardiovasc Revasc Med. 2021;24:33–41. doi:10.1016/j.carrev.2020.08.010
14. Penso M, Pepi M, Fusini L, et al. Predicting long-term mortality in TAVI patients using machine learning techniques. J Cardiovasc Dev Dis. 2021;8(4):44.
15. LeCun Y, Bengio Y, Hinton G. Deep learning. Nature. 2015;521(7553):436–444. doi:10.1038/nature14539
16. Ching T, Zhu X, Garmire LX. Cox-nnet: an artificial neural network method for prognosis prediction of high-throughput omics data. PLoS Comput Biol. 2018;14(4):e1006076. doi:10.1371/journal.pcbi.1006076
17. Wang D, Jing Z, He K, Garmire LX. Cox-nnet v2. 0: improved neural-network-based survival prediction extended to large-scale EMR data. Bioinformatics. 2021;37(17):2772–2774. doi:10.1093/bioinformatics/btab046
18. Katzman JL, Shaham U, Cloninger A, Bates J, Jiang T, Kluger Y. DeepSurv: personalized treatment recommender system using a Cox proportional hazards deep neural network. BMC Med Res Methodol. 2018;18(1):24. doi:10.1186/s12874-018-0482-1
19. Moons KG, Altman DG, Reitsma JB, et al. Transparent Reporting of a multivariable prediction model for Individual Prognosis or Diagnosis (TRIPOD): explanation and elaboration. Ann Intern Med. 2015;162(1):W1–73. doi:10.7326/M14-0698
20. Kappetein AP, Head SJ, Généreux P, et al. Updated standardized endpoint definitions for transcatheter aortic valve implantation: the valve academic research consortium-2 consensus document. Eur Heart J. 2012;33(19):2403–2418. doi:10.1093/eurheartj/ehs255
21. Généreux P, Cohen DJ, Mack M, et al. Incidence, predictors, and prognostic impact of late bleeding complications after transcatheter aortic valve replacement. J Am Coll Cardiol. 2014;64(24):2605–2615. doi:10.1016/j.jacc.2014.08.052
22. Stekhoven DJ, Bühlmann P. MissForest–non-parametric missing value imputation for mixed-type data. Bioinformatics. 2012;28(1):112–118. doi:10.1093/bioinformatics/btr597
23. Chawla NV, Bowyer KW, Hall LO, Kegelmeyer WP. SMOTE: synthetic minority over-sampling technique. J Artif Intell Res. 2002;16:321–357. doi:10.1613/jair.953
24. Kingma DP, Adam: BJ. A method for stochastic optimization. arXiv Preprint arXiv:14126980; 2014.
25. Kokhlikyan N, Miglani V, Martin M, et al. Captum: a unified and generic model interpretability library for pytorch. arXiv Preprint arXiv:200907896; 2020.
26. Steyerberg EW, Vergouwe Y. Towards better clinical prediction models: seven steps for development and an ABCD for validation. Eur Heart J. 2014;35(29):1925–1931. doi:10.1093/eurheartj/ehu207
27. Austin PC, Harrell JFE, van Klaveren D. Graphical calibration curves and the integrated calibration index (ICI) for survival models. Stat Med. 2020;39(21):2714–2742. doi:10.1002/sim.8570
28. Smith GC, Seaman SR, Wood AM, Royston P, White IR. Correcting for optimistic prediction in small data sets. Am J Epidemiol. 2014;180(3):318–324. doi:10.1093/aje/kwu140
29. Bello GA, Dawes TJW, Duan J, et al. Deep learning cardiac motion analysis for human survival prediction. Nat Mach Intell. 2019;1:95–104. doi:10.1038/s42256-019-0019-2
30. Piccolo R, Pilgrim T, Franzone A, et al. Frequency, timing, and impact of access-site and non-access-site bleeding on mortality among patients undergoing transcatheter aortic valve replacement. JACC Cardiovasc Interv. 2017;10(14):1436–1446. doi:10.1016/j.jcin.2017.04.034
31. Trimaille A, Marchandot B, Park S-H, Schini-Kerth V, Morel O. The difficult balance between thrombosis and bleeding after transcatheter aortic valve replacement: a translational review. Arch Cardiovasc Dis. 2020;113(4):263–275. doi:10.1016/j.acvd.2019.12.003
32. Ranasinghe MP, Peter K, McFadyen JD. Thromboembolic and bleeding complications in transcatheter aortic valve implantation: insights on mechanisms, prophylaxis and therapy. J Clin Med. 2019;8(2):280.
33. Fanaroff AC, Manandhar P, Holmes DR, et al. Peripheral artery disease and transcatheter aortic valve replacement outcomes. Circ Cardiovasc Interv. 2017;10(10):e005456. doi:10.1161/CIRCINTERVENTIONS.117.005456
34. She Y, Jin Z, Wu J, et al. Development and validation of a deep learning model for non-small cell lung cancer survival. JAMA Netw Open. 2020;3(6):e205842. doi:10.1001/jamanetworkopen.2020.5842
35. Matsuo K, Purushotham S, Jiang B, et al. Survival outcome prediction in cervical cancer: cox models vs deep-learning model. Am J Obstet Gynecol. 2019;220(4):
36. Wang H, Raj B. On the origin of deep learning. arXiv Preprint arXiv:170207800; 2017.
 © 2022 The Author(s). This work is published and licensed by Dove Medical Press Limited. The full terms of this license are available at https://www.dovepress.com/terms.php and incorporate the Creative Commons Attribution - Non Commercial (unported, v3.0) License.
By accessing the work you hereby accept the Terms. Non-commercial uses of the work are permitted without any further permission from Dove Medical Press Limited, provided the work is properly attributed. For permission for commercial use of this work, please see paragraphs 4.2 and 5 of our Terms.
© 2022 The Author(s). This work is published and licensed by Dove Medical Press Limited. The full terms of this license are available at https://www.dovepress.com/terms.php and incorporate the Creative Commons Attribution - Non Commercial (unported, v3.0) License.
By accessing the work you hereby accept the Terms. Non-commercial uses of the work are permitted without any further permission from Dove Medical Press Limited, provided the work is properly attributed. For permission for commercial use of this work, please see paragraphs 4.2 and 5 of our Terms.