")
Back to Journals » Neuropsychiatric Disease and Treatment » Volume 15
Decreased Vascular Pulsatility in Alzheimer’s Disease Dementia Measured by Transcranial Color-Coded Duplex Sonography
Authors Ortner M, Hauser C , Schmaderer C, Muggenthaler C, Hapfelmeier A , Sorg C, Diehl-Schmid J , Kurz A, Förstl H, Ikenberg B, Kotliar K , Poppert H , Grimmer T
Received 2 August 2019
Accepted for publication 15 November 2019
Published 20 December 2019 Volume 2019:15 Pages 3487—3499
DOI https://doi.org/10.2147/NDT.S225754
Checked for plagiarism Yes
Review by Single anonymous peer review
Peer reviewer comments 2
Editor who approved publication: Dr Roger Pinder
Marion Ortner,1 Christine Hauser,2 Christoph Schmaderer,2 Claudia Muggenthaler,1 Alexander Hapfelmeier,3 Christian Sorg,1,4 Janine Diehl-Schmid,1 Alexander Kurz,1 Hans Förstl,1 Benno Ikenberg,5 Konstantin Kotliar,6 Holger Poppert,5,7,* Timo Grimmer1,*
1Technical University of Munich, School of Medicine, Klinikum Rechts der Isar, Department of Psychiatry and Psychotherapy, Munich, Germany; 2Technical University of Munich, School of Medicine, Klinikum Rechts der Isar, Department of Nephrology, Munich, Germany; 3Technical University of Munich, School of Medicine, Klinikum Rechts der Isar, Institute for Medical Statistics and Epidemiology, Munich, Germany; 4Technical University of Munich, School of Medicine, Klinikum Rechts der Isar, Department of Diagnostic and Interventional Neuroradiology, Munich, Germany; 5Technical University of Munich, School of Medicine, Klinikum Rechts der Isar, Department of Neurology, Munich, Germany; 6Department of Medical Engineering and Technomathematics, FH Aachen, Jülich, Germany; 7Department of Neurology, Helios Dr. Horst Schmid Kliniken Wiesbaden, Wiesbaden, Germany
*These authors contributed equally to this work
Correspondence: Marion Ortner
Technical University of Munich, School of Medicine, Klinikum Rechts der Isar, Department of Psychiatry and Psychotherapy, Moehlstr. 26 81675, Muenchen, Germany
Tel +49 89 4140 6463
Fax +49 89 4140 4923
Email [email protected]
Purpose: Impaired paravascular drainage of β-Amyloid (Aβ) has been proposed as a contributing cause for sporadic Alzheimer’s disease (AD), as decreased cerebral blood vessel pulsatility and subsequently reduced propulsion in this pathway could lead to the accumulation and deposition of Aβ in the brain. Therefore, we hypothesized that there is an increased impairment in pulsatility across AD spectrum.
Patients and Methods: Using transcranial color-coded duplex sonography (TCCS) the resistance and pulsatility index (RI; PI) of the middle cerebral artery (MCA) in healthy controls (HC, n=14) and patients with AD dementia (ADD, n=12) were measured. In a second step, we extended the sample by adding patients with mild cognitive impairment (MCI) stratified by the presence (MCI-AD, n=8) or absence of biomarkers (MCI-nonAD, n=8) indicative for underlying AD pathology, and compared RI and PI across the groups. To control for atherosclerosis as a confounder, we measured the arteriolar-venular-ratio of retinal vessels.
Results: Left and right RI (p=0.020; p=0.027) and left PI (p=0.034) differed between HC and ADD controlled for atherosclerosis with AUCs of 0.776, 0.763, and 0.718, respectively. The RI and PI of MCI-AD tended towards ADD, of MCI-nonAD towards HC, respectively. RIs and PIs were associated with disease severity (p=0.010, p=0.023).
Conclusion: Our results strengthen the hypothesis that impaired pulsatility could cause impaired amyloid clearance from the brain and thereby might contribute to the development of AD. However, further studies considering other factors possibly influencing amyloid clearance as well as larger sample sizes are needed.
Keywords: pulsatility index, PI, resistance index, RI, biomarker, mild cognitive impairment, MCI, Alzheimer’s dementia
Introduction
The characteristic histopathological features of Alzheimer’s disease (AD) include senile plaques containing Amyloid β (Aβ) and neurofibrillary tangles with tau deposition in conjunction with loss of neurons and synapses.1,2 Whereas the diagnosis of AD dementia (ADD) is based on clinical criteria3 two categories of biomarkers reflecting the histopathological features are used to support the diagnosis of AD as underlying etiology. First, biomarkers for neuronal degeneration including elevated tau protein in cerebrospinal fluid (CSF), specific regions with reduced 18F-Fluordeoxyglucose (FDG) uptake on positron emission tomography (PET), and atrophy on magnetic resonance imaging (MRI).3 Secondly, biomarkers for Aβ accumulation, namely decreased Aβ42 in CSF or positive uptake of an amyloid tracer on PET.3 According to the amyloid hypothesis of the development of AD, Aβ is the first biomarker to change and to pass detection threshold.4
However, the mechanisms ultimately resulting in senile plaques remain vastly unclear. Only 1–3% of AD patients have a known genetic mutation leading to overproduction and, as a consequence, to aggregation of Aβ.5 In sporadic AD, one hypothesis is that impaired clearance of Aβ from the brain contributes to cerebral amyloid deposition.6 This notion is strengthened by a number of findings. Age, the biggest risk factor for dementia, seems to be associated with decreased Aβ clearance. This has been shown in lab animals and humans. Late onset AD patients have identical Aβ production but their Aβ clearance rate is 30% lower than normal controls.7 Compared to young wild type mice, Aβ clearance is reduced by 40% in old mice.8 Transgenic amyloid precursor protein mice produce more Aβ, which can be measured in higher plasma concentrations. As mice age the amount of Aβ in their brains markedly increases while plasma concentrations decrease by half, suggesting an age-related reduction of Aβ clearance from the brain.9 Potter et al demonstrated that human carriers of presenilin mutations had a decreased fractional turnover rate for Aβ42 in addition to Aβ overproduction.10
Elimination of Aβ from the brain is achieved in three ways: local degradation and both via the blood brain barrier (BBB) and perivascular pathways.11 Pericapillary Aβ appears to be a very early form of Aβ-deposition, possibly caused by altered perivascular clearance resulting in the accumulation of Aβ in perivascular pathways.12–14 Yet it remains unclear if impaired clearance mechanisms of Aβ result in its accumulation or if Aβ deposition results in impaired clearance capacity. Until the discovery of the glymphatic system, a perivascular glial-dependent clearance pathway,15 the efflux of Aβ across the BBB had been thought to be the most important clearing pathway for amyloid from the brain. However, Iliff et al were able to demonstrate that the majority of large proteins and solutes, including Aβ, are most likely cleared from the brain parenchyma through the glymphatic system.15 Since this system was first described, a number of studies have supported its importance as a clearance pathway.16–19
Glymphatic clearance capacities seem to be affected by sleep. During sleep, interstitial space increases by more than 60% while Aβ levels decrease,20,21 indicating a rise in the amyloid clearance rate. It has also been shown that glymphatic clearance is reduced even prior to the presence of substantial Aβ deposition in transgenic mice,17 thereby strengthening the hypothesis that impaired Aβ elimination might play a major role in AD.
Rennels et al suspected arterial pulsation as the driving force in perivascular clearing pathways even before the glymphatic system was discovered22,23 and Nilsson et al observed the dependence of pulsatile CSF flow on the cardiac cycle.24 Studies in mice and humans have shown that cerebral arterial pulsation was a driving force for paravascular fluid exchange in the brain18,25 and that glymphatic perfusion seemed to depend on arterial patency.26 Kiviniemie et al demonstrated that in addition to cardiac pulses, respiratory pulsations and very low-frequency pulsations affected CSF pulsation and thereby perivascular clearance.25 The existence of other driving factors besides cardiac pulses was further supported by Aldea et al, who suggested intrinsic vasomotion of cerebrovascular smooth muscle cells as the major motive force in glymphatic clearance.27
In patients with ADD, previous studies using transcranial Doppler (TCD) ultrasound revealed an increased pulsatility index (PI), an increased resistance index (RI), and a decreased cerebral artery mean flow velocity (MFV).28–32 In a large population-based study from the Netherlands decreased cerebral blood flow velocity was associated with dementia.33 A possible reason for higher PIs in AD patients could be an increased wall rigidity caused by cerebral small vessel disease, eg, atherosclerosis, or by amyloid angiopathy.13,34 Small vessel disease constitutes a risk factor for Alzheimer’s dementia35 and contributes to the symptoms of dementia.36 Furthermore, the extent of white matter hyperintensities, a common marker for cerebral small vessel disease on MRI,37 predicts the progression of intracerebral amyloid deposition.38
Impaired cerebral blood vessel pulsatility and subsequently reduced propulsion in the perivascular spaces could affect the drainage pathway of Aβ and subsequently lead to its accumulation and finally deposition in the form of Aβ plaques in the brain. This hypothesis is strengthened by the finding that older mice have a reduced pulsatility of intracortical arterioles and impaired amyloid clearance.8 There is also evidence of impaired vascular function in humans with cerebral amyloid deposition. In non-demented older adults with fibrillary amyloid deposition on PET scan, increased amyloid burden was associated with reduced cerebral vascular autoregulation.39 As retinal vessels share similar anatomy, physiology and embryology with cerebral vessels, they have been deemed a good surrogate to directly assess the state of cerebral small vessels.40 Parameters of retinal microcirculation, in particular of static analysis of retinal vessels, appear to be markers for cerebral microcirculation.41–44 Atherosclerosis and other microvascular disorders are associated with a reduced retinal arteriolar-venular ratio (AVR) characterized by narrowed retinal arterioles and/or wide retinal veins.43,45 A smaller AVR caused by arteriolar narrowing or venous enlargement was associated with cardiovascular disease, cerebral white matter lesions on MRI and increased risk of dementia.46–49
In a pilot study, we set out to further support the thesis that impaired vascular pulsatility might be present in ADD as compared to cognitively healthy controls, and thus supporting the thesis that amyloid clearance pathways might be impaired in AD. To this purpose, we measured the resistance index (RI) and pulsatility index (PI) of the middle cerebral arteries by transcranial color-coded duplex sonography (TCCS) in healthy controls (HC) and patients with Alzheimer’s dementia (ADD). Additionally, we measured the retinal arteriolar-venular ratio (AVR), a marker of atherosclerosis, as a possible confounder. In a second step, we compared the RIs and PIs of patients with mild cognitive impairment (MCI), a risk stage of pre-dementia AD pathology, to the groups mentioned formerly. We expected an increase of RI and PI with advancing stages of AD. Based on the results of this pilot study we calculated minimal sample sizes required for confirmative studies.
Materials and Methods
Ethics Statement
The study protocol was submitted to the ethic committee of the Faculty of Medicine of the Technical University of Munich, Munich, Germany that raised no objections and approved the protocol (reference number 118–14). All patients gave written informed consent prior to any study-specific procedures and all clinical investigations have been conducted in accordance with the principles of the Declaration of Helsinki, sixth revision.
Patient Recruitment, Inclusion and Exclusion Criteria
Three groups of participants were recruited: patients with mild-to-moderate dementia due to probable AD fulfilling the standard diagnostic criteria (ADD patients),3 healthy control subjects (HC) and patients with mild cognitive impairment (MCI). In accordance with Albert et al, MCI was further divided into (a) MCI with intermediate or high likelihood to be due to AD, ie, Aβ biomarker positive (MCI-AD), and (b) MCI unlikely due to AD, ie, Aβ biomarker negative (MCI-nonAD).50
Patients with ADD and MCI were recruited from the research outpatient unit for cognitive disorders at the Department of Psychiatry, Klinikum rechts der Isar, Technical University of Munich, Munich, Germany. They had been referred for the diagnostic evaluation of cognitive impairment by self-referral, general practitioners, neurologists, psychiatrists, or other institutions. The standardized diagnostic work-up included an interview with the patient and an informant, psychiatric, neurologic, and physical examinations, neuropsychological evaluations including the Mini-Mental state examination (MMSE),51 and the Consortium to Establish a Registry for Alzheimer’s Disease Neuropsychological Assessment Battery (CERAD-NAB),52 a routine laboratory screen, and APOE genotyping. The severity of cognitive impairment was rated on the Clinical Dementia Rating scale (CDR, global CDR score of 0.5 for MCI and 1–2 for ADD, respectively); the sub-scores were used to calculate the CDR sum of boxes (CDR SOB).53 Cranial magnetic resonance imaging (MRI) was performed to assess structural brain abnormalities, white matter hyperintensities, and microbleeds, which is a typical finding in amyloid angiopathy. MRI scans were assessed by visual expert opinion of an experienced radiologist from the department of neuroradiology. In MCI subjects biomarkers for AD as suggested by Albert et al50 were tested. Subjects with at least one biomarker indicative for amyloid pathology, namely decreased Aβ42 in CSF or positive uptake of an amyloid tracer on PET, were considered biomarker positive (MCI-AD). In case of no available biomarker for amyloid pathology, hippocampal atrophy or temporoparietal hypometabolism on FDG-PET were required for subjects to be considered MCI-AD as both modalities have shown a very high accuracy in predicting conversion from MCI to ADD.54,55 Subjects with elevated tau protein in CSF and no other AD typical changes were not included in the MCI-AD sample. Subjects were considered to be MCI-nonAD when there was either no positive biomarker at all or any biomarker test results for amyloid pathology were negative, eg, no uptake on PiB-PET or normal values for Aβ42 in CSF.
HC subjects were defined as having no subjective memory complaints, normal results in all subtests of the CERAD-NAB and a CDR global score of 0. HC were mainly spouses of patients or volunteers recruited via Word-of-Mouth advertising.
Participants were excluded if they were incapable to provide written informed consent, had severe disturbances in regular heart rate (eg, atrial fibrillation), hemodynamic relevant extracranial stenosis on extra cranial color-coded duplex sonography (ECCS), or insufficient bone window for TCCS. Patients were also excluded if they showed any major abnormalities on MRI, such as brain infarcts, extensive leucoencephalopathy, intracerebral aneurysm, or arteriovenous malformation. National Institute of Neurological Disorders and Stroke – Association Internationale pour la Recherche et l ́Enseignement en Neurosciences (NINDS-AIREN) criteria were used to exclude vascular dementia.56 Participants were not included in the study if they met diagnostic criteria for other neurological or psychiatric disorders, including Parkinson’s disease, normal pressure hydrocephalus, progressive nuclear palsy, or major depression. Further exclusion criteria were other possible causes of cognitive impairment such as sedating psychotropic medication (eg, tricyclic antidepressants, low-potent antipsychotics), substance misuse, or major abnormalities in routine blood testing.
Doppler Ultrasound Assessment
Doppler examinations were performed using an ACUSON S2000TM Ultrasound System (Siemens Medical Solutions USA Inc., Mountain View, CA, USA) with a 9L4 transducer for ECCS and a 4V1c transducer for TCCS. ECCS was used to rule out any extracranial stenosis. Systolic and diastolic velocity (Vsyst, Vdiast) and mean flow velocity (MFV) were measured in cm/s at the left and right middle cerebral artery (MCA). The resistance index (RI = (Vsyst – Vdiast)/Vsyst)57 and the pulsatility index (PI = (Vsyst – Vdiast)/MFV)58 from two consecutive measurements were calculated. The averaged values were used for all subsequent statistical analyses.
Arteriolar-Venular Ratio (AVR)
To assess the AVR as a marker of cerebrovascular disease, static retinal vessel analysis (SVA) was performed. Using a non-mydriatic retinal camera Topcon NW200 (Topcon, Japan), 30° color retinal photographs of each study participants were taken with the optic disc in the center. The photographs were processed and analyzed using Visuals and Vessel Map Software (IMEDOS Systems Ltd., Jena, Germany). The diameters of retinal arterioles and venules were measured as described previously45 and reported with three main parameters. Central retinal arteriolar and venular equivalents (CRAE, CRVE) as estimates of diameters of central retinal artery and vein were calculated using the Parr-Hubbard formula.46 The ratio of CRAE/CRVE named as the retinal AVR was calculated additionally. The values of CRAE and CRVE were expressed in measuring units (MU). In the Gullstrand`s normal eye model 1 MU equals 1 µm.
Statistical Analyses
In the initial analyses of HC and ADD group comparisons of all clinical variables were performed using Mann–Whitney U-test for continuous variables and Fisher’s exact test for categorical variables. As data of this study were not normally distributed Mann–Whitney U-test as a non-parametric test was used to calculate differences of RI and PI between HC and ADD. In a second step the MCI groups stratified by the presence or absence of biomarkers for AD were added to the analyses. Group comparisons were calculated using Kruskal–Wallis test for continuous variables and linear-by-linear association for categorical variables. If the group comparison yielded a statistically significant result pairwise Mann–Whitney U-test or Fisher’s exact test was calculated for that respective variable. Differences between HC and ADD regarding the AVR as a retinal marker for cerebrovascular damage were tested using Mann–Whitney U-test. Areas under the curves (AUC) were analyzed using receiver operating characteristic (ROC) curves and the best cut-off values (maximum value of Youden’s J) for the left and right MCA between HC and ADD were calculated. In addition, the ability to discriminate HC, MCI, and ADD subjects by RI and PI measurements of the left and right MCA was assessed through ROC analysis for clustered data.59 Spearman correlation analyses between the CDR SOB and the RIs and PIs in the whole patient group and in the AD spectrum group (HC, MCI-AD, ADD) were calculated. IBM SPSS statistics 22.0 software was used to calculate all analyses (IBM Corporation, Armonk, New York, United States). For all tested hypotheses the level of significance was set to <0.05.
We used G*power60,61 for minimal sample size calculations (α = 0.05; power = 0.8).
Results
Characteristics of Participants
Characteristics of participants are shown in Table 1. 12 Patients with ADD and 14 HC were included in the study. The two groups did not statistically differ in age or sex. ADD patients scored significantly worse on MMSE z-scores, CERAD-NAB global and CDR SOB scores. We also included 16 patients with MCI of which 8 were positive (MCI-AD) and 8 were negative (MCI-nonAD) for AD biomarkers. Characteristics of MCI cohorts are shown in Supplementary Table 1. The following biomarkers were used to determine whether a subject was considered MCI-AD or MCI-nonAD: PiB-PET (n=10), FDG-PET (n=15), hippocampal atrophy (n=16), CSF-Aβ42 (n=6), CSF-Tau (n=6). There were no significant differences regarding age and sex between the individual groups. HC subjects scored significantly better than ADD patients on MMSE, CERAD-NAB battery and CDR scores (see Table 1). When looking at the extended sample both MCI groups scored significantly better than ADD and worse than HC (see Supplementary Table 1). 18 possible study participants did not have a sufficient bone window for TCCS. Two of them additionally had other causes for dementia. There were no significant hemodynamic findings in the ECCS or TCCS that necessitated any form of intervention or resulted in the exclusion from the study. For a diagram displaying the progress of participants please compare Supplementary Figure 1.
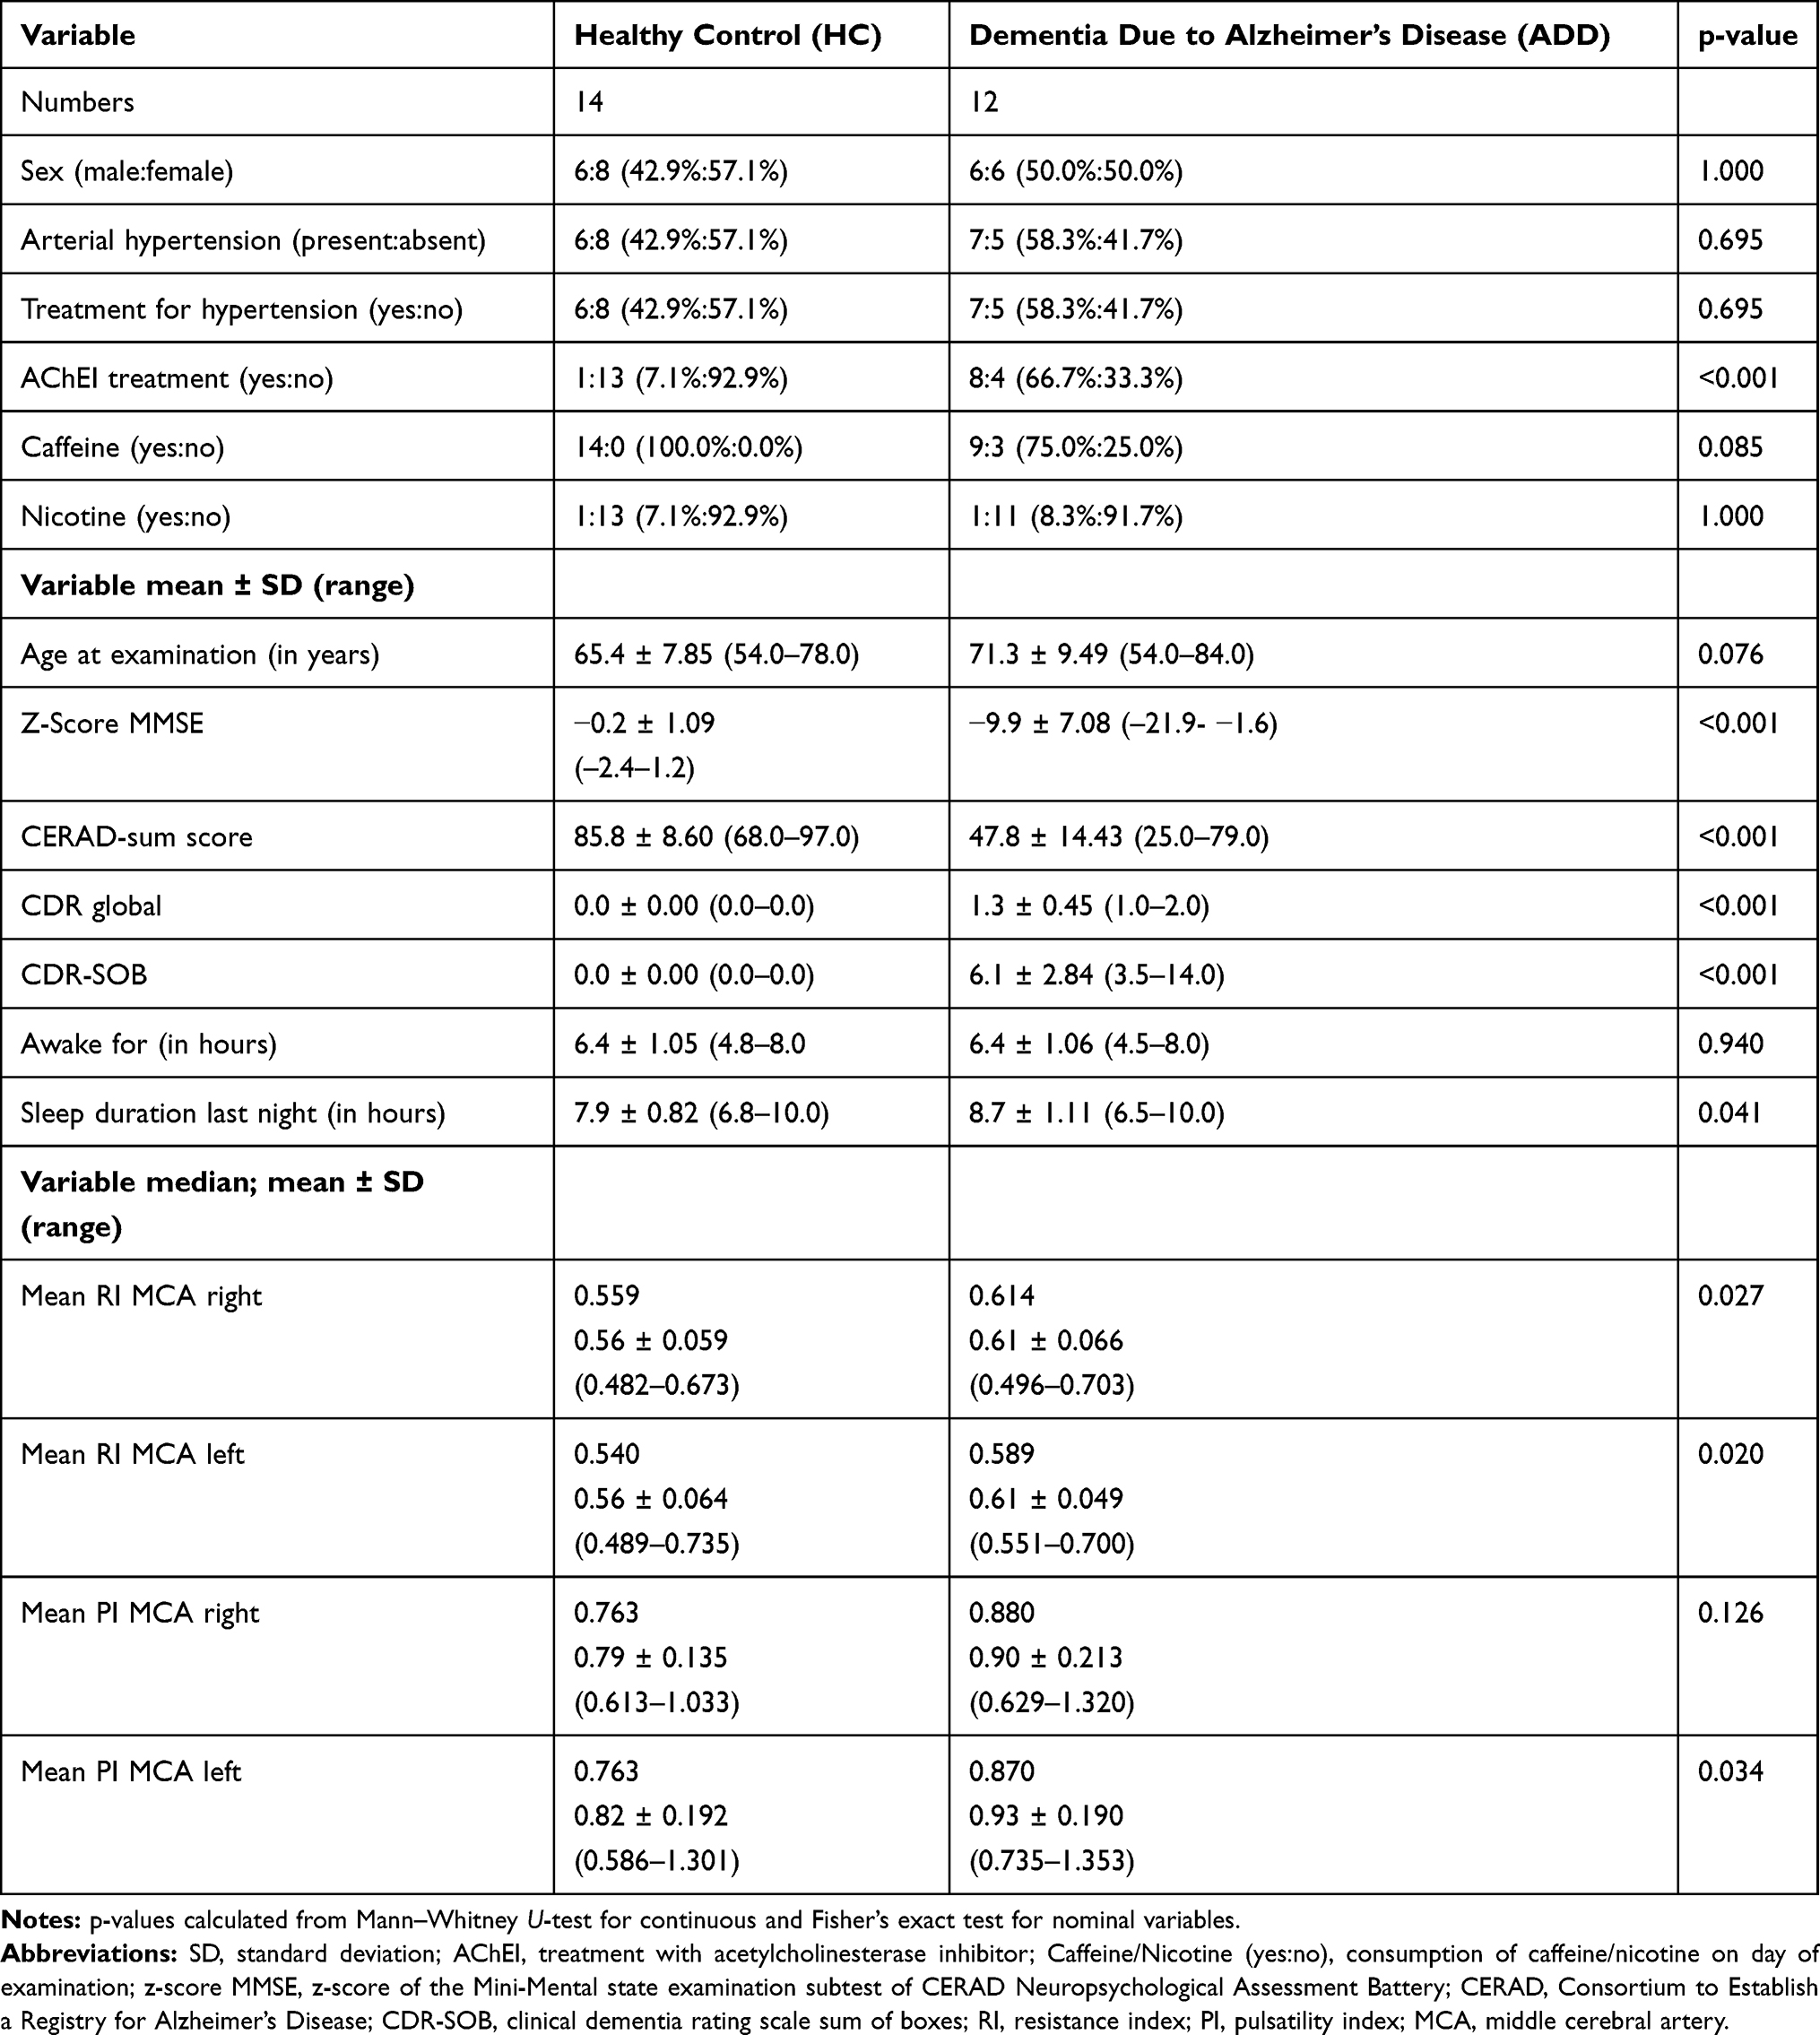 |
Table 1 Characteristics of HC and ADD Participants |
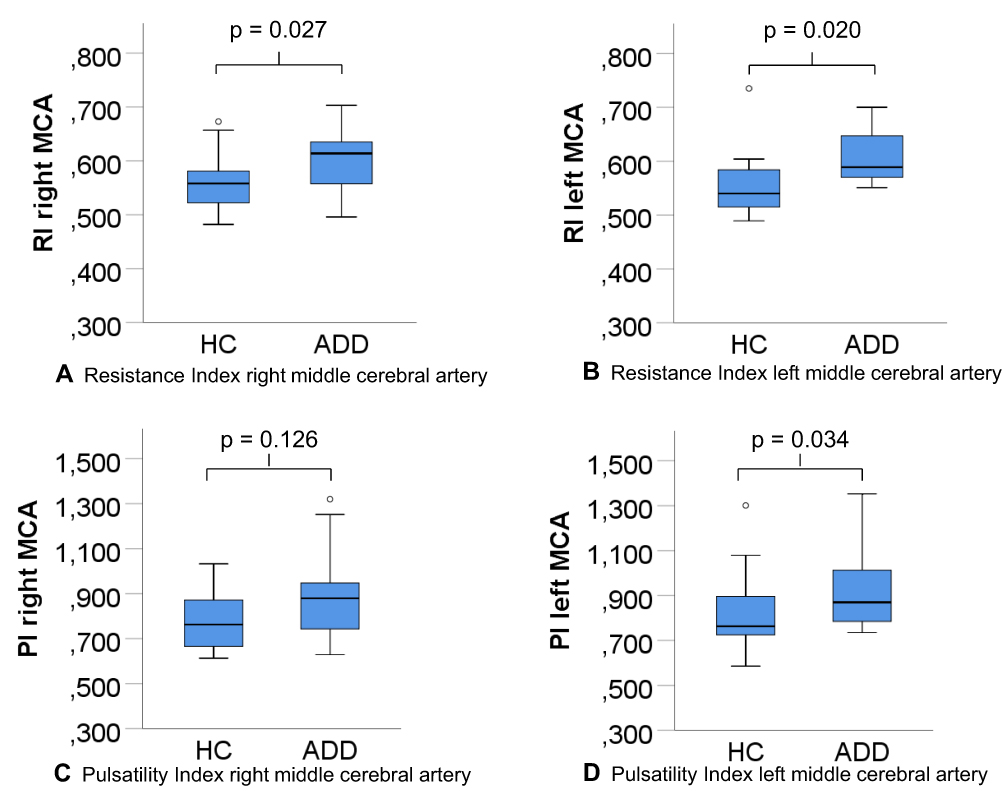 |
Figure 1 (A–D) Resistance and pulsatility indices middle cerebral artery. Abbreviations: RI, resistance index; PI, pulsatility index; MCA, middle cerebral artery; HC, healthy controls; ADD, Alzheimer’s disease dementia. |
Differences of RI and PI Between HC and ADD
The RI of the left and right MCA, and the PI of the left MCA were significantly higher in patients with ADD compared to HC (p=0.027 RI right MCA, p=0.020 RI left MCA, p=0.034 PI left MCA, respectively, Table 1, Figure 1). The differences in the right PI did not attain statistical significance. A univariate ANOVA using the respective RI and PI as the dependent variable and the diagnostic group as the independent variable, controlling for age, did not significantly alter the results.
Differences of RI and PI Between HC, MCI and ADD
While group comparisons did not attain statistical significance, RI and PI of the MCI-nonAD group tended towards the mean values measured in HC, whereas mean values of MCI-AD patients tended towards mean values of the ADD group (Supplementary Figure 2, Supplementary Table 1). A univariate ANOVA using the respective RI and PI as the dependent variable and the diagnostic group as the independent variable controlling for age did not significantly alter the results.
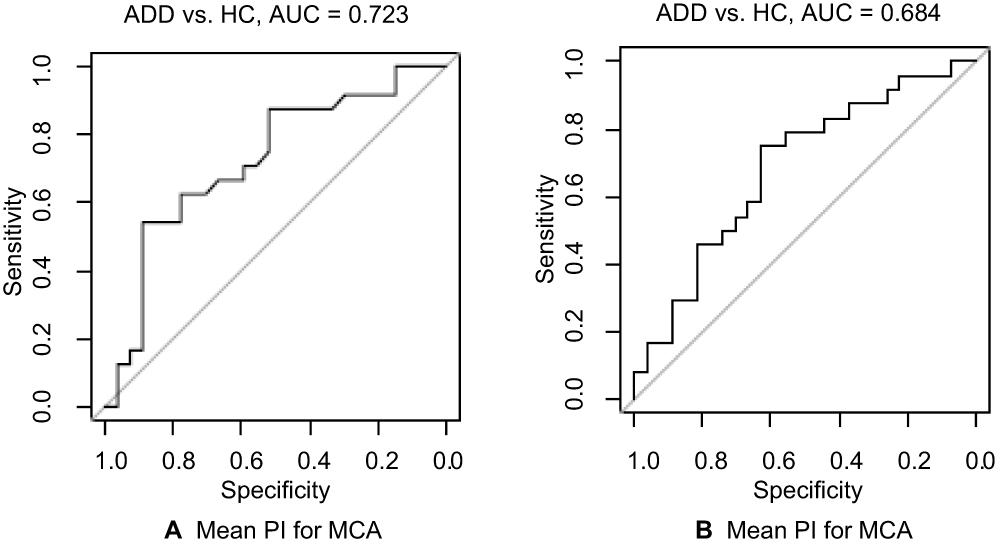 |
Figure 2 (A, B) ROC analyses for clustered data. Abbreviations: ADD, Alzheimer’s disease dementia; HC, healthy controls; AUC, area under the curve; RI, resistance index; PI, pulsatility index; MCA, middle cerebral artery. |
Arteriolar-Venular Ratio (AVR)
Comparing the AVRs of HC and ADD subjects we found no significant difference (p=0.308; see Supplementary Table 2).
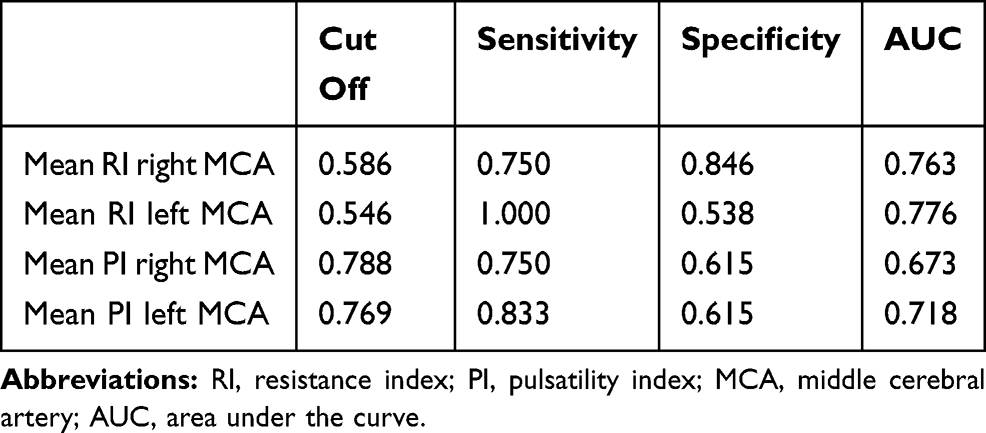 |
Table 2 ROC Analyses for RI and PI of the Right and Left MCA |
ROC Curves
For differentiating HC from ADD AUCs of the RIs of the right and left MCA were 0.763 and 0.776, respectively. AUCs of the PIs of the right and left MCA were 0.673 and 0.718, respectively (Table 2). Using the best cut-off values, the sensitivity ranged from 75.0% for the RI and PI of the right MCA to 100% for the RI of the left MCA, while the specificity ranged from 53.8% to 84.6%. Best cut-off values for the RI of the right and left MCA were 0.586 and 0.546, respectively. Best cut-off values for the PI of the right and left MCA were 0.788 and 0.769, respectively.
The additional ROC analyses for clustered data showed an AUC of 0.723 (p=0.021) for the RI and an AUC of 0.684 (p=0.058) for the PI (Table 3). ROC curves are shown in Figure 2. ROC curves comparing the other groups are shown in Supplementary Figure 3.
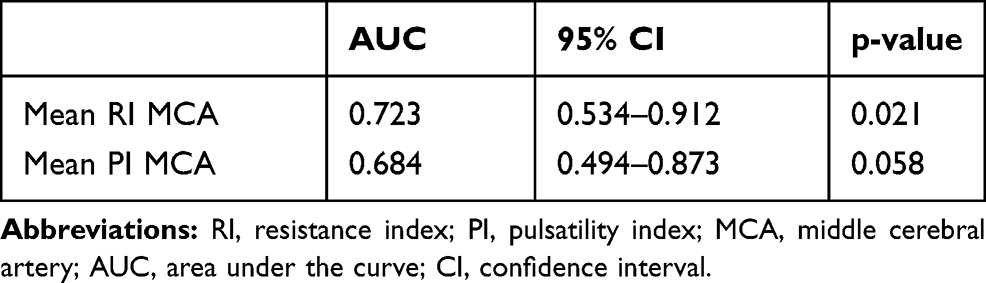 |
Table 3 ROC Analyses for Clustered Data of RI and PI of the MCA |
CDR SOB and PI/RIs
CDR SOB was significantly associated with the RI of the right MCA, the RI of the left MCA, and the PI of the left MCA throughout the whole sample (Table 4). When only including the AD continuum of HC, MCI-AD and ADD, excluding MCI-nonAD, CDR SOB was also significantly associated with the RI of the right MCA, the RI of the left MCA, and with the PI of the left MCA (Table 4).
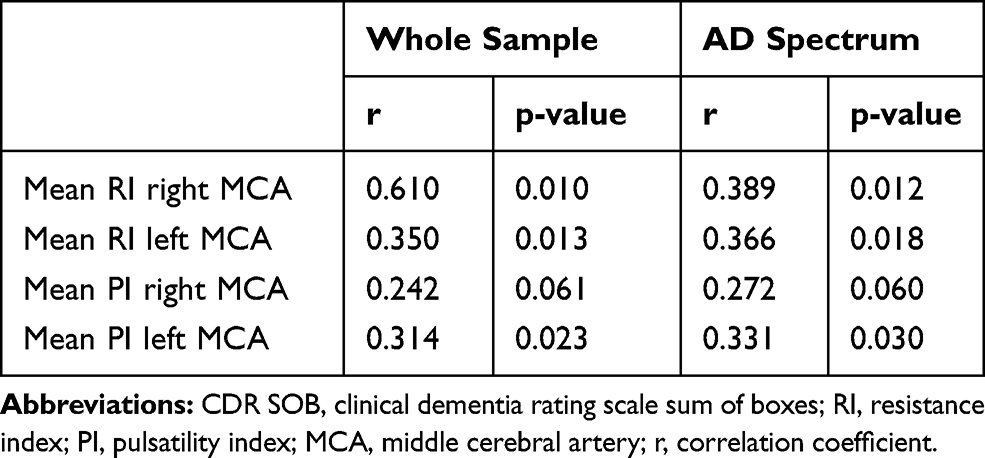 |
Table 4 Spearman Correlation Analyses Between the CDR SOB and the RI and PI for All Participants |
Minimal Sample Size Calculation
Based on mean values and standard deviations, minimal sample sizes were calculated. When comparing HC with ADD, minimal sample sizes for each cohort ranged from n = 22 (RI left MCA) to n= 49 (PI left MCA). Results from all calculations are shown in Table 5 and Supplementary Table 2.
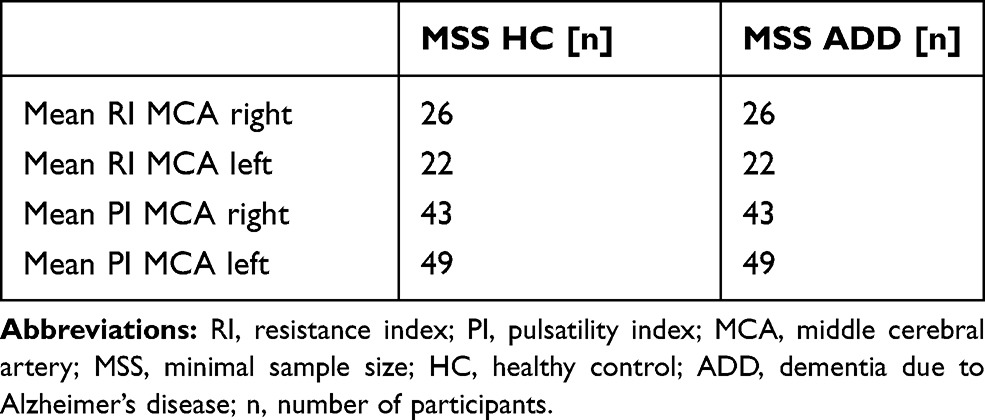 |
Table 5 Minimal Sample Size Calculation |
Discussion
Based on the amyloid clearance hypothesis, we investigated changes in PI and RI in Alzheimer’s disease. Consistent with previous results and our hypothesis we found a significant difference of the left and right RI and of the left PI between HC and ADD. RI and PI of the MCI groups ranged between HC and ADD. Extending previous studies, we sub classified the MCI group depending on AD biomarkers. The RI and PI of MCI patients positive for AD biomarkers tended towards ADD patients, MCI patients negative for AD biomarkers tended towards HC. Moreover, RIs and PIs were significantly associated with disease severity as measured by CDR SOB. Group comparisons were rerun after exclusion of outliers without resulting in changes of the pattern of significant group differences. Our results strengthen the hypothesis that impaired pulsatility is associated with the development of AD. In addition, increased RI and PI could be a consequence of Aβ deposition in the vessel walls.
Our findings are in line with the results from studies by Roher et al, Stefani et al and Jin et al28,30,31 who found an increased PI and RI in patients with possible and probable ADD as compared to HC. The PI of a cohort of 9 amnestic MCI patients was not significantly different as compared to HC and ADD.28 Although methodically different, our findings are also in line with the results of a small pilot study by Claassen et al29 who found a near-significantly reduced cerebral blood flow velocity when comparing probable AD patients with HC. In the Rotterdam study, lower cerebral blood flow velocity was associated not only with dementia, but also with cognitive decline and hippocampal atrophy.33 While Stefani et al and Claasen et al reported results as a global value independent of body sides,29,30 Jin et al and Roher et al calculated values for individual blood vessels on both sides of the brain separately.28,31 Jin et al also obtained results about cardiac function from an echocardiography and investigated white matter changes with MRI. While they saw no differences between HC and AD patients regarding white matter changes and lacunae, the left ventricular ejection fraction (EF) was significantly lower in AD patients. Reduced EF and reduced MFV were independently associated with AD, indicating that heart function may play a role in AD. Jin et al did not give information about the contribution of disease severity in their AD cohort. In contrast to our study, Roher et al found a statistically significant increase of the PI not only of the left but also of the right MCA. Roher et al examined larger groups of HC and ADD subjects than we did. That the increase of the right MCA PI was not significant, while all other measures were, could be attributed to limited statistical power. Regarding the MCI cohort, group sizes are comparable, with 11 MCI subjects in the study by Roher et al and 16 subjects in our study.
All MCI patients in our sample were either amnestic MCI or multi-domain amnestic MCI. As proposed by Albert et al,50 we used biomarkers for amyloid pathology and biomarkers for neuronal injury to determine the likelihood of MCI being due to AD, thereby extending previous studies.28–30 Although not statistically significant the PI and RI of MCI subjects with positive biomarkers for AD tended towards the test results of the ADD group while MCI without positive biomarkers tended towards HC. This result might be interpreted in a way that vascular pulsatility, like other neuropathological or clinical symptoms of AD, increase with increasing disease duration and severity. This interpretation is strengthened by the results of the correlation analyses with disease severity. Using the CDR SOB as a measure of disease severity, significant associations were depicted with PI and RI. Whereas Roher et al28 and Claasen et al29 used the CDR as an instrument to define healthy controls or disease severity, no correlation between the CDR and PI or RI, respectively, are given or discussed by them. In a one year follow-up study by Lim et al32 changes of the PI of the anterior cerebral arteries correlated with increased disease severity measured with the CDR SOB.
While arterial pulsation has been thought to be the main driving force of perivascular clearance, other factors such as respiratory pulsation and (very) low-frequency vasomotor waves have recently been described.25,27,62 To further our knowledge, if indeed impaired clearance of Aβ leads to ADD, studies including all known factors driving elimination would need to be conducted. Furthermore, vascular function might be affected by other factors, such as age-related vascular stiffness or reduced vessel wall pulsatility.8
It is still open for debate whether vascular pathology promotes AD or vice versa. An aspect in favor of vascular pathology promoting AD pathology is that the presence of known cardiovascular risk factors, such as hypertension or smoking, in the middle years of life increases the risk for developing AD later in life.63 Ruitenberg et al could also show that diminished blood flow velocity preceded cognitive decline and hippocampal atrophy in the population-based Rotterdam study.33 While the results of a neuropathologic study by Beach et al suggested an association between Circle of Willis atherosclerosis and AD,64 Honig et al found no association between neuritic plaques and fibrillary tangles with small vessel disease but rather with large vessel disease.65 As we found no difference in the AV ratio, a marker for structural microvascular damage, between HC and ADD, we concluded that in our sample differences in RI and PI could not be directly attributed to atherosclerosis, vascular narrowing or other possible structural alterations of microvessels.
One factor in explaining the hypothesis that AD facilitates small vessel disease might be decreased concentrations of acetylcholine (ACh) in AD. Neurovascular function depends on ACh32 and its lack might cause impaired cerebral circulation and impaired perivascular clearance preceding Aβ deposition on PET scans or Aβ changes in CSF. Some authors found an improvement of neurovascular function in subjects taking Acetylcholine esterase inhibitors (AChEI).66,67 In our sample, 8 out of 12 subjects with ADD took AChEI, while none of the HC subjects did (p<0.001; Pearsons’s χ2). Under the assumption that AChEI improve neurovascular function, one could hypothesize that the differences between HC and ADD in our study would be even more pronounced if ADD patients were not under treatment with an AChEI.
And finally, as a third alternative besides amyloid deposition causing vessel wall stiffening or vice versa, the clogging of perivascular spaces could facilitate both, the development of atherosclerosis and the accumulation of Aβ in the brain without a causative relation among each other.
Our study has some limitations, the biggest being the small sample size. As confirmed by minimal sample size calculations based on the results of this study, a larger sample would be necessary to confirm our findings and make the statistical analyses more robust. Furthermore, biomarkers for amyloid pathology were not available in all subjects. For healthy controls, we had to rely on the absence of cognitive symptoms assessed by neuropsychological tests including the CDR and self-observation of participants. Invasive and potentially harmful procedures, such as lumbar puncture or PET with radiation exposure, were not performed in HC but would have ruled out preclinical AD in this cohort. MCI subjects with CSF biomarkers needed to have amyloid pathology to be considered MCI due to AD. If only Tau was elevated subjects were considered MCI not due to AD. Participants in the MCI cohort without amyloid-PET or CSF needed to show either hippocampal atrophy on MRI or an AD typical hypometabolism on FDG-PET, making it likely that those participants had underlying AD.54,55 However, we would have preferred biomarkers for amyloid pathology in all participants. Another limitation is the method of TCCS. 30% of possible participants we screened failed to have a suitable bone window and could not be included in the study. Sonographers were not informed about the diagnosis of individual participants. Nevertheless, it can be assumed that based on the participants’ behavior the technicians often guessed the cohort and blinding could not be maintained. It would have been impossible for technicians to differentiate between MCI-AD and MCI-non-AD, however. We chose to use the AVR to control for differences of arteriolosclerosis between groups. Retinal vessels, like the diencephalon, derive from the ectoderm and share anatomy and physiology with cerebral arterioles.40,68,69 The AVR is considered a marker of cerebrovascular small vessel disease41,44,70 and a decrease of the AVR is associated with a higher risk of stroke43,71 and progression of white matter lesions.72 However, using a different marker for cerebrovascular disease might have yielded different results.
Another major limitation is that most knowledge about perivascular amyloid clearance has been gathered in animal studies and it has yet to be proven that all mechanisms observed mainly in rodents apply to humans.
Conclusion
Differences in RI and PI between HC and ADD might be indicators for a reduced propulsive force within perivascular clearance pathways, thereby decreasing clearance rates and facilitating Aβ deposition in the brain. However, research in lager cohorts as estimated in post-hoc sample size calculations is needed. A follow-up study to investigate associations between progression of cognitive symptoms and pulsatility would also be of great interest.
Data Sharing Statement
The datasets generated during and/or analyzed during the current study are available from the corresponding author on reasonable request. However, due to the nature of pseudonymized patient data, a material transfer agreement is required to meet ethical standards and data privacy laws of Germany.
Acknowledgments
We would like to give special thanks to the ultrasound technicians Beate Eckenweber, Claudia Leege, and Christina Leonhart for their continuous support. This work was supported by the German Research Foundation (DFG) and the Technical University of Munich (TUM) in the framework of the Open Access Publishing Program.
Author Contributions
All authors approved the submitted version and agreed to be accountable for all aspects of the work. MO: Design of the study, analysis and interpretation of data, drafting the manuscript; CH: Acquisition of data, drafting the manuscript; CSch: Analysis and interpretation of data; revising the manuscript for intellectual content; CM: Acquisition and analysis of the data, drafting the manuscript for intellectual content; AH: Analysis and interpretation of data, revising the manuscript for intellectual content; CS: Contribution to conception of study; revising the manuscript for intellectual content; JDS: Interpretation of data and revising the manuscript for intellectual content; AK: analysis and interpretation of data; revising the manuscript for intellectual content; HF: Contribution to conception and design; revising the manuscript for intellectual content; BI: analysis and interpretation of data, revising the manuscript for intellectual content; KK: Conceptualization of the study, analysis and interpretation of data, revising the manuscript for intellectual content; HP: Acquisition of data and revising work for intellectual content; TG: Design of the study, analysis and interpretation of the data, drafting and revising the manuscript for intellectual content.
Disclosure
None of the authors declared any conflicts of interest with regard to this paper.
Outside the submitted work Dr. Grimmer reported having received consulting fees from Actelion, Biogen, Eli Lilly, Iqvia/Quintiles; MSD; Novartis, Quintiles, Roche Pharma, lecture fees from Biogen, Lilly, Parexel, Roche Pharma, and grants to his institution from Actelion and PreDemTech. Outside the submitted work Dr. Diehl-Schmid reported having received lecture fees from Novartis. Outside the submitted work Professor Holger Poppert reports serving on a scientific advisory board, fees paid to his institution from Bristol-Myers Squibb, personal fees from Daiichi Sankyo, serving on a scientific advisory board, fees paid to his institution from Bayer Healthcare, personal fees from Pfizer, personal fees from Bayer Healthcare. Part of the research presented in this paper was presented at the AAIC 2016 in Toronto, at the DGPPN congress 2016 in Berlin and at the ADPD convention 2017 in Vienna.
References
1. Braak H, Braak E. Neuropathological stageing of Alzheimer-related changes. Acta Neuropathol. 1991;82(4):239–259. doi:10.1007/BF00308809
2. Thal DR, Rub U, Orantes M, Braak H. Phases of A beta-deposition in the human brain and its relevance for the development of AD. Neurology. 2002;58(12):1791–1800. doi:10.1212/WNL.58.12.1791
3. McKhann GM, Knopman DS, Chertkow H, et al. The diagnosis of dementia due to Alzheimer’s disease: recommendations from the National Institute on Aging-Alzheimer’s Association workgroups on diagnostic guidelines for Alzheimer’s disease. Alzheimers Dement. 2011;7(3):263–269. doi:10.1016/j.jalz.2011.03.005
4. Jack CR
5. Hardy J, Selkoe DJ. The amyloid hypothesis of Alzheimer’s disease: progress and problems on the road to therapeutics. Science. 2002;297(5580):353–356. doi:10.1126/science.1072994
6. Thal DR. The pre-capillary segment of the blood-brain barrier and its relation to perivascular drainage in Alzheimer’s disease and small vessel disease. Sci World J. 2009;9:557–563. doi:10.1100/tsw.2009.72
7. Mawuenyega KG, Sigurdson W, Ovod V, et al. Decreased clearance of CNS beta-amyloid in Alzheimer’s disease. Science. 2010;330(6012):1774. doi:10.1126/science.1197623
8. Kress BT, Iliff JJ, Xia M, et al. Impairment of paravascular clearance pathways in the aging brain. Ann Neurol. 2014;76(6):845–861. doi:10.1002/ana.24271
9. Kuo YM, Crawford F, Mullan M, et al. Elevated A beta and apolipoprotein E in A betaPP transgenic mice and its relationship to amyloid accumulation in Alzheimer’s disease. Mol Med. 2000;6(5):430–439. doi:10.1007/BF03401785
10. Potter R, Patterson BW, Elbert DL, et al. Increased in vivo amyloid-beta42 production, exchange, and loss in presenilin mutation carriers. Sci Transl Med. 2013;5(189):189ra177. doi:10.1126/scitranslmed.3005615
11. Weller RO, Subash M, Preston SD, Mazanti I, Carare RO. Perivascular drainage of amyloid-beta peptides from the brain and its failure in cerebral amyloid angiopathy and Alzheimer’s disease. Brain Pathol. 2008;18(2):253–266. doi:10.1111/j.1750-3639.2008.00133.x
12. Attems J, Yamaguchi H, Saido TC, Thal DR. Capillary CAA and perivascular Abeta-deposition: two distinct features of Alzheimer’s disease pathology. J Neurol Sci. 2010;299(1–2):155–162. doi:10.1016/j.jns.2010.08.030
13. Weller RO, Massey A, Newman TA, Hutchings M, Kuo YM, Roher AE. Cerebral amyloid angiopathy: amyloid beta accumulates in putative interstitial fluid drainage pathways in Alzheimer’s disease. Am J Pathol. 1998;153(3):725–733. doi:10.1016/S0002-9440(10)65616-7
14. Preston SD, Steart PV, Wilkinson A, Nicoll JA, Weller RO. Capillary and arterial cerebral amyloid angiopathy in Alzheimer’s disease: defining the perivascular route for the elimination of amyloid beta from the human brain. Neuropathol Appl Neurobiol. 2003;29(2):106–117. doi:10.1046/j.1365-2990.2003.00424.x
15. Iliff JJ, Wang M, Liao Y, et al. A paravascular pathway facilitates CSF flow through the brain parenchyma and the clearance of interstitial solutes, including amyloid beta. Sci Transl Med. 2012;4(147):147ra111. doi:10.1126/scitranslmed.3003748
16. Nedergaard M. Neuroscience. Garbage truck of the brain. Science. 2013;340(6140):1529–1530. doi:10.1126/science.1240514
17. Peng W, Achariyar TM, Li B, et al. Suppression of glymphatic fluid transport in a mouse model of Alzheimer’s disease. Neurobiol Dis. 2016;93:215–225. doi:10.1016/j.nbd.2016.05.015
18. Iliff JJ, Lee H, Yu M, et al. Brain-wide pathway for waste clearance captured by contrast-enhanced MRI. J Clin Invest. 2013;123(3):1299–1309. doi:10.1172/JCI67677
19. Iliff JJ, Chen MJ, Plog BA, et al. Impairment of glymphatic pathway function promotes tau pathology after traumatic brain injury. J Neurosci. 2014;34(49):16180–16193. doi:10.1523/JNEUROSCI.3020-14.2014
20. Kang JE, Lim MM, Bateman RJ, et al. Amyloid-beta dynamics are regulated by orexin and the sleep-wake cycle. Science. 2009;326(5955):1005–1007. doi:10.1126/science.1180962
21. Xie L, Kang H, Xu Q, et al. Sleep drives metabolite clearance from the adult brain. Science. 2013;342(6156):373–377. doi:10.1126/science.1241224
22. Rennels ML, Gregory TF, Blaumanis OR, Fujimoto K, Grady PA. Evidence for a ‘paravascular’ fluid circulation in the mammalian central nervous system, provided by the rapid distribution of tracer protein throughout the brain from the subarachnoid space. Brain Res. 1985;326(1):47–63. doi:10.1016/0006-8993(85)91383-6
23. Rennels ML, Blaumanis OR, Grady PA. Rapid solute transport throughout the brain via paravascular fluid pathways. Adv Neurol. 1990;52:431–439.
24. Nilsson C, Stahlberg F, Thomsen C, Henriksen O, Herning M, Owman C. Circadian variation in human cerebrospinal fluid production measured by magnetic resonance imaging. Am J Physiol. 1992;262(1 Pt 2):R20–24. doi:10.1152/ajpregu.1992.262.1.R20
25. Kiviniemi V, Wang X, Korhonen V, et al. Ultra-fast magnetic resonance encephalography of physiological brain activity – Glymphatic pulsation mechanisms? J Cereb Blood Flow Metab. 2016;36(6):1033–1045. doi:10.1177/0271678X15622047
26. Gaberel T, Gakuba C, Goulay R, et al. Impaired glymphatic perfusion after strokes revealed by contrast-enhanced MRI: a new target for fibrinolysis? Stroke. 2014;45(10):3092–3096. doi:10.1161/STROKEAHA.114.006617
27. Aldea R, Weller RO, Wilcock DM, Carare RO, Richardson G. Cerebrovascular smooth muscle cells as the drivers of intramural periarterial drainage of the brain. Front Aging Neurosci. 2019;11:1. doi:10.3389/fnagi.2019.00001
28. Roher AE, Garami Z, Tyas SL, et al. Transcranial doppler ultrasound blood flow velocity and pulsatility index as systemic indicators for Alzheimer’s disease. Alzheimers Dement. 2011;7(4):445–455. doi:10.1016/j.jalz.2010.09.002
29. Claassen JA, Diaz-Arrastia R, Martin-Cook K, Levine BD, Zhang R. Altered cerebral hemodynamics in early Alzheimer disease: a pilot study using transcranial Doppler. J Alzheimers Dis. 2009;17(3):621–629. doi:10.3233/JAD-2009-1079
30. Stefani A, Sancesario G, Pierantozzi M, et al. CSF biomarkers, impairment of cerebral hemodynamics and degree of cognitive decline in Alzheimer’s and mixed dementia. J Neurol Sci. 2009;283(1–2):109–115. doi:10.1016/j.jns.2009.02.343
31. Jin WS, Bu XL, Wang YR, et al. Reduced cardiovascular functions in patients with Alzheimer’s disease. J Alzheimers Dis. 2017;58(3):919–925. doi:10.3233/JAD-170088
32. Zuccolo E, Lim D, Kheder DA, et al. Acetylcholine induces intracellular Ca(2+) oscillations and nitric oxide release in mouse brain endothelial cells. Cell Calcium. 2017;66:33–47. doi:10.1016/j.ceca.2017.06.003
33. Ruitenberg A, den Heijer T, Bakker SL, et al. Cerebral hypoperfusion and clinical onset of dementia: the Rotterdam Study. Ann Neurol. 2005;57(6):789–794. doi:10.1002/ana.20493
34. Roher AE, Garami Z, Alexandrov AV, et al. Interaction of cardiovascular disease and neurodegeneration: transcranial Doppler ultrasonography and Alzheimer’s disease. Neurol Res. 2006;28(6):672–678. doi:10.1179/016164106X130470
35. Prins ND, van Dijk EJ, den Heijer T, et al. Cerebral white matter lesions and the risk of dementia. Arch Neurol. 2004;61(10):1531–1534. doi:10.1001/archneur.61.10.1531
36. Matthews FE, Brayne C, Lowe J, McKeith I, Wharton SB, Ince P. Epidemiological pathology of dementia: attributable-risks at death in the Medical Research Council Cognitive Function and Ageing Study. PLoS Med. 2009;6(11):e1000180. doi:10.1371/journal.pmed.1000180
37. Pantoni L. Cerebral small vessel disease: from pathogenesis and clinical characteristics to therapeutic challenges. Lancet Neurol. 2010;9(7):689–701. doi:10.1016/S1474-4422(10)70104-6
38. Grimmer T, Faust M, Auer F, et al. White matter hyperintensities predict amyloid increase in Alzheimer’s disease. Neurobiol Aging. 2012;33(12):2766–2773. doi:10.1016/j.neurobiolaging.2012.01.016
39. Brickman AM, Guzman VA, Gonzalez-Castellon M, et al. Cerebral autoregulation, beta amyloid, and white matter hyperintensities are interrelated. Neurosci Lett. 2015;592:54–58. doi:10.1016/j.neulet.2015.03.005
40. Wong TY, Klein R, Klein BE, Tielsch JM, Hubbard L, Nieto FJ. Retinal microvascular abnormalities and their relationship with hypertension, cardiovascular disease, and mortality. Surv Ophthalmol. 2001;46(1):59–80. doi:10.1016/S0039-6257(01)00234-X
41. Patton N, Aslam T, Macgillivray T, Pattie A, Deary IJ, Dhillon B. Retinal vascular image analysis as a potential screening tool for cerebrovascular disease: a rationale based on homology between cerebral and retinal microvasculatures. J Anat. 2005;206(4):319–348. doi:10.1111/joa.2005.206.issue-4
42. Cooper LS, Wong TY, Klein R, et al. Retinal microvascular abnormalities and MRI-defined subclinical cerebral infarction: the Atherosclerosis Risk in Communities Study. Stroke. 2006;37(1):82–86. doi:10.1161/01.STR.0000195134.04355.e5
43. Wong TY, Klein R, Couper DJ, et al. Retinal microvascular abnormalities and incident stroke: the Atherosclerosis Risk in Communities Study. Lancet. 2001;358(9288):1134–1140. doi:10.1016/S0140-6736(01)06253-5
44. Kwa VI, van der Sande JJ, Stam J, Tijmes N, Vrooland JL. Amsterdam Vascular Medicine G. Retinal arterial changes correlate with cerebral small-vessel disease. Neurology. 2002;59(10):1536–1540. doi:10.1212/01.WNL.0000033093.16450.5C
45. Ikram MK, Ong YT, Cheung CY, Wong TY. Retinal vascular caliber measurements: clinical significance, current knowledge and future perspectives. Ophthalmologica. 2013;229(3):125–136. doi:10.1159/000342158
46. Hubbard LD, Brothers RJ, King WN, et al. Methods for evaluation of retinal microvascular abnormalities associated with hypertension/sclerosis in the Atherosclerosis Risk in Communities Study. Ophthalmology. 1999;106(12):2269–2280. doi:10.1016/S0161-6420(99)90525-0
47. Wong TY, Klein R, Sharrett AR, et al. Retinal arteriolar narrowing and risk of coronary heart disease in men and women. The Atherosclerosis Risk in Communities Study. JAMA. 2002;287(9):1153–1159. doi:10.1001/jama.287.9.1153
48. Wong TY, Klein R, Sharrett AR, et al. Retinal microvascular abnormalities and cognitive impairment in middle-aged persons: the Atherosclerosis Risk in Communities Study. Stroke. 2002;33(6):1487–1492. doi:10.1161/01.STR.0000016789.56668.43
49. de Jong FJ, Schrijvers EM, Ikram MK, et al. Retinal vascular caliber and risk of dementia: the Rotterdam study. Neurology. 2011;76(9):816–821. doi:10.1212/WNL.0b013e31820e7baa
50. Albert MS, DeKosky ST, Dickson D, et al. The diagnosis of mild cognitive impairment due to Alzheimer’s disease: recommendations from the National Institute on Aging-Alzheimer’s Association workgroups on diagnostic guidelines for Alzheimer’s disease. Alzheimers Dement. 2011;7(3):270–279. doi:10.1016/j.jalz.2011.03.008
51. Folstein MF, Folstein SE, McHugh PR. “Mini-mental state”. A practical method for grading the cognitive state of patients for the clinician. J Psychiatr Res. 1975;12(3):189–198. doi:10.1016/0022-3956(75)90026-6
52. Morris JC, Heyman A, Mohs RC, et al. The consortium to establish a registry for Alzheimer’s Disease (CERAD). Part I. Clinical and neuropsychological assessment of Alzheimer’s disease. Neurology. 1989;39(9):1159–1165. doi:10.1212/WNL.39.9.1159
53. Morris JC. The Clinical Dementia Rating (CDR): current version and scoring rules. Neurology. 1993;43(11):2412–2414. doi:10.1212/WNL.43.11.2412-a
54. Iaccarino L, Chiotis K, Alongi P, et al. A cross-validation of FDG- and amyloid-PET biomarkers in mild cognitive impairment for the risk prediction to dementia due to Alzheimer’s disease in a clinical setting. J Alzheimers Dis. 2017;59(2):603–614. doi:10.3233/JAD-170158
55. Heister D, Brewer JB, Magda S, Blennow K, McEvoy LK. Alzheimer’s disease neuroimaging I. Predicting MCI outcome with clinically available MRI and CSF biomarkers. Neurology. 2011;77(17):1619–1628. doi:10.1212/WNL.0b013e3182343314
56. Roman GC, Tatemichi TK, Erkinjuntti T, et al. Vascular dementia: diagnostic criteria for research studies. Report of the NINDS-AIREN International Workshop. Neurology. 1993;43(2):250–260. doi:10.1212/WNL.43.2.250
57. Planiol T, Pourcelot L, Itti R. The carotid and cerebral circulations. Advances in its study by external physical methods. Principles, normal recordings, adopted parameters. Nouv Presse Med. 1973;2(37):2451–2456.
58. Gosling RG, King DH. Arterial assessment by Doppler-shift ultrasound. Proc R Soc Med. 1974;67(6 Pt 1):447–449.
59. Obuchowski NA. Nonparametric analysis of clustered ROC curve data. Biometrics. 1997;53(2):567–578. doi:10.2307/2533958
60. Faul F, Erdfelder E, Lang AG, Buchner A. G*Power 3: a flexible statistical power analysis program for the social, behavioral, and biomedical sciences. Behav Res Methods. 2007;39(2):175–191. doi:10.3758/BF03193146
61. Faul F, Erdfelder E, Buchner A, Lang AG. Statistical power analyses using G*Power 3.1: tests for correlation and regression analyses. Behav Res Methods. 2009;41(4):1149–1160. doi:10.3758/BRM.41.4.1149
62. Dreha-Kulaczewski S, Joseph AA, Merboldt KD, Ludwig HC, Gartner J, Frahm J. Inspiration is the major regulator of human CSF flow. J Neurosci. 2015;35(6):2485–2491. doi:10.1523/JNEUROSCI.3246-14.2015
63. Qiu C, Winblad B, Fratiglioni L. The age-dependent relation of blood pressure to cognitive function and dementia. Lancet Neurol. 2005;4(8):487–499. doi:10.1016/S1474-4422(05)70141-1
64. Beach TG, Wilson JR, Sue LI, et al. Circle of Willis atherosclerosis: association with Alzheimer’s disease, neuritic plaques and neurofibrillary tangles. Acta Neuropathol. 2007;113(1):13–21. doi:10.1007/s00401-006-0136-y
65. Honig LS, Kukull W, Mayeux R. Atherosclerosis and AD: analysis of data from the US National Alzheimer’s Coordinating Center. Neurology. 2005;64(3):494–500. doi:10.1212/01.WNL.0000150886.50187.30
66. Rosengarten B, Paulsen S, Molnar S, Kaschel R, Gallhofer B, Kaps M. Acetylcholine esterase inhibitor donepezil improves dynamic cerebrovascular regulation in Alzheimer patients. J Neurol. 2006;253(1):58–64. doi:10.1007/s00415-005-0926-5
67. Rosengarten B, Paulsen S, Burr O, Kaps M. Neurovascular coupling in Alzheimer patients: effect of acetylcholine-esterase inhibitors. Neurobiol Aging. 2009;30(12):1918–1923. doi:10.1016/j.neurobiolaging.2008.02.017
68. Goto I, Katsuki S, Ikui H, Kimoto K, Mimatsu T. Pathological studies on the intracerebral and retinal arteries in cerebrovascular and noncerebrovascular diseases. Stroke. 1975;6(3):263–269. doi:10.1161/01.STR.6.3.263
69. Walsh JB, Rosen RB, Berinstein DM, ed. Diseases of the Retina. Chapter 13. Systemic Hypertension and the Eye. Duane’s Foundations of clinical Ophthalmology. Hagerstown: Lippincott Williams & Wilkins; 2007. Tasman W JE, ed.
70. Moss HE. Retinal vascular changes are a marker for cerebral vascular diseases. Curr Neurol Neurosci Rep. 2015;15(7):40. doi:10.1007/s11910-015-0561-1
71. Lindley RI, Wang JJ, Wong MC, et al. Retinal microvasculature in acute lacunar stroke: a cross-sectional study. Lancet Neurol. 2009;8(7):628–634. doi:10.1016/S1474-4422(09)70131-0
72. Ikram MK, De Jong FJ, Van Dijk EJ, et al. Retinal vessel diameters and cerebral small vessel disease: the Rotterdam Scan Study. Brain. 2006;129(Pt 1):182–188. doi:10.1093/brain/awh688
 © 2019 The Author(s). This work is published and licensed by Dove Medical Press Limited. The full terms of this license are available at https://www.dovepress.com/terms.php and incorporate the Creative Commons Attribution - Non Commercial (unported, v3.0) License.
By accessing the work you hereby accept the Terms. Non-commercial uses of the work are permitted without any further permission from Dove Medical Press Limited, provided the work is properly attributed. For permission for commercial use of this work, please see paragraphs 4.2 and 5 of our Terms.
© 2019 The Author(s). This work is published and licensed by Dove Medical Press Limited. The full terms of this license are available at https://www.dovepress.com/terms.php and incorporate the Creative Commons Attribution - Non Commercial (unported, v3.0) License.
By accessing the work you hereby accept the Terms. Non-commercial uses of the work are permitted without any further permission from Dove Medical Press Limited, provided the work is properly attributed. For permission for commercial use of this work, please see paragraphs 4.2 and 5 of our Terms.