")
Back to Journals » Diabetes, Metabolic Syndrome and Obesity » Volume 15
Decreased Levels of miR-126 and miR-132 in Plasma and Vitreous Humor of Non-Proliferative Diabetic Retinopathy Among Subjects with Type-2 Diabetes Mellitus
Authors Pramanik S, Saha C, Chowdhury S, Bose C , Bhattacharyya NP, Mondal LK
Received 2 November 2021
Accepted for publication 24 January 2022
Published 4 February 2022 Volume 2022:15 Pages 345—358
DOI https://doi.org/10.2147/DMSO.S346097
Checked for plagiarism Yes
Review by Single anonymous peer review
Peer reviewer comments 2
Editor who approved publication: Professor Ming-Hui Zou
Subhasish Pramanik,1,* Chinmay Saha,1,2,* Subhankar Chowdhury,1 Chiranjit Bose,1 Nitai P Bhattacharyya,1 Lakshmi Kanta Mondal3
1Department of Endocrinology & Metabolism, Institute of Post Graduate Medical Education & Research and SSKM Hospital, Kolkata, 700020, West Bengal, India; 2Genome Science, School of Interdisciplinary Studies, University of Kalyani, Nadia, 741235, West Bengal, India; 3Department of Ophthalmology, Regional Institute of Ophthalmology, Medical College Campus, Kolkata, 700 073, West Bengal, India
*These authors contributed equally to this work
Correspondence: Subhankar Chowdhury
Department of Endocrinology & Metabolism, Institute of Post Graduate Medical Education & Research and SSKM Hospital, Kolkata, 700020, West Bengal, India
, Email [email protected]
Lakshmi Kanta Mondal
Department of Ophthalmology, Regional Institute of Ophthalmology, Medical College Campus, 88, College Street, Kolkata, 700 073, West Bengal, India
, Email [email protected]
Purpose: Diabetic retinopathy (DR), the leading cause of blindness among working adults, is an urgent public health problem as diabetes mellitus (DM) is increasing at an alarming rate. Hyperglycemia-induced endothelial dysfunction is the principal contributing factor leading to the development of microangiopathy. Altered levels of microRNA (miR), the negative regulator of protein-coding genes, have been observed and considered to be markers for DR. Present study aimed to find out whether miR levels in plasma could be effective biomarkers to differentiate between type 2 diabetes mellitus (T2DM) with non-proliferative retinopathy (NPDR) from T2DM with no-DR (DNR).
Methods: We recruited 50 T2DM subjects comprising 31 NPDR and 19 DNR individuals. Surrogate markers of systemic oxidative stress and vascular endothelial growth factor (VEGF) were measured in plasma. Levels of miR-126 and miR-132 were determined in plasma and vitreous fluid using real-time PCR.
Results: We observed that levels of miR-126 and miR-132 were decreased in NPDR subjects in comparison to DNR. Plasma levels of miRs were inversely correlated with secreted levels of VEGF and oxidative stress marker. The levels of these miRs showed discriminating ability between NPDR and DNR.
Conclusion: Circulating miRs 126 and 132 in plasma or vitreous may serve as biomarkers for early diabetic retinopathy risk prediction, provided validated in a larger cohort and other forms of retinal vasculopathy or retinopathy in the future.
Keywords: diabetic retinopathy, microRNA-126, microRNA-132, oxidative stress, malondialdehyde, vascular endothelial growth factor
Introduction
Among various microvascular complications resulting from long-standing Type 2 diabetes mellitus (T2DM), diabetic retinopathy (DR) is a major complication leading to visual loss in the working-age population. About one-third of the T2DM patient develops a severe form of DR namely proliferative diabetic retinopathy (PDR) through an early stage of the disease known as nonproliferative diabetic retinopathy (NPDR). Increased vascular permeability and capillary occlusion in the retinal vasculature in NPDR produce microaneurysms, hemorrhages, and exudates. Ultimately, neovascularization in the retina owing to persistent ischemia in the capillary beds characterizes PDR and invites severe vision impairment.1–3 Poor glycemic control is considered to be a principal contributing factor to the development of DR. However, in some cases of DR, intensive control of blood sugar did not show a preventive effect against the initiation of DR.4–6 It is assumed that on the background of genetic predisposition, hyperglycemia-induced biochemical derangements ie production of free radicals, advanced glycosylation end products, and lipid peroxidation converge to the pathways of inflammation, and tissue hypoxia, which ultimately lead to increased secretion of vascular endothelial growth factor (VEGF).7–9 VEGF mediated through activation of hypoxia-inducible factor 1-alpha (HIF1-α), plays crucial roles in the development of DR.8–12 VEGF enhances vascular permeability by phosphorylation of tight junction proteins like zonula occludens-1 (ZO-1) and occludin.13 VEGF also promotes the proliferation of endothelial cells by activation of the mitogen-activated protein (MAP).14 However, apoptotic cell death of endothelial cells and thickening of basement membrane are observed during the early stage of development of DR.15–17 It is assumed that in response to hyperglycemia-mediated anomalous biochemical pathways in diabetes, diverse cellular alterations like inflammation, transcription deregulation, apoptosis, proliferation, and angiogenesis result in the development and progression of DR.
Altered levels of microRNAs (miRs), a group of small non-coding RNAs with a length of 19–26 nucleotides, have been reported to inversely regulate the expression of protein-coding genes in peripheral blood mononuclear cell (PBMC), plasma, serum, the aqueous and vitreous humor of diabetic patients with NPDR or PDR in comparison with healthy non-diabetics and diabetic without retinopathy (DNR).18–49 The analysis of the published deregulated miRs revealed that a total of 111 miRs were deregulated in DR and only 13 miRs have been observed in more than one experiment in diverse tissues or samples (Supplementary Table ST1). Among 13 deregulated miRs, 5 (miR- 93, 335, 122,155, 21) were observed to be increased, 4 (miR-7b-5p, 126, 15b, 200b) were decreased and another 4 (miR-15a, 29a, 99–5p and 320a) were reported to be increased as well as decreased in different studies among DR patients. It has also been observed that among different miRs, VEGF is a target of miR-15a,23,51 miR-15b,52 miR-126,20,50,51 and miR-200b.40,41 Besides, in an animal model, it has been shown that VEGF is a potent activator of miR-132 that promotes angiogenesis, proliferation, and migration of vascular endothelial cells in diabetic heart disease (DHD).53 Though retinal vascular endothelial dysfunction and angiogenesis are the pathological features of advanced stages of DR,2,3 it remains unknown whether the expression of miR-132 alters in DR. Thus, in the present study, we used miR-126 that has been shown to be decreased in different tissues by different investigators,54,55 targets VEGF50,51 and a novel miR (miR-132) that also modulated by VEGF, a principal mediator for DR.7,53 It is also to be noted that even several miRs were deregulated in DR, there are limited studies to demonstrate that levels of miRs in plasma could distinguish NPDR from DNR.55
Most of the studies in human subjects attempted to identify markers for the late stage of the disease like PDR.48,49 However, it is poorly known whether the level of deregulated miRs could also be used to discriminate between NPDR, the early stage of the disease, and DNR. Hence, in the present communication, we measured the levels of miR-126 and miR-132 in plasma to find out whether these miRs could be used as markers for distinguishing NPDR from DNR. The choice of miR-126 was based on the reported deregulation of the miRs in many studies.56 The miR-126 also targets VEGF,50,51 which further induces the expression of miR-132 that promotes vascular complications in DHD.53 However, it is unknown whether miR-132 altered in DR. In a limited number of cases, we tested whether levels of the miRs observed in plasma could also be observed in vitreous, the closest biofluid to the affected in DR.
Materials and Methods
Calculation of Sample Size
The sample size for two study groups in the present study was calculated depending on the previous study conducted by Kamel et al, 202055 for miR-126 and using the statistical software G* power (3.1.9.2). The ΔCT values (mean ± SD) for miR-126 in the plasma of DNR and NPDR subjects were used for effect size (d) calculation. Then, setting the statistical test as, “difference between two independent means (two groups)”, α error probability = 0.05, power of the study (1-β) = 0.85 and sample allocation ratio (N2/N1) = 2 (DNR = N1 and NPDR = N2), we got the required sample size for DNR group = 14 and NPDR group = 28. Finally, we recruited 19 samples in DNR and 31 samples in NPDR groups to reduce the margin of errors of the study. The allocation ratio was determined based on usual adherence of the DNR and NPDR subjects at the outdoor patient clinic of the Regional Institute of Ophthalmology, from where patients were recruited.
Study Subjects
A number of 50 subjects with diabetes comprising 31 NPDR (mean age = 55.67±1.97 years) and 19 DNR (mean age 54.55±1.51 years) were enrolled in this cross-sectional study. Presence of coronary artery disease, hypertension, peripheral vascular disease, neoplastic disease, recent acute infection, thrombotic event, urinary microalbumin >300 mg/dl, pre-diabetes, and ocular disorders (glaucoma, Eales’ disease, diabetic macular edema, vitreous hemorrhage, branch retinal venous occlusion, etc) were excluded from recruitment.
Study subjects have been suffering from type 2 diabetes mellitus for more than 3 years and diagnosis of DM was done according to World Health Organization (WHO) criteria. The extent of DR was determined by dilated fundus examination with slit-lamp biomicroscopy by +90 D lens, seven-field digital fundus photography with fluorescein angiography, and optical coherence tomography and graded according to the proposed international classification of diabetic retinopathy and diabetic macular edema disease severity scale.57 All the subjects enrolled in this study belonged to the same geographical area (Gangetic delta), eastern India. Written informed consent was collected from each patient according to the declaration of Helsinki and was approved by the Ethics Committee of the institute. Age, sex, blood pressure, and body mass index were matched within the study groups. The glycemic status of all study subjects was assessed by measuring fasting plasma glucose (FPG) and postprandial plasma glucose (PPG) and glycated hemoglobin levels (HbA1c %).
Blood Sample Collection and Processing
Study subjects were advised to fast for 12 hours before blood sample collection. Then, 6 mL of venous blood sample was collected in Ethylene diamine tetraacetic acid (EDTA) tubes. Whole blood sample (50µL) was used for estimation of HbA1c (%). Then remaining blood samples were centrifuged at 3000 rpm for 10 minutes at 4°C to separate cellular components and plasma. Plasma samples were collected in cryovials for further biochemical and molecular assays.
Collection of Vitreous Sample
Vitreous samples were drawn by 3-port pars plana vitrectomy from 7 out of 19 recruited DNR subjects and 8 out of 31 NPDR subjects during surgery of idiopathic macular hole or removal of a dropped nucleus which occurred accidentally after blunt trauma and from a per-operative complication of phacoemulsification. Undiluted vitreous gel (500 µL) was excised from mid-vitreous by vitreous cutter and carefully aspirated into the hand-held sterile syringe attached to the suction port of the vitrectomy probe. Immediately after collection, the vitreous samples were taken in the microcentrifuge tube and centrifuged at 3000 rpm for 5 minutes. The clear solution without any precipitate was then collected in another tube and either used for RNA isolation or preserved in −80°C for further use.
Estimation of Plasma Glucose Level
Plasma glucose level was measured by the colorimetric endpoint test method using a commercially available kit (Labcare Diagnostics (India) Pvt. Ltd., Mumbai, India).
Measurement of Glycated Hemoglobin (HbA1c %)
HbA1c % was measured by an ion exchange resin method using a commercially available kit [Labcare Diagnostics (India) Pvt. Ltd., Mumbai, India].
Estimation of Lipid Profile Components
The conventional lipid profile components like plasma total cholesterol (TC), high-density lipoprotein cholesterol (HDL-C), and triglycerides (TG) levels were estimated spectrophotometrically by using commercially available kits (Coral Clinical Systems, Goa, India). The low-density lipoprotein cholesterol (LDL-C) was estimated using Fridewald’s formula [LDL-C = TC-(HDL-C)-TG/5].58
Measurement of Malondialdehyde (MDA)
Plasma MDA was measured as per the method of Satoh59 and the method of estimation was discussed in detail in our previous paper.60 The minimum detection limit (MDL) for the method of MDA measurement was 0.34µM/L and calculated as described by Gagautes and Pearson, 1987.61 The intra- and inter-assay coefficients of variation were 4.32% and 5.5%, respectively.
Measurement of Vascular Endothelial Growth Factor (VEGF)
The concentration of VEGF in the plasma sample was measured by the Enzyme-linked immunosorbent assay (ELISA) method using the commercial kit (Catalogue ELH-VEGF 001, Ray Biotech, Norcross, USA) as per the manufacturer’s protocol. The MDL of VEGF was determined to be 10pg/mL as mentioned in the protocol. The intra- and inter-assay coefficients of variation were 2.04% and 2.48%, respectively.
RNA Isolation from Plasma and Vitreous
Total RNA was extracted from Plasma and Vitreous using TRIZOL reagent (Ambion, USA) according to the manufacturer’s protocol. RNAs were quantified by spectrophotometry (Eppendorf BioPhotometer) and fluorometry (Qubit, Invitrogen). The ratio of 260/280 for all samples was between 1.9 and 2.1.
cDNA Synthesis and miR Expression Study
One hundred nanograms of total RNA was used to synthesize cDNA with a universal stem-loop primer as described62 and U6 RT primer using RevertAidTMReverseTranscriptase (Fermentas). The 20µL of RT reaction mixture contained 100ng of Total RNA, 2 µL Universal stem-loop primer (USLP) [From 10µM stock], 2 µL of U6 RT primer [From 10µM stock], 2 µL of 10mM dNTP Mix, 4 µL of 5x RT reaction buffer, 0.5 µL of RibolockRNase Inhibitor (40 U/µL), 1 µL Revert-Aid M-MuLV Reverse Transcriptase (200U/µL). The mixture was incubated at 25°C for 10 min, and then incubation was continued at 42°C for 60 min. The reaction was stopped by heating at 70°C for 10 min. Real-time PCR was performed using DynamoColorFlash SYBR Green I Kit (Thermo Scientific) on a 7500 real-time PCR machine. Ten microliters of qRT-PCR reaction contained 5µL 2X DyNAmoColorFlash SYBR Green I master mix, 0.5µM each primer, and 1 µL of RT product (10 fold diluted sample). Minus (-) RT reaction product was also used as a template to check DNA contamination. The thermal set-up was 10 min at 95°C, followed by 40 cycles of 15sec at 95°C, 35s at 62°C. The small nuclear RNA (snRNA) U6 was used as a housekeeping gene. Mean Delta Ct value for Diabetic control (DNR) samples was calculated. Ct value of the gene of interest (GOI) – Ct value of the housekeeping gene was calculated as Δ Ct value. Δ Ct value of patients - Δ Ct value of the control subjects represented as ΔΔ Ct value. Relative levels of the miRs (fold change) were calculated using the standard method as 2–ΔΔCt, where Ct stands for the cycle threshold, ΔCt = (Ct value of the gene of interest (GOI) – Ct value of the housekeeping gene) and ΔΔ Ct value = (Δ Ct value of patients - Δ Ct value of the control subjects). Sequences of all primers along with references are listed in Supplementary Table ST2.
Validated Targets of miR
Targets of human miRs were downloaded from miRTarbase (http://rna.sysu.edu.cn/chipbase/, version 7.0). The database has recently been upgraded (http://mirtarbase.cuhk.edu.cn/php/index.php, version 8.0).56 We have downloaded the entire data for validated targets of human miRs and collected the targets of miR-126 and miR-132 and used them for our analysis.
Enrichment Analysis of Biological Processes and Pathways
For enrichment analysis, we have used the latest version of user-friendly online publicly available facility GeneCodis-4 (http://genecodis.cnb.csic.es) as described.57 This facility can be used for enrichment of Gene Ontology (GO) terms for molecular functions, biological processes, cellular components, and the Kyoto Encyclopedia of Genes and Genomes (KEGG) pathway. The proportion of proteins in a particular GO term from the input query list is computed and compared with those of proteins coded by the human genome as catalogued in the database. The hypergeometric p-value, after correction for multiple testing, was computed. The validated target of miR-126 and miR-132 collected from miRTarbase was used as the query and the biological processes and KEGG pathways enrichment analysis were determined.
Statistical Analysis
Kolmogorov–Smirnov test was performed to evaluate the normality of continuous variables. Data were presented using means ± standard error of means (SEM). Normally distributed two groups were compared by unpaired Student’s t-test. When two groups were not normally distributed, they were compared by Mann–Whitney U-test. A Spearman correlation coefficient was used to find out the correlation between two variables. The receiver operating characteristic (ROC) analysis was performed to find out the area under the curve (AUC), cut-off value with sensitivity and specificity of each of miR-126 and 132 for discriminating NPDR from DNR. Statistical analyses for categorical variables like sex distribution between two groups were evaluated by Fisher’s exact test. A value of “p” <0.05 was considered statistically significant. All statistical analyses were performed using Graph pad prism (Version 6, Sandiego, CA, USA).
Results
Comparison of two groups enrolled in the present study showed no statistically significant differences in sex distribution, age, and duration of DM, BMI, systolic and diastolic blood pressure, FPG, PPG, and HbA1c. Plasma TC, LDL-C, and TG levels were found to be higher in the NPDR group compared to the DNR group. There was no significant difference observed in plasma HDL-C level between the groups (Table 1).
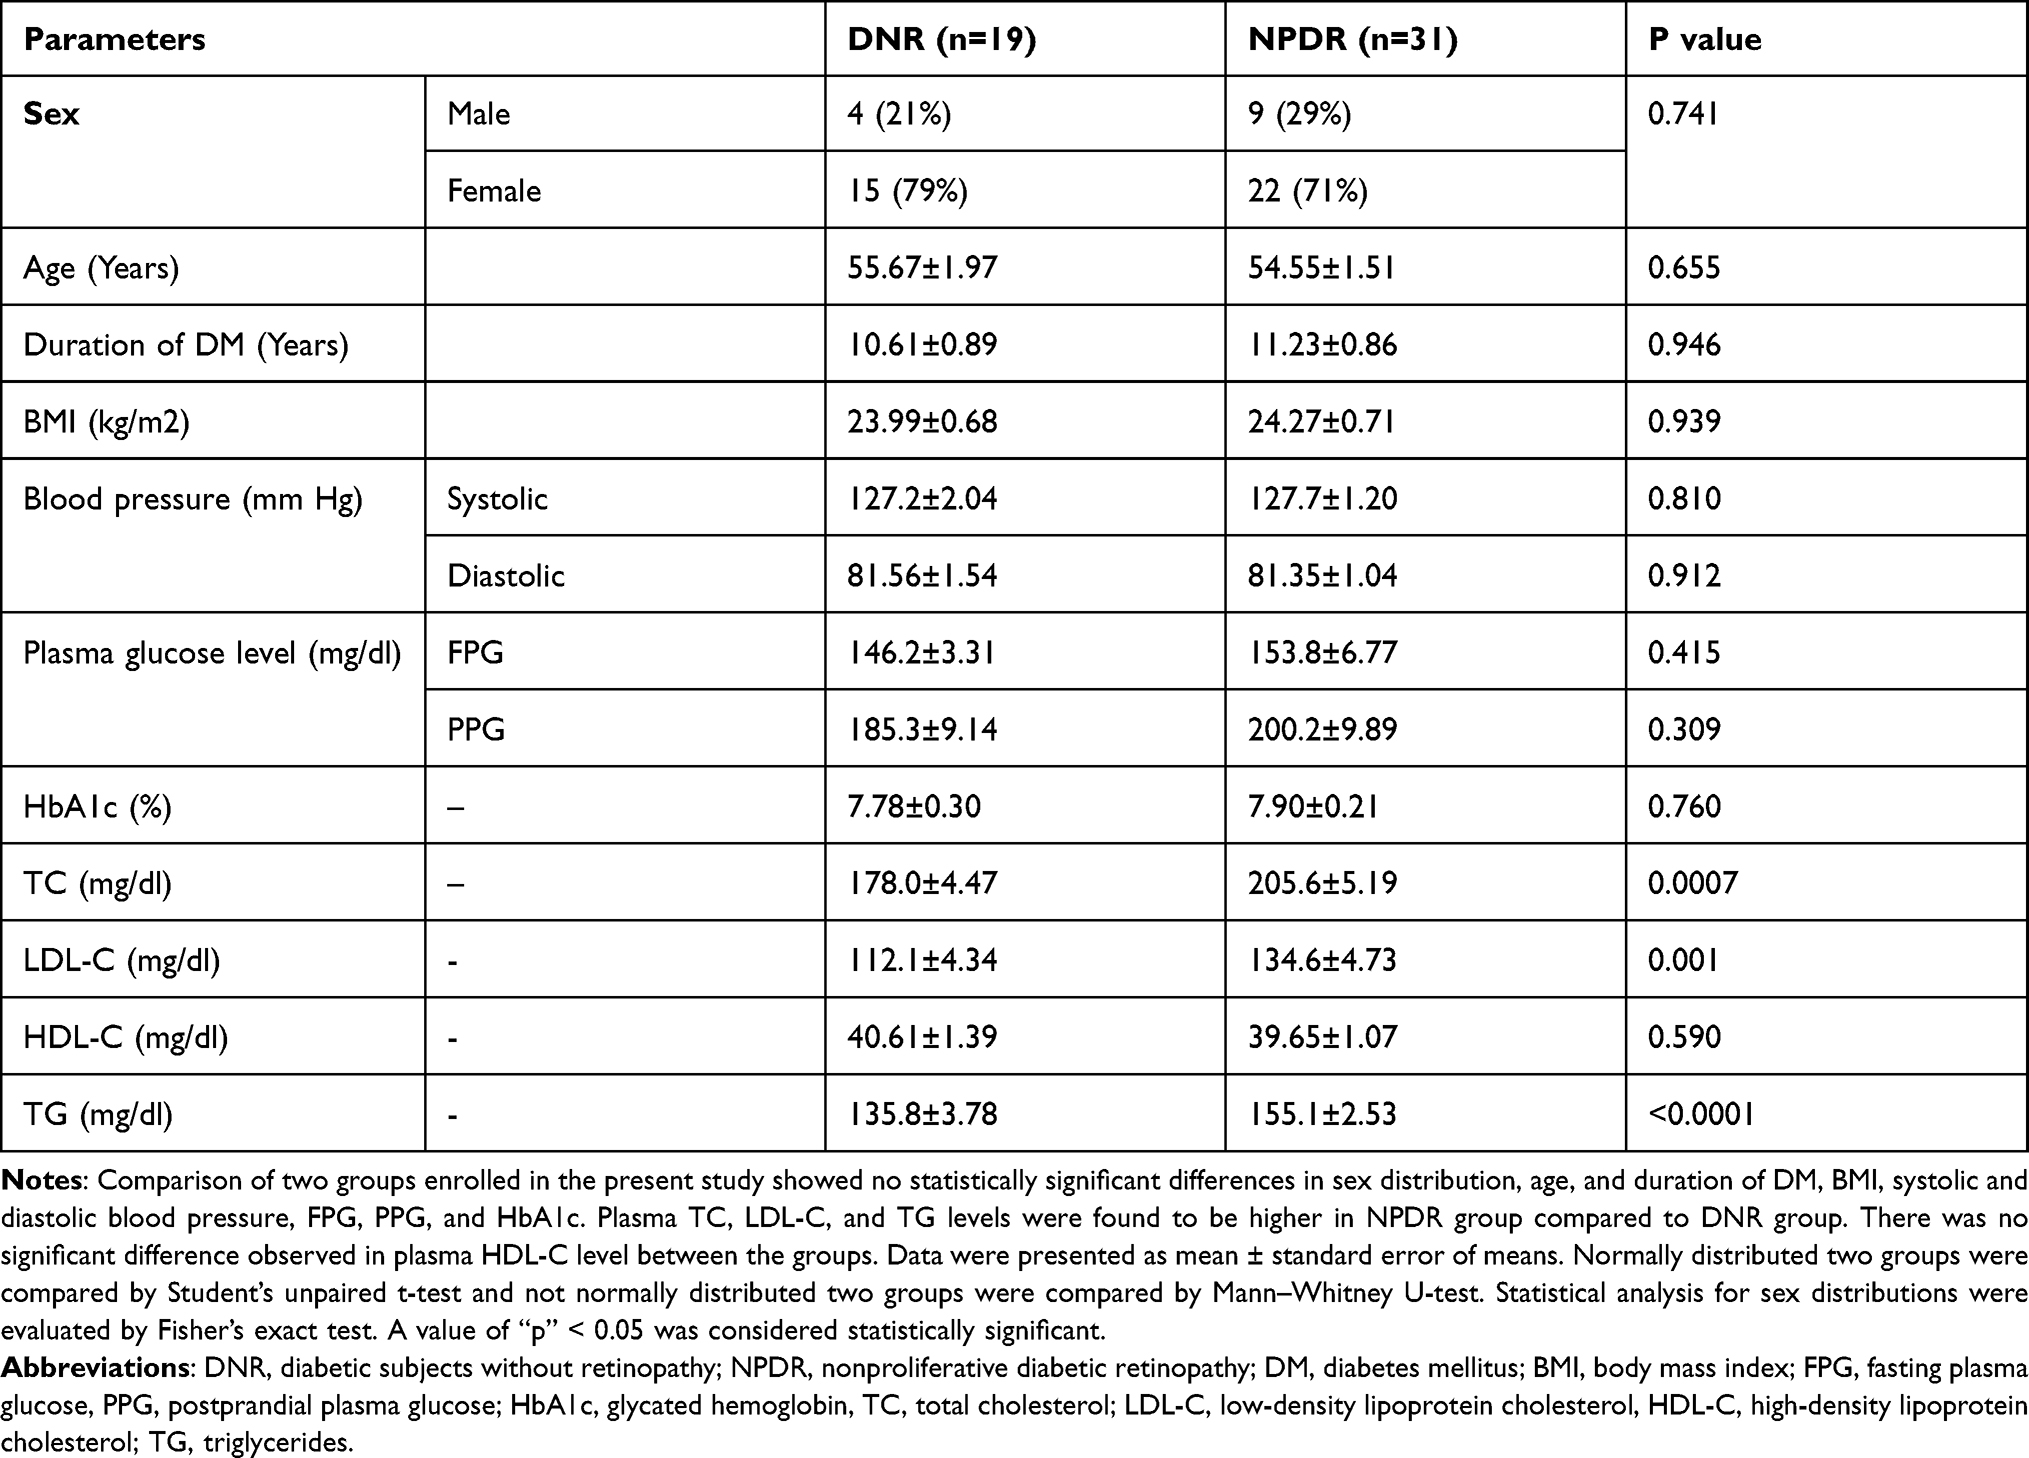 |
Table 1 Demographic and Clinical Characteristics of Study Subjects |
Plasma MDA and VEGF Levels of the Study Subjects
The NPDR subjects showed significantly (p < 0.0001) higher plasma MDA level, a recommended marker for oxidative stress63 (5.22 ± 0.082µM/L) compared to that of in DNR (4.33 ± 0.193µM/L). The result is shown in (Figure 1A). To identify the hypoxia level, we detected the level of VEGF64 in plasma of DNR and NPDR. It showed that levels of VEGF in NPDR were significantly (p = 0.0001) higher (159.4 ± 5.57 pg/mL) in comparison with that of DNR (121.1 ± 5.83pg/mL). The result is shown in (Figure 1B).
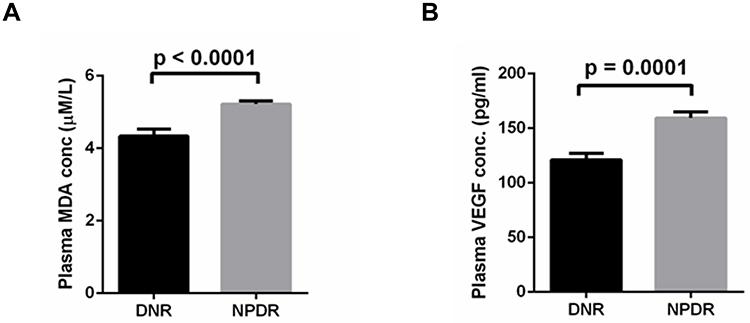 |
Figure 1 Levels of MDA (A) and VEGF (B) in plasma of DNR and NPDR. |
Plasma and Vitreous miR-126 and miR-132 Levels of Study Groups
Compared to DNR, level of miR-126 in plasma was decreased significantly in NPDR (0.806 ± 0.20, p = 0.002), while this value for miR-132 was (0.80± 0.195 p = 0.016) (Figure 2A and B). Thus, in the plasma of NPDR, the levels of miR-126 and miR-132 were decreased significantly. Similarly, decreased levels of miR-126 and miR-132 were observed in vitreous (Figure 2C and D).
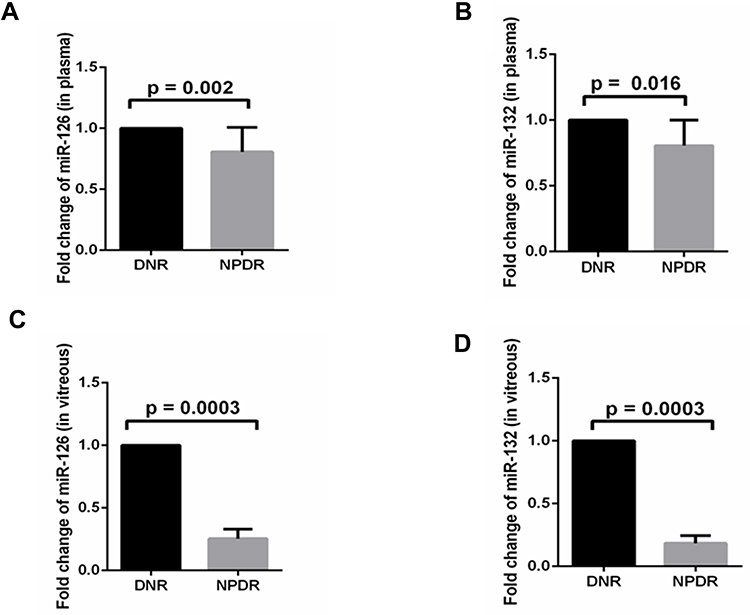 |
Figure 2 Levels of miR-126 and miR-132 in plasma (A and B) and vitreous (C and D) of type 2 diabetes without retinopathy (DNR) (dense black bar) and non-proliferative diabetic retinopathy (NPDR) (greyscale). |
Correlation Between Levels of miR-126 and miR-132 in Plasma and Vitreous of NPDR Subjects
Levels of both the miRs were reduced in plasma and vitreous. The cellular origin of circulating cell-free miRs in plasma and vitreous remains unknown. Decreased levels of miRs in plasma or various other materials could be due to the repression of the miRs by the transcription factors (TF) in the cells from where they originated. Common TFs might regulate both the miRs and in this scenario, levels of the miRs could be coregulated. To find out whether levels of miR-126 and miR-132 were correlated, we determined the correlation between the levels observed in plasma and vitreous of NPDR subjects. In NPDR subjects, miR-126 showed very strong and significant positive correlations with fold change of miR-132, both in plasma (r = 0.989, p < 0.0001) (Figure 3A) and vitreous (r = 0.949, p = 0.001) (Figure 3B). As evident from the figures, the outlier values might influence the correlation, we repeated the analysis of the data after removing the outliers and observed a similar strong positive correlation between the said miRs in plasma after exclusion of two outlier values (r = 0.983, p < 0.0001) (data not shown). Thus, these two miRs might be regulated by the same regulators.
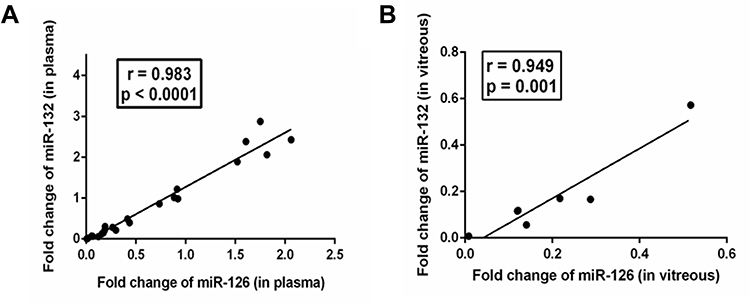 |
Figure 3 Correlation between the levels of miR in plasma (A) and vitreous (B) from NPDR subjects. |
Correlation of Demographic and Biochemical Parameters with Fold Change of miR-126 and miR-132
To find out the contribution of miRs in various demographic and biochemical parameters, we determined the correlation between plasma levels of miRs, demographic characteristics, and biochemical parameters. This analysis revealed that levels of VEGF in plasma were strongly and significantly correlated with levels of miR-126 in plasma (r = −0.532, p = 0.009). Other significantly but negatively correlated parameters were total cholesterol (TC), low-density lipoprotein (LDL) cholesterol (LDL-C), Triglycerides (TG), and Malondialdehyde (MDA). This result shows that miR-126 may contribute to these parameters. The result is shown in Table 2. A similar result was also obtained with levels of miR-132 in plasma and shown in Table 3.
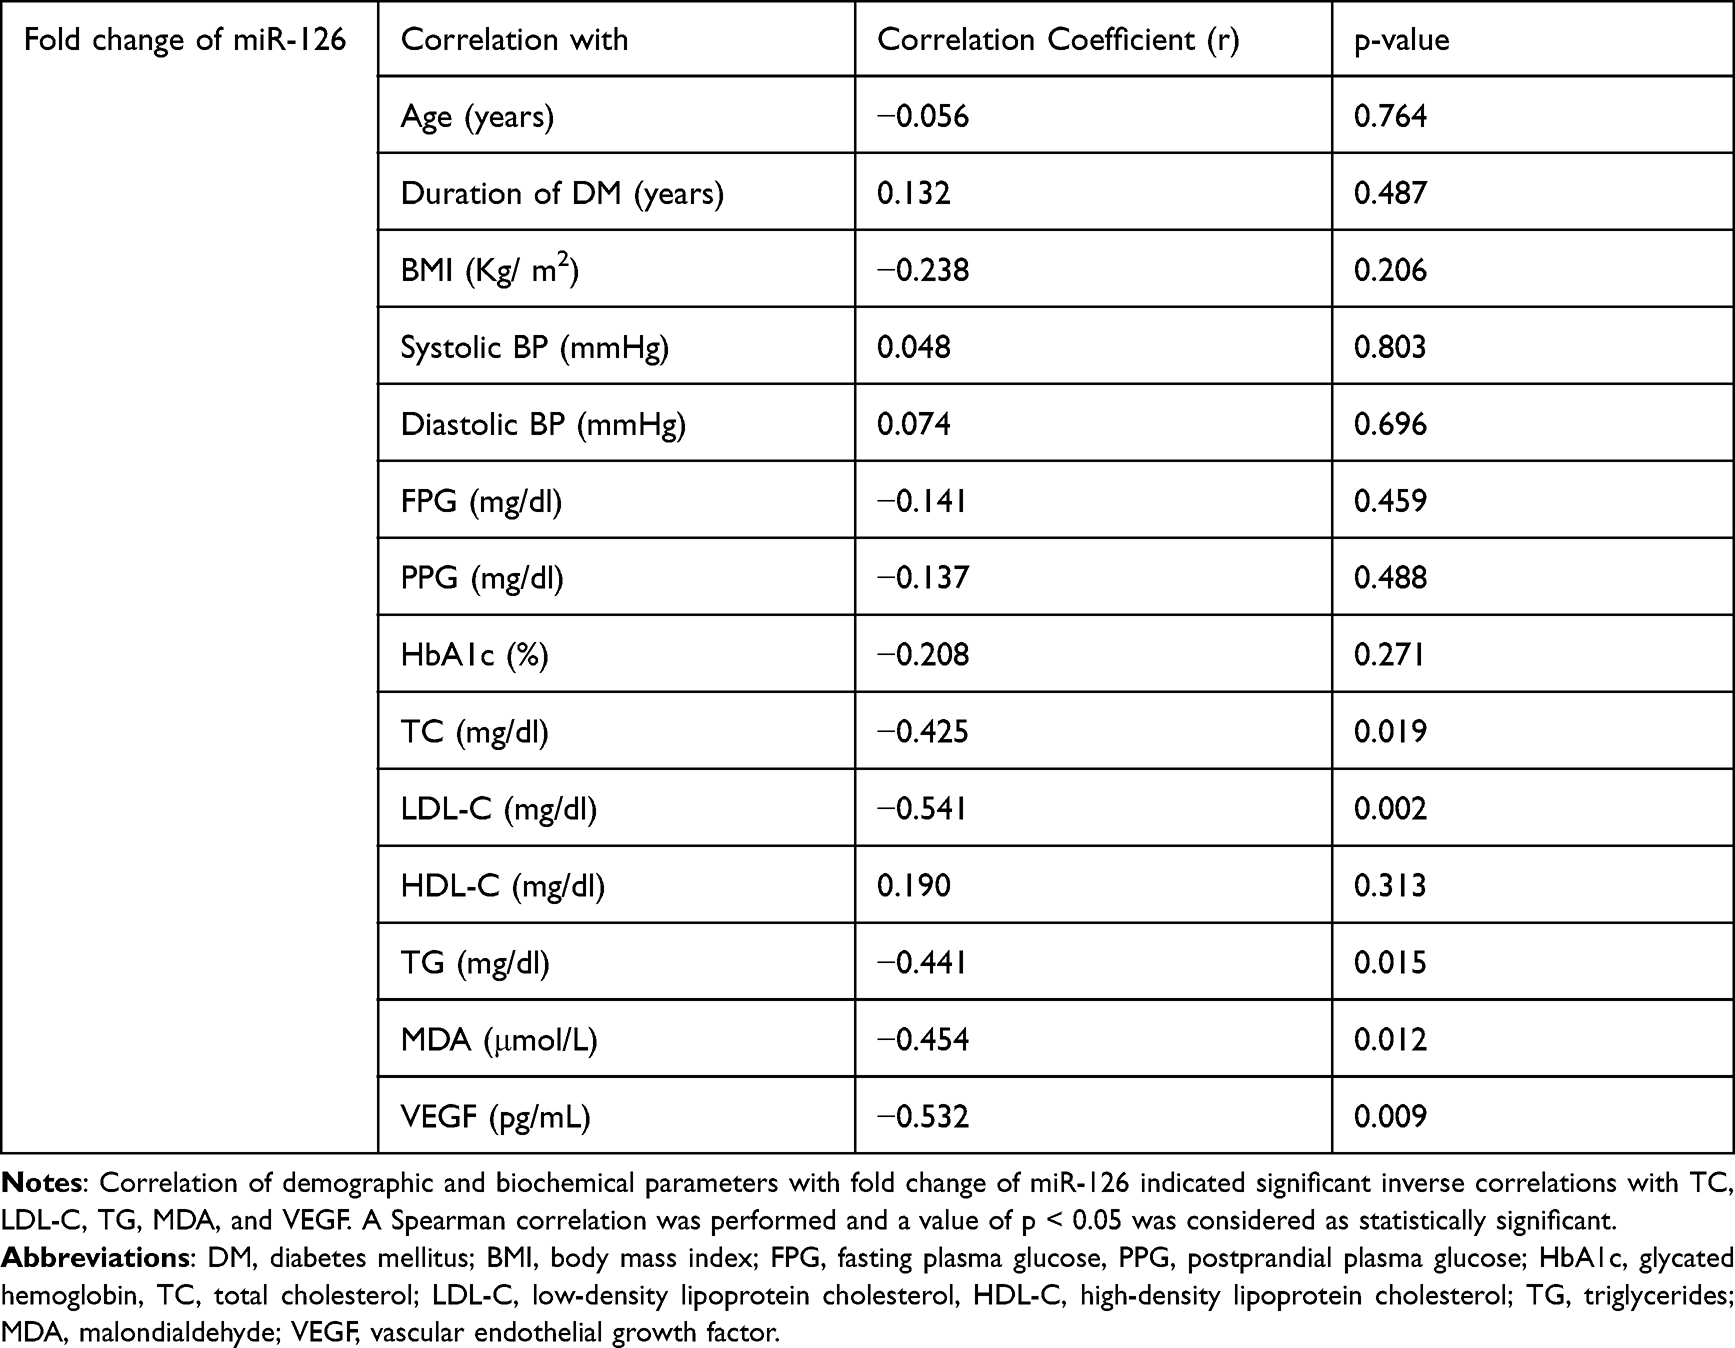 |
Table 2 Correlation of Demographic and Biochemical Parameters with Fold Change of miR-126 in NPDR Subjects |
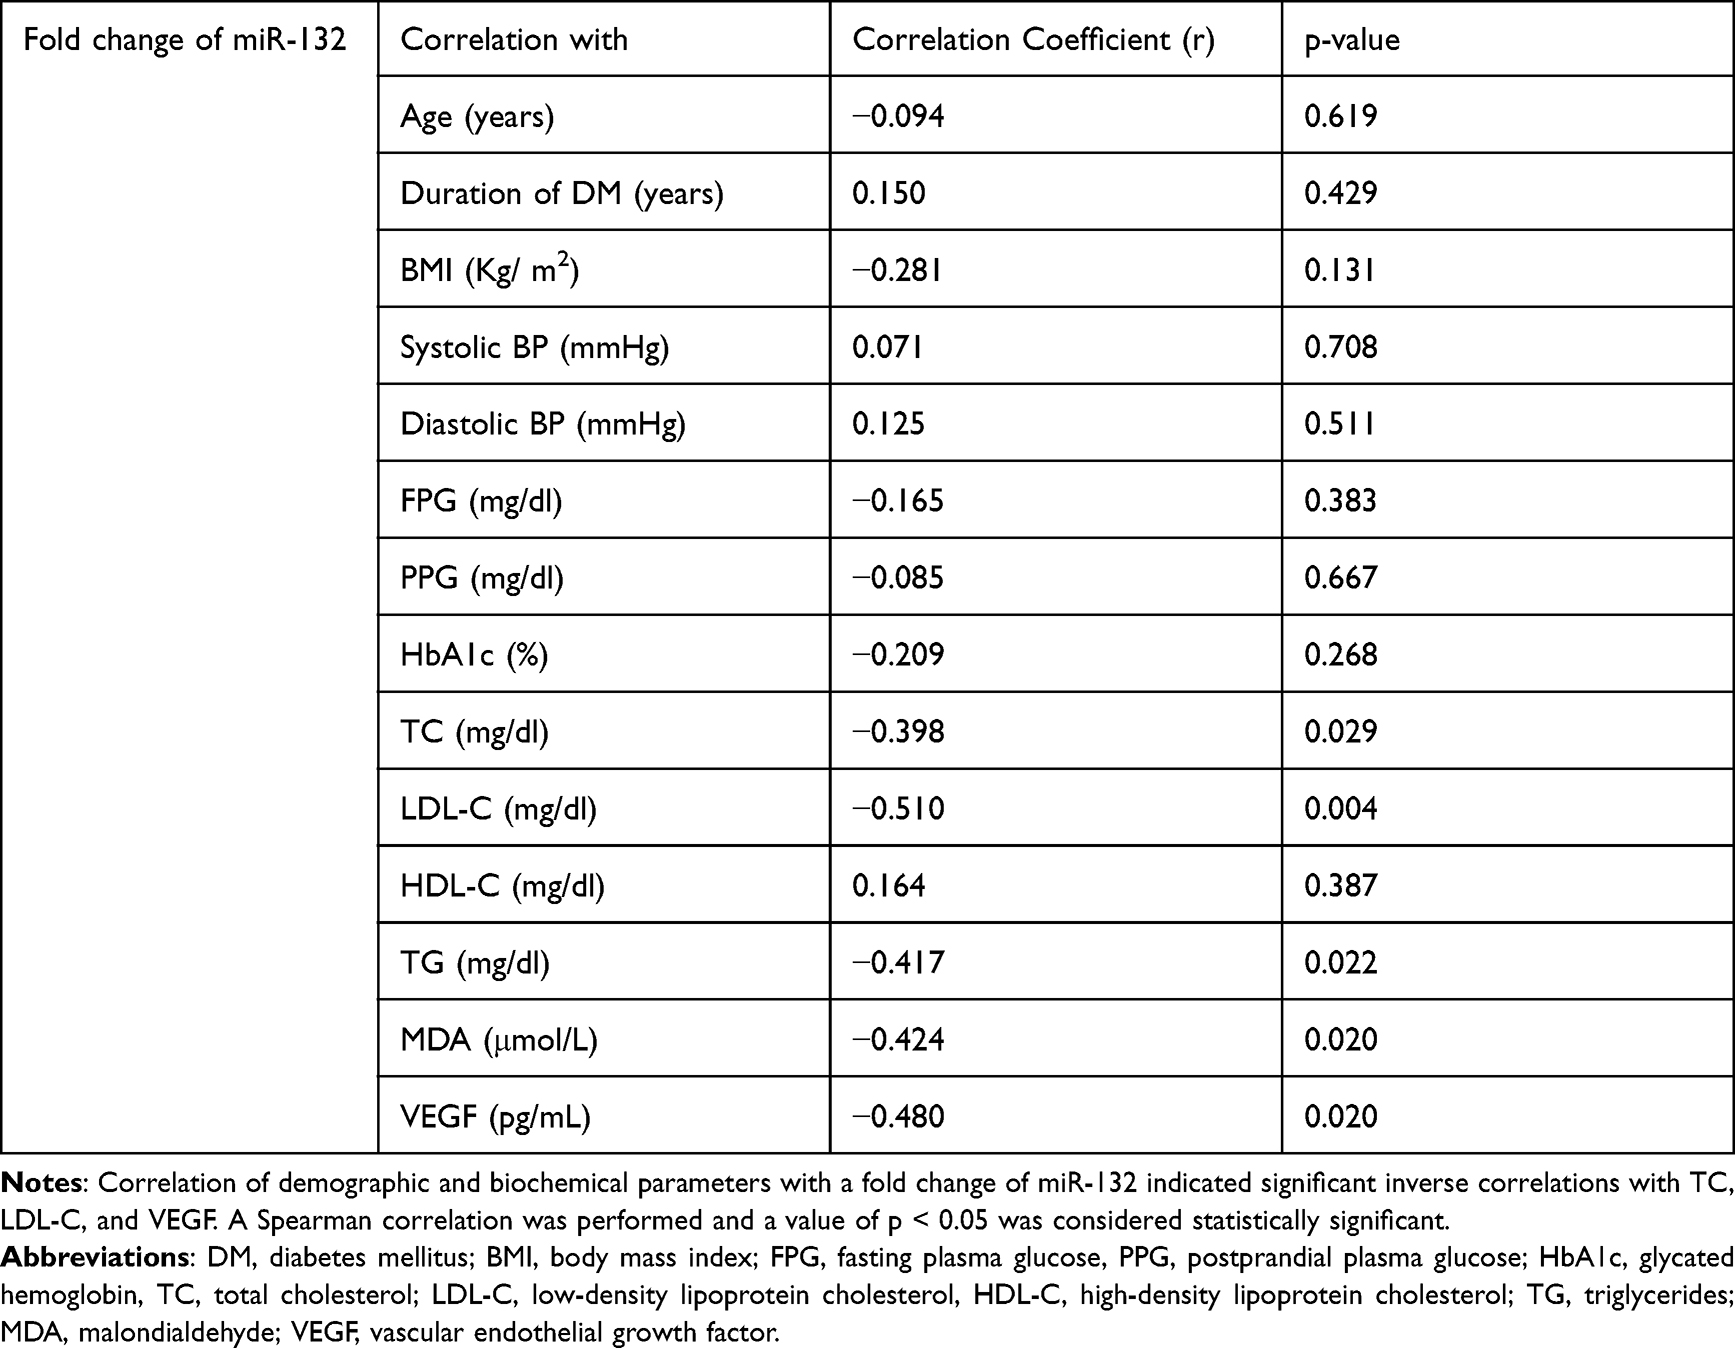 |
Table 3 Correlation of Demographic and Biochemical Parameters with a Fold Change of miR-132 in NPDR Subjects |
ROC Curve for miR-126 and 132 in Terms of Delta Ct (Δct) Value
ROC analysis with the fold change of miR-126 in plasma demonstrated that it could discriminate NPDR subjects from DNR subjects with an AUC of ROC curve of 0.7241 [95% CI (0.56 to 0.88), p = 0.01] (Figure 4A). The cutoff value was <0.9607; with 72% sensitivity and 100% specificity. On the other hand, miR-132 was found to discriminate DNR subjects from NPDR subjects with an AUC of ROC curve of 0.7037 [95% CI (0.53 to 0.87), p = 0.02] (Figure 4B). The cut-off value was <0.9930, with 70% sensitivity and 100% specificity. In vitreous, both miRs were able to discriminate DNR subjects from NPDR subjects with an AUC of ROC curve of 1.000, [95% CI (1.000–1.000), p = 0.001] (4C) and (4D), respectively. The cut-off values were <0.8126 (for miR-126) and <0.7862 (for miR-132) indicated 100% sensitivity and 100% specificity in both cases.
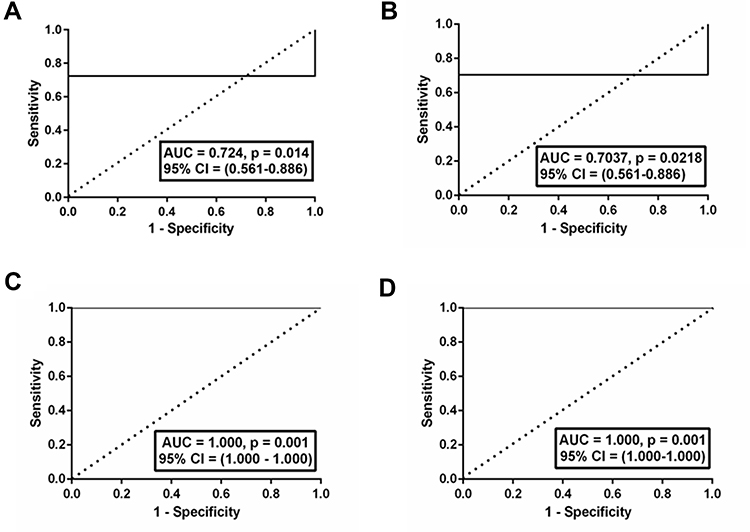 |
Figure 4 ROC curve for miR-126 and 132. In plasma, fold change of miR-126 was found to discriminate DNR subjects from NPDR subjects with an AUC of ROC curve of 0.724, p = 0.014 (A); miR-132 was found to discriminate DNR subjects from NPDR subjects with an AUC of ROC curve 0.703, p = 0.021 (B). In vitreous, both miRs were found to discriminate DNR subjects from NPDR subjects with an AUC of ROC curve of 1.000, p = 0.001 (C) and (D) respectively. |
Validated Targets of miR-126 and miR-132
Experimentally determined targets of miR-126 and miR-132 were collected from miRTarBase as described in materials methods. Four genes, namely CRK, SPRED1, SIRT1, and PLAGL2 are common targets of miR-126 and miR-132; miR-126 has 54 unique experimentally known targets and miR-132 has 251 unique targets. Both the miRs have together 309 validated targets. These targets may contribute to the pathophysiology of the disease. Detail of the targets of the miR-126 and miR-132 is shown in the Supplementary Tables ST3A and ST3B.
Enrichment Analysis with the Validated Targets of miR-126 and miR-132 for Biological Processes and Pathways
Following the methods described in the materials and methods, enrichment analysis was carried out using GeneCodis4. It was observed that more than 400 biological processes and 77 KEGG pathways were significantly (corrected p ≤ 0.05) enriched with the validated targets of the miR-126 and miR-132 and associated with at least 3 targets. A complete list of the enriched biological processes and KEGG pathways are shown in the Supplementary Tables ST4A and ST4B. Representatives of most significantly enriched biological processes and pathways are shown in Figure 5A and B respectively.
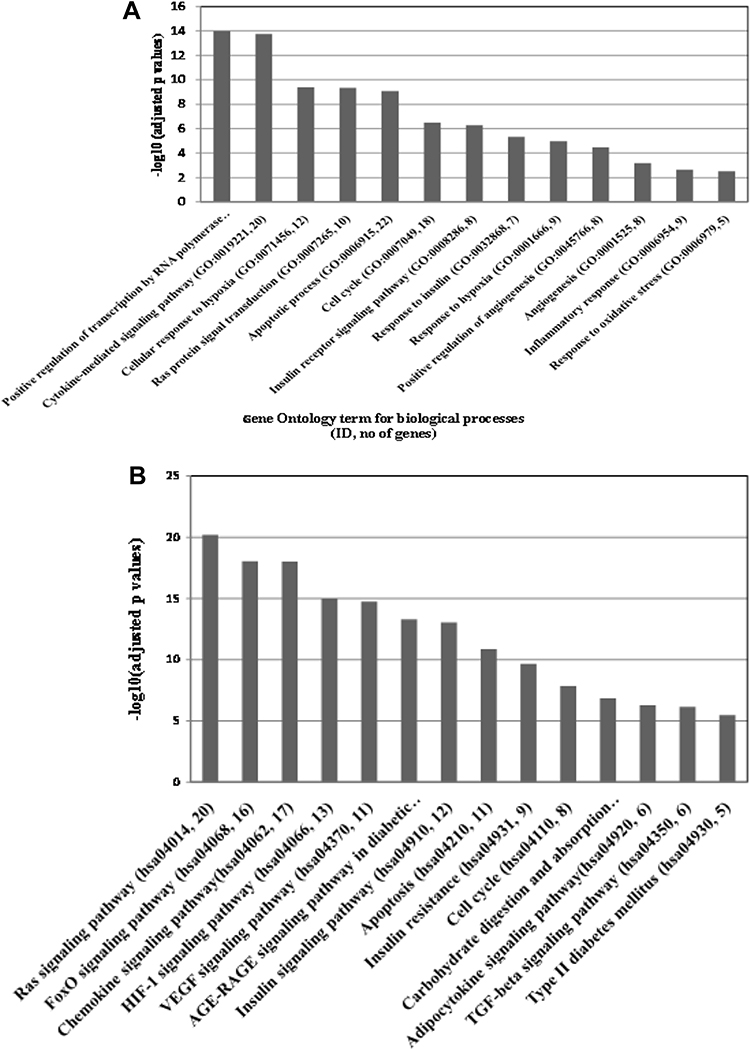 |
Figure 5 (A) Positive regulation of transcription by RNA polymerase II (GO: 0045944, no of genes 34), Cytokine-mediated signalling pathway (GO:0019221, 20), Cellular response to hypoxia (GO:0071456, 12), Ras protein signal transduction (GO:0007265, 10), Apoptotic process (GO:0006915, 22), Cell cycle (GO:0007049, 18), Insulin receptor signalling pathway (GO:0008286, 8), Response to insulin (GO:0032868, 7), Response to hypoxia (GO:0001666, 9), Positive regulation of angiogenesis (GO:0045766, 8), Angiogenesis (GO:0001525, 8), Inflammatory response (GO:0006954, 9) and Response to oxidative stress (GO:0006979, 5). (B) Representative image of relevant KEGG pathways significantly enriched with validated targets of miR-126 and miR-132: From left to right FoxO signalling pathway (hsa04068, number of genes 16), Chemokine signalling pathway (hsa04062, 17), HIF-1 signalling pathway (hsa04066, 13), VEGF signalling pathway (hsa04370, 11), AGE-RAGE signalling pathway in diabetic complications (hsa04933, 12), Insulin signalling pathway (hsa04910, 12), Apoptosis (hsa04210, 11), Insulin resistance (hsa04931, 9), Cell cycle (hsa04110, 8), Carbohydrate digestion and absorption (hsa04973, 5), Adipocytokine signalling pathway (hsa04920, 6), TGF-beta signalling pathway (hsa04350, 6) and Type II diabetes mellitus (hsa04930,5). |
Discussion
In the present manuscript, we observed decreased levels of miR-126 and miR-132 in plasma and vitreous from NPDR in comparison with that of DNR. Even though fold changes in plasma of both the miRs could discriminate NPDR from DNR with moderate sensitivity and specificity, fold changes in vitreous could discriminate NPDR from DNR with high specificity and sensitivity. Levels of the miRs were negatively correlated with VEGF, TC, LDL-C, TG, and MDA. In silico enrichment analysis with the known validated targets of the miRs indicated that these miRs might involve in the pathogenesis of DR, especially NPDR.
A similar result of decreased levels of miR-126 has been observed in serum, plasma, and aqueous humor of retina of DR or animal model of DR.18,28,37 Serum level of miR-126 has been shown to discriminate between healthy control and DR (NPDR+PDR) with AUC of 0.976; specificity and sensitivity were 0.903 and 0.812. These values were higher than those obtained with plasma but lower than those obtained with vitreous miR-126 for NPDR (Figure 4). In the present study, a similar result for discriminating NPDR from diabetic control was also obtained with plasma and vitreous (Figure 4), possibly for the first time.
Increased levels of TC, LDL-C, TG, MDA, and VEGF among NPDR subjects compared to DNR are in agreement with similar studies conducted earlier.65,66 However, significant negative correlations of those conventional lipid parameters, MDA, an indicator of oxidative stress,63 and VEGF with levels of miRs in our study could be due to up-regulation of target genes of miR-126 and miR-132 in NPDR. For example, the voltage-dependent anion-selective channel protein 2 (VDAC2) and low-density lipoprotein receptor (LDLR), validated targets of miR-132 are associated with cholesterol metabolism pathway (KEGG ID: hsa04979). Cystic fibrosis transmembrane conductance regulator (CFTR), another target of miR-132 is associated with cholesterol transport (GO: 0030301). Similarly, glycerol kinase (GK), and (Acyl-CoA Synthetase Long-Chain Family Member 4 (ACSL4) and cytochrome P450 family 2 subfamily E member 1 (CYP2E1)), targets of miR-132 are associated with triglyceride biosynthesis (GO:0019432), response to oxidative stress (GO:0006979) and lipid metabolic process (GO:0006629). This in silico analysis indicates that observed changes in MDA, TC, LDL-C, and TG could be mediated through decreased miRs (Supplementary Table ST5). However, whether TC, LDL-C, and TG in plasma could influence the levels of miRs in plasma could not be ruled out. It remains to be found out whether expressions of the genes were increased in the affected tissue of DR.
Experimentally validated targets of both the miR together enriched with biological processes and pathways like angiogenesis, apoptosis, cell cycle, hypoxic response, inflammation, and many signalling pathways (Supplementary Tables ST4A, ST4B, Figure 5A and B). MiR-126 has been shown to contribute to the pathogenesis of DR by regulating cell viability, cell proliferation, neovascularization, and angiogenesis,67–71 possibly targeting VEGF, and a validated target of miR-126.20,50,51,71 Decreased expression of miR-132 has been shown to be associated with microangiopathy in the early stage of DHD.53 In various studies, transcription factor “forkhead box O” (FoxO),72 chemokine,18 HIF-1 signalling pathway,8,73 receptor for advanced glycation end products (AGE-RAGE) signalling pathway in diabetic complications,20 insulin signalling, insulin resistance,21 apoptosis,17 carbohydrate metabolism,22 adipocytokine pathway67 and transforming growth factor-beta (TGFβ) signalling pathway have been implicated in DR pathogenesis. These pathways were enriched with validated targets of miR-126 and miR-132 indicating deregulated miRs might involve in the pathogenesis of NPDR.
The mechanism of deregulation of miRs in DR remains unknown. In vitro hypoxic condition that stabilizes HIF-1 alters expression of several miRs that target VEGF in a time-dependent manner.74 Bioinformatics analysis showed the binding site of HIF-1 at putative promoters of a few miRs.75 This result indicates that HIF-1 directly or indirectly might modulate the expression of miRs alters several miRs. The binding of HIF-1 at putative promoters of miR-126 and miR-132 were evident from the ChIPBase database (http://rna.sysu.edu.cn/chipbase/, accessed in October 2019) (data not shown). It remains unknown whether HIF-1 binds and regulates the expression of these miRs in retinal cells or DR. Strong correlation between the levels of miR-126 and miR-132 indicates that they might be regulated by the same transcription factors, yet to be identified.
Despite some novelty, the present study has some limitations. The significant inverse correlations observed with levels of miRs in plasma with plasma levels of VEGF, TC, LDL-C, TG, and MDA could not be causal. The causality of these parameters for altered levels of miRs in developing NPDR from DNR could not be established in a very significant way with the present cross-sectional study using the small sample size. The mechanism by which the levels of miRs altered in plasma or vitreous samples was not clear. It might originate from the decreased expression in the damaged tissue(s) in NPDR. The roles of cholesterol, lipids, and oxidative stress in altering the stability of miRs in plasma remain unknown. This possibility cannot be ruled out from this study. A larger cohort study with balanced background biochemical features and other forms of retinal vasculopathy or retinopathy is required to better understand the role of miR in the etiology of DR.
Conclusion
Relative levels of circulating miR-126 and miR-132 in plasma or vitreous might serve as biomarkers for early diabetic retinopathy risk prediction, provided validated in a larger cohort and other forms of retinal vasculopathy or retinopathy in the future.
Ethics and Consent
The study was approved by the Institutional Ethics Committee (Medical College, Kolkata, Ref. No: MC/ KOL/IEC/NON-SPON/181/12-2018), and informed consents were collected from all patients according to the declaration of Helsinki.
Acknowledgments
Prof Ashim Kumar Ghosh, Director Regional Institute of Ophthalmology, for his encouragement and support towards the fulfillment of this work. We also want to acknowledge “Multidisciplinary Research Unit” (MRU) of IPGME&R and SSKM Hospital for providing us trichloroacetic acid (TCA) reagent (Sigma-Aldrich, CAS Number 76-03-9) for MDA measurement.
Funding
This research did not receive any specific grant from funding agencies in the public, commercial, or not-for-profit sectors.
Disclosure
The authors declare no conflicts of interest for this work.
References
1. Cheung N, Mitchell P, Wong TY. Diabetic retinopathy. Lancet. 2010;376(9735):124–136. doi:10.1016/S0140-6736(09)62124-3
2. Wong TY, Cheung CM, Larsen M, Sharma S, Simo R. Diabetic retinopathy. Nat Rev Dis Primers. 2016;2:16012. doi:10.1038/nrdp.2016.12
3. Wang W, Lo ACY. Diabetic retinopathy: pathophysiology and treatments. Int J MolSci. 2018;19(6):1816.
4. Nathan DM, Genuth S, Lachin J, et al.; Diabetes C, Complications Trial Research. The effect of intensive treatment of diabetes on the development and progression of long-term complications in insulin-dependent diabetes mellitus. N Engl J Med. 1993;329(14):977–986.
5. Group UKPDSU. Intensive blood-glucose control with sulphonylureas or insulin compared with conventional treatment and risk of complications in patients with type 2 diabetes (UKPDS 33). Lancet. 1998;352(9131):837–853. doi:10.1016/S0140-6736(98)07019-6
6. Writing Team for the Diabetes C, Complications Trial/Epidemiology of Diabetes I, Complications Research G. Sustained effect of intensive treatment of type 1 diabetes mellitus on development and progression of diabetic nephropathy: the Epidemiology of Diabetes Interventions and Complications (EDIC) study. JAMA. 2003;290(16):2159–2167. doi:10.1001/jama.290.16.2159
7. Zhang QM, Fang W, Ma L, Wang Z, Yang YM, Lu YQ. VEGF levels in plasma in relation to metabolic control, inflammation, and microvascular complications in type-2 diabetes. Medicine. 2018;97(15):e0415. doi:10.1097/MD.0000000000010415
8. Huang H, He J, Johnson DK, et al. Deletion of placental growth factor prevents diabetic retinopathy and is associated with Akt activation and HIF1α-VEGF pathway inhibition. Diabetes. 2015;64(1):200–212.
9. Li J, Wang JJ, Yu Q, Chen K, Mahadev K, Zhang SX. Inhibition of reactive oxygen species by Lovastatin downregulates vascular endothelial growth factor expression and ameliorates blood-retinal barrier breakdown in db/db mice: role of NADPH oxidase 4. Diabetes. 2010;59(6):1528–1538. doi:10.2337/db09-1057
10. Aiello LP, Avery RL, Arrigg PG, et al. Vascular endothelial growth factor in ocular fluid of patients with diabetic retinopathy and other retinal disorders. N EnglJ Med. 1994;331(22):1480–1487. doi:10.1056/NEJM199412013312203
11. Adamis AP, Miller JW, Bernal M-T, et al. Increased vascular endothelial growth factor levels in the vitreous of eyes with proliferative diabetic retinopathy. Am J Ophthalmol. 1994;118(4):445–450. doi:10.1016/S0002-9394(14)75794-0
12. Lupo G, Motta C, Giurdanella G, et al. Role of phospholipases A2 in diabetic retinopathy: in vitro and in vivo studies. BiochemPharmacol. 2013;86(11):1603–1613.
13. Antonetti DA, Barber AJ, Hollinger LA, Wolpert EB, Gardner TW. Vascular endothelial growth factor induces rapid phosphorylation of tight junction proteins occludin and zonulaoccluden 1: a potential mechanism for vascular permeability in diabetic retinopathy and tumors. J BiolChem. 1999;274(33):23463–23467.
14. Rousseau S, Houle F, Landry J, Huot J. p38 MAP kinase activation by vascular endothelial growth factor mediates actin reorganization and cell migration in human endothelial cells. Oncogene. 1997;15(18):2169–2177. doi:10.1038/sj.onc.1201380
15. Patel JI, Hykin PG, Gregor ZJ, Boulton M, Cree IA. Angiopoietin concentrations in diabetic retinopathy. Br J Ophthalmol. 2005;89(4):480–483. doi:10.1136/bjo.2004.049940
16. Rangasamy S, Srinivasan R, Maestas J, McGuire PG, Das A. A potential role for angiopoietin 2 in the regulation of the blood-retinal barrier in diabetic retinopathy. Invest Ophthalmol Vis Sci. 2011;52(6):3784–3791. doi:10.1167/iovs.10-6386
17. Ejaz S, Chekarova I, Ejaz A, Sohail A, Lim CW. Importance of pericytes and mechanisms of pericyte loss during diabetes retinopathy. Diabetes ObesMetab. 2008;10(1):53–63.
18. Martinez B, Peplow P. MicroRNAs as biomarkers of diabetic retinopathy and disease progression. Neural Regen Res. 2019;14(11):1858–1869. doi:10.4103/1673-5374.259602
19. Barutta F, Bruno G, Matullo G, et al. MicroRNA-126 and micro-/macrovascular complications of type 1 diabetes in the EURODIAB Prospective Complications Study. ActaDiabetol. 2017;54(2):133–139.
20. McAuley AK, Dirani M, Wang JJ, Connell PP, Lamoureux EL, Hewitt AW. A genetic variant regulating miR-126 is associated with sight threatening diabetic retinopathy. DiabVasc Dis Res. 2015;12(2):133–138. doi:10.1177/1479164114560160
21. Lu J-M, Zhang -Z-Z, Ma X, Fang S-F, Qin X-H. Repression of microRNA-21 inhibits retinal vascular endothelial cell growth and angiogenesis via PTEN dependent-PI3K/Akt/VEGF signaling pathway in diabetic retinopathy. Exp Eye Res. 2020;190:107886. doi:10.1016/j.exer.2019.107886
22. Wang Q, Navitskaya S, Chakravarthy H, et al. Dual anti-inflammatory and anti-angiogenic action of miR-15a in diabetic retinopathy. EBioMedicine. 2016;11:138–150. doi:10.1016/j.ebiom.2016.08.013
23. Chen S, Yuan M, Liu Y, et al. Landscape of microRNA in the aqueous humour of proliferative diabetic retinopathy as assessed by next-generation sequencing. ClinExpOphthalmol. 2019;47(7):925–936.
24. Ji H, Yi Q, Chen L, et al. Circulating miR-3197 and miR-2116-5p as novel biomarkers for diabetic retinopathy. ClinChimActa. 2019;501:147–153.
25. Blum A, Meerson A, Rohana H, et al. MicroRNA-423 may regulate diabetic vasculopathy. ClinExp Med. 2019;19(4):469–477. doi:10.1007/s10238-019-00573-8
26. Pastukh N, Meerson A, Kalish D, Jabaly H, Blum A. Serum miR-122 levels correlate with diabetic retinopathy. ClinExp Med. 2019;19(2):255–260. doi:10.1007/s10238-019-00546-x
27. Zampetaki A, Willeit P, Burr S, et al. Angiogenic microRNAs linked to incidence and progression of diabetic retinopathy in type 1 diabetes. Diabetes. 2016;65(1):216. doi:10.2337/db15-0389
28. Smit-McBride Z, Nguyen AT, Yu AK, et al. Unique molecular signatures of microRNAs in ocular fluids and plasma in diabetic retinopathy. PLoS One. 2020;15(7):e0235541. doi:10.1371/journal.pone.0235541
29. Kumari N, Karmakar A, Chakrabarti S, Ganesan SK. Integrative computational approach revealed crucial genes associated with different stages of diabetic retinopathy. Front Genet. 2020;11:576442. doi:10.3389/fgene.2020.576442
30. Grieco GE, Sebastiani G, Eandi CM, et al. MicroRNA expression in the aqueous humor of patients with diabetic macular edema. Int J MolSci. 2020;21(19):7328.
31. Desjarlais M, Rivera JC, Lahaie I, et al. MicroRNA expression profile in retina and choroid in oxygen-induced retinopathy model. PLoS One. 2019;14(6):e0218282–e. doi:10.1371/journal.pone.0218282
32. Platania CBM, Maisto R, Trotta MC, et al. Retinal and circulating miRNA expression patterns in diabetic retinopathy: an in silico and in vivo approach. Br J Pharmacol. 2019;176(13):2179–2194. doi:10.1111/bph.14665
33. Wang M, Zheng H, Zhou X, Zhang J, Shao G. miR-122 promotes diabetic retinopathy through targeting TIMP3. Animal Cells and Systems. 2020;24(5):275–281. doi:10.1080/19768354.2020.1816580
34. Yang TT, Song SJ, Xue HB, Shi DF, Liu CM, Liu H. Regulatory T cells in the pathogenesis of type 2 diabetes mellitus retinopathy by miR-155. Eur Rev Med PharmacolSci. 2015;19(11):2010–2015.
35. Prado MSG, de Jesus ML, de Goes TC, Mendonca LSO, Kaneto CM. Downregulation of circulating miR-320a and target gene prediction in patients with diabetic retinopathy. BMC Res Notes. 2020;13(1):155. doi:10.1186/s13104-020-05001-9
36. Ji Q, Han J, Wang L, et al. MicroRNA-34a promotes apoptosis of retinal vascular endothelial cells by targeting SIRT1 in rats with diabetic retinopathy. Cell Cycle. 2020;19(21):2886–2896. doi:10.1080/15384101.2020.1827509
37. Zheng Y, Liu Y, Wang L, et al. MicroRNA126 suppresses the proliferation and migration of endothelial cells in experimental diabetic retinopathy by targeting pololike kinase 4. Int J Mol Med. 2021;47(1):151–160. doi:10.3892/ijmm.2020.4775
38. Wang J, Yao Y, Wang K, Li J, Chu T, Shen H. MicroRNA-148a-3p alleviates high glucose induced diabetic retinopathy by targeting TGFB2 and FGF2. ActaDiabetol. 2020;57(12):1435–1443.
39. Yang Y, Liu Y, Li Y, et al. MicroRNA-15b targets VEGF and inhibits angiogenesis in proliferative diabetic retinopathy. J ClinEndocrinolMetab. 2020;105(11):3404–3415.
40. Li EH, Huang QZ, Li GC, Xiang ZY, Zhang X. Effects of miRNA-200b on the development of diabetic retinopathy by targeting VEGFA gene. Biosci Rep. 2017;37(2):BSR20160572. doi:10.1042/BSR20160572
41. McArthur K, Feng B, Wu Y, Chen S, Chakrabarti S. MicroRNA-200b regulates vascular endothelial growth factor-mediated alterations in diabetic retinopathy. Diabetes. 2011;60(4):1314–1323. doi:10.2337/db10-1557
42. Zhang J, Li S, Li L, Li M, Guo C, Yao J. Exosome and exosomal MicroRNA: trafficking, sorting, and function. GenomProteomBioinf. 2015;13(1):17–24.
43. Arroyo JD, Chevillet JR, Kroh EM, et al. Argonaute2 complexes carry a population of circulating microRNAs independent of vesicles in human plasma. NatlAcadSci U S A. 2011;108(12):5003–5008. doi:10.1073/pnas.1019055108
44. Turchinovich A, Tonevitsky AG, Burwinkel B. Extracellular miRNA: a collision of two paradigms. Trends BiochemSci. 2016;41(10):883–892. doi:10.1016/j.tibs.2016.08.004
45. Greco M, Chiefari E, Accattato F, et al. MicroRNA-1281 as a novel circulating biomarker in patients with diabetic retinopathy. Front Endocrinol (Lausanne). 2020;11:528. doi:10.3389/fendo.2020.00528
46. Yang X, Yu X, Zhou RH, Liu C. Serum miRNA-27b-3p is a biomarker of diabetic retinopathy. J BiolRegulHomeost Agents. 2020;34(4):1431–1435.
47. Liu HN, Li X, Wu N, et al. Serum microRNA-221 as a biomarker for diabetic retinopathy in patients associated with type 2 diabetes. Int J Ophthalmol. 2018;11(12):1889–1894. doi:10.18240/ijo.2018.12.02
48. Shaker OG, Abdelaleem OO, Mahmoud RH, et al. Diagnostic and prognostic role of serum miR-20b, miR-17-3p, HOTAIR, and MALAT1 in diabetic retinopathy. IUBMB Life. 2019;71(3):310–320.
49. Qing S, Yuan S, Yun C, et al. Serum miRNA biomarkers serve as a fingerprint for proliferative diabetic retinopathy. Cell PhysiolBiochem. 2014;34(5):1733–1740.
50. Fish JE, Santoro MM, Morton SU, et al. miR-126 regulates angiogenic signalling and vascular integrity. Dev Cell. 2008;15(2):272–284. doi:10.1016/j.devcel.2008.07.008
51. Dang LT, Lawson ND, Fish JE. MicroRNA control of vascular endothelial growth factor signaling output during vascular development. Arterioscler Thromb Vasc Biol. 2013;33(2):193–200. doi:10.1161/ATVBAHA.112.300142
52. Yang Y, Liu Y, Li Y, et al. MicroRNA-15b targets VEGF and inhibits angiogenesis in proliferative diabetic retinopathy. J Clin Endocrinol Metab. 2020;105(11):3404–3415. doi:10.1210/clinem/dgaa538
53. Rawal S, Munasinghe PE, Shindikar A, et al. Down-regulation of proangiogenic microRNA-126 and microRNA-132 are early modulators of diabetic cardiac microangiopathy. Cardiovasc Res. 2017;113(1):90–101. doi:10.1093/cvr/cvw235
54. Qin LL, An MX, Liu YL, Xu HC, Lu ZQ. MicroRNA-126: a promising novel biomarker in peripheral blood for diabetic retinopathy. Int J Ophthalmol. 2017;10(4):530–534. doi:10.18240/ijo.2017.04.05
55. Kamel NM, Ayoub NM, Ibrahim RS, Ghalwash AA, Khalaf NA. Clinical significance of microRNA 126 in diabetic retinopathy in type 2 diabetes mellitus. JRAM. 2020;1(2):128–135.
56. Chou C-H, Shrestha S, Yang C-D, et al. miRTarBase update 2018: a resource for experimentally validated microRNA-target interactions. Nucleic Acids Res. 2018;46(D1):D296–D302.
57. Wilkinson CP, Ferris FL
58. Friedewald WT, Levy RI, Fredrickson DS. Estimation of the concentration of low-density lipoprotein cholesterol in plasma, without use of the preparative ultracentrifuge. Clin Chem. 1972;18(6):499–502. doi:10.1093/clinchem/18.6.499
59. Kei S. Serum lipid peroxide in cerebrovascular disorders determined by a new colorimetric method. ClinicaChimicaActa. 1978;90(1):37–43.
60. Pramanik S, Ganguly U, Khemka VK, Banerjee A. Decreased glucose-6-phosphate dehydrogenase activity along with oxidative stress affects visual contrast sensitivity in alcoholics. Alcohol. 2018;73:17–24. doi:10.1016/j.alcohol.2018.03.007
61. Gatautis VJ, Pearson KH. Separation of plasma carotenoids and quantitation of beta-carotene using HPLC. Clin Chim Acta. 1987;166(2–3):195–206. doi:10.1016/0009-8981(87)90422-0
62. Yang LH, Wang SL, Tang LL. Universal stem-loop primer method for screening and quantification of MicroRNA. PLoS One. 2015;9(12):e115293. doi:10.1371/journal.pone.0115293
63. Bergin P, Leggett A, Cardwell CR, et al. The effects of vitamin E supplementation on malondialdehyde as a biomarker of oxidative stress in haemodialysis patients: a systematic review and meta-analysis. BMC Nephrol. 2021;22(1):126. doi:10.1186/s12882-021-02328-8
64. Tschirch E, Weber B, Koehne P, et al. Vascular endothelial growth factor as marker for tissue hypoxia and transfusion need in anemic infants: a prospective clinical study. Pediatrics. 2009;123(3):784–790. doi:10.1542/peds.2007-2304
65. Mondal LK, Bhaduri G, Bhattacharya B. Biochemical scenario behind initiation of diabetic retinopathy in type 2 diabetes mellitus. Indian J Ophthalmol. 2018;66(4):535–540. doi:10.4103/ijo.IJO_1121_17
66. Pramanik S, Chowdhury S, Ganguly U, Banerjee A, Bhattacharya B, Mondal LK. Visual contrast sensitivity could be an early marker of diabetic retinopathy. Heliyon. 2020;6(10):e0533. doi:10.1016/j.heliyon.2020.e05336
67. Chen X, Yu X, Li X, et al. MiR-126 targets IL-17A to enhance proliferation and inhibit apoptosis in high-glucose-induced human retinal endothelial cells. Int J Biochem Cell Biol. 2019;98(2):277–283. doi:10.1139/bcb-2019-0174
68. Fang S, Ma X, Guo S, Lu J. MicroRNA-126 inhibits cell viability and invasion in a diabetic retinopathy model via targeting IRS-1. Oncol Lett. 2017;14(4):4311–4318. doi:10.3892/ol.2017.6695
69. Yang W-Z, Yang J, Xue L-P, Xiao L-B, Li Y. MiR-126 overexpression inhibits high glucose-induced migration and tube formation of rhesus macaque choroid-retinal endothelial cells by obstructing VEGFA and PIK3R2. J Diabetes Complicat. 2017;31(4):653–663. doi:10.1016/j.jdiacomp.2016.12.004
70. Ye P, Liu J, He F, Xu W, Yao K. Hypoxia-induced deregulation of miR-126 and its regulative effect on VEGF and MMP-9 expression. Int J Med Sci. 2013;11(1):17–23. doi:10.7150/ijms.7329
71. Bai Y, Bai X, Wang Z, Zhang X, Ruan C, Miao J. MicroRNA-126 inhibits ischemia-induced retinal neovascularization via regulating angiogenic growth factors. Exp Mol Med. 2011;91(1):471–477.
72. Silva Rodrigues DV, Silva Monteiro VV, Navegantes-Lima KC, et al. MicroRNAs in cell cycle progression and proliferation: molecular mechanisms and pathways. Non-Coding RNA Investing. 2018;2:28. doi:10.21037/ncri.2018.04.06
73. Beltramo E, Porta M. Pericyte loss in diabetic retinopathy: mechanisms and consequences. Curr Med Chem. 2013;20(26):3218–3225. doi:10.2174/09298673113209990022
74. Lazzara F, Trotta MC, Platania CBM, et al. Stabilization of HIF-1α in human retinal endothelial cells modulates expression of miRNAs and proangiogenic growth factors. Front Pharmacol. 2020;11:1063. doi:10.3389/fphar.2020.01063
75. Nallamshetty S, Chan SY, Loscalzo J. Hypoxia: a master regulator of microRNA biogenesis and activity. Free RadicBiol Med. 2013;64:20–30. doi:10.1016/j.freeradbiomed.2013.05.022
 © 2022 The Author(s). This work is published and licensed by Dove Medical Press Limited. The full terms of this license are available at https://www.dovepress.com/terms.php and incorporate the Creative Commons Attribution - Non Commercial (unported, v3.0) License.
By accessing the work you hereby accept the Terms. Non-commercial uses of the work are permitted without any further permission from Dove Medical Press Limited, provided the work is properly attributed. For permission for commercial use of this work, please see paragraphs 4.2 and 5 of our Terms.
© 2022 The Author(s). This work is published and licensed by Dove Medical Press Limited. The full terms of this license are available at https://www.dovepress.com/terms.php and incorporate the Creative Commons Attribution - Non Commercial (unported, v3.0) License.
By accessing the work you hereby accept the Terms. Non-commercial uses of the work are permitted without any further permission from Dove Medical Press Limited, provided the work is properly attributed. For permission for commercial use of this work, please see paragraphs 4.2 and 5 of our Terms.