")
Back to Journals » Journal of Pain Research » Volume 13
Decreased Functional Capacity in Individuals with Chronic Non-Specific Low Back Pain: A Cross-Sectional Comparative Study
Authors Vachalathiti R , Sakulsriprasert P , Kingcha P
Received 1 May 2020
Accepted for publication 17 July 2020
Published 5 August 2020 Volume 2020:13 Pages 1979—1986
DOI https://doi.org/10.2147/JPR.S260875
Checked for plagiarism Yes
Review by Single anonymous peer review
Peer reviewer comments 2
Editor who approved publication: Professor Robert B. Raffa
Roongtiwa Vachalathiti,1 Prasert Sakulsriprasert,1 Pathaimas Kingcha2
1Division of Physical Therapy, Faculty of Physical Therapy, Mahidol University, Nakhon Pathom, Thailand; 2Physical Therapy Center, Faculty of Physical Therapy, Mahidol University, Bangkok, Thailand
Correspondence: Roongtiwa Vachalathiti
Physical Therapy Center, Faculty of Physical Therapy, Mahidol University, Nakhon Pathom 73170, Thailand
Email [email protected]
Purpose: This study aimed to compare functional capacity tests between individuals with and without chronic non-specific low back pain and to investigate the effects of demographic data on functional capacity tests.
Methods: Thirty individuals with chronic non-specific low back pain (CNSLBP) and thirty healthy individuals underwent three functional capacity tests comprising functional reach test (FRT), five-time sit to stand test (5 TSST), and two-minute step test (2 MST). CNSLBP were assessed in pain intensity using a visual analog scale (VAS) and disability level using the modified Oswestry disability questionnaire (MODQ) Thai version.
Results: The results found significant differences in five-time sit to stand and two-minute step tests between individuals with chronic non-specific low back pain and healthy individuals. The mean differences between healthy and CNSLBP for the 5 TSST were − 3.24 seconds (95% CI=− 4.47–− 2.02) and for the 2 MST they were 13.13 steps (95% CI=2.62– 23.64). Age significantly influenced the 5 TSST (P=0.004) and 2 MST (P=0.008), while gender (P=0.028) and height (P=0.002) affected the FRT.
Conclusion: Individuals with chronic non-specific low back pain had lower functional capacity assessed by five-time sit to stand and 2-minute step tests compared to healthy individuals, and the therapeutic programs were emphasized. With increasing age, the 5 TSST and 2 MST would both be declined.
Keywords: physical examination, five-time sit to stand, two-minute step, functional reach
Introduction
According to diagnostic triage of low back pain (LBP), non-specific LBP is the largest group representing approximately 90–95% of LBP patients compared to the others, namely radicular LBP and specific LBP.1 There is no clear clinical evidence for non-specific LBP to identify the pain-sensitive structures,2 but mostly related to mechanical causes.3 Regarding onset, acute LBP will develop to be chronic, if the symptoms persist for 12 weeks or longer.4 The definite diagnosis for chronic non-specific low back pain (CNSLBP) is complicated and the management aims to reduce pain and disability.5 Therefore, CNSLBP is one of the most significant health problems. The impacts are about the limitation of functional capacity and associated disability, which is highest in working age groups worldwide.6
The assessments for functional capacity and disability in patients with CNSLBP can be done with physical performance tests7,11 and self-administered questionnaires,12 respectively. Pfingsten et al9 found the differences in ability to perform eight physical performance tests such as stair climbing, prolonged flexion, stand-to-floor, fingertip-to-floor, lift test, sock test, sit-up test and pick-up test, between LBP patients and healthy controls. Stand-to-floor was the most discriminatory test whereas pick-up and lift test produced moderate results. Rudy et al10 also reported the significant difference between older individuals with and without CLBP regarding physical and psychosocial functions.
The underlying causes of CNSLBP are complex, however, it has been postulated that the weakness of core stabilizer muscles in individuals is evident, contributing to its fatigability,13 poor trunk control, and mobility.14,15 Therefore, the functional capacity tests should be thought about when considering the challenge of trunk static and dynamic control, yet in a timely manner to prevent the excessive fatigue.
Functional reach test has been used as a clinical measure of dynamic balance with core muscle control.16 Five-time sit to stand and two-minute step are promising because these tests are relevant to the dynamic function of trunk and lower limb muscles similarly to everyday working activities. Those tests were also used to measure in older adults representing dynamic balance and aerobic endurance.17,18
The objectives of this study were to compare the functional capacity in individuals with CNSLBP and healthy individuals, and to investigate the effects of demographic data on those functional capacity tests. We hypothesized that individuals with CNSLBP had a lower functional capacity compared to healthy individuals, and there were some demographic data influencing those functional capacity tests.
Methods
Study Design, Setting, and Subjects
This study was a comparative study design comparing functional capacity tests between healthy and individuals with chronic non-specific low back pain. Thirty individuals with CNSLBP were recruited from the Physical Therapy Center, Faculty of Physical Therapy, Mahidol University during a period of 9-month data collection. CNSLBP patients had mild-to-moderate pain intensity (1–3 cm for mild pain and 3.1–6 cm for moderate pain on visual analog scale) of at least 3-month duration without radicular pain.
For the healthy group, 30 individuals who were interested in the research study through public announcement were recruited. The healthy individuals had no history of pain or any symptoms at their lumbosacral region within at least 6 months prior to participation. Exclusion criteria for both groups were any neurological conditions, cardiovascular diseases, history of spinal or lower limbs surgery or fracture, pain at lower extremities, pregnancy, and on menstruation. Healthy and CNSLBP received detailed information about the study and signed an informed consent form. This study was conducted in accordance with the Declaration of Helsinki and was approved by the Ethics Committee of the Mahidol University Central Institutional Review Board (MU-CIRB), no.2017/155.2808.
Sample size calculation using a sample size calculator program, statulator.com, based on the data of five-time sit to stand from our pilot study. The confidence interval was set at 95%, alpha level 5%, power 80%, mean difference 1.889, and standard deviation 2.300, then the calculated sample size of 24 subjects per group was needed to see the difference between groups. We also recruited 20% more in order to cover all possible missing values might happen. Therefore, 30 subjects per group, 60 in total, were recruited.
Measurements
Pain Intensity
Individuals with CNSLBP were assessed for pain intensity with a 10-centimeter horizontal visual analog scale (VAS) where the left side indicated “no pain” and the right side the “worst pain imaginable”. The individuals with CNSLBP reported their pain intensity on worst movement or activity on the tested day by marking on the VAS.
Disability Level
Individuals with CNSLBP were assessed using the modified Oswestry Disability Questionnaire (MODQ) Thai version.12 The total score of MODQ, Thai version, has been used by summarizing from 10 items; pain intensity, personal care, lifting, walking, sitting, standing, sleeping, social life, traveling, employment/home making, which is categorized into six levels of each item starting from 0 (no disability) to 5 (highest disability) and multiplied by 2 to gain a percentage of disability level. This can imply how pain affects various activities of daily living. The higher percentage represented a greater level of disability defined as follows: 0–20 minimal disability, 21–40 moderate disability, 41–60 severe disability, 61–80 crippled, and 81–100 bed bound or symptom magnifier.
Physical Activity Level
Physical activity level was measured with the Thai physical activity guideline (TPAG)19,20 describing level zero, most sedentary, to level five, most physically active. Those levels were derived from the calculation of energy expenditure based on the total time of physical activity during the last 7 days. The brief explanation is as follows; Level 0: had no moderate-vigorous physical activity, Level 1: had moderate intensity activity ≤150 minutes/week or vigorous intensity activity <75 minutes/week. Level 2: had moderate intensity activity ≥150 minutes/week or vigorous intensity activity ≥75 minutes/week. Level 3: had moderate intensity activity ≥300 minutes/week or vigorous intensity activity ≥150 minutes/week. Level 4: had moderate intensity activity ≥450 minutes/week or vigorous intensity activity ≥225 minutes/week. Level 5: had moderate intensity activity ≥600 minutes/week or vigorous intensity activity ≥300 minutes/week.
Functional Capacity Tests
All subjects had to perform three functional capacity tests: functional reach, five-time sit to stand, and two-minute step, respectively. During the tests, all subjects wore comfortable clothes and canvas shoes for these tests. They were explained the test protocols and observed demonstration, with a question-and-answer session provided if needed.
Using the functional reach test (FRT), the researcher adhered a ruler to the wall at the subject’s shoulder-height level and marked a shoulder-width feet placement sign on the floor. For starting position, the subjects stood sideways next to the wall without leaning against the wall, and flexed both shoulders to 90 degrees with elbows straight, hands fisting and the head of the 3rd metacarpal bone on the ruler was recorded. They were asked to reach forward with arms straight keeping at shoulder level as far as possible without stepping.16,21 They performed three trials, the farthest reach value was used. Figure1A and B demonstrate the starting position and final position of FRT.
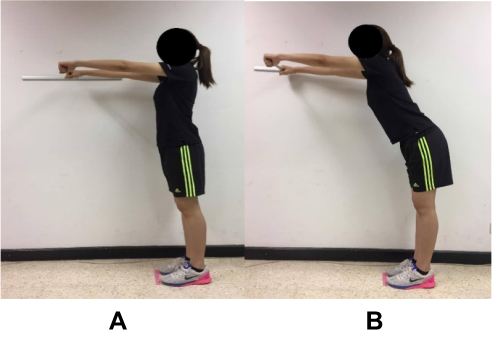 |
Figure 1 (A) Starting position of FRT, (B) Final position of RFT. |
The five-time sit to stand test (5 TSST) involved a chair that was positioned against the wall to secure the test location. For the starting position, the subjects sat in the middle of the chair, back straight without support, feet flat on the floor, and both arms were folded together across the chest (Figure 2A). They were then asked to rise to full stand and return to sitting position as fast as possible five times continuously (Figure 2B). They performed three trials, the shortest time spent to complete the five times was used.17
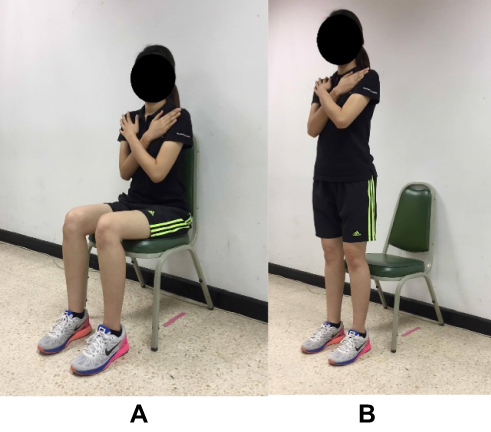 |
Figure 2 (A) Starting position of 5 TSST, (B) Final position of 5 TSST. |
For the two-minute step test (2 MST), the researcher measured the stepping height of each subject, which was equal to the mid-thigh level, halfway between the iliac crest and patella, and marked that level on the wall (Figure 3A). The starting position was standing, the subject was then instructed to step by alternately moving the knee up to the marked level, beginning with the right knee and continuing to step for 2 minutes. The researcher counted the number of times the right knee successfully reached the marked level (Figure 3B). The subject was allowed to place one hand on a table for balance assistance if needed.17 They performed this test only once. However, before data collection, the researcher allowed the subject a short practice.
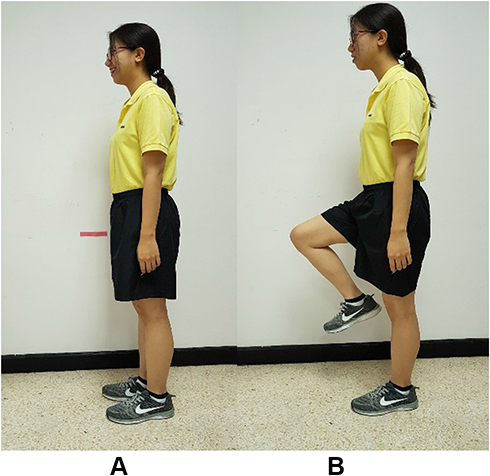 |
Figure 3 (A) Starting position of 2 MST, (B) Final position of 2 MST. |
The rest interval was 2 minutes provided to reduce fatigue between each test. The researcher asked all subjects every time before starting the next tests to reassure that all subjects had no carry-over symptoms. After all tests, the subjects slowly walked for a few minutes to cool down.
Statistical Analysis
The demographic data were presented as mean±standard deviation, or number and percentage of the subjects. Chi-square test and independent t-test were used to compare demographic data in both groups. Shapiro–Wilk test was used to test the normal distribution of the data. As a comparison of functional capacity tests, the independent t-test was used for functional reach since the data were normally distributed, while the Mann–Whitney U-test was used for the five times sit to stand and two-minute step because of non-normal distribution. For the analyses of the demographic data on their influences to all functional capacity tests, a multiple linear regression, stepwise method, was used. Statistical analyses were done with SPSS program version 23 (IBM Corp., Armonk, NY), the statistical significance was set at a P-value less than 0.05.
Results
The demographic data of both groups were similar in gender, age, weight, height, and BMI. However, the significant differences were found in working task and physical activity level between individuals with CNSLBP and healthy individuals. The individuals with CNSLBP had mild-to-moderate pain intensity and minimal disability level. Nearly 50% of healthy individuals had household working, while 56.7% of individuals with CNSLBP had prolonged sitting tasks. The physical activity domain demonstrated a higher level of physical activity in healthy individuals, as shown in Table 1.
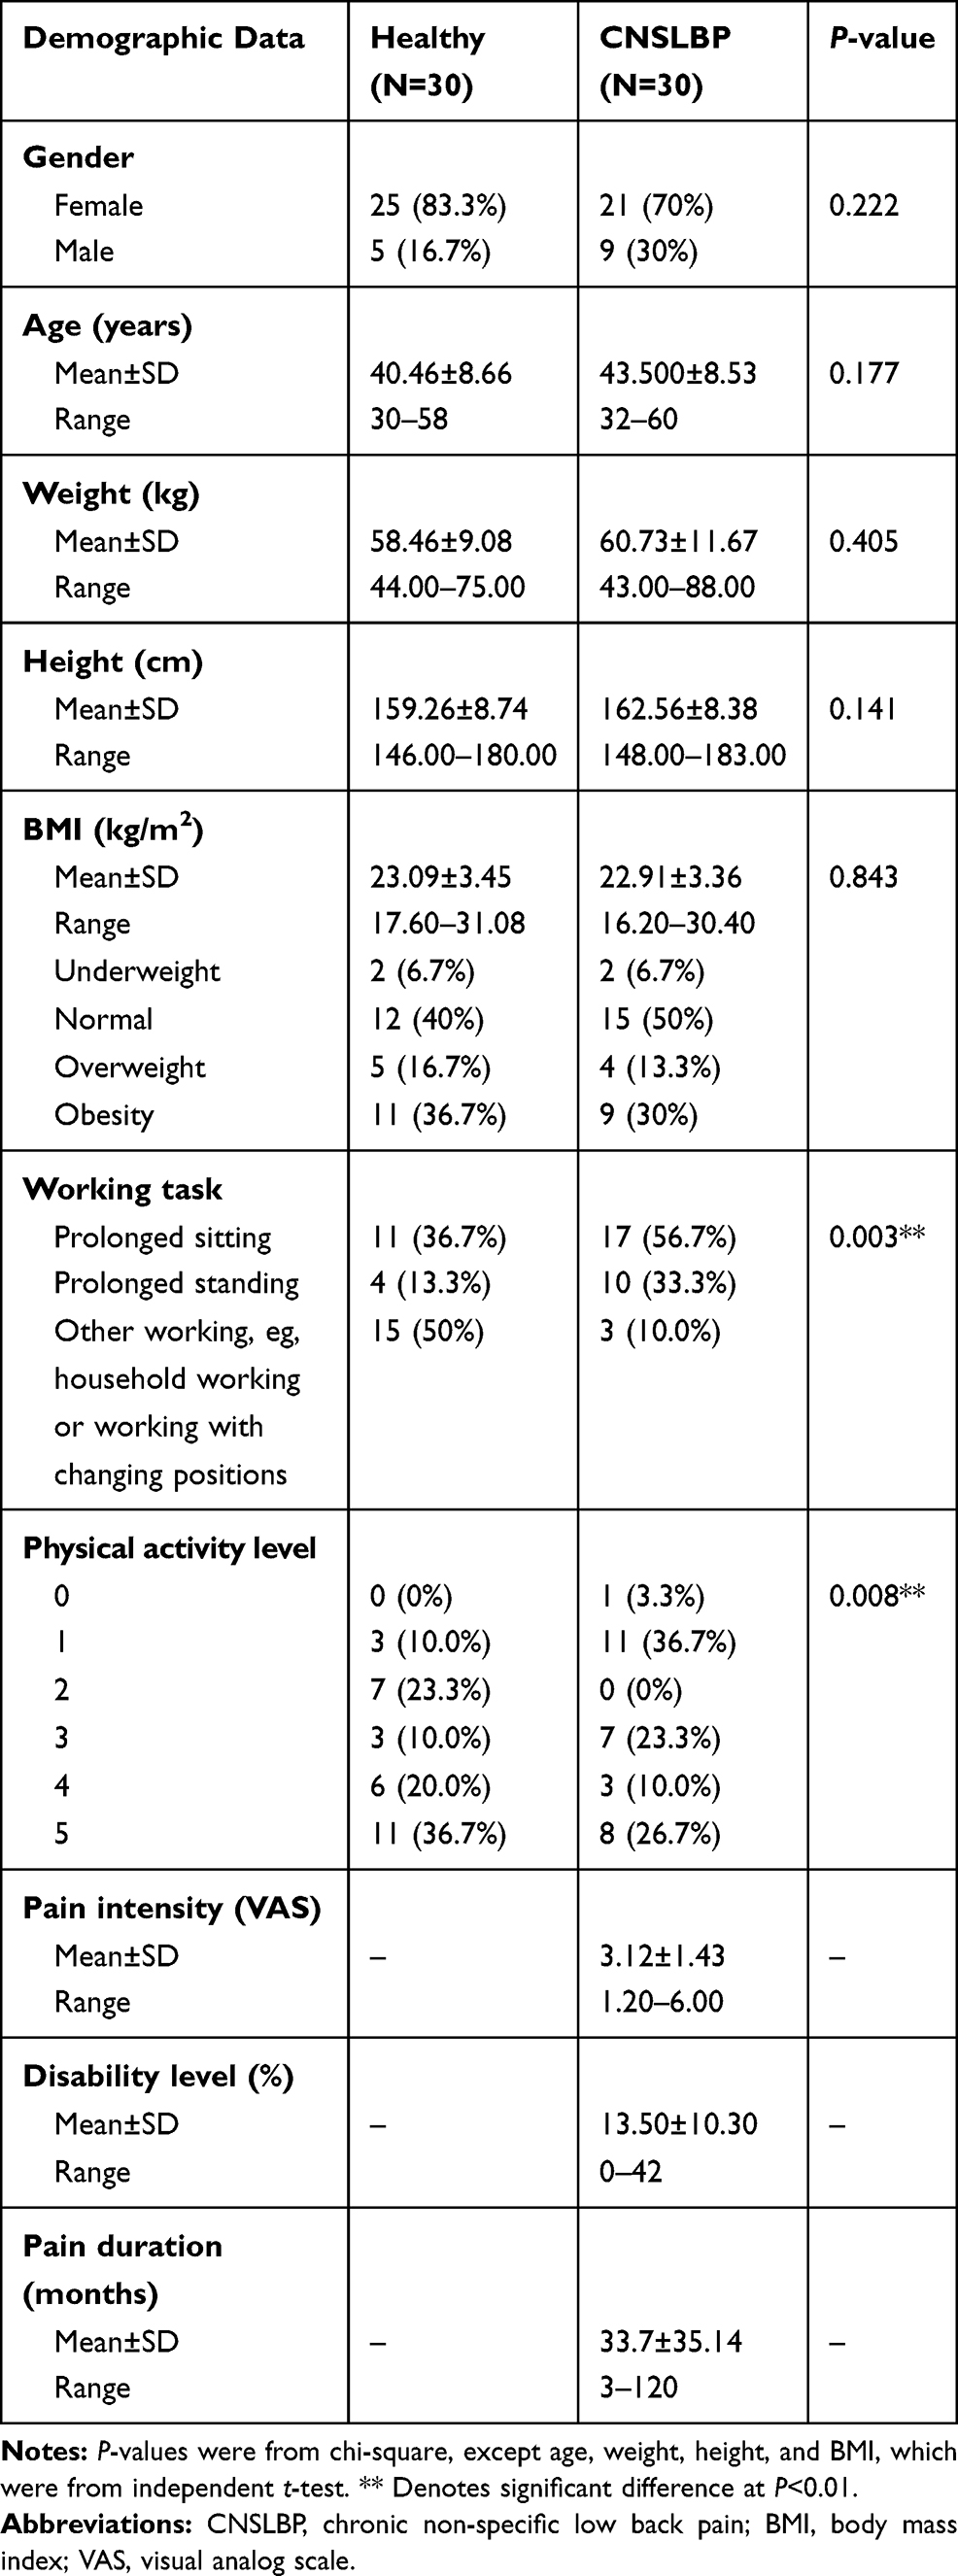 |
Table 1 Demographic Data of the Participants |
The comparison of functional capacity tests between the individuals with CNSLBP and healthy individuals showed significant differences in five-time sit to stand and two-minute step. The mean differences between groups and 95% confidence intervals are also presented in Table 2.
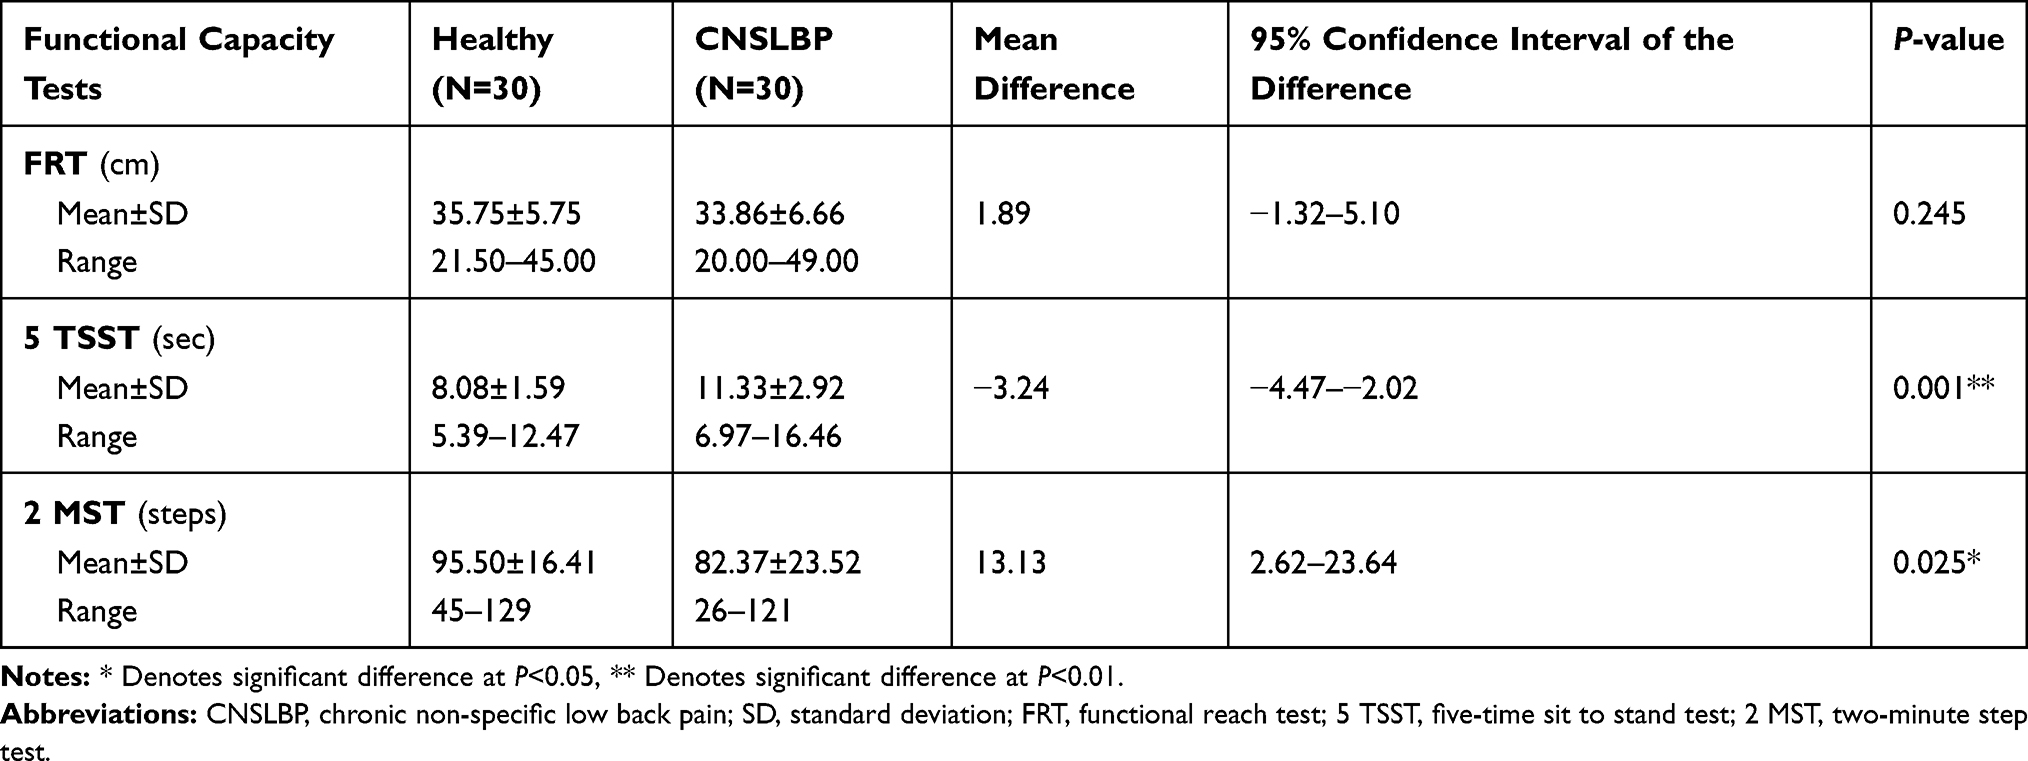 |
Table 2 Functional Capacity Tests Between Healthy and CNSLBP Groups |
For the effects of demographic data, it was found that age significantly influenced the five-time sit to stand (P=0.004) and two-minute step test (P=0.008), while gender (P=0.028) and height (P=0.002) affected on functional reach, as shown in Table 3.
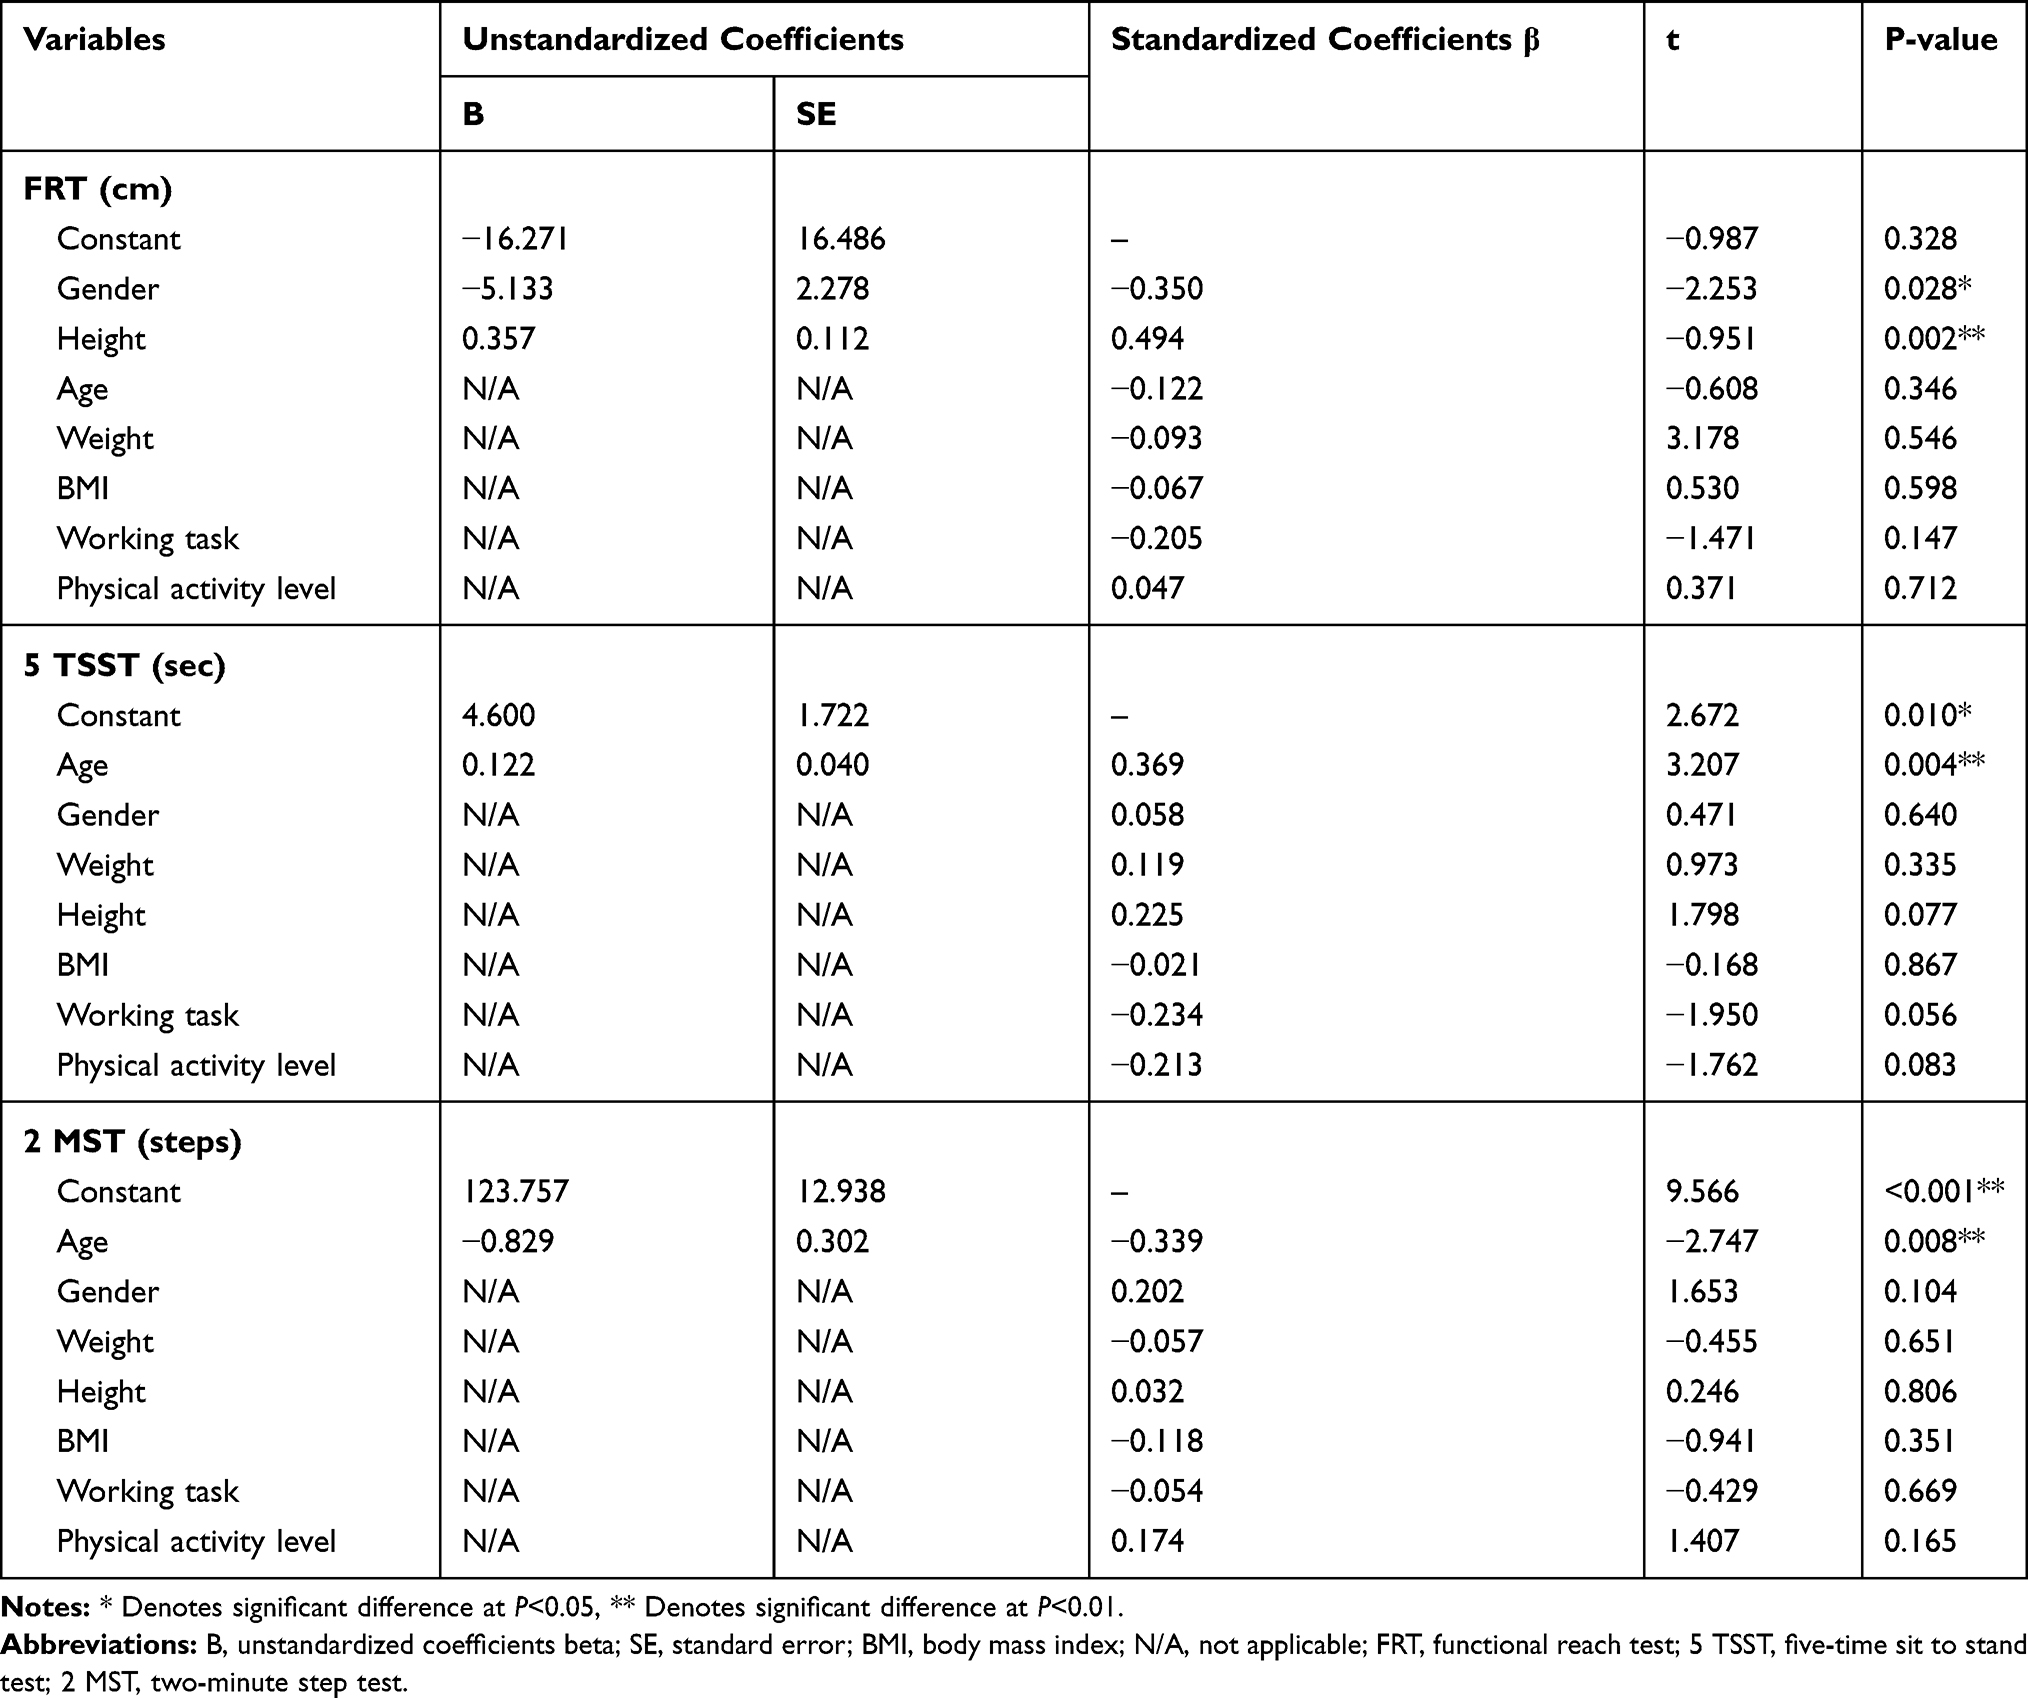 |
Table 3 Multiple Linear Regression Investigating the Effects of Demographic Data on Each Functional Capacity Test in All Participants (N=60) |
Discussion
The first objective of this study was to compare the functional capacity between the individuals with CNSLBP and healthy individuals with three functional capacity tests. We found that the five-time sit to stand and two-minute step tests were significantly worsening in individuals with CNSLBP compared to healthy individuals. This finding corresponds to previous studies done with functional capacity tests or physical performance tests.7,9,10 The lower level of functional capacity in individuals with CNSLBP found in this study might be due to poor trunk motor control as shown by longer time spent in the five-time sit to stand and fewer steps counted in the two-minute step tests. Even though the rest interval provided between tests and the reassurance questions asked to every subject have been done as a standardized method, in this study.
Interestingly, the averaged value from two-minute step in individuals with CNSLBP in this study was 82.37, close to older people aged 80–89 years showing an averaged value of 83.5.17 This result might give us the awareness of worsening of dynamic control and aerobic endurance in individuals with CNSLBP. Smeets et al22 also found a significant lower level of aerobic fitness in LBP patients compared with healthy controls. This finding might reflect the functional capacity impairment in individuals with CNSLBP, which might be due to chronically-compromised fibrosed connective tissue and muscle that leads to pain and movement restriction in CLBP.23 The appropriate interventions should be considered emphasizing the restoration of functional capacity.
In terms of the assessment methods, we encouraged the use of five-time sit to stand and two-minute step for clinical assessment tools since they can differentiate the individuals with CNSLBP from healthy individuals. Also, five-time sit to stand has been proved to be responsive for overtime measurements in chronic LBP patients.24 Time spent for the two tests is about 5 minutes including a 2-minute rest interval between that can be feasible clinically. However, functional reach was not different between two groups. Rudy et al10 found the difference in functional reach between older adults with and without chronic LBP. The indifferent result in this study can be surmised as that this test might not be challenging to the capacity of trunk muscles in individuals with CNSLBP of younger age, in contrast to older adults.10 However, the pattern of reach could be different among individuals, which this study did not investigate, considered as a limitation of this study. Future studies can investigate biomechanical parameters such as trunk and leg angles and angular velocity between the individuals with and without CNSLBP performing of functional reach to deepen the understanding of compensatory patterns, if present, caused by CNSLBP.
Most of the healthy individuals had a higher physical activity level and less in a prolonged sitting working task, while the individuals with CNSLBP had a significantly lower physical activity level and was engaged in prolonged sitting working tasks. These results correspond to the study done by Yiengprugsawan et al,25 who also found a reduction of physical activity in chronic LBP patients. However, other demographic data regarding gender, age, weight, height, and BMI showed no significant difference between the two groups. Although the individuals with CNSLBP in this study had mild-to-moderate pain intensity and minimal disability level, their test results were significantly lower. This results might be due to the contributing factors of physical capacity such as muscle strength, cardiovascular capacity,26, 27 fear of movement,28,29 and pain during movement.30 This study therefore suggests that future studies can investigate the causal effects of those factors on functional capacity in individuals with CNSLBP.
The second objective was to investigate the effects of demographic data on those functional capacity tests. We found that individual’s height and gender have effects on functional reach. A previous study reported that the factors influencing functional reach were height, age, base of support (BOS), and methods of reaching.31 This present study corresponds to the previous study regarding height influencing functional reach. However, the previous study investigated growing children with their increasing age associated with increasing height. Therefore, the effect of age cannot apply to the adults. The previous study did not see the effect of gender, but BOS was significantly wider for men than women,31 which might explain the difference in gender in this study. Additionally, the methods of reach influenced the values of functional reach,31 however, this study used standardized methods of functional reach. Also, the mean height and gender distribution between the two groups in this study were not significantly different.
For the five-time sit to stand and two-minute step tests, only age has an effect on functional capacity, not gender, weight, height, BMI, working task, or physical activity level. Bohannon et al18 found that the five-time sit to stand test had slight correlations with age and BMI. The two-minute step test in this present study corresponds to Rikli and Jones.17 However, the mean age of the two groups was not significantly different in this study.
One of the limitations of this study was that most of the individuals with CNSLBP had a minimal disability, so the finding of this study may not be widely applicable for individuals with CNSLBP, moderate-to-severe disability. Apart from pain and disability, psychosocial factors would influence functional capacity performance. Further research should include the effect of psychosocial factors on functional capacity evaluation for providing better management to the patients.
Conclusion
This study investigated the comparison of functional capacity between the individuals with and without CNSLBP. The result found significant differences in five-time sit to stand and two-minute step tests. Of the demographic data, age significantly affects the five-time sit to stand and two-minute step tests, while gender and height significantly affect functional reach. This finding suggests that the functional capacity should be evaluated in a clinical setting for a better understanding of CNSLBP conditions.
Protocol Reference
Protocol Reference: dx.doi.org/10.17504/protocols.io.bfq6jmze.
Acknowledgments
The authors would like to express the gratitude to all participants in this study, both the patients who came to the Physical Therapy Center, Faculty of Physical Therapy, Mahidol University and healthy individuals who contributed to this study.
Disclosure
The authors declare no conflicts of interest in this study. This study received no research funding.
References
1. Bardin L, King P, Maher C. Diagnostic triage for low back pain: a practical approach for primary care. Med J Aust. 2017;206(6):268–273. doi:10.5694/mja16.00828
2. Maher C, Underwood M, Buchbinder R. Non-specific low back pain. Lancet. 2017;389(10070):736–747. doi:10.1016/S0140-6736(16)30970-9
3. Rozenberg S. Chronic low back pain: definition and treatment. Rev Prat. 2008;58(3):265–272.
4. Chou R. Low back pain (chronic). Am Fam Phys. 2011;84(4):437–438.
5. Patrick N, Emanski E, Knaub M. Acute and chronic low back pain. Med Clin North Am. 2014;98(4):777–789. doi:10.1016/j.mcna.2014.03.005
6. Hartvigsen J, Hancock M, Kongsted A, et al. What low back pain is and why we need to pay attention. Lancet. 2018;391(10137):2356–2367. doi:10.1016/S0140-6736(18)30480-X
7. Simmonds MJ, Olson SL, Jones S, et al. Psychometric characteristics and clinical usefulness of physical performance tests in patients with low back pain. Spine. 1998;23(22):2412–2421. doi:10.1097/00007632-199811150-00011
8. Strand L, Moe-Nilssen R, Ljunggren A. Back performance scale for the assessment of mobility related activities in people with back pain. Phys Ther. 2002;82:1213–1223. doi:10.1093/ptj/82.12.1213
9. Pfingsten M, Lueder S, Luedtke K, Petzke F, Hildebrandt J. Significance of physical performance tests for patients with low back pain. Pain Med. 2014;15(7):1211–1221. doi:10.1111/pme.12482
10. Rudy TE, Weiner DK, Lieber SJ, Slaboda J, Boston JR. The impact of chronic low back pain on older adults: a comparative study of patients and controls. Pain. 2007;131(3):293–301. doi:10.1016/j.pain.2007.01.012
11. Oesch P, Meyer K, Jansen B, Kool J. Functional capacity evaluation: performance of patients with chronic non-specific low back pain without Waddell signs. J Occup Rehabil. 2015;25(2):257–266. doi:10.1007/s10926-014-9533-6
12. Sakulsriprasert P, Vachalathiti R, Vongsirinavarat M, Kantasorn J. Cross-cultural adaptation of modified Oswestry low back pain disability questionnaire to Thai and its reliability. J Med Assoc Thai. 2006;89(10):1694–1701.
13. Roy S, De Luca C, Casavant D. Lumbar muscle fatigue and chronic lower back pain. Spine. 1989;14(9):992–1001. doi:10.1097/00007632-198909000-00014
14. Chang W, Lin H, Lai P. Core strength training for patients with chronic low back pain. J Phys Ther Sci. 2015;27(3):619–622. doi:10.1589/jpts.27.619
15. Lamoth C, Meijer O, Daffertshofer A, Wuisman P, Beek P. Effects of chronic low back pain on trunk coordination and back muscle activity during walking: changes in motor control. Eur Spine J. 2006;15(1):23–40. doi:10.1007/s00586-004-0825-y
16. Duncan PW, Weiner DK, Chandler J, Studenski S. Functional reach: a new clinical measure of balance. J Gerontol. 1990;45(6):M192–M197. doi:10.1093/geronj/45.6.M192
17. Rikli RE, Jones CJ. Development and validation of a functional fitness test for community-residing older adults. J Aging Phys Act. 1999;7(2):129–161. doi:10.1123/japa.7.2.129
18. Bohannona R, Shovea M, Barrecab S, Mastersd L, Sigouinc C. Five-repetition sit-to-stand test performance by community-dwelling adults: a preliminary investigation of times, determinants, and relationship with self-reported physical performance. Isokinet Exerc Sci. 2007;15:77–81. doi:10.3233/IES-2007-0253
19. Jalayondeja C, Jalayondeja W, Vachalathiti R, et al. Cross-cultural adaptation of the compendium of physical activity: thai translation and content validity. J Med Assoc Thai. 2015;98(Suppl 5):S53–S59.
20. Jalayondeja C, Jalayondeja W, Bovonsunthonchai S, Kaewkhuntee W, Bunprajun T. Thai Physical Activity Guideline (TPAG): A Manual of Physical Activity Promotion in Community.
21. Duncan PW, Studenski S, Chandler J, Prescott B. Functional reach: predictive validity in a sample of elderly male veterans. J Gerontol. 1992;47(3):M93–M98. doi:10.1093/geronj/47.3.M93
22. Smeets RJ, Wittink H, Hidding A, Knottnerus J. Do patients with chronic low back pain have a lower level of aerobic fitness than healthy controls?: are pain, disability, fear of injury, working status, or level of leisure time activity associated with the difference in aerobic fitness level? Spine. 2006;31(1):90–97. doi:10.1097/01.brs.0000192641.22003.83
23. Langevin H, Sherman K. Pathophysiological model for chronic low back pain integrating connective tissue and nervous system mechanisms. Med Hypotheses. 2006;68(1):74–80. doi:10.1016/j.mehy.2006.06.033
24. Sakulsriprasert P, Vachalathiti R, Kingcha P. Responsiveness of pain, functional capacity tests, and disability level in individuals with chronic nonspecific low back pain. Hong Kong Physiother J. 2020;40(1):11–17. doi:10.1142/S101370252050002X
25. Yiengprugsawan V, Hoy D, Buchbinder R, Bain C, Seubsman S-A, Sleigh AC. Low back pain and limitations of daily living in Asia: longitudinal findings in the Thai cohort study. BMC Musculoskelet Disord. 2017;18(1):19. doi:10.1186/s12891-016-1380-5
26. Simmonds M. Physical function and physical performance in patients with pain: what are the measures and what are do they mean? Pain 1999. 1999.
27. Matheson LN, Leggett S, Mooney V, Schneider K, Mayer J. The contribution of aerobic fitness and back strength to lift capacity. Spine. 2002;27(11):1208–1212. doi:10.1097/00007632-200206010-00013
28. Crombez G, Vlaeyen JW, Heuts PH, Lysens R. Pain-related fear is more disabling than pain itself: evidence on the role of pain-related fear in chronic back pain disability. Pain. 1999;80(1–2):329–339. doi:10.1016/S0304-3959(98)00229-2
29. Vlaeyen J, Kole-Snijders AM, Boeren RG, Van Eek H. Fear of movement/(re) injury in chronic low back pain and its relation to behavioral performance. Pain. 1995;62(3):363–372. doi:10.1016/0304-3959(94)00279-N
30. Smeets RJ, Van Geel AC, Kester AD, André Knottnerus J. Physical capacity tasks in chronic low back pain: what is the contributing role of cardiovascular capacity, pain and psychological factors? Disabil Rehabil. 2007;29(7):577–586. doi:10.1080/09638280600925829
31. Volkman K, Stergiou N, Stuberg W, Blanke D, Stoner J. Factors affecting functional reach scores in youth with typical development. Pediatr Phys Ther. 2010;21(1):38–44. doi:10.1097/PEP.0b013e318196f68a
 © 2020 The Author(s). This work is published and licensed by Dove Medical Press Limited. The full terms of this license are available at https://www.dovepress.com/terms.php and incorporate the Creative Commons Attribution - Non Commercial (unported, v3.0) License.
By accessing the work you hereby accept the Terms. Non-commercial uses of the work are permitted without any further permission from Dove Medical Press Limited, provided the work is properly attributed. For permission for commercial use of this work, please see paragraphs 4.2 and 5 of our Terms.
© 2020 The Author(s). This work is published and licensed by Dove Medical Press Limited. The full terms of this license are available at https://www.dovepress.com/terms.php and incorporate the Creative Commons Attribution - Non Commercial (unported, v3.0) License.
By accessing the work you hereby accept the Terms. Non-commercial uses of the work are permitted without any further permission from Dove Medical Press Limited, provided the work is properly attributed. For permission for commercial use of this work, please see paragraphs 4.2 and 5 of our Terms.