")
Back to Journals » International Medical Case Reports Journal » Volume 10
Decrease of the foveal avascular zone area after internal limiting membrane peeling: single case study
Authors Kumagai K, Uemura A, Furukawa M, Suetsugu T , Ogino N
Received 1 December 2016
Accepted for publication 21 February 2017
Published 8 March 2017 Volume 2017:10 Pages 81—85
DOI https://doi.org/10.2147/IMCRJ.S129174
Checked for plagiarism Yes
Review by Single anonymous peer review
Peer reviewer comments 3
Editor who approved publication: Dr Scott Fraser
Kazuyuki Kumagai,1 Akinori Uemura,2 Mariko Furukawa,1 Tetsuyuki Suetsugu,1 Nobuchika Ogino3
1Department of Ophthalmology, Kami-iida Daiichi General Hospital, Aichi, 2Department of Ophthalmology, Kagoshima City Hospital, Kagoshima, 3Department of Ophthalmology, Nishigaki Eye Clinic, Aichi, Japan
Purpose: To report a patient whose foveal avascular zone (FAZ) decreased after vitrectomy with internal limiting membrane (ILM) peeling.
Methods: A 58-year-old woman underwent successful phacovitrectomy with ILM peeling for a thin epiretinal membrane in an eye with a normal foveal contour. Optical coherence tomography angiographic en face images of the 3 mm×3 mm superficial and deep inner retinal vascular plexuses were examined preoperatively, and on days 1, 2, 9, and 37 postoperatively. The changes in the FAZ areas and the thicknesses of the parafoveal retinal layers at 500 μm from the foveal center were assessed in the vertical and horizontal B-scan images.
Results: The areas of the superficial and deep FAZ decreased after the surgery. The course of the postoperative decrease of the FAZ area in the superficial plexus can be fit by a hyperbolic curve (R2=0.993). An increase in the thicknesses of the retinal nerve fiber layer, ganglion cell–inner plexiform layer, and inner nuclear layer was observed at all times postoperatively.
Conclusions: We observed one case that the FAZ area decreased and the parafoveal inner retinal thickness increased after the vitrectomy with ILM peeling. The decrease in the FAZ area suggests that a centripetal movement of the inner retinal layer is probably due to the ILM peeling.
Keywords: internal limiting membrane, optical coherence tomography angiography, foveal avascular zone
Introduction
The foveal avascular zone (FAZ) is a capillary-free area bordered by the foveal capillaries running in the inner retinal layers. Optical coherence tomography angiography (OCTA) was recently introduced as a noninvasive method that can obtain en face images of both the superficial and deep capillary plexuses.1
The size of the FAZ area is correlated with the sex,2 age,2–6 and foveal thickness.5–6,7–11 However, the effect of internal limiting membrane (ILM) peeling on the FAZ area has not been well determined. Thus, the purpose of this study was to determine the effect of vitrectomy with ILM peeling on the size of the FAZ. To accomplish this, we performed vitrectomy with ILM peeling on an eye with a thin epiretinal membrane (ERM) and a normal foveal contour. The OCTA en face images of the superficial and deep retinal vascular plexuses were examined preoperatively, and at days 1, 2, 9, and 37 postoperatively.
Case report
A 58-year-old woman presented with a slight decrease in vision in her right eye (20/25) of 1 year duration. Ophthalmoscopy showed that she had a thin ERM over the fovea. The patient underwent phacoemulsification, intraocular lens implantation followed by vitrectomy, ERM peeling, and brilliant blue G-assisted ILM peeling within the vascular arcade. After the surgery, her visual acuity improved to 20/20 at day 37 postoperatively. The patient did not have systemic risk factors such as diabetes mellitus or uncontrolled hypertension that could affect the retinal morphology. Also, she did not have ocular diseases such as myopia, glaucoma, and age-related macular degeneration that could affect retinal morphology except for a thin ERM.
The patient has signed a written informed consent for the case report and any accompanying images to be published.
The sequential changes of the foveal morphology were determined by swept-source optical coherence tomography (SS-OCT) with the DRI OCT-1 instrument (Topcon, Atlantis, Tokyo, Japan). The scans were performed with the angioretina mode to obtain 3 mm×3 mm en face images of the superficial and deep vascular plexuses. The retinal surface maps were reconstructed from the three-dimensional cube scans. The FAZ area was measured by manual delineation with the ImageJ software (National Institutes of Health, ImageJ, Bethesda, MD, USA).
The vertical and horizontal B-scan images through the foveal center were analyzed to determine the thicknesses of the retinal nerve fiber layer (RNFL), ganglion cell-inner plexiform layer (GCIPL), inner nuclear layer (INL), outer plexiform layer, and outer nuclear layer. Manual measurements were made of the horizontal and vertical lines at 500 μm from the foveal center.
The sequential retinal surface maps and the OCTA images showing the FAZ in the superficial and deep plexuses at each time are shown in Figure 1. The surface maps showed an increase of the parafoveal thickness up to day 9 postoperatively, and then only a slight decrease in the thickness at day 37.
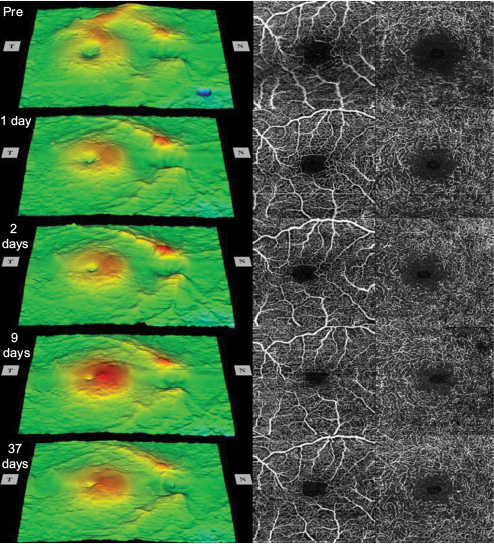 | Figure 1 Sequential retinal surface maps (left) and the optical coherence tomography angiography images showing the foveal avascular zone in the superficial (center) and deep (right) plexuses at each visit pre- and postoperatively. |
Analyses of the changes in the superficial plexuses showed that the postoperative decrease of the FAZ area can be fit by a hyperbolic curve (Figure 2; R2=0.993). The area of the FAZ of the superficial plexus was 0.336 mm2 preoperatively, and 0.285 mm2 on day 1, 0.262 mm2 on day 2, 0.212 mm2 on day 9, and 0.209 mm2 on day 37. The area of the FAZ in the normal fellow eye was 0.378 mm2. The OCTA images of the superficial and deep plexuses and the horizontal cross-sectional SS-OCT image of the normal fellow eye are shown in Figure 3.
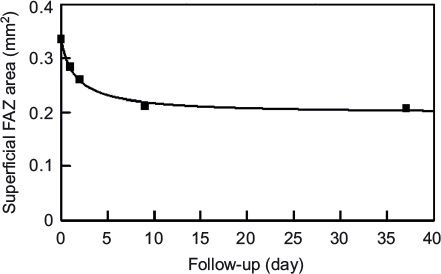 | Figure 2 Postoperative decrease of the FAZ area in the superficial plexus can be fit by a hyperbolic function of y=0.336−0.138*x/(1.634+x). Note: R2=0.993. Abbreviation: FAZ, foveal avascular zone. |
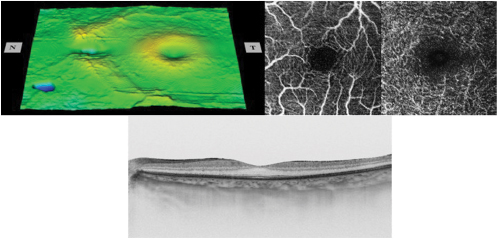 | Figure 3 The retinal surface map (top left), optical coherence tomography angiography images showing foveal avascular zone in the superficial and deep plexuses (top right), and horizontal cross-sectional swept-source optical coherence tomography image (bottom) of the normal fellow eye. |
The sequential horizontal cross-sectional SS-OCT images during the follow-up period are shown in Figure 4. The preoperative OCT image showed that the foveal contour was normal. After the surgery, the parafoveal thickness was increased, and the foveal contour became steeper.
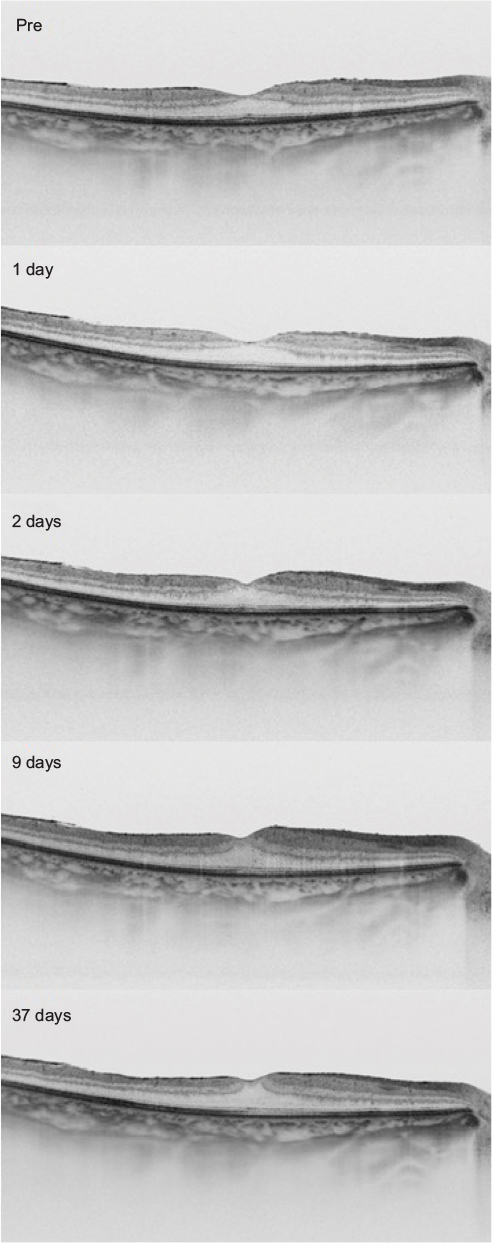 | Figure 4 The horizontal cross-sectional swept-source optical coherence tomography images at each visit. Note: Preoperative image with a thin epiretinal membrane is shown at the top, then the images 1 day, 2 days, 9 days, and 37 days after the surgery are shown sequentially to the bottom. |
The thicknesses of the different retinal layers preoperatively and at day 37 postoperatively determined by the horizontal (top) and vertical lines (bottom) at 500 μm from the foveal center are shown in Figure 5. The thicknesses of the RNFL, GCIPL, and INL were increased postoperatively.
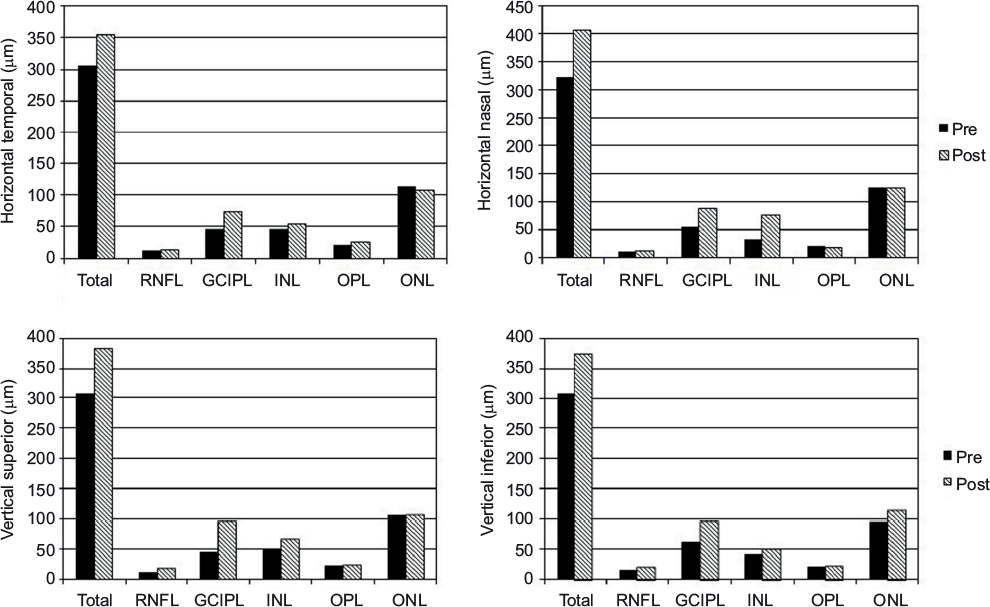 | Figure 5 The preoperative and the day 37 postoperative layer-by-layer retinal thicknesses in the horizontal (top) and vertical lines (bottom) at 500 μm from the foveal center. Notes: The measurements on temporal, nasal, superior, and inferior points are shown. Abbreviations: GCIPL, ganglion cell–inner plexiform layer; INL, inner nuclear layer; ONL, outer nuclear layer; OPL, outer plexiform layer; RNFL, retinal nerve fiber layer. |
Discussion
We presented a case in which the FAZ area decreased and the parafoveal inner retina thickness increased after the vitrectomy with ILM peeling on an eye with a thin ERM and a normal foveal contour. There are three possible causes for the decrease of the FAZ area.
First, the release of the traction by the ERM may have caused the decrease. The preoperative surface maps showed that the parafoveal region was thicker in the affected eye than in the normal fellow eye although the foveal contour was normal. In addition, the FAZ area of the affected eye was similar in size with that of the normal fellow eye. It is possible that the thin ERM had influenced the parafoveal thickness, but the FAZ size and the foveal center thickness were unaffected. Thus, it seems unlikely that the release of the traction caused the decrease in the FAZ size.
Second, a growth of the capillaries toward the foveal center may have occurred after the ILM peeling. During the development of the human retina, the area of the FAZ is demarcated before the foveal pit forms. The FAZ is first observed at 26 weeks of gestation, and no vessel overgrowth is observed until birth. The FAZ area expands to the adult size of 500–700 µm at 15 months after birth as the foveal pit widens by remodeling.12 No vessel overgrowth is observed during this process. It is less likely that an extension of the capillaries inside the FAZ occurs postnatally even after surgical procedures.
Third, the surgical procedures, ie, the vitrectomy and the ILM peeling, may have caused the FAZ area to decrease in size. Although it is difficult to distinguish the effects of each procedure, the surgical procedures may be partly responsible for the FAZ area decrease. The increase in the parafoveal inner retinal thicknesses may be due to a transient subclinical macular edema resulting from the ILM peeling.
The ILM peeling may cause a centripetal movement of the parafoveal inner retinal layer. The foveal capillaries run in the inner retinal layers, and the capillary network at the foveal margin forms the FAZ border. The capillary network delineating the FAZ border may have moved centripetally along with the inner retinal layers. This suggestion may also help explain the postoperative increase in the parafoveal thickness.
An inner retinal movement toward the foveal center would lead to a reduction in the FAZ area and cause more retinal cells to be packed in the parafoveal regions leading to an increase of the retinal thickness. In fact, the smaller FAZ area has been reported in other studies to be associated with an increase in the foveal thickness.5–6,7–11 Also, an increase in the central macular thicknesses has been reported after ILM peeling in eyes treated for several macular diseases.13–18
One question raised from this possibility is why there is a centripetal retinal movement after ILM peeling. The ILM may have some intrinsic forces stretching the retina centrifugally, and the removal of ILM may eliminate such forces leading to a centripetal movement. Additional studies need to be performed to determine why this occurs.
The structural changes to the Mueller cells may be a key factor influencing the inner retinal movement. The Mueller cells extend vertically for the full thickness of the retina, except for the foveal center, and they stretch eccentrically from the foveal center to the parafoveal region.19 The footplates of the Mueller cells form the ILM. Thus, the structural changes in the Mueller cells after ILM peeling may be involved in the retinal movement.
The study has several limitations. First, the findings were made on only one eye. Thus, the examinations of a larger number of patients are needed. Second, longer follow-up periods and further studies are needed to determine the effects on the functional outcomes.
In conclusion, we observed a single case where FAZ area decreased after vitrectomy with ILM peeling. It may indicate that surgery can affect the morphology of the inner retina. However, the exact mechanisms causing these changes were not determined from the results of this single case. Our findings demonstrate the ability of OCTA in providing en face images that can be used to analyze the changes in the inner retinal area including the FAZ. Further studies are needed to determine the underlying mechanisms for the retinal movements.
Acknowledgment
We thank Professor Emeritus Duco Hamasaki of the Bascom Palmer Eye Institute of the University of Miami, FL, for discussions and editing of this manuscript.
Disclosure
The authors report no conflicts of interest in this work.
References
Spaide RF, Klancnik JM Jr, Cooney MJ. Retinal vascular layers imaged by fluorescein angiography and optical coherence tomography angiography. JAMA Ophthalmol. 2015;133(1):45–50. | ||
Yu J, Jiang C, Wang X, et al. Macular perfusion in healthy Chinese: an optical coherence tomography angiogram study. Invest Ophthalmol Vis Sci. 2015;56(5):3212–3217. | ||
Laatikainen L, Larinkari J. Capillary-free area of the fovea with advancing age. Invest Ophthalmol Vis Sci. 1977;16(12):1154–1157. | ||
Grunwald JE, Piltz J, Patel N, Bose S, Riva CE. Effect of aging on retinal macular microcirculation: a blue field simulation study. Invest Ophthalmol Vis Sci. 1993;34(13):3609–3613. | ||
Gong D, Zou X, Zhang X, Yu W, Qu Y, Dong F. The influence of age and central foveal thickness on foveal zone size in healthy people. Ophthalmic Surg Lasers Imaging Retina. 2016;47(2):142–148. | ||
Samara WA, Say EA, Khoo CT, et al. Correlation of foveal avascular zone size with foveal morphology in normal eyes using optical coherence tomography angiography. Retina. 2015;35(11):2188–2195. | ||
Tick S, Rossant F, Ghorbel I, et al. Foveal shape and structure in a normal population. Invest Ophthalmol Vis Sci. 2011;52(8):5105–5110. | ||
Dubis AM, Hansen BR, Cooper RF, Beringer J, Dubra A, Carroll J. Relationship between the foveal avascular zone and foveal pit morphology. Invest Ophthalmol Vis Sci. 2012;53(3):1628–1636. | ||
Chui TY, Zhong Z, Song H, Burns SA. Foveal avascular zone and its relationship to foveal pit shape. Optom Vis Sci. 2012;89(5):602–610. | ||
Chui TY, VanNasdale DA, Elsner AE, Burns SA. The association between the foveal avascular zone and retinal thickness. Invest Ophthalmol Vis Sci. 2014;55(10):6870–6877. | ||
Balaratnasingam C, Chae B, Remmer MH, et al. The spatial profile of macular pigments is related to the topological characteristics of the foveal avascular zone. Invest Ophthalmol Vis Sci. 2015;56(13):7859–7865. | ||
Provis JM, Hendrickson AE. The foveal avascular region of developing human retina. Arch Ophthalmol. 2008;126(4):507–511. | ||
Christensen UC, Krøyer K, Sander B, Jorgensen TM, Larsen M, la Cour M. Macular morphology and visual acuity after macular hole surgery with or without internal limiting membrane peeling. Br J Ophthalmol. 2010;94(1):41–47. | ||
Lee JW, Kim IT. Outcomes of idiopathic macular epiretinal membrane removal with and without internal limiting membrane peeling: a comparative study. Jpn J Ophthalmol. 2010;54(2):129–134. | ||
Kumagai K, Furukawa M, Ogino N, Larson E. Possible effects of internal limiting membrane peeling in vitrectomy for macular vein occlusion. Jpn J Ophthalmol. 2010;54(1):61–65. | ||
Kumagai K, Ogino N, Furukawa M, et al. Retinal thickness after vitrectomy and internal limiting membrane peeling for macular hole and epiretinal membrane. Clin Ophthalmol. 2012;6:679–688. | ||
Chang S. Controversies regarding internal limiting membrane peeling in idiopathic epiretinal membrane and macular hole. Retina. 2012;32 Suppl 2:S200–S203; discussion S203–S204. | ||
Purtskhvanidze K, Treumer F, Junge O, Hedderich J, Roider J Hillenkamp J. The long-term course of functional and anatomical recovery after macular hole surgery. Invest Ophthalmol Vis Sci. 2013;54(7):4882–4891. | ||
Spaide RF. Closure of an outer lamellar macular hole by vitrectomy: hypothesis for one mechanism of macular hole formation. Retina. 2000;20(6):587–590. |
 © 2017 The Author(s). This work is published and licensed by Dove Medical Press Limited. The full terms of this license are available at https://www.dovepress.com/terms.php and incorporate the Creative Commons Attribution - Non Commercial (unported, v3.0) License.
By accessing the work you hereby accept the Terms. Non-commercial uses of the work are permitted without any further permission from Dove Medical Press Limited, provided the work is properly attributed. For permission for commercial use of this work, please see paragraphs 4.2 and 5 of our Terms.
© 2017 The Author(s). This work is published and licensed by Dove Medical Press Limited. The full terms of this license are available at https://www.dovepress.com/terms.php and incorporate the Creative Commons Attribution - Non Commercial (unported, v3.0) License.
By accessing the work you hereby accept the Terms. Non-commercial uses of the work are permitted without any further permission from Dove Medical Press Limited, provided the work is properly attributed. For permission for commercial use of this work, please see paragraphs 4.2 and 5 of our Terms.