")
Back to Journals » International Journal of Nanomedicine » Volume 18
D-Optimal Design and Development of a Koumine-Loaded Microemulsion for Rheumatoid Arthritis Treatment: In vivo and in vitro Evaluation
Authors Hu Q, Fu XL, Dong YY, Ma J, Hua J, Li JT, Liu KX, Yang J, Yu CX
Received 1 February 2023
Accepted for publication 15 May 2023
Published 5 June 2023 Volume 2023:18 Pages 2973—2988
DOI https://doi.org/10.2147/IJN.S406641
Checked for plagiarism Yes
Review by Single anonymous peer review
Peer reviewer comments 2
Editor who approved publication: Dr Yan Shen
Qing Hu,1,2,* Xiao-Ling Fu,1,* Yi-Yan Dong,1,2 Ju Ma,1 Jian Hua,1 Jia-Ting Li,1 Kai-Xin Liu,1 Jian Yang,1,2 Chang-Xi Yu1,2
1School of Pharmacy, Fujian Medical University, Fuzhou, People’s Republic of China; 2Fujian Key Laboratory of Drug Target Discovery and Structural and Functional Research, School of Pharmacy, Fujian Medical University, Fuzhou, People’s Republic of China
*These authors contributed equally to this work
Correspondence: Chang-Xi Yu; Jian Yang, School of Pharmacy, Fujian Medical University, No. 1 Xuefu North Road, Fuzhou, 350122, People’s Republic of China, Tel +86-0591-22862016, Email [email protected]; [email protected]
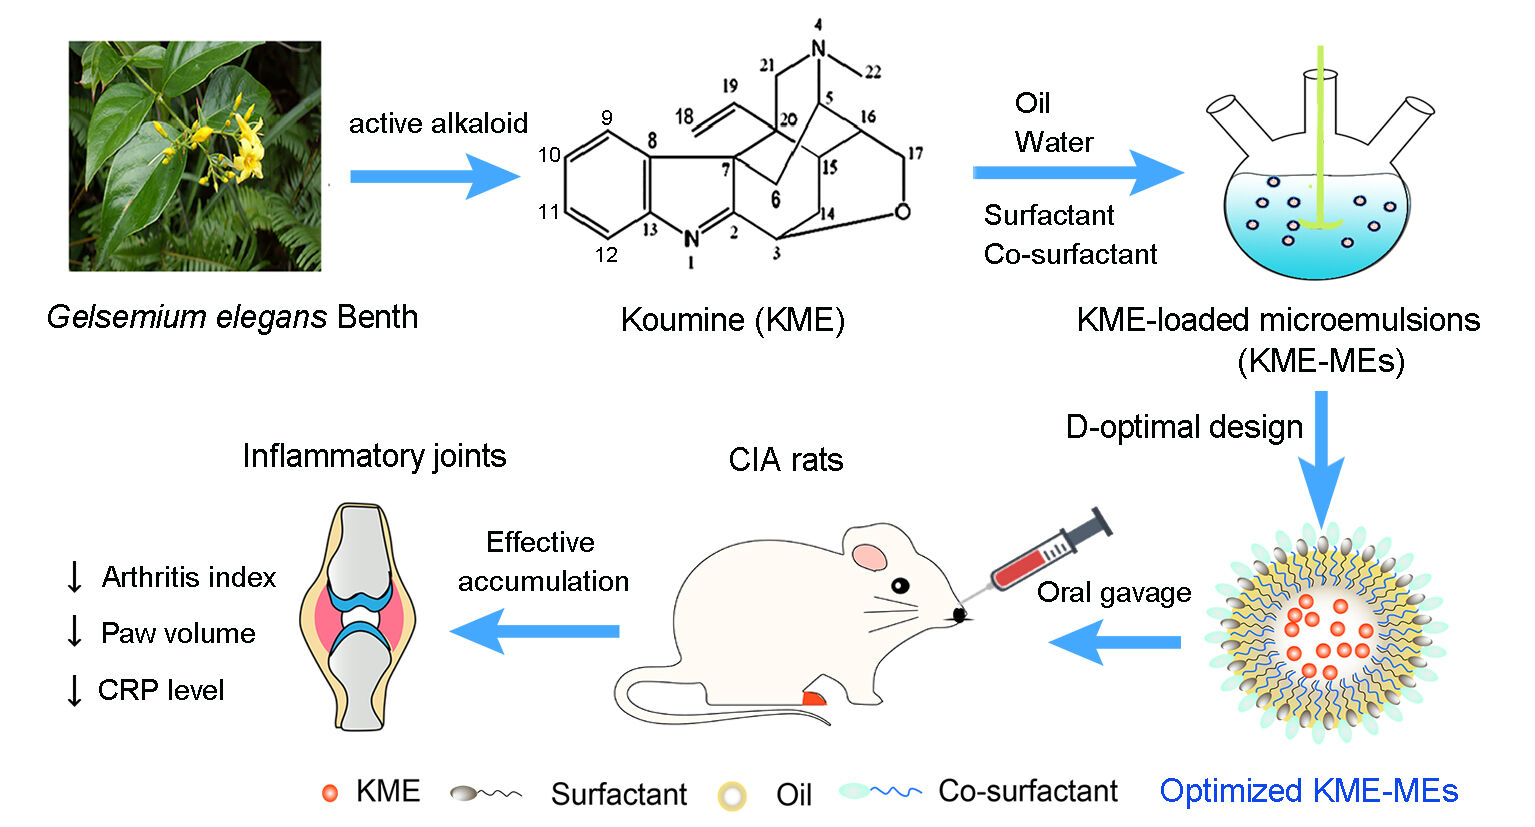
Introduction: Koumine (KME) is the most abundant active ingredient separated from Gelsemium elegans Benth and exhibits a significant therapeutic effect on rheumatoid arthritis (RA). It is a lipophilic compound with poor aqueous solubility, and there is an urgent need to develop novel dosage forms of KME and promote its clinical application for the treatment of RA. The aim of this study was to design and develop KME-loaded microemulsions (KME-MEs) for the effective management of RA.
Methods: The composition of the microemulsion was selected by carrying out a solubility study and generating pseudoternary phase diagrams, and further optimized by D-Optimal design. The optimized KME-MEs was evaluated for particle size, viscosity, drug release, storage stability, cytotoxicity, cellular uptake, Caco-2 cell transport and everted gut sac investigations. In vivo fluorescence imaging and the therapeutic effects of KME and KME-MEs on collagen-induced arthritis (CIA) rats were also evaluated.
Results: The optimized microemulsion contained 8% oil, 32% Smix (surfactant/cosurfactant) and 60% water and was used for in vivo and in vitro studies. The optimal KME-MEs exhibited a small globule size of 18.5 ± 0.14 nm and good stability over 3 months, and the release kinetics followed a first-order model. These KME-MEs had no toxic effect on Caco-2 cells but were efficiently internalized into the cytoplasm. Compared to KME, the KME-MEs displayed significantly increased permeability and absorption in Caco-2 cell monolayer assay and ex vivo everted gut sac experiment. As expected, the KME-MEs attenuated the progression of RA in CIA rats and were more effective than free KME with a reduced frequency of administration.
Conclusion: The KME-MEs improved the solubility and therapeutic efficacy of KME by employing formulation technology. These results provide a promising vehicle for the oral delivery of KME to treat RA and have attractive potential for clinical translation.
Keywords: rheumatoid arthritis, koumine, microemulsion, permeability, oral administration
Graphical Abstract:
Introduction
Rheumatoid arthritis (RA) is one of the most common chronic, complex, and heterogeneous autoimmune diseases that is characterized by symmetric polyarthritis and synovial hypertrophy and often results in joint damage, bone and cartilage destruction, and even deformities.1 In Chinese populations, the prevalence of RA is 0.28%~0.41%, and the total number of patients is nearly 5 million. It has been reported that 80% of RA patients have incomplete disability, which seriously affects their quality of life and life expectancy. In general, RA patients are thought to have a shorter life expectancy of 10 to 15 years.2 The pathogenesis of RA is not fully understood, and current RA medications include non-steroidal anti-inflammatory drugs (NSAIDs), disease-modifying anti-rheumatic drugs (DMARDs), biologics, JAK inhibitors and steroidal medications.3 RA treatments have been continuously developed, with the discovery of new target strategies, new pathways, and new cells and molecules.4,5 However, even after such encouraging developments, the treatment of RA remains one of the most critical challenges due to the possibility of adverse reactions, and some patients may not respond to treatment. The development of novel RA drugs is therefore imperative, and scientists are exploring new strategies to achieve this aim through various innovative approaches.
Gelsemium elegans Benth (G. elegans) is a highly poisonous plant that belongs to the family Loganiaceae and genus Gelsemium. It is native to Southeast Asia and is found in Southeast China, India and Indonesia.6 Until now, a total of 121 alkaloids have been found in G. elegans, among which koumine (KME) is the most abundant alkaloid, and has various biological effects including anti-inflammatory, analgesic, antitumor and neurosteroid-modulating activities.7–9 We have developed an economical and robust method to isolate, extract and purify KME from G. elegans.10 Additionally, our group previously reported promising results indicating that gavage with KME could alleviate paw swelling, pain and joint inflammation in the collagen-induced arthritis (CIA) model, suggesting that KME has a significant therapeutic effect on RA.11,12 The anti-inflammatory activity of KME has been patented in China (CN101015593A) and the United States (US9078890 B2). More importantly, we completed a preclinical study of KME and are in the process of submitting an IND application to the National Medical Products Administration (NMPA). Therefore, there is an urgent need to develop novel dosage forms of KME and promote its clinical application for the treatment of RA.
Oral delivery is the most common and acceptable route of administration due to its convenience, cost and high patient compliance. However, there are several obstacles for oral administration, including poor solubility and membrane permeability, the low dissolution rate of hydrophobic drugs, and first-pass metabolism, which can be extensive for some drugs.13,14 To overcome these limitations, the novel drug delivery systems have been developed for RA treatment. Among them, microemulsion (ME) is of particular interest and has been proposed as carriers to enhance the absorption of oral drugs across biological membranes.15,16 ME is clear, thermodynamically stable, isotropic dispersions of water, oil, surfactant, and often additional cosurfactant. ME has many advantages, such as increased drug solubility and stability, low viscosity, high drug-loading capacity, ease of preparation and economical scale-up.17–19 Furthermore, the droplet size of ME ranges from 10 to 100 nm, and small droplets increase the surface area to volume ratio for drug absorption, thus improving bioavailability.20,21
Herein, KME, poorly water-soluble substance (< 1 mg/mL in water), can be solubilized in oil or oil-surfactant mixtures of ME. This study aimed to prepare KME-loaded microemulsions (KME-MEs), optimize the preparation procedure, explore the intestinal absorption mechanism, and evaluate the pharmacodynamics in vivo. Solubility studies and pseudoternary phase diagrams were both used to confirm the composition of the ME formulation. The effects of the formulation factors on the critical quality attributes of KME-MEs were optimized by D-optimal mixture design. Furthermore, in vitro permeation testing studies were performed to evaluate the absorptive permeability of KME-MEs across Caco-2 cell monolayers and rat intestines. Finally, the therapeutic effect of the KME-MEs was investigated in a CIA rat model.
Materials and Methods
Materials
KME (Fujian medical university, purity 99.2%). Capryol® 90, Labrasol, Maisine 35–1 and Transcutol® HP were purchased from Gattefossé (Shanghai) Co., LTD.; Cremophor® RH40 and Kolliphor EL were obtained from BASF (Germany). Medium chain triglyceride (MCT), Tween-80, Tween-20, propylene glycol, PEG 400, DIR dye and Coumarin-6 were all purchased from Sinopharm Chemical Reagents Co., LTD; Dulbecco’s Modified Eagle’s Medium (DMEM) and fetal bovine serum (FBS) were purchased from HyClone Inc.
Solubility Study
The solubility of KME in different oils (Capryol 90, monocaprylin, MCT and Maisine 35–1), surfactants (Tween-80, Tween-20, Kolliphor EL, Cremophor® RH40) and cosurfactants (Transcutol® HP, Labrasol, propylene glycol, and PEG 400) was measured. Briefly, excess drug was added to each of the above types of solvents, vortexed for 10 min, and oscillated at 37°C for 48 h. The mixtures were centrifuged and the supernatant was measured at 265 nm by HPLC system (Shimadzu, Kyoto, Japan) after appropriate dilution with methanol.22
Construction of Pseudoternary Phase Diagram
Pseudoternary phase diagrams were established by water titration method. First, the surfactants /cosurfactants (Smix) were mixed in various weight ratios (1:1, 1:2 and 2:1). Then the Smix were mixed with oil, with a weight ratio of 9:1 to 1:9. Purified water was finally dropped into each mixture under magnetic stirring. After equilibration, the ME formation was visually examined for transparency or turbidity. The diagrams were drawn using Origin 2018 software.
Preparation and Optimization of KME-MEs
The Smix ratio with the largest ME region was selected, and the KME-MEs formulation was further optimized by D-optimal design.23 The equilateral triangle of the D-optimal design represented oil, Smix and water. The sum of the three components was constant at 100%.24 According to the results of the pseudoternary phase diagram and the stability of the ME, the dosage ranges of oil (X1), Smix (X2, Smix = 1:1) and water (X3) were set as 8–14%, 20–32% and 54%-72%, respectively. A total of 16 runs were carried out in the design to study the effects of the independent variable (mixed components) on the experimental responses of particle size (Y1) and loading efficiency % (LE%, Y2). The interactions between the independent variable and the experimental response are graphically represented in the form of contour plots and 3D surface response plots.
Characterization of the Optimized KME-MEs
Particle Size, Zeta Potential and Morphology
The mean particle size, polydispersity index (PDI), and zeta potential of KME-MEs were measured by using a dynamic light scattering particle analyzer (Zetasizer Nano ZS 3000, USA). Before measurement, the samples were diluted with deionized water to a certain concentration. Each sample measurement was repeated three times. The KME-MEs sample was placed on a carbon-coated copper grid, then negatively stained with 1% phosphotungstic acid and dried at room temperature. The surface morphology was observed by transmission electron microscopy (TEM) (FEI), and representative photographs were taken at different magnifications.
Viscosity, pH and Transmittance
The viscosity of the KME-MEs was measured using a rotational rheometer (MCR102, Anton Paar, Austria). The pH value of the KME-MEs was estimated by a sensitive pH meter (FE20, Mettler Toledo). The transmittance of the KME-MEs was determined using a UV‒vis spectrophotometer (UV-1800, Agilent) at 600 nm. All measurements were taken three times at room temperature.
Loading Efficiency
The loading efficiency of KME-MEs was estimated by HPLC method. Briefly, KME-MEs were purified by ultrafiltration membrane, then dissolved in methanol, sonicated, centrifuged and filtered through a 0.22 μm membrane before HPLC analysis. The HPLC system utilized an SPD-20A UV visible detector (Shimadzu, Kyoto, Japan). The determination was performed on a C18 column (150 mm × 4.6 mm, 5 μm) with methanol: 0.1% ammonium hydroxide water (70:30, v/v) as the mobile phase at a flow rate of 1.0 mL/min. The sample injection volume was 20 μL, and the column temperature was 30°C. The LE% was calculated by the following equation:

In vitro Drug Release
In vitro KME release from KME-MEs was analyzed using a dynamic dialysis method.19 Briefly, an appropriate amount of KME or KME-ME was transferred to a dialysis bag (8000–14,000 Da) and then placed in 40 mL of release medium (pH 6.8 buffer, 37 ± 0.5°C, stirred at 100 rpm). Release samples (4 mL) were withdrawn at 15 min, 30 min, 45 min, 1 h, 3 h and 6 h, and the same amount of fresh medium was added back to the system. The samples were filtered through a 0.22 μm filter membrane and analyzed by HPLC at 265 nm. The drug release kinetics were determined after fitting the drug release data to various kinetic models using Origin 2018 software.
Stability Studies
KME-MEs were diluted 10-fold, 100-fold and 500-fold with deionized water. The particle size, transmittance and pH value were measured after each dilution. Triplicate samples of the optimized KME-MEs were prepared and stored at 4°C, room temperature and 40°C for three months. Samples were removed at specific time points (0, 7, 30, 60 and 90 days) and checked for the changes in particle size, PDI and transmittance. The LE% of the KME-MEs was also determined by HPLC analysis.
Cellular Uptake
Caco-2 cells were kindly provided by Fuzong Clinical Medical College of Fujian Medical University, which purchased the cells from Guangzhou Janio Biotechnology Co., LTD. Caco-2 cells were cultured in DMEM supplemented with 20% (v/v) FBS and 1% antibiotics and maintained in 5% CO2 at 37°C (Thermo Fisher Scientific).
Coumarin-6 (C6)-loaded MEs (C6-MEs) were prepared to assess the cellular uptake of the KME-MEs, in which the green fluorescent hydrophobic dye C6 was substituted for KME. Briefly, cells were seeded in 6-well cell culture plates (1 × 10⁵ cells/mL) and incubated at 37°C for 12 h. Then, the medium was replaced with 1 mL of C6 solution or C6-MEs (5 μg/mL) and treated for another 0.5 h, 1 h and 2 h. Cellular uptake was determined by flow cytometry (Cytoflex, Beckman Coulter, USA) and fluorescence microscopy (Leica). For flow cytometry analysis, the collected cells were washed 3 times with PBS, centrifuged (1200 rpm) and resuspended in cold PBS. Additionally, cells in the culture plate were stained with Hoechst 33342, and observed under a fluorescence microscope.
Cytotoxicity Assays
The cytotoxicity of KME-MEs against Caco-2 cells was evaluated via the cell counting kit-8 (CCK-8) method. Caco-2 cells were inoculated in 96-well cell culture plates and cultured overnight at 37°C. Subsequently, the medium was replaced with different concentrations of KME or KME-MEs. After 24 h, CCK-8 solution (5 mg/mL, 10 μL) was added and incubated for 2 h. The samples were measured at 490 nm by a microplate reader (BioTek Epoch). Untreated cells were used as control (100% viability).
Caco-2 Cell Permeability Assays
Caco-2 cells were seeded onto Transwell inserts (12-well, 5×10⁴ cells/well) and cultured for 21 days in 5% CO2 at 37°C. The culture medium was changed every 2 days for the first 7 d and every day for the following 14 d. After 21 days, the transepithelial electrical resistance (TEER) of the Caco-2 cells in the inserts was measured using a Millicell ERS-2 voltmeter (Millipore Millicell, USA). Only monolayers displaying TEER values above 600 Ω/cm2 could be used for subsequent transport experiments.
The transport of KME and KME-MEs through the Caco-2 cell monolayer was determined in both directions, from apical to basolateral (AP-BL) and basolateral to apical (BL-AP) direction. After preincubation for 30 min in pH 7.4 HBSS, the KME or KME-MEs (equivalent KME concentration of 50 μg/mL) was added to the apical side (0.5 mL) for the AP-BL direction experiment or to the basolateral side (1.5 mL) for the BL-AP direction experiment. Then, 100 μL of medium was taken from the acceptor compartment at 30, 60, 90, and 120 min and replaced with the same volume of fresh HBSS. The KME content was analyzed by HPLC. The apparent permeability coefficient (Papp, cm/s) and efflux ratio (ER) were calculated according to the following equations.

where dQ/dt is the amount of KME that transport through the cell monolayer unit time, A is the monolayer surface area (1.12 cm2), and C0 is the initial concentration (50 μg/mL).

Ex vivo Everted Gut Sac Experiments
All animal experiments were conducted in accordance with the guidelines of the institutional animal care and use committee (Fujian Medical University, SCXK (Min) 2016–0002). The procedure for the everted gut sac experiment followed our previously published reports.22 Briefly, the everted duodenum, jejunum, ileum and colon were immediately rinsed in ice-cold Krebs-Ringer buffer (K-R, pH 7.4) after collection. One end of the gut sac was ligated, and the other end was attached to a glass sleeve as an opening. The segment was filled with 2.5 mL of K-R buffer and then placed in 50 mL of K-R buffer (serosal side, containing KME or KME-MEs). Throughout the experiment, the intestinal segments were incubated in oxygen-saturated gas (95% O2-5% CO2) culture medium at 37°C. At 30, 60, 90 and 120 min, one milliliter of medium was removed from the serosal side and replaced with an equal volume of fresh K-R solution. The samples were filtered and analyzed by HPLC.

where dQ/dt is the amount of KME that passes through the intestines per unit time, C0 is the initial concentration of KME, and A is the intestinal sac surface area.
Evaluation of the Anti-Arthritis Effect in vivo
Establishment of the CIA Rat Model
Male Wistar rats with a body weight of 120 ± 10 g were housed in a controlled environment (20~26°C and 40%~70% RH) with free access to food and water. Six Wistar rats were not treated and used as the normal group, and the remaining rats were used to establish the CIA model according to published references.25,26 The CIA model was established by two immunizations. First, the 200 μL emulsion prepared with type II collagen solution and incomplete Freund’s adjuvant (v/v, 1:1) was injected intradermally into the rat tail root. Seven days after the first immunization, 100 μL of the above emulsion was used for booster immunization.
In vivo Fluorescence Imaging
CIA rats were given free DIR and DIR-labeled DIR-MEs by oral gavage. At 3 h, 9 h, and 24 h after administration, the hind limbs of rats were photographed using an IVIS spectroscopy system (IVIS, Caliper, USA).
In vivo Therapeutic Effects
To investigate the anti-arthritic activity, CIA rats were divided into 3 groups on the 21st day after the first immunization. Group 1: CIA rats treated with saline every day; Group 2: rats orally administered a KME suspension (6 mg/kg) every day; Group 3: rats orally administered KME-MEs (6 mg/kg) every other day. The entire dosing cycle lasted 15 days. The paw volume, arthritis index, hematological parameters and histopathology of the ankle joints were used to evaluate the anti-arthritis effect.
Arthritis Index and Paw Volume
On the 0, 22nd, 27th, 32nd and 37th days, arthritic index (AI) scores were assigned according to the following scale: 0 = normal, 1 = erythema and light swelling, 2 = erythema and mild swelling, 3 = erythema and severe swelling, and 4 = excess erythema with joint stiffness. Additionally, inhibition of arthritis was also demonstrated by a reduction in paw volume as measured by a plethysmometer.
Hematological Parameters
Blood biomarkers have been commonly used to provide more information about the effectiveness of RA medications. Therefore, parameters such as red blood cells (RBCs), white blood cells (WBCs) and hemoglobin (HGB) were evaluated, and cell count analysis was performed on a fully automatic hematology analyzer (SYSMEX Japan Inc.). The concentration of C-reactive protein (CRP) in serum was measured by commercially available ELISA kits (Cloud-Clone Corp.) following the manufacturer’s protocol.
Histological Analysis
Rats were sacrificed on day 37 and the left hind paw ankle joints were dissected, fixed in 4% paraformaldehyde solution, decalcified in 10% EDTA solution, and embedded in paraffin. The tissue sections (5 μm) were stained with hematoxylin-eosin (H&E) and safranin-O, and observed under light microscope. Pathological changes in inflammatory cell infiltration, cartilage and bone destruction and edema of the periarticular tissue were observed.
Animal Body Weights and Blood Tests
The weight of the treated rats was measured during the experiment. After treatment, the blood of the animals was collected for analysis. The levels of aspartate transaminase (AST), alanine transaminase (ALT), blood urea nitrogen (BUN) and creatinine (Cre) in the blood serum were measured by a blood biochemistry analyzer (Beckman coulter).
Statistical Analysis
Statistical analysis was conducted by an unpaired Student’s t-test using GraphPad Prism 8.0 software. Differences at *p < 0.05 and **p < 0.01 were considered significant. The data are expressed as mean ± standard deviation (SD).
Results and Discussion
Solubility Study
The oil is the inner phase of the oil-in-water (O/W) ME and serves as a reservoir for hydrophobic drugs. Drug solubility in oil is an important basis for screening suitable oil phases.27,28 As shown in Figure S1, the solubility of KME was found to be the highest in Capryol 90, followed by monocaprylin, MCT and Maisine 35–1. Capryol 90 is a commercially available oily liquid, with a hydrophilic-lipophilic balance value of 4–5, has been applied in oral formulations to improve the bioavailability of low-solubility drugs. Hence, Capryol 90 was selected as the oil phase. Interestingly, when Cremophor® RH40 was used as the surfactant, the prepared emulsion had good emulsifying effect, small particle size and high stability, even though the solubility of KME in Cremophor® RH40 was not the highest among all the surfactants examined. Cremophor® RH40 was finally selected as the surfactant for the ME development. Cosurfactants can efficiently reduce the interfacial tension and increase the emulsion stability, which is very important for colloidal systems. Similarly, Transcutol® HP was chosen as the cosurfactant because it incorporated the most KME compared to Labrasol, propylene glycol, and PEG 400.
Pseudoternary Phase Diagrams
Based on the preliminary solubility and emulsifying effects, Capryol 90, Cremophor® RH40 and Transcutol® HP were chosen as oil phase, surfactant and cosurfactant, respectively. Pseudoternary phase diagrams is a suitable way to find transparent, single-phase, low viscosity ME systems. Thus, these diagrams were constructed to determine the optimal Smix (Cremophor® RH40/Transcutol HP) of the ME formulation in the present study. The pseudoternary phase diagrams containing different weight ratios of Smix were presented in Figure 1. The blue areas of the phase diagrams indicated the ME regions, while the white area represented the turbid, biphasic and conventional emulsion regions. The results showed that the ME with a Smix ratio of 1:1 had the largest ME region, and this ratio could be used for the optimization of KME-MEs.
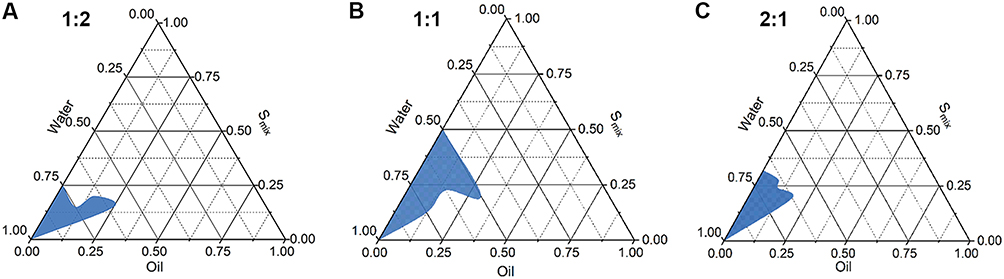 |
Figure 1 Pseudo-ternary phase diagram of MEs with various weight ratios of Smix (Cremophor RH40: Transcutol HP). (A) Smix 1:2; (B) Smix 1:1; (C) Smix 2:1. |
D-Optimal Design
Pharmaceutical scientists are often faced with the problem of using single-factor optimization methods to optimize formulations. However, compared with the single-factor design method, multiobjective optimization is more efficient and can produce an optimal value. D-Optimal mixture design is more suitable for the development of ME and requires fewer optimization tests. It has the characteristics of simple design, high predictive accuracy and multiobjective synchronous optimization.24 Sixteen experimental runs suggested by the statistical design were performed and the results were shown in Table S1. Three formulation variables, oil (X1), Smix (X2) and water (X3), and two dependent variable, particle size (Y1) and LE% (Y2), were selected for the optimization study. The first step in statistical analysis optimization is to select the optimal model that best fits the resulting data. Predicted residual sum of squares (PRESS) was used to determine the suitability of model fitting. The model with the minimum PRESS value has the best prediction ability. Therefore, the special quartic model was selected for response Y1 (Table S2), and the special cubic model was selected for response Y2 (Table S3). The equation of the polynomial regression was obtained for regression fitting analysis of the experimental data (Tables S4 and S5).


As shown in Figure 2A and B, the interaction between the formulation variables and dependent variable was graphically represented in the form of contour and 3D surface plots. In the oil content ranging from 8% to 14%, Smix increases, the particle size decreases, and the LE% decreases. When the Smix content is in the range of 20% - 32%, the particle size increases with increasing oil content, and the LE% first decreases and then increases. The plots showed that the LE% (83.50–89.13%) and globule size (29.8–17.4 nm) increased and decreased with increasing Smix and decreasing oil content, respectively. These obtained results indicated that to form a stable interfacial film around the oil droplets, more surfactant needs to be added to make clear and transparent MEs. In summary, a large Smix proportion is required for the preparation of stable ME formulations.
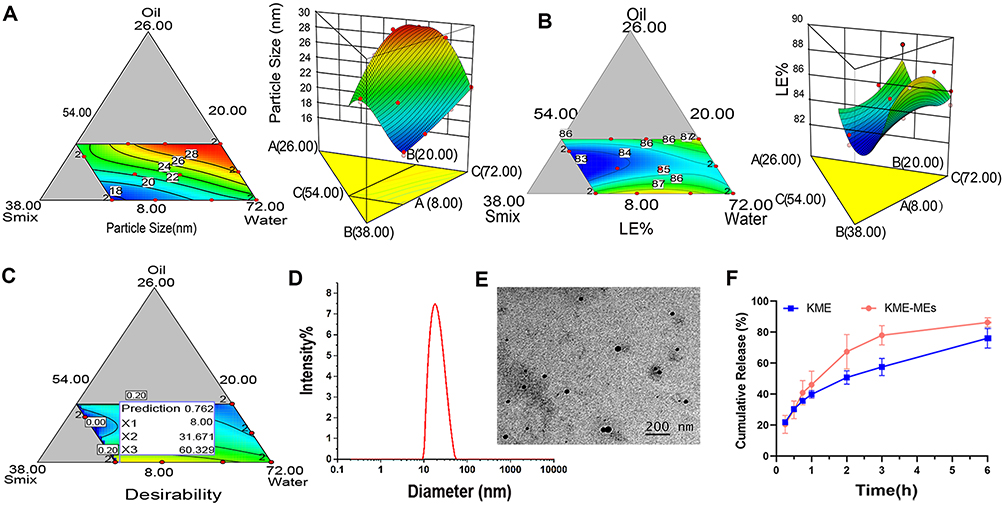 |
Figure 2 Optimization and characterization of KME-MEs. Contour plots and 3D response surface plots for response (A) particle size (nm) and (B) LE%; (C) Desirability plot for optimization formulation; (D) Size distribution obtained by DLS and (E) TEM image of optimized KME-MEs, Scale bar, 200 nm; (F) In vitro KME release from the KME suspension and KME-MEs at 37°C in pH 6.8 buffer. All data were shown as mean ± SD (n = 3). |
The software was used to predict the ME with maximum LE% and minimum globule size to determine the optimized formulation. The overlay plot shown in Figure 2C highlights the regions that serve as the upper and lower limits of the response for the formulation components. The recommended formulation was composed of 8% oil, 32% Smix and 60% water (w/w). The predicted value of Y1 and Y2 was 17.74 nm and 86.88%, respectively. Validation tests were conducted in triplicate, and the actual value of Y1 and Y2 was detected to be 18.5 ± 0.14 nm and 90.63%, respectively. The average relative deviation less than 5%, indicating that D-optimal mixture was a reliable model for the optimization of KME-MEs.
Characterization of the Optimal KME-MEs
Physicochemical Properties
The particle size of the optimized KME-MEs was 18.5 ± 0.14 nm (Figure 2D), the PDI was 0.120 ± 0.03, and the zeta potential was found to be −11.87 ± 0.87 mV. The TEM images (Figure 2E) showed that the KME-MEs were spherical with a smooth, flexible boundary and did not aggregate. The viscosity (mPa·s) decreased as the shear rate (1/s, 0 to 100) increased, indicating that the KME-MEs was a pseudoplastic fluid. When the shear rate was 20 1/s, the viscosity was 10.33 ± 1.11 mPa·s. The pH value was 7.79 ± 0.17, which was considered appropriate for oral administration. The transmittance of KME-MEs was 98.08±0.02%, a value close to 100%, indicating the clarity and transparency of the formulation.
In vitro Drug Release
In vitro release profile of KME from the KME and KME-MEs was shown in Figure 2F. Approximately 77.9% of KME was released from the KME-MEs within 3 h, while that of the corresponding KME suspension was approximately 57.5% (p<0.001). The result indicated that KME-MEs improved the solubility and diffusion rate of KME due to the formation of ME. The in vitro release curves were fitted to zero-order kinetic, first-order kinetic, Higuchi model and Korsmeyer-Peppas model, respectively. The KME-MEs was in line with the first-order release kinetics (r =0.999) and displayed a simple diffusion release mechanism. The fitting results are reported in Table S6.
Stability Studies
Both Table 1 and Table S7 showed the results of the stability study. After 10-fold, 100-fold, and 500-fold dilutions, the particle size and transmittance of the KME-MEs did not change significantly (Table S7), and there was no phase separation or drug precipitation, indicating that the ME had good dilution stability and was suitable for oral administration. The storage stability of KME-MEs was evaluated after storage for 0, 7, 30, 60 and 90 days under specific conditions. The changes in the particle size, LE% and transmittance were not statistically significant, indicating that the KME-MEs formulation had good storage stability.
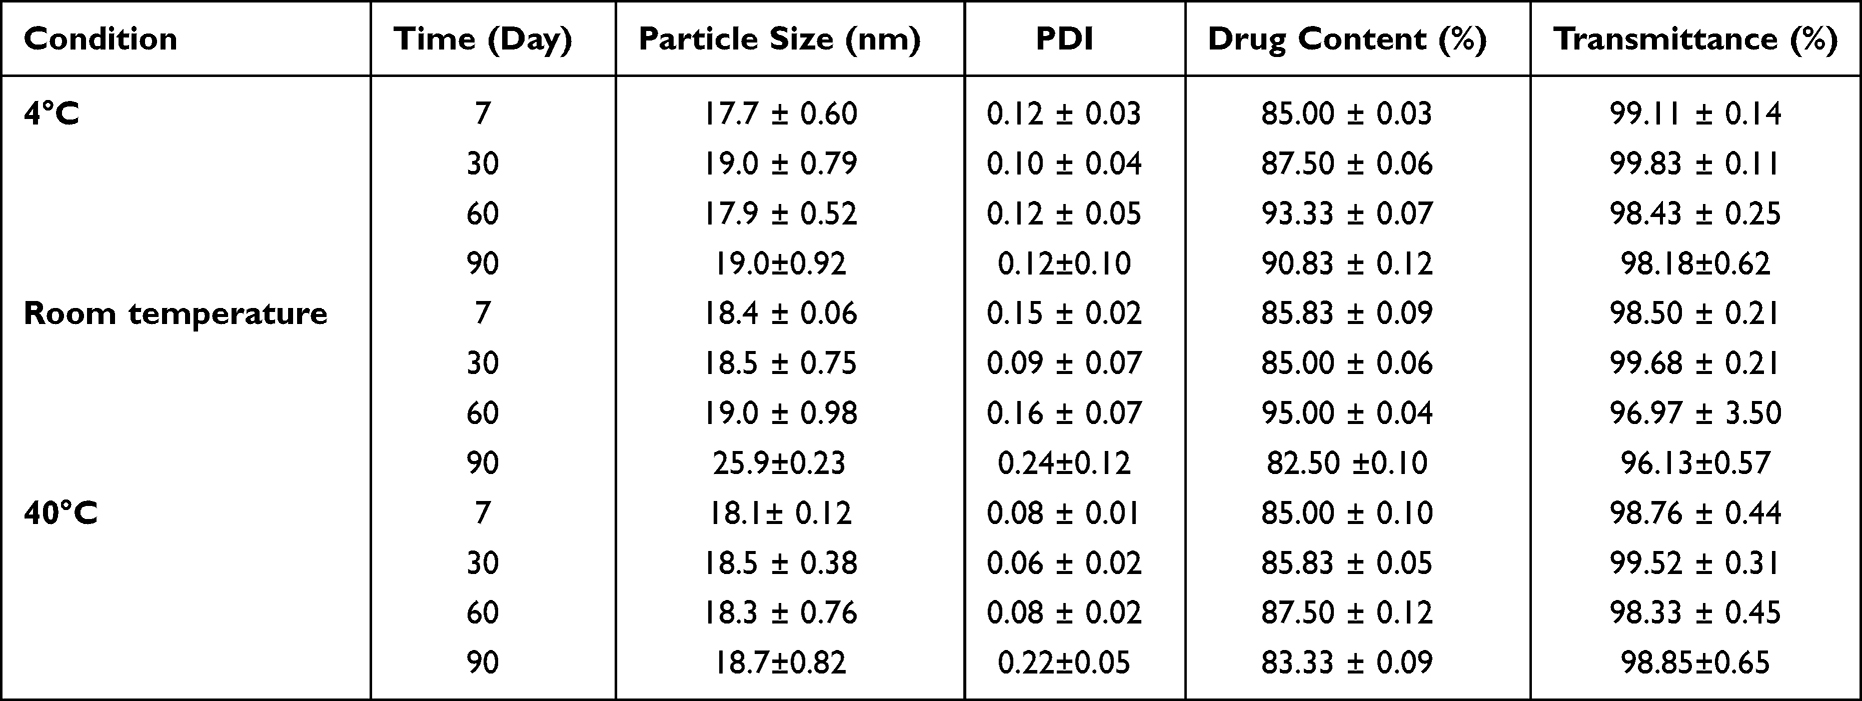 |
Table 1 Storage Stability of the KME-MEs (Mean ± SD, n = 3) |
Cellular Uptake
C6 is a hydrophobic dye with a molecular weight similar to that of KME. Thus, C6-MEs were prepared and incubated with Caco-2 cells to study the cellular uptake and transport of the MEs. The flow cytometry histogram (Figure 3A) displayed time-dependent uptake of C6 and C6-MEs by Caco-2 cells, with a continuous increase in intracellular fluorescence intensity from 0.5 h to 2 h. Notably, the fluorescence intensity of the C6-ME group was higher than that of C6 at 0.5 h, 1 h and 2 h (Figure 3B, ***p<0.001, *p<0.05), indicating that the ME could increase the rate and extent of drug entry into the cells. The results of fluorescence microscopy were consistent with those of flow cytometry. As shown in Figure 3C, green fluorescence represents C6 or C6-MEs, and blue fluorescence represents the nucleus. With the extension of incubation time, the fluorescence intensity in the cells increased gradually, and the green fluorescence intensity of the C6-ME in Caco-2 cells was higher than that of the C6. These findings confirmed the efficient internalization of KME-MEs in Caco-2 cells.
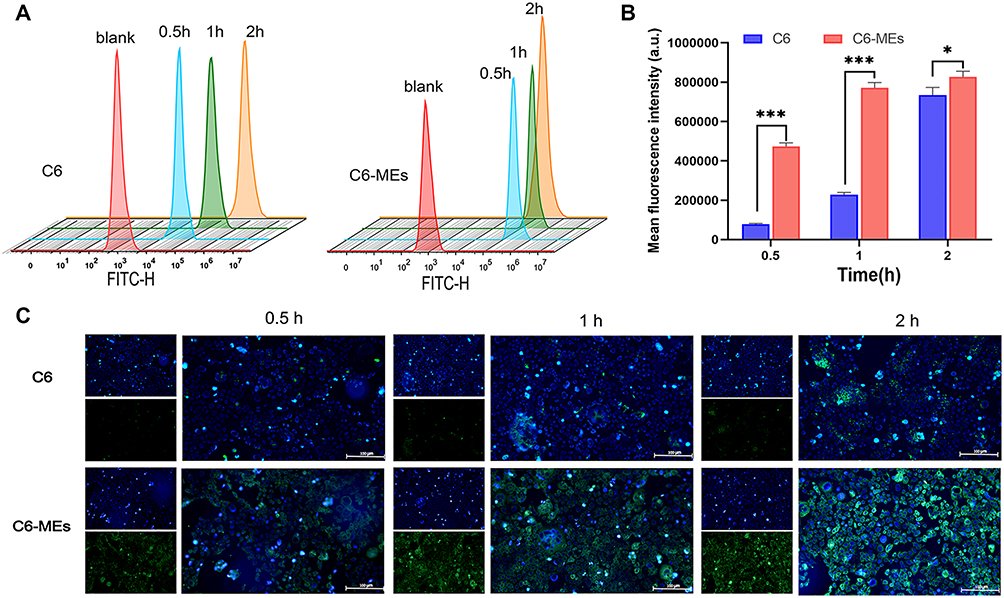 |
Figure 3 Intracellular uptake of C6-MEs in Caco-2 cells. (A) Flow cytometric analysis of Caco-2 cells treated with C6 or C6-MEs for 0.5, 1 and 2 h; (B) Quantitative results, ***p < 0.001, *p < 0.05; (C) Fluorescence microscopy images of Caco-2 cells incubation with C6 or C6-MEs. The nuclei were stained with Hoechst 33342 (blue), Scale bar, 100 μm. |
Cytotoxicity Assays
As presented in Figure 4A, cell viability was over 90% after treatment with 5–100 μg/mL of KME. KME-MEs had no obvious cytotoxicity in the range of 5 to 50 μg/mL, but slightly inhibited cell proliferation was observed at 100 μg/mL. This slightly higher cytotoxicity may be attributed to the high concentration of surfactant/cosurfactant used in the ME. The CCK-8 results showed that the KME-MEs formulation (5–50 μg/mL) had low toxicity and did not show any effect on the physical integrity of Caco-2 cell membrane, giving this formulation potential for oral application.
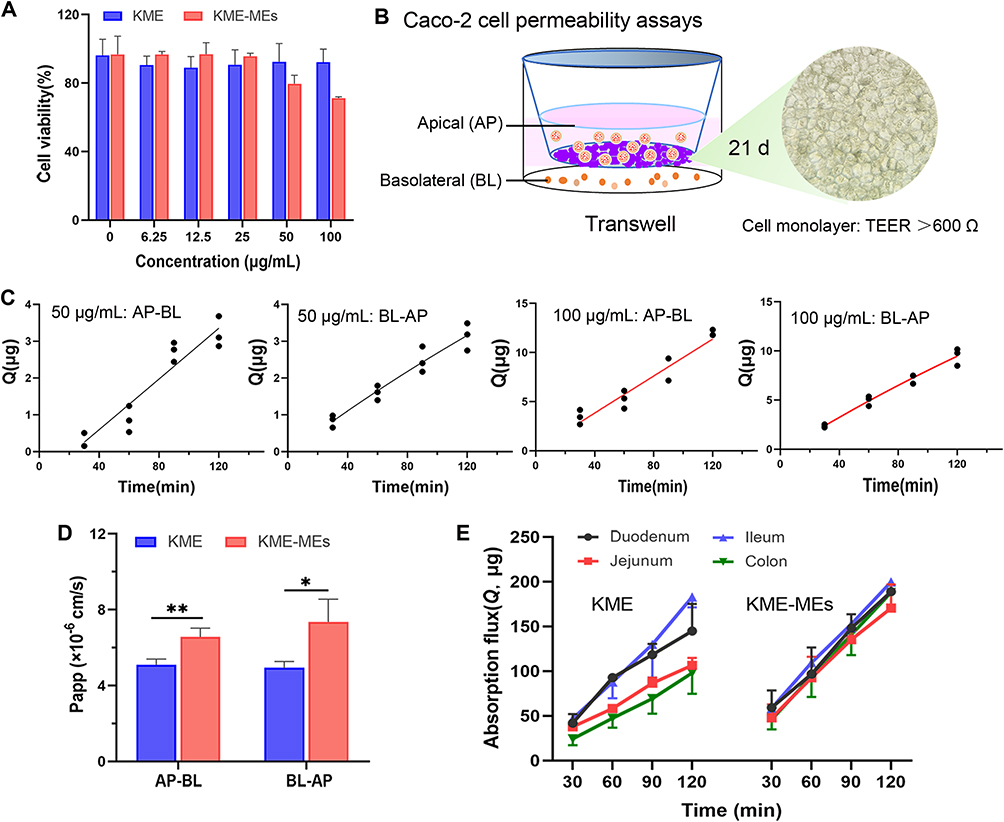 |
Figure 4 In vitro intestinal permeability of KME-MEs. (A) Cytotoxicity of KME or KME-MEs against Caco-2 cells (24 h); (B) Schematic illustration of the Caco-2 cells permeability model using a Transwell system; (C) Transport of KME (50 and 100 μg/mL) through the Caco-2 cell monolayer (n=3); (D) Papp values in the Caco-2 cell permeability assays (n=3). *p < 0.05; **p < 0.01; (E) The permeability of KME and KME-MEs across duodenum, jejunum, ileum, and colon. |
Caco-2 Cell Permeability Assay
Solubility and permeability are two important parameters when evaluating drug substances. Although dissolution can be studied with official dissolution instruments, there is no certified technique for examining drug permeability. The Caco-2 cell monolayer and averted intestinal sacs are two commonly used models for high-throughput screening and drug permeability ranking. The Caco-2 cell permeability assay is widely used in pharmaceutical studies to predict the absorption properties of drugs and preparations.29 In our study, Caco-2 cells were cultured for 21 days in Transwell-polycarbonate plates, their morphology as observed by light microscopy was uniform, dense, and flat, and the cells fused into sheets with an epithelioid morphology (Figure 4B). The TEER value is a vital index to evaluate the integrity and tightness of the Caco-2 cell monolayer. At 21 days, this value in the present study exceeded 700 Ω/cm2 (> 600 Ω/cm2), suggesting that the Caco-2 cell monolayer model was successfully established and could be used for cell permeability experiment.
The transport of KME or KME-MEs across the cell monolayer was carried out in the AP-BL and BL-AP direction. First, the influence of the KME concentration on transport efficiency was investigated. With increasing KME concentration (from 50 to 100 μg/mL), the cumulative absorption increased, and both directions had similar transport trends and transport amounts (Figure 4C). Papp is an index that evaluates the degree of permeability of drug substances. Generally, substances with Papp >1×10⁻⁶ cm/s are classified as highly permeable, Papp values between 1×10⁻⁶ and 1×10⁻⁷ indicate medium permeability, and those with Papp <1×10⁻⁷ indicate low permeability.30 The Papp (AP-BL) and Papp (BL- AP) of KME (50 μg/mL) were 5.09×10⁻⁶ cm/s and 4.93×10⁻⁶ cm/s, respectively. According to this classification, KME is a substance with medium permeability. In addition, drug efflux has been reported to occur when ER is greater than 2.31 The ER value of KME (50 μg/mL) was 0.97, indicating that there was no efflux transporter involved in KME permeation through the cell monolayer. The Papp (AP-BL) and Papp (BL- AP) of KME-MEs (50 μg/mL KME) were 6.57×10⁻⁶ cm/s and 7.36×10⁻⁶ cm/s, respectively. The Papp of KME-MEs increased by 1.3-fold (**p<0.01) and 1.5-fold (*p<0.05) compared with those of the KME in both directions (Figure 4D and Table S8), respectively. These results indicated that the ME enhanced the absorptive permeability of KME.
Everted Gut Sac Experiment
Isolated intestinal tissues were used for the ex vivo study. The cumulative absorption (Q, μg) of KME and KME-MEs in different intestinal segments at different times (t) was calculated, and the Q-t curve was drawn in Figure 4E and Table 2. KME and KME-MEs could be absorbed by the intestinal sac, and the Q-t curves showed an upward trend without saturation. In detail, KME was absorbed throughout the whole small intestine and colon with a faster absorption rate in the ileum, followed by the duodenum, jejunum and colon. With the prolongation of time, the cumulative absorption in the intestinal sac increased continuously. Within 120 min, the amount absorbed in the duodenum, jejunum, ileum and colon reached 144.9±30.1 μg, 106.6±8.4 μg, 162.4±36.2 μg and 97.9±23.2 μg, respectively. KME-MEs were also absorbed and transported by each intestinal segment, and there was no statistical difference between them. Notably, the transport rates of KME-MEs were higher than those of KME in each segment, suggesting that the ME increased the amount of transported KME. After 120 min, the total amount transported in each segment was 197.2 ± 9.8 μg, 170.5 ± 20.2 μg, 199.6 ± 10.5 μg and 188.1 ± 16.9 μg, respectively.
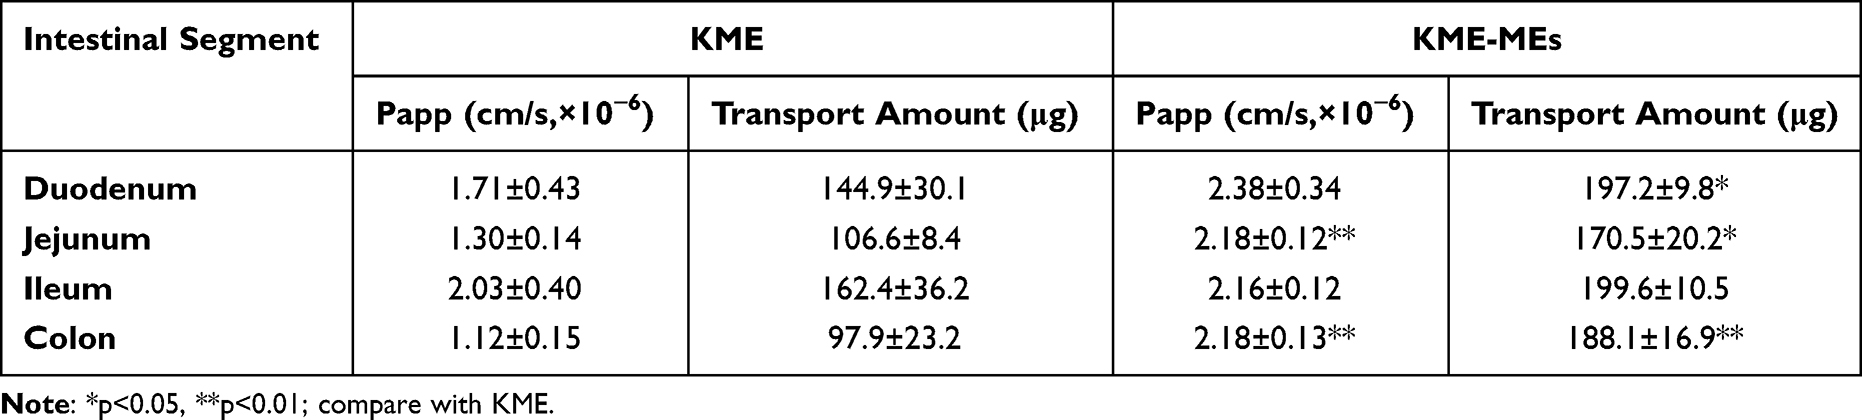 |
Table 2 Transport Amount and Apparent Permeability in Each Intestinal Segment |
The Q-t curves were fitted to first-order kinetic equation (Table S9), and the correlation coefficients (r) values were all exceed 0.98, obeying Fick’s law of diffusion. This result indicating that both KME and KME-MEs pass through the intestinal membrane via passive diffusion. The Papp values of KME-MEs in each intestinal segment were greater than those of KME, especially in jejunum (**p < 0.01) and colon (**p < 0.01). Papp values increased by 1.68- and 1.95-fold, respectively. This increased permeability may be attributed to the small particle size of the ME, which allows a larger area of contact with the gastrointestinal wall. Moreover, the surfactant/cosurfactant in ME appeared to disrupt the structural integrity of the lipid bilayer and increase the fluidity of the intestinal membrane, thereby enhancing KME absorption. In conclusion, the improved absorption efficiency of the KME-ME was confirmed by the Caco-2 cell permeability assay and the averted intestinal sac experiment.
In vivo Efficacy Studies
In vivo Distribution of DIR-MEs
The CIA model was established by two immunizations (Figure 5A). As shown in Figure 5B, the DIR-MEs produced a strong fluorescence signal in the paw region at 3 h after oral gavage, which continued to increase and peaked at the 9 h time point. The fluorescence intensity of free DIR in the paw region was very weak and significantly lower than that of DIR-MEs at all time points. These results suggest that microemulsion may help to improve drug transport across the intestinal membrane, thereby increasing the effective drug accumulation in inflammatory joints.
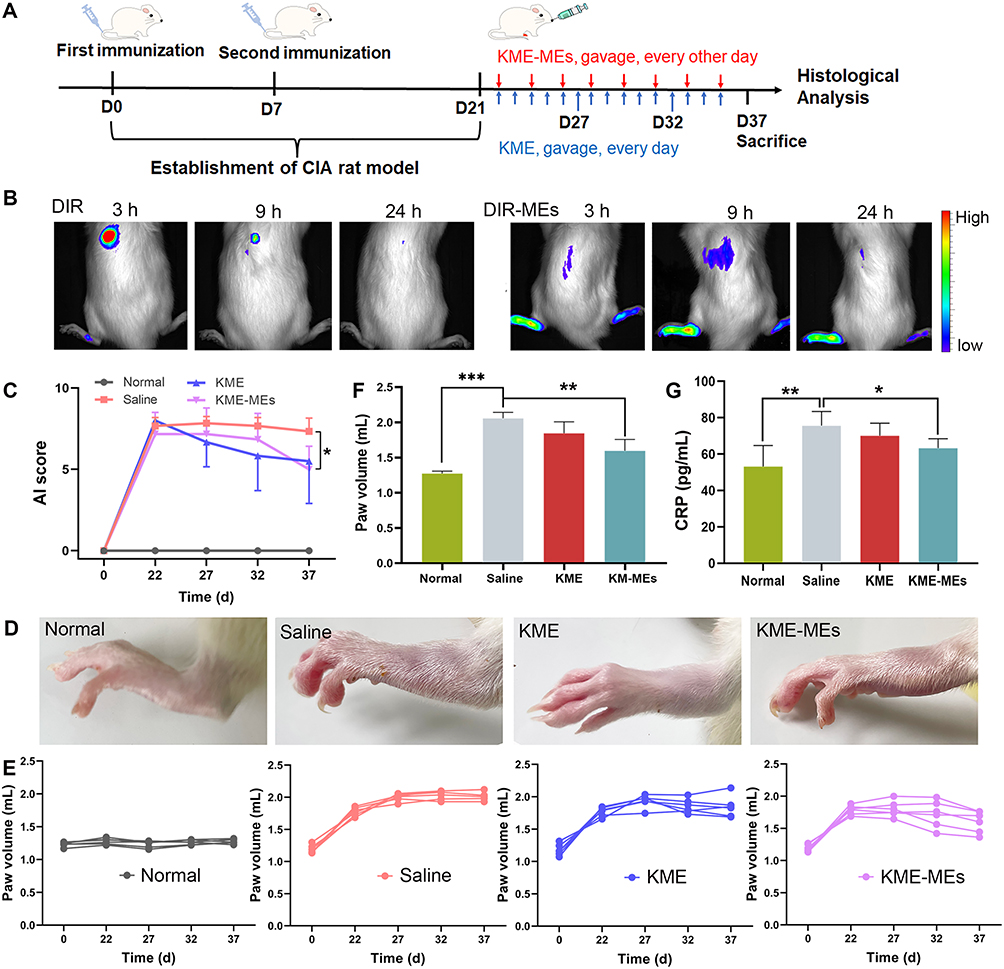 |
Figure 5 Therapeutic effect of KME-MEs in CIA rats. (A) Schematic illustration of the construction of CIA rat model and the protocol of therapeutic regimen. (B) In vivo fluorescence images of CIA rats at 3 h, 9 h, and 24 h after gavage with free DIR and DIR-MEs. (C) Arthritis index in different groups over 15 days of treatment; n=6, *p < 0.05. (D) Representative photograph of left hind limbs after treatment with different formulation. (E) Individual left paw volume change curves of each rat after treated with different groups; (F) Paw volume in each group after treatment, n=6, ***p < 0.001, **p < 0.01; (G) Serum concentrations of CRP in each group measured by ELISA tests, n=6, **p < 0.01, *p < 0.05. |
Measurements of Arthritis Index and Paw Volume
The experimental protocol for the therapeutic effects of KME and KME-ME on CIA rats was also shown in Figure 5A. In brief, on day 21, the CIA model had been successfully established, and then both KME and KME-MEs were administered orally to treat joint inflammation. The KME group received gavage 15 times (blue arrow, every day), and the KME-ME group received gavage 8 times (red arrow, every other day). The severity of arthritis was scored according to a clinical scoring system, and the paw volume was also measured. As shown in Figure 5C, the arthritis scores consistently increased in the saline-treated rats as the disease progressed, whereas those of the KME- and KME-MEs-treated rats began to decrease slowly after oral administration. In particular, more effective inhibition was observed in the KME-MEs group at the end of treatment (p < 0.05). Additionally, paw volume is a crucial index to evaluate anti-inflammatory effects, and the examination results were consistent with the arthritis scores. On day 15 after administration, the paws in each group were photographed to assess their appearance (Figure 5D). The CIA rats treated with saline had severe swelling and redness in their paws. However, these symptoms were markedly alleviated in rats treated with KME and KME-MEs. The changes in paw volume during treatment were also measured and were displayed in Figure 5E. The saline group suffered from significant paw swelling compared with normal rats (p < 0.001). The degree of paw swelling in the KME and KME-MEs groups was obvious reduced. Of note, more significant inhibition of the increase in paw volume was observed in the KME-MEs group (Figure 5F).
Measurement of Hematological Parameters
The serum concentration of CRP has been recognized as an objective measure of disease activity in RA. CRP is mainly produced in the liver, and its synthesis may reflect the concentration of inflammatory mediators that can leave the joint and stimulate hepatocytes either directly or indirectly. The synthesis of CRP increases rapidly after systemic inflammation. As shown in Figure 5G, the CRP level in the saline-treated CIA rats was significantly higher than in the normal rats (p < 0.01). However, this level was significantly reduced by treatment with KME-MEs (p < 0.05).
It is best to use multiple parameters to aid in disease staging, so routine blood analysis is also useful for the clinical evaluation of RA. It has been reported that decreased RBC and HGB levels are clinical manifestations of RA. After treatment with KME and KME-MEs, the levels of both increased significantly. For example, the KME-MEs-treated group showed an obvious increase in RBC (9.07±0.7 ×10⁶/μL) and HGB levels (148.83 ± 3.82 g/L) compared to the RBC (8.19±0.31 ×10⁶/μL) and HGB levels (133.83 ± 6.43 g/L) in the CIA-saline group. An elevated white blood cell count is also a characteristic diagnosis of arthritis. After treatment with KME and the KME-MEs formulation, the WBC levels were effectively reduced from 4.37 ± 1.42 ×10³/μL (CIA-saline group) to 2.15 ± 0.72 ×10³/μL and 1.79 ± 0.48 ×10³/μL, respectively.
Histological Analysis
The therapeutic efficacy of KME and KME-MEs was further evaluated by histological analysis. The pathological changes of the ankle joints were evaluated by H&E staining and safranin-O staining. As shown in Figure 6A, in normal rats, there was no inflammatory cell infiltration and the articular cartilage surface was smooth and flat. In contrast, the CIA-saline group showed severe cartilage destruction and inflammatory cell infiltration on the surface of the articular cartilage. As expected, the articular surface of the rats in the KME and KME-MEs groups was smooth, the chondrocytes were arranged regularly, and the number of periarticular inflammatory cells was reduced. Similar results were observed with safranin-O staining, which stains glycosaminoglycans in cartilage. In the CIA-saline group, cartilage matrix proteoglycans were obviously depleted, suggesting that the articular cartilage was severely degraded and destroyed. The cartilage structure was effectively preserved in the KME and KME-MEs groups, and obvious red staining was observed on the articular surface.
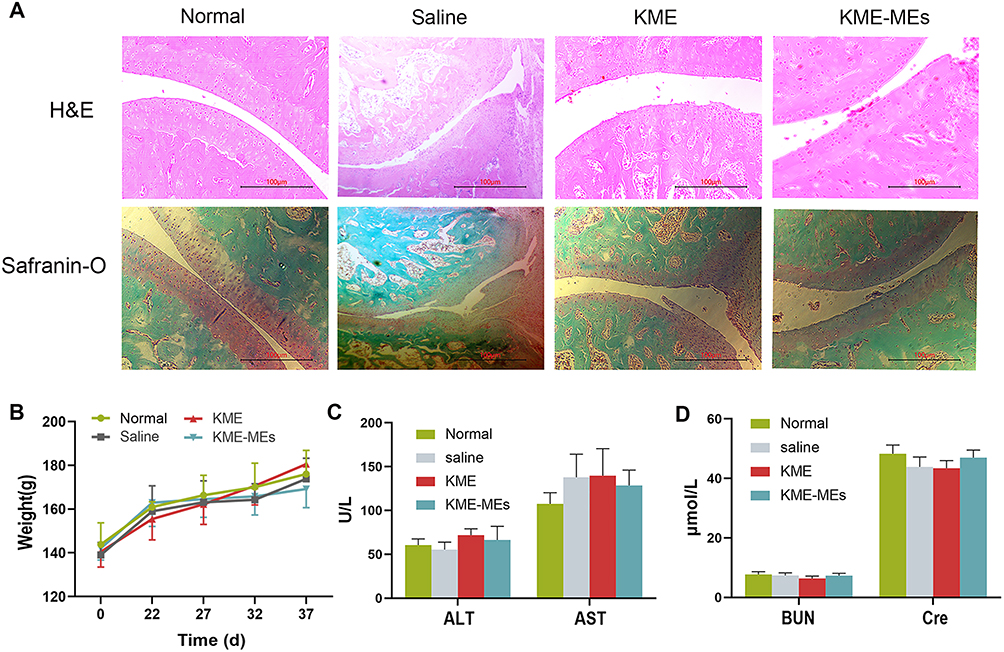 |
Figure 6 Histological study and safety of KME-MEs. (A) Representative images of H&E staining and safranin-O staining on the left ankle joints from normal rats and CIA rats treated with saline, KME or KME-MEs. Scale bars, 100 μm; (B) Change of body weight in each group on 37 days; (C) Serum level of ALT, AST and (D) BUN and Cre. All data were shown as mean ± SD (n = 6). |
Animal Body Weights and Blood Tests
The weights of experimental rats were measured throughout the treatment and the result was presented in Figure 6B. The body weights in the KME and KME-MEs groups were similar to those of untreated normal rats. After treatment, the liver function markers ALT and AST and the renal function indexes BUN and Cre were monitored to evaluate the safety of KME and KME-MEs in vivo. The serum levels of these markers did not change significantly compared with untreated normal group (Figure 6C and D), suggesting that KME and KME-MEs were not toxic in vivo.
Combining the arthritis index, paw volume and pathological results, the therapeutic effect of KME-MEs was similar to that of KME, but the frequency of administration was reduced. KME was administered once daily, whereas KME-MEs were administered once every other day. These data also suggested that only half the dose of KME-MEs might be needed to achieve a therapeutic effect similar to or even better than that of KME. This result may be related to the increased absorption of KME mediated by the ME formulation.
Conclusion
In the present study, D-Optimal design was successfully applied to design and develop the KME-MEs formulation. The ME, consisting of Capryol® 90, Cremophor RH 40, Transcutol HP and water, was used to orally administer KME and improve its intestinal permeability and therapeutic effects. The optimized KME-MEs showed a smaller globule size, negative zeta potential, excellent stability, acceptable cytotoxicity and enhanced absorptive permeability, thus improving drug accumulation in inflamed joints and anti- arthritic activity in vivo. Overall, the results obtained in this study show the great potential of the developed KME-ME formulation for clinical translation. Our future studies will focus on toxicity and long-term stability.
Acknowledgments
Qing Hu and Xiao-Ling Fu contributed equally to this work. This work was supported by the National Natural Science Foundation of China (82003663, 81872879); Joint Funds for the Innovation of Science and Technology, Fujian province (2019Y9006, 2020Y9010); the Fujian Provincial Talent Project (087376).
Disclosure
The authors report no conflicts of interest in this work.
References
1. Zhao M, Zhu T, Chen J, et al. PLGA/PCADK composite microspheres containing hyaluronic acid-chitosan siRNA nanoparticles: a rational design for rheumatoid arthritis therapy. Int J Pharm. 2021;596:120204. doi:10.1016/j.ijpharm.2021.120204
2. Lu Y, Li L, Lin Z, et al. A new treatment modality for rheumatoid arthritis: combined photothermal and photodynamic therapy using Cu(7.2) S(4) nanoparticles. Adv Healthc Mater. 2018;7(14):e1800013. doi:10.1002/adhm.201800013
3. Kim J, Kim HY, Song SY, et al. Synergistic oxygen generation and reactive oxygen species scavenging by manganese ferrite/ceria co-decorated nanoparticles for rheumatoid arthritis treatment. ACS Nano. 2019;13(3):3206–3217. doi:10.1021/acsnano.8b08785
4. Qiu S, Wu X, Li Z, et al. A smart nanoreactor based on an O(2)-economized dual energy inhibition strategy armed with dual multi-stimuli-responsive “doorkeepers” for enhanced CDT/PTT of rheumatoid arthritis. ACS Nano. 2022;16(10):17062–17079. doi:10.1021/acsnano.2c07338
5. Huang R, Zhang C, Bu Y, et al. A multifunctional nano-therapeutic platform based on octahedral yolk-shell Au NR@CuS: photothermal/photodynamic and targeted drug delivery tri-combined therapy for rheumatoid arthritis. Biomaterials. 2021;277:121088. doi:10.1016/j.biomaterials.2021.121088
6. Jin GL, Su YP, Liu M, et al. Medicinal plants of the genus Gelsemium (Gelsemiaceae, Gentianales)--A review of their phytochemistry, pharmacology, toxicology and traditional use. J Ethnopharmacol. 2014;152(1):33–52. doi:10.1016/j.jep.2014.01.003
7. Liu M, Shen J, Liu H, et al. Gelsenicine from gelsemium elegans attenuates neuropathic and inflammatory pain in mice. Biol Pharm Bull. 2011;34(2):1877–1880. doi:10.1248/bpb.34.1877
8. Xu Y, Qiu HQ, Liu H, et al. Effects of koumine, an alkaloid of Gelsemium elegans Benth, on inflammatory and neuropathic pain models and possible mechanism with allopregnanolone. Pharmacol Biochem Behav. 2012;101(3):504–514. doi:10.1016/j.pbb.2012.02.009
9. Jin GL, Liu HP, Huang YX, et al. Koumine regulates macrophage M1/M2 polarization via TSPO, alleviating sepsis-associated liver injury in mice. Phytomedicine. 2022;107:154484. doi:10.1016/j.phymed.2022.154484
10. Su YP, Shen J, Xu Y, Zheng M, Yu CX. Preparative separation of alkaloids from Gelsemium elegans Benth using pH-zone-refining counter-current chromatography. J Chromatogr A. 2011;1218(23):3695–3698. doi:10.1016/j.chroma.2011.04.025
11. Yang J, Cai HD, Zeng YL, et al. Effects of koumine on adjuvant- and collagen-induced arthritis in rats. J Nat Prod. 2016;79(10):2635–2643. doi:10.1021/acs.jnatprod.6b00554
12. Yang J, Lin Y-R, Xiong B-J, et al. Regulation effect of koumine on T-helper cell polarization in rheumatoid arthritis. Eur J Pharmacol. 2022;937:175387. doi:10.1016/j.ejphar.2022.175387
13. Choi JU, Maharjan R, Pangeni R, et al. Modulating tumor immunity by metronomic dosing of oxaliplatin incorporated in multiple oral nanoemulsion. J Control Release. 2020;322:13–30. doi:10.1016/j.jconrel.2020.03.012
14. Kim DS, Cho JH, Park JH, et al. Self-microemulsifying drug delivery system (SMEDDS) for improved oral delivery and photostability of methotrexate. Int J Nanomedicine. 2019;14:4949–4960. doi:10.2147/IJN.S211014
15. Li F, Hu R, Wang B, et al. Self-microemulsifying drug delivery system for improving the bioavailability of huperzine A by lymphatic uptake. Acta Pharm Sin B. 2017;7(3):353–360. doi:10.1016/j.apsb.2017.02.002
16. Yousefpoor Y, Amani A, Divsalar A, Mousavi SE, Shakeri A, Sabzevari JT. Anti-rheumatic activity of topical nanoemulsion containing bee venom in rats. Eur J Pharm Biopharm. 2022;172:168–176. doi:10.1016/j.ejpb.2022.02.005
17. Jha SK, Chung JY, Pangeni R, et al. Enhanced antitumor efficacy of bile acid-lipid complex-anchored docetaxel nanoemulsion via oral metronomic scheduling. J Control Release. 2020;328:368–394. doi:10.1016/j.jconrel.2020.08.067
18. Liao H, Gao Y, Lian C, et al. Oral absorption and lymphatic transport of baicalein following drug-phospholipid complex incorporation in self-microemulsifying drug delivery systems. Int J Nanomedicine. 2019;14:7291–7306. doi:10.2147/IJN.S214883
19. Liu H, Mei J, Xu Y, et al. Improving the oral absorption of nintedanib by a self-microemulsion drug delivery system: preparation and in vitro/in vivo evaluation. Int J Nanomedicine. 2019;14:8739–8751. doi:10.2147/IJN.S224044
20. Singh Y, Meher JG, Raval K, et al. Nanoemulsion: concepts, development and applications in drug delivery. J Control Release. 2017;252:28–49. doi:10.1016/j.jconrel.2017.03.008
21. Pires PC, Fazendeiro AC, Rodrigues M, Alves G, Santos AO. Nose-to-brain delivery of phenytoin and its hydrophilic prodrug fosphenytoin combined in a microemulsion - formulation development and in vivo pharmacokinetics. Eur J Pharm Sci. 2021;164:105918. doi:10.1016/j.ejps.2021.105918
22. Hu Q, Fu X, Su Y, et al. Enhanced oral bioavailability of koumine by complexation with hydroxypropyl-β-cyclodextrin: preparation, optimization, ex vivo and in vivo characterization. Drug Deliv. 2021;28(1):2415–2426. doi:10.1080/10717544.2021.1998248
23. Chouhan P, Saini TR. D-optimal design and development of microemulsion based transungual drug delivery formulation of ciclopirox olamine for treatment of onychomycosis. Indian J Pharm Sci. 2016;78:4. doi:10.4172/pharmaceutical-sciences.1000145
24. Shah N, Seth A, Balaraman R, Sailor G, Javia A, Gohil D. Oral bioavailability enhancement of raloxifene by developing microemulsion using D-optimal mixture design: optimization and in-vivo pharmacokinetic study. Drug Dev Ind Pharm. 2018;44(4):687–696. doi:10.1080/03639045.2017.1408643
25. Zhang S, Huang G, Yuan K, et al. Tanshinone IIA ameliorates chronic arthritis in mice by modulating neutrophil activities. Clin Exp Immunol. 2017;190(1):29–39. doi:10.1111/cei.12993
26. Choudhary N, Bhatt LK, Prabhavalkar KS. Experimental animal models for rheumatoid arthritis. Immunopharmacol Immunotoxicol. 2018;40(3):193–200. doi:10.1080/08923973.2018.1434793
27. More SK, Pawar AP. Preparation, optimization and preliminary pharmacokinetic study of curcumin encapsulated turmeric oil microemulsion in zebra fish. Eur J Pharm Sci. 2020;155:105539. doi:10.1016/j.ejps.2020.105539
28. Hu Q, Lin H, Wang Y, et al. Design, optimization and evaluation of a microemulsion-based hydrogel with high malleability for enhanced transdermal delivery of levamisole. Int J Pharm. 2021;605:120829. doi:10.1016/j.ijpharm.2021.120829
29. Xu HY, Liu CS, Huang CL, et al. Nanoemulsion improves hypoglycemic efficacy of berberine by overcoming its gastrointestinal challenge. Colloids Surf B Biointerfaces. 2019;181:927–934. doi:10.1016/j.colsurfb.2019.06.006
30. Artursson P, Karlsson J. Correlation between oral drug absorption in humans and apparent drug permeability coefficients in human intestinal epithelial (Caco-2) cells. Biochem Biophys Res Commun. 1991;175(3):880–885. doi:10.1016/0006-291X(91)91647-U
31. Nagayasu M, Ozeki K, Sakurai Y, Tsutsui H, Onoue S. Simplified method to determine the efflux ratio on P-glycoprotein substrates using three-compartment model analysis for caco-2 cell assay data. Pharm Res. 2019;37(1):13. doi:10.1007/s11095-019-2729-x
 © 2023 The Author(s). This work is published and licensed by Dove Medical Press Limited. The full terms of this license are available at https://www.dovepress.com/terms.php and incorporate the Creative Commons Attribution - Non Commercial (unported, v3.0) License.
By accessing the work you hereby accept the Terms. Non-commercial uses of the work are permitted without any further permission from Dove Medical Press Limited, provided the work is properly attributed. For permission for commercial use of this work, please see paragraphs 4.2 and 5 of our Terms.
© 2023 The Author(s). This work is published and licensed by Dove Medical Press Limited. The full terms of this license are available at https://www.dovepress.com/terms.php and incorporate the Creative Commons Attribution - Non Commercial (unported, v3.0) License.
By accessing the work you hereby accept the Terms. Non-commercial uses of the work are permitted without any further permission from Dove Medical Press Limited, provided the work is properly attributed. For permission for commercial use of this work, please see paragraphs 4.2 and 5 of our Terms.