")
Back to Journals » Neuropsychiatric Disease and Treatment » Volume 14
Cytological and cytometric analysis of oral mucosa in patients with Alzheimer’s and Parkinson’s disease
Authors Kose Ozlece H , Findik Guvendi G, Huseyinoglu N , Ehi Y, Kivrak Y
Received 21 November 2017
Accepted for publication 26 May 2018
Published 31 July 2018 Volume 2018:14 Pages 1901—1906
DOI https://doi.org/10.2147/NDT.S157731
Checked for plagiarism Yes
Review by Single anonymous peer review
Peer reviewer comments 2
Editor who approved publication: Dr Roger Pinder
Hatice Kose Ozlece,1 Gulname Findik Guvendi,2 Nergiz Huseyinoglu,1 Yusuf Ehi,3 Yuksel Kivrak4
1Department of Neurology, Acibadem Kayseri Hospital, Kayseri, Turkey; 2Department of Pathology, Medical Faculty, Kafkas University, Kars, Turkey; 3Department of Neurology, Medical Faculty, Kafkas University, Kars, Turkey; 4Department of Psychiatry, Medical Faculty, Kafkas University, Kars, Turkey
Background: Alzheimer’s disease (AD) and Parkinson’s disease (PD) are the two most common neurodegenerative diseases. Recent studies have sought to identify precursor symptoms of AD and PD that occur before the onset of the disease. We evaluated changes in the oral mucosa of patients with AD and PD using a stereological method.
Patients and methods: The study included 29 patients with AD, 30 patients with idiopathic PD, and 30 healthy volunteers. Brush biopsies were obtained from all participants, and the nucleator method was used to estimate the volume of cells obtained from the buccal mucosa.
Results: Cytomorphometric analysis revealed that the nuclear volume was 484.39±117.10 µm3 in the AD group, 509.71±132.26 µm3 in PD patients, and 509.30±100.21 µm3 in the control group. The cytoplasmic volume was 115,456.60±30,664.98 µm3 in the AD group, 103,097.93±25,034.65 µm3 in PD patients, and 109,528.45±28,381.43 µm3 in the control group. The nuclear and cytoplasmic volumes were not significantly different among groups (P>0.05).
Conclusion: The cytomorphometric analysis revealed no significant differences in the cytoplasmic and nuclear volumes of buccal cells obtained from patients with AD and PD and healthy volunteers.
Keywords: Alzheimer’s disease, Parkinson’s disease, exfoliative cytology, stereology, oral mucosa
Introduction
Alzheimer’s disease (AD), the most common cause of dementia, is characterized by an insidious onset and progressive impairment of short-term memory and other cognitive disorders linked to the degeneration of neurons in the limbic system and neocortical areas.1
Parkinson’s disease (PD) is the second most common neurodegenerative disease after AD. It is characterized by movement disorders such as rigidity, bradykinesia, postural imbalance, and unilateral resting tremor caused by the degeneration of neuromelanin-containing neurons in the ventral region of the substantia nigra pars compacta and locus coeruleus in the brain stem.2 Both diseases are chronic and progressive, and in the advanced stages, patients are completely dependent on caregivers, imposing a serious social and economic burden.3,4
AD and PD are diagnosed clinically based on detailed medical histories and thorough neurological examinations. Definitive diagnoses can only be made post mortem or by invasive biopsies to identify disease-specific pathological changes.5,6
Several recent studies have investigated various precursors of AD and PD to identify individuals at risk before the onset of symptoms. For instance, olfactory disorders, rapid-eye-movement sleep behavior disorder, and constipation are thought to be precursor symptoms of PD.6 Moreover, gastrointestinal tract biopsies have been studied for specific markers of PD.7 Although several studies have investigated changes in nasal mucosa, fibroblasts, and erythrocytes to identify precursors of AD,8–10 no specific marker of the disease has been found.
Recent studies have examined oral mucosa cells for precursors of neurological diseases because the cells are derived from ectodermal tissue and are thought to be embryologically related to the central nervous system.
A previous study found that gene expression of the tau protein was increased in the oral epithelial cells of patients with AD.11 In another study, it was determined that telomer analysis of buccal cells differed between AD stages.12 However, the morphological and cytological structure of the oral mucosa has only been analyzed in one study. In a cytological analysis of the oral mucosa of 10 AD patients, de Oliveira et al13 found an increase in the nucleus area of the buccal mucosa and cell groups in the tongue and a decrease in the nuclear/cytoplasmic area ratio. However, the authors noted that the changes they observed could have been caused by diabetes mellitus (DM) or B12, folic acid, and iron deficiencies, indicating that further study was needed to clarify their findings.
Exfoliative cytology is a readily used, noninvasive, inexpensive, and rapid procedure based on the microscopic evaluation of fixed epithelial cells.14
Several methods may be used to investigate exfoliated cells; however, stereology is one of the most reliable methods for objective morphometric and three-dimensional analyses.15
We aimed to investigate whether the oral exfoliative cytology can be a tool for early diagnosis of AD and PD.
Patients and methods
The study included 29 patients with AD diagnosed according to the National Institute of Neurological and Communicative Disorders and Stroke (NINCDS) and Alzheimer’s Disease and Related Disorders Association (ARDA)16 criteria, 30 patients with idiopathic PD diagnosed according to the Parkinson Society Brain Bank17 criteria, and 30 healthy volunteers. All patients were diagnosed at the Kafkas University Faculty of Medicine Neurology Clinic. The study was approved by the Kafkas University Local Ethics Committee and was performed in accordance with the Declaration of Helsinki. All participants provided written informed consent.
Patients who smoked; were alcohol dependent; had iron, B12, or folate deficiencies; had DM; had undergone chemotherapy or radiotherapy; or had an oral mucosa infection were excluded from the study.
The modified Hoehn and Yahr scale was used to identify the stage, and the Unified Parkinson’s Disease Rating Scale (UPDRS) was used to determine the severity of idiopathic PD. The Mini-Mental State Examination (MMSE) and Clinical Dementia Scale were used to assess the patients with AD.
Oral mucosa samples were taken from all participants after they underwent a detailed neurological examination. The oral mucosa was dried with a gauze swab; then, smears were taken from the clinically healthy buccal mucosa using a cotton swab and transferred to glass slides. The samples were immediately fixed in 95% ethyl alcohol, stained using the Papanicolaou method,18 and examined under a light microscope.
Stereological estimation of cytoplasmic and nuclear volumes
The samples were placed under a microscope with a motor-driven stage and cells were projected onto a monitor via a camera at ×200 magnification. A minimum of 200 randomly selected epithelial cells per patient were measured. The nuclear (NV) and cytoplasmic (CV) volumes were evaluated for each cell using Stereo Investigator software (MicroBrightField, Williston, VT, USA).
The volume of cells obtained from the buccal mucosa samples was estimated using the nucleator method according to the following formula:19
|

where V(n) is the number-weighted volume, l is the length of intercepts, and n is the number of nucleator estimates (Figure 1).
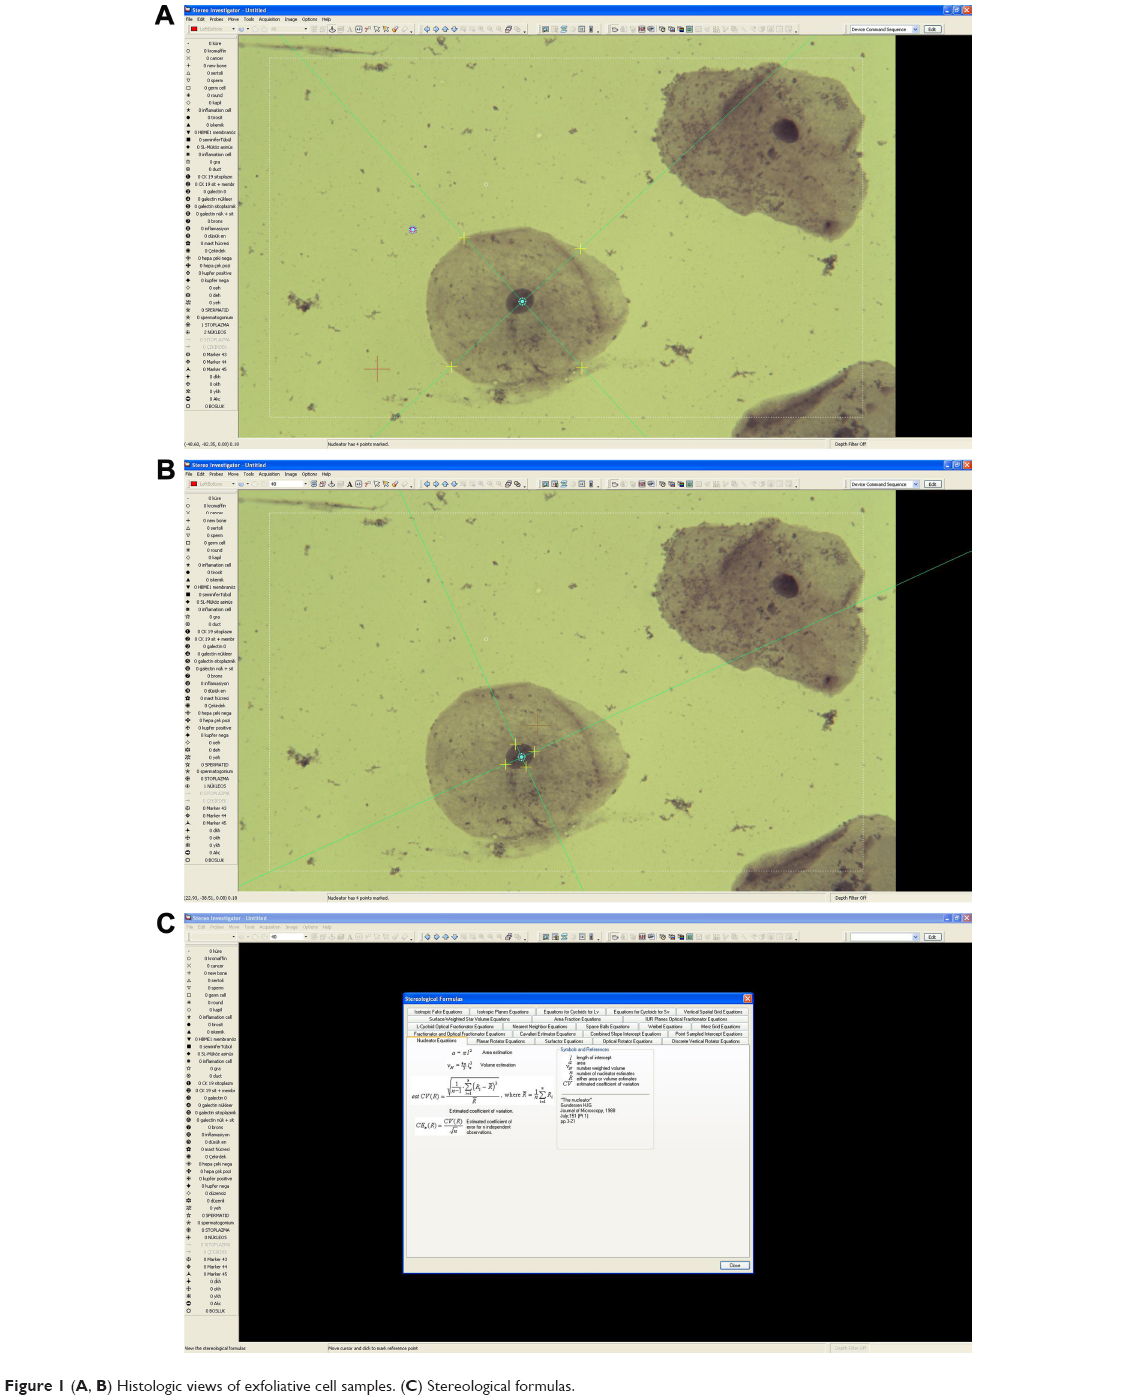 | Figure 1 (A, B) Histologic views of exfoliative cell samples. (C) Stereological formulas. |
Statistical analysis
The Statistical Package for the Social Sciences version 22.0 for Windows (IBM Corporation, Armonk, NY, USA) was used to conduct the statistical tests. The normal distribution of data was assessed using the Kolmogorov–Smirnov test, and nonparametric data were assessed using the Mann–Whitney U-test. Differences among subgroups were evaluated using the Kruskal–Wallis test. P<0.05 was deemed to indicate statistical significance.
Results
The study included 29 patients with AD (16 males, 13 females), 30 patients with idiopathic PD (16 males, 14 females), and 30 healthy controls (15 males, 15 females). The AD patient ages ranged from 60 to 89 years (mean, 78.93±7.47 years), the PD patients were aged 62–85 years (mean, 76.52±7.29 years), and the healthy controls were aged 60–88 years (mean, 79.49±8.13 years). The age and sex of the participants were not significantly different among groups (P>0.05).
In the AD group, the mean MMSE score was 14.32±4.23, and the mean Clinical Dementia Scale score was 2.59±0.68. The mean modified Hoehn and Yahr and UPDRS scores in the idiopathic PD patients were 2.41±0.53 and 101.23±8.21, respectively. The sociodemographic data of the patients are shown in Table 1.
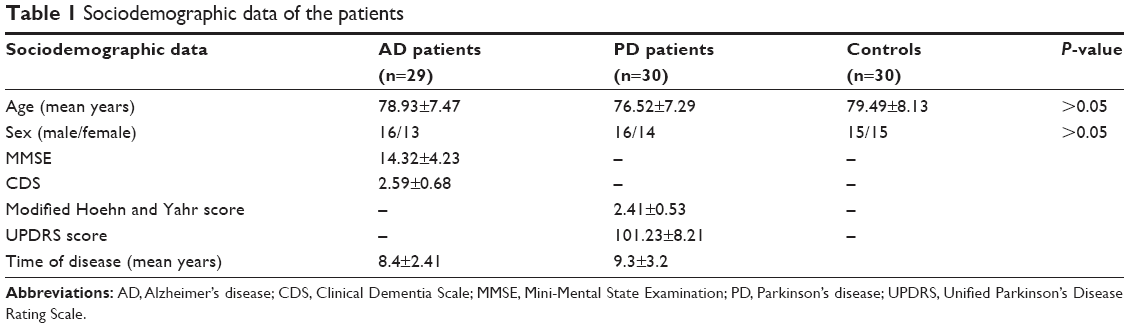 | Table 1 Sociodemographic data of the patients |
Thirteen of the 29 patients were not using any medication for the AD due to different reasons; five of them were not using medication due to various side effects, and eight of them were newly diagnosed patients (these patients had AH symptoms for at least 1 year); on the other hand, 16 of the patients were using different medications; 14 of them were using memantine+donepezil and two of them were using donepezil. There were no statistically significant differences in NV or CV between the groups with and without drug use. However, according to MMSE, the patients were grouped as mild (group 1), moderate (group 2), or severe (group 3). Since the number of severe stage patients was insufficient, they could not be included in the statistics. No significant differences among group 1, group 2, and controls in terms of NV and CV were observed. Although the NV was decreased in group 2 compared with group 1, the difference was not statistically significant (Table 2). All the patients who were diagnosed with PD had drug use. Twelve patients used only dopamine agonist, six patients received dopamine+dopamine agonist therapy, and 12 patients used only L-dopamine. According to the Hoehn and Yahr stages, patients were divided into two subgroups: group 1 (stages 1 and 2) and group 2 (stages 3 and 4). No significant differences among group 1, group 2, and controls in terms of NV and CV were observed (Table 3).
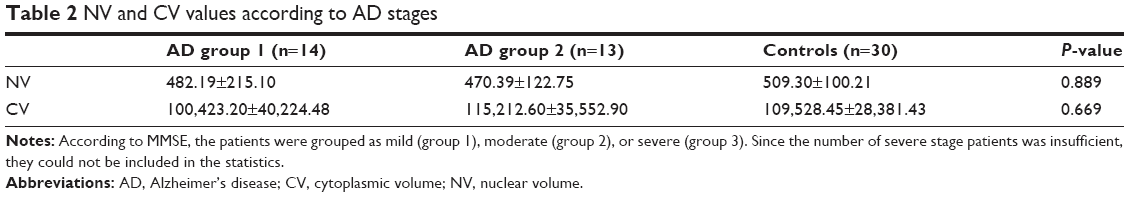 | Table 2 NV and CV values according to AD stages |
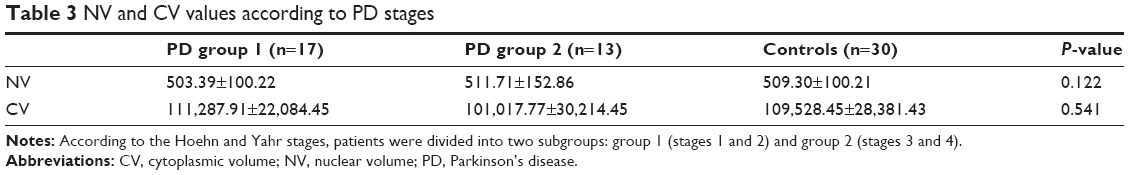 | Table 3 NV and CV values according to PD stages |
Cytomorphometric analysis revealed that the NV was 484.39±117.10 μm3 in the AD group, 509.71±132.26 μm3 in PD patients, and 509.30±100.21 μm3 in the control group. These values were not significantly different among the groups (P>0.05; Table 4).
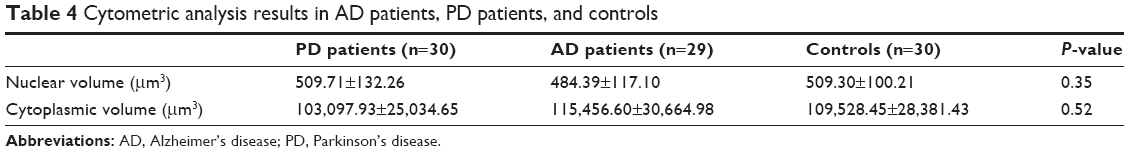 | Table 4 Cytometric analysis results in AD patients, PD patients, and controls |
Similarly, CVs were not significantly different among groups (AD patients, 115,456.60±30,664.98 μm3; PD patients, 103,097.93±25,034.65 μm3; and controls, 109,528.45±28,381.43 μm3; P>0.05).
Discussion
Our microscopic and cytomorphometric analyses of buccal cells in patients with AD and PD, the two most common neurodegenerative diseases, and healthy volunteers revealed no differences in NV or CV among groups.
Exfoliative cytology has been used for the screening and the early diagnosis of malignancies for several years.20 Buccal mucosa cells, in particular, are readily obtained using this inexpensive, noninvasive procedure, which is well tolerated by patients. Stereological assessment of the buccal cells provides objective information based on mathematical and statistical principles.21 Thus, recent studies have investigated cytological changes in oral mucosa cell-associated diseases other than cancer.
Keles et al18 found a significant increase in NV and CV values in exfoliated buccal mucosa cells after renal transplant (RT). Given the increased risk of malignancy in RT recipients, the authors concluded that the observed changes may have been related to the malignant transformation of oral mucosa cells.
Previous cytomorphometric analyses performed in patients with DM have revealed an increase in NV and the nuclear/cytoplasmic area ratio in oral mucosa cells.22–24 This finding may be explained by nuclear hypertrophy, which is an adaptive response to the cellular damage caused by DM.
Buccal mucosa cells are derived from ectodermal tissue during the embryological period of development, similar to brain and skin epithelial cells.5 Thus, it may be that buccal mucosa cells reflect changes in brain tissue. Accordingly, we searched the literature for previous cytological and cytometric analyses of buccal mucosa cells in patients with AD. de Oliveira et al13 performed a cytomorphometric analysis of buccal mucosa cells in 10 AD patients and nine age-matched control patients. They found a significant reduction in intermediate cells (P<0.05) and in the nuclear/cytoplasmic area ratio (P<0.0001) in AD patients, compared with the control patients. However, the authors acknowledged that their sample size was small, and the changes observed could have been caused by type 2 DM or deficiencies in vitamin B12, folic acid, and iron. To our knowledge, no such study has been conducted in patients with PD.
Our sample size was larger than that of de Oliveira et al, and we excluded participants with DM or vitamin B12, folic acid, and iron deficiencies; nevertheless, we found no significant differences in buccal cell cytology among the AD, PD, and control groups.
Limitation
However, a limitation of our study is that we did not perform analyses according to buccal cell types.
Conclusion
In our study, we could not reach a conclusion that oral cytological evaluation helped early diagnosis. Our findings suggest that further study is needed to clarify the effect of neurodegenerative diseases on buccal mucosa cells, and whether such changes are useful clinical predictors of neurodegenerative disease.
Acknowledgment
The paper was presented as a poster at the 51st National Neurology Congress, 27 November–3 December 2015, Antalya, Turkey.
Disclosure
The authors report no conflicts of interest in this work.
References
Thies W, Bleiler L. Alzheimer’s Association. 2011 Alzheimer’s disease facts and figures. Alzheimers Dement. 2011;7(2):208–244. | ||
Parkinson J. An essay on the shaking palsy. 1817. J Neuropsychiatry Clin Neurosci. 2002;14(2):223–236. | ||
Diem-Zangerl A, Seppi K, Oberaigner W, Poewe W. Mortality in Parkinson’s disease, a 20-year follow-up study. Mov Disord. 2010;25(5):661–662. | ||
Medina J. What you need to know about Alzheimer’s. Hong Kong: New Harbinger Publications; 1999. | ||
François M, Leifert W, Martins R, Thomas P, Fenech M. Biomarkers of Alzheimer’s disease risk in peripheral tissues; focus on buccal cells. Curr Alzheimer Res. 2014;11(6):519–531. | ||
Miller DB, O’Callaghan JP. Biomarkers of Parkinson’s disease: present and future. Metabolism. 2015;64(3 Suppl 1):S40–S46. | ||
Ruffmann C, Parkkinen L. Gut feelings about α-synuclein in gastrointestinal biopsies: biomarker in the making? Mov Disord. 2016;31(2):193–202. | ||
Hock C, Golombowski S, Müller-Spahn F, et al. Histological markers in nasal mucosa of patients with Alzheimer’s disease. Eur Neurol. 1998;40(1):31–36. | ||
Sims NR, Finegan JM, Blass JP. Altered metabolic properties of cultured skin fibroblasts in Alzheimer’s disease. Ann Neurol. 1987;21(5):451–457. | ||
Blass JP, Hanin I, Barclay L, Kopp U, Reding MJ. Red blood cell abnormalities in Alzheimer disease. J Am Geriatr Soc. 1985;33(6):401–405. | ||
Hattori H, Matsumoto M, Iwai K, et al. The tau protein of oral epithelium increases in Alzheimer’s disease. J Gerontol A Biol Sci Med Sci. 2002;57(1):M64–M70. | ||
Mathur S, Glogowska A, Mcavoy E, et al. Three-dimensional quantitative imaging of telomeres in buccal cells identifies mild, moderate, and severe Alzheimer’s disease patients. J Alzheimers Dis. 2014;39(1):35–48. | ||
de Oliveira RM, Lia EN, Guimarães RM, Bocca AL, Cavalcante Neto FF, da Silva TA. Cytologic and cytometric analysis of oral mucosa in Alzheimer’s disease. Anal Quant Cytol Histol. 2008;30(2):113–118. | ||
Kazanowska K, Hałoń A, Radwan-Oczko M. The role and application of exfoliative cytology in the diagnosis of oral mucosa pathology – contemporary knowledge with review of the literature. Adv Clin Exp Med. 2014;23(2):299–305. | ||
Unal B, Kara A, Aksak S, Unal D. A stereological assessment method for estimating the surface area of cycloids. Eurasian J Med. 2010;42(2):66–73. | ||
Mckhann G, Drachman D, Folstein M, Katzman R, Price D, Stadlan EM. Clinical diagnosis of Alzheimer’s disease: report of the NINCDS-ADRDA work group under the auspices of Department of Health and Human Services Task Force on Alzheimer’s disease. Neurology. 1984;34(7):939–944. | ||
Hughes AJ, Daniel SE, Kilford L, Lees AJ. Accuracy of clinical diagnosis of idiopathic Parkinson’s disease: a clinico-pathological study of 100 cases. J Neurol Neurosurg Psychiatry. 1992;55(3):181–184. | ||
Keles M, Caglayan F, Tozoglu U, et al. Changes in exfoliative cell of oral mucosa in kidney transplant patients. Transplant Proc. 2015;47(5):1425–1428. | ||
Gundersen HJ. The nucleator. J Microsc. 1988;151(Pt 1):3–21. | ||
Sampaio HC, Loyola AM, Gomez RS, Mesquita RA. AgNOR count in exfoliative cytology of normal buccal mucosa. Effect of smoking. Acta Cytol. 1999;43(2):117–120. | ||
Odaci E, Kaplan S, Sahin B, et al. Effects of low-dose oxcarbazepine administration on developing cerebellum in newborn rat: a stereological study. Neurosci Res Commun. 2004;34(1):28–36. | ||
Karthik KR, Malathi N, Poornima K, Prakash S, Kadhiresan R, Arunmozhi U. Evaluation of glycemic control in type 2 diabetes mellitus using cytomorphometry of buccal cells and correlation with glycosylated hemoglobin. J Int Oral Health. 2015;7(2):20–24. | ||
Gopal D, Malathi N, Reddy BT. Efficacy of oral exfoliative cytology in diabetes mellitus patients: a light microscopic and confocal microscopic study. J Contemp Dent Pract. 2015;16(3):215–221. | ||
Oz ZS, Bektas S, Battal F, Atmaca H, Ermis B. Nuclear morphometric and morphological analysis of exfoliated buccal and tongue dorsum cells in type-1 diabetic patients. J Cytol. 2014;31(3):139–143. |
 © 2018 The Author(s). This work is published and licensed by Dove Medical Press Limited. The full terms of this license are available at https://www.dovepress.com/terms.php and incorporate the Creative Commons Attribution - Non Commercial (unported, v3.0) License.
By accessing the work you hereby accept the Terms. Non-commercial uses of the work are permitted without any further permission from Dove Medical Press Limited, provided the work is properly attributed. For permission for commercial use of this work, please see paragraphs 4.2 and 5 of our Terms.
© 2018 The Author(s). This work is published and licensed by Dove Medical Press Limited. The full terms of this license are available at https://www.dovepress.com/terms.php and incorporate the Creative Commons Attribution - Non Commercial (unported, v3.0) License.
By accessing the work you hereby accept the Terms. Non-commercial uses of the work are permitted without any further permission from Dove Medical Press Limited, provided the work is properly attributed. For permission for commercial use of this work, please see paragraphs 4.2 and 5 of our Terms.