")
Back to Journals » OncoTargets and Therapy » Volume 13
Cytochrome C Oxidase Assembly Factor 1 Homolog Predicts Poor Prognosis and Promotes Cell Proliferation in Colorectal Cancer by Regulating PI3K/AKT Signaling
Authors Xue Y , Li PD , Tang XM, Yan ZH, Xia SS, Tian HP, Liu ZL, Zhou T, Tang XG, Zhang GJ
Received 28 August 2020
Accepted for publication 22 October 2020
Published 10 November 2020 Volume 2020:13 Pages 11505—11516
DOI https://doi.org/10.2147/OTT.S279024
Checked for plagiarism Yes
Review by Single anonymous peer review
Peer reviewer comments 2
Editor who approved publication: Dr Sanjay Singh
Yuan Xue,1,2,* Pei-Dong Li,1,2,* Xue-Mei Tang,3,* Zai-Hua Yan,1,2 Shu-Sen Xia,1 Hong-Peng Tian,1 Zuo-Liang Liu,1 Tong Zhou,1 Xue-Gui Tang,4 Guang-Jun Zhang1,2
1The Second Department of Gastrointestinal Surgery, The Affiliated Hospital of North Sichuan Medical College, Nanchong, Sichuan, People’s Republic of China; 2Institute of Hepatobiliary, Pancreatic and Intestinal Disease, North Sichuan Medical College, Nanchong, Sichuan, People’s Republic of China; 3Department of Ultrasound, The Affiliated Hospital of North Sichuan Medical College, Nanchong, Sichuan, People’s Republic of China; 4Anorectal Department of Integrated Traditional Chinese and Western Medicine, The Affiliated Hospital of North Sichuan Medical College, Nanchong, Sichuan, People’s Republic of China
*These authors contributed equally to this work
Correspondence: Xue-Gui Tang
Anorectal Department of Integrated Traditional Chinese and Western Medicine, The Affiliated Hospital of North Sichuan Medical College, 63 Wenhua Road, Nanchong 637000, Sichuan, People’s Republic of China
Tel +86 817 2262419
Email [email protected]
Guang-Jun Zhang
The Second Department of Gastrointestinal Surgery, The Affiliated Hospital of North Sichuan Medical College, 63 Wenhua Road, Nanchong 637000, Sichuan, People’s Republic of China
Tel +86 817 2262419
Email [email protected]
Purpose: Colorectal cancer (CRC) is one of the most common malignancies in the world. The prognosis of advanced CRC is still poor. The purpose of this study was to identify a gene expression profile associated with CRC that may contribute to the early diagnosis of CRC and improve patient prognosis.
Patients and Methods: Five pairs of CRC tissues and paracancerous tissues were used to identify causative genes using microarray assays. The prognostic value of Cytochrome C Oxidase Assembly Factor 1 Homolog (COA1) in CRC was assessed in 90 CRC patients. Loss-of-function assays, cell proliferation assays using Celigo and MTT, colony formation assays, a subcutaneous xenograft mouse model, and apoptosis assays were used to define the effects of downregulation of COA1 in CRC cells in vitro and in vivo. The underlying molecular mechanisms of COA1 in CRC were also investigated.
Results: The causative gene COA1 was identified through microarray analysis. COA1 expression in CRC was notably associated with pathologic differentiation, tumor size, and tumor depth. COA1 expression may act as an independent prognostic factor for overall survival of CRC. Knockdown of COA1 inhibited the proliferation of CRC cells in vitro and the tumorigenicity of CRC cells in vivo. Decreased COA1 expression induced apoptosis of CRC cells. Based on the microarray assay results comparing HCT116 cells transfected with lentivirus encoding anti-COA1 shRNA or negative control shRNA, ingenuity pathway analysis (IPA) revealed that the PI3K/AKT signaling pathway was significantly enriched. Moreover, CCND1, mTOR, AKT1, and MDM2 were identified as the downstream genes of COA1.
Conclusion: These findings demonstrate that COA1 promotes CRC cell proliferation and inhibits apoptosis by regulating the PI3K/AKT signaling pathway. Our results implicate COA1 as a potential oncogene involved in tumor growth and progression of CRC.
Keywords: colorectal cancer, COA1, proliferation, apoptosis, PI3K/AKT signaling
Introduction
Colorectal cancer (CRC) ranks third in terms of morbidity worldwide, but ranks second in terms of mortality.1 In 2018, newly diagnosed cases of CRC were above 1.85 million and cancer resulted in 880,792 deaths worldwide.2 By 2030, the burden of CRC worldwide is expected to increase by 60% and the death toll will exceed 1.1 million.3 Although combined chemotherapy and targeted therapies have significantly improved survival in patients with advanced CRC, the 5-year survival rate is still low.4,5 Early detection and treatment of CRC through timely screening may help reduce cancer mortality.6,7 Therefore, the discovery of specific diagnostic and prognostic biomarkers by exploring the underlying molecular mechanisms of CRC are urgently required.
COA1 is an inner mitochondrial membrane protein and is a member of the family of mitochondrial respiratory chain complex assembly factors. COA1 (also known as MITRAC15) is a component of the mitochondrial translation regulation assembly intermediate of cytochrome c oxidase complex (MITRAC), which regulates both the translation of mitochondrial encoded components and the assembly of nuclear-encoded ingredients imported in the mitochondria.8 Hence, COA1 plays an important role in maintaining the stability and integrity of mitochondria. Previous studies have reported the involvement of mitochondria in the proliferation of human cancers.9 Gogvadze et al have suggested that mitochondria have become an important target for cancer chemotherapy.10 Moreover, COA1 is regulated by miR-127-3p to mediate the pathophysiology of the giant-cell tumor of bone.11 Based on the evidence mentioned above, we hypothesized that COA1 might play an important role in CRC.
In this study, we used gene microarray analysis and high-content screening to demonstrate that COA1 expression was upregulated in CRC cells. We performed loss of function studies to verify that knockdown of COA1 inhibits the progression of CRC cells in vitro and in vivo. In addition, we explored the possible mechanisms of COA1 involvement in CRC.
Patients and Methods
Patients and Tissue Specimens
CRC tissue and matched paracancerous tissue samples were collected from 90 patients with CRC, who underwent surgery at The Affiliated Hospital of North Sichuan Medical College from February 2013 to August 2014. We also collected a group of clinical samples of 5 pairs of CRC tissues and matched paracancerous tissues for gene microarray analysis. None of the patients received pre-operative adjuvant therapy. Upon removal of the surgical specimens, all tissue samples were promptly frozen in liquid nitrogen and stored in a −80°C freezer until use. Written informed consent was obtained from all patients for participation in the study. The Medical Ethics Committee of North Sichuan Medical College approved the present study (approval no. 2020ER(A)030) and this study was conducted in keeping with the principles of the Declaration of Helsinki.
Cell Culture
Human CRC cell lines (HCT116, SW480) were obtained from GeneChem Co., Ltd (Shanghai, China). Cell lines were cultured in Dulbecco’s modified Eagle’s medium (DMEM; Corning, Shanghai, China), supplemented with 10% fetal bovine serum (FBS) at 37°C in a 5% CO2 incubator.
RNA Microarrays
Microarray assays were performed by GeneChem (Shanghai, China) to identify differentially expressed genes (DEGs) between CRC tissue samples and matched paracancerous tissues (n=5), as well as between HCT116 cells transfected with lentivirus encoding anti-COA1 shRNA (shCOA1, n=3) or negative control shRNA (shCtrl, n=3). Total RNA was extracted using the Agilent RNA 6000 Nano Kit (Agilent, Santa Clara, CA, USA). The GeneChip 3ʹIVT Express Kit (Affymetrix, CA, USA) was used to prepare amplified RNA (aRNA). The aRNA was purified and fragmented, and then hybridized it to the chip probe. After hybridization, the GeneChips were washed by GeneChip Hybridization Wash and Stain Kit (Affymetrix, CA, USA). Microarray GeneChips were scanned by GeneChip Scanner 3000 to obtained images and raw data.
High-Content Screening (HCS) for Cell Growth
The multi-parameter high-content screening method was used to evaluate the growth of cultured cells. In this study, 3 RNA interference targets were designed for each candidate gene (n=20) to ensure the knockdown efficiency. After 3 days of lentivirus infection, HCT116 cells were seeded into a 96-well plate (1500 cells per well) containing 100 μL of medium/well. After culture for an additional 1 day, the cells were automatically counted and photographed using the Celigo Image Cytometer (Nexcelom, USA) platform once a day for 5 consecutive days. After adjusted the input parameters of the analysis settings, the number of cells in the well were calculated, and the cell proliferation curve was drawn.
Lentivirus Construction, and shRNA Transfection
The full-length human sequence (GeneBank no. NM_018224) was used to design the complementary DNA sequence by Shanghai GeneChem (Shanghai, China) to establish the short hairpin RNA (shRNA) target site of COA1. The targeting sequence of anti-COA1 shRNA (shCOA1) was GGGGGCTTTGCCATTGTGTAT. The targeting sequence of the negative control shRNA (shCtrl) was TTCTCCGAACGTGTCACGT. HCT116 and SW480 cells were transfected with shCtrl lentivirus or shCOA1 lentivirus at a multiplicity of infection (MOI) of 10 in accordance with the manufacturer’s protocol. Forty-eight hours post-infection, the cells were observed under a fluorescence microscope (Olympus, Tokyo, Japan) to detect the presence of a green fluorescent protein (GFP) marker as a screen of transfected cells under puromycin selection. Real-time quantitative polymerase chain reaction (RT-qPCR) and Western blotting were used to identify the efficiency of gene knockdown.
Real-Time Quantitative Polymerase Chain Reaction
The total RNA Isolation Reagent (Pufei Biotech, Shanghai, China) was used to extract the total RNA from cells and tissue samples. First-strand cDNA was synthesized using the Promega M-MLV kit (Promega, Beijing, China) according to the manufacturer’s protocol. Subsequently, RT-qPCR was performed using the SYBR Master Mixture (Takara Bio Group, Japan), which was amplified and analyzed using the Roche LightCycler 480II real-time PCR system (Roche, Basel, Switzerland). GAPDH was used as internal control. Relative quantitative analysis was performed with the 2 − ΔΔ Ct method as described previously.12 The primers used in this study are summarized in Table 1.
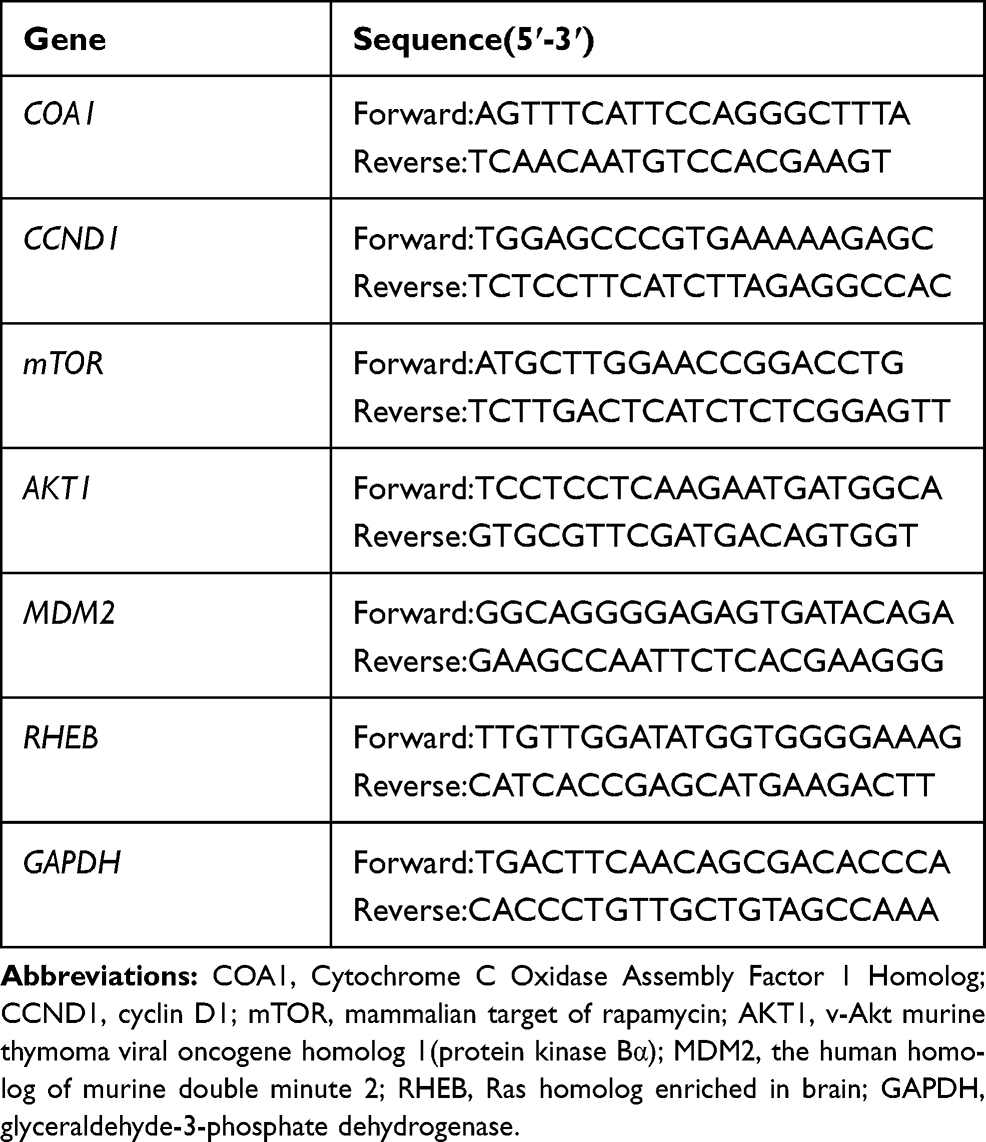 |
Table 1 The Primer Sequences for RT-qPCR in This Study |
Western Blotting Analysis
RIPA lysis buffer (Beyotime, China) was used to extract the proteins from HCT116 and SW480 cells transfected with shCtrl (Negative Control shRNA) or shCOA1 (anti-COA1 shRNA). Protein was quantified using the BCA kit (Beyotime Institute of Biotechnology). Before being transferred to PVDF membrane, equal amounts of protein (20 µg/lane) were loaded onto a 10% SDS-PAGE minigel. The membrane was blocked using 5% nonfat milk and primary antibodies were incubated with the membrane at 4°C overnight. The primary antibodies used were as follows: rabbit anti-COA1 antibody (dilution rate 1:500, Atlas Antibodies, Stockholm, Sweden), rabbit anti-CCND1 antibody (1:1000, CST, California, USA), rabbit anti-mTOR antibody (1:1000, CST, California, USA), rabbit anti-AKT1 antibody (1:1000, CST, California, USA), rabbit anti-MDM2 antibody (1:100, Abcam, Cambridge, USA), and rabbit anti-RHEB antibody (1:500, Abcam, Cambridge, USA). After washing the membranes with tris buffered saline tween (TBST), the goat anti-rabbit (1:2000, Santa Cruz, CA, USA) were incubated with the membranes. Subsequently, signals of Western blot were detected using Pierce™ ECL Western Blotting Substrate (Thermo Scientific). GAPDH was used as the internal reference.
Cell Proliferation Assay
MTT and Celigo assays were used to measure the cell growth. For MTT and Celigo assays, transduced cells were seeded into 96-well plates at a concentration of 2000 cells/well, and then incubated at 37°C and 5% CO2 for 5 days. The number of cells were counted each day using the Celigo Image Cytometer (Nexcelom, USA). At 1, 2, 3, 4, or 5 days post-infection, the cells were incubated with 5 mg/mL MTT (Genview, Beijing, China) at a final concentration of 0.5mg/mL. After incubation at 37°C for 4 h, the supernatant was removed. Subsequently, 100 μL of dimethyl sulfoxide (DMSO; Corning, Shanghai, China) was added to each well, and the absorbance was measured at 490 nm on a microplate reader (Tecan Infinite, Männedorf, Switzerland).
Cell Apoptosis Assay
Cell apoptosis was assessed by flow cytometry (FCM). The Annexin V Apoptosis Detection kit APC (eBioscience, San Diego, CA, USA) was used as the apoptosis assay. After transfection, HCT116 or SW480 cells were seeded in 6-well plates. The cells were collected when the plate confluence was about 70%. After centrifugation for 5 minutes at 1300 rpm, D-Hanks solution, pre-cooled at 4°C, was used to wash cells, which were then washed again with 1× binding buffer. Subsequently, the cells were resuspended using 200 µL 1× binding buffer, and stained with Annexin V in the dark at room temperature for 15 minutes. After adding 600 µL 1× binding buffer, the Guava easyCyte HT Flow cytometer (Millipore, USA) was used to for data acquisition and analysis.
Colony Formation Assay
For colony formation assays, transfected cells were plated in 6-well plates (800 cells/well), then maintained in complete medium, which was refreshed every 3 days. After a 14-day culture, 4% paraformaldehyde was used to fix transfected cells for 45 min, cells were then washed in PBS, and stained with 1% crystal violet for 20 min. The cells were then washed with ddH2O several times, before counting the number of colonies.
Xenograft Mouse Model
ShangHai Slac Laboratory Animal Co., Ltd (ShangHai, China) provided a total of 10 female BALB/c nude mice. HCT116 cells transfected with lentivirus expressing shCOA1 (anti-COA1 shCOA1) or shCtrl (Negative Control shRNA) were injected subcutaneously into the right flanks of nude mice. Calipers were used to measure the width (W) and length (L) of tumors every 3 days. The calculation of the tumor volume (V) was measured by the formula: Volume=(length×width2)/2. When the experiment ended, the animals were euthanized, and the xenografts were excised, weighed, and imaged. The animal studies were approved by the Committee on the Ethics of Experimental Animal studies of North Sichuan Medical College. All animal experiments were performed in accordance with the National Institutes of Health guidelines for the care and use of laboratory animals.
Ingenuity Pathway Analysis
To identify any pathways that were significantly enriched, an integrated online analysis software ingenuity pathway analysis (IPA) was used for pathway enrichment analysis (https://www.qiagenbioinformatics.com/products/ingenuity-pathway-analysis/).
Statistical Analysis
In this study, data for each group was expressed as mean ± standard deviation (SD). Each set of experiments were carried out at least in triplicate. Statistical analyses were performed with SPSS version 23.0 statistical software (IBM, Chicago, IL, USA). The differences between two groups were analyzed using the Student’s t-test, and the chi-square test was used to analyze the categorical variables. The Kaplan-Meier method was used to analyze the postoperative survival rate of patients with CRC, and the differences in survival rates were evaluated using the Log rank test. Univariate and multivariate analysis were performed using the Cox proportional hazard regression model to assess the significance of the relevant covariates. A P-value <0.05 was considered statistically significant.
Results
COA1 Was Identified as a Potential Regulatory Gene That Accelerates Cell Proliferation in CRC
To explore DEGs involved in the progression of CRC, we collected five matched pairs of CRC tissues and adjacent mucosal tissues for the mRNA microarray analysis. Compared to the normal group, 608 DEGs (screening condition: P-value<0.05 and log2 fold-value change of ≥2) were identified in the cancer group, of which 366 were upregulated, and 242 were downregulated. To identify causative genes, we selected 20 upregulated genes (Figure 1A) for high-content screening. The potential relationship between these 20 genes and cancer has not been widely reported. We silenced the 20 candidate genes in HCT116 cells to identify their potential impact on the proliferation of CRC cells in vitro. Downregulation of COA1 in HCT116 cells had the most significant inhibitory effect on cell proliferation compared with other candidate genes (Figure 1B). As shown in Figure 1C, the shCOA1 (anti-COA1 shRNA) group exhibited a significant inhibition in cell proliferation compared to the shCtrl (negative control shRNA) group. Thus, we focused on COA1 in subsequent studies.
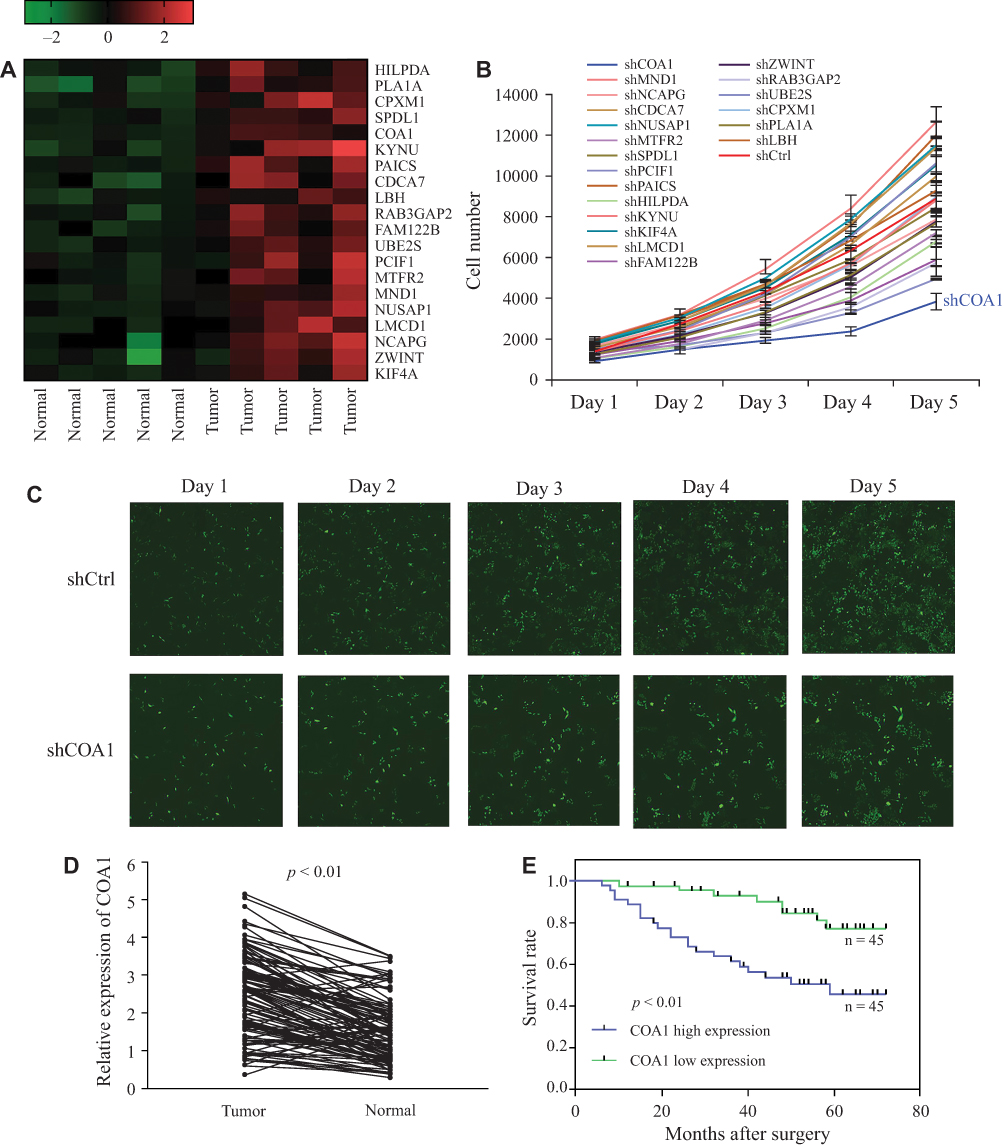 |
Figure 1 COA1 was identified as a colorectal cancer (CRC)-associated gene. (A) Heatmap of differential expression of 20 candidate genes in paired normal and cancer tissues, high expression is indicated in red and low expression indicated in green. (B) Twenty candidate genes were silenced in HCT116 cells to detect the potential impact on the proliferation of CRC cells. (C) Representative fluorescent images of the negative control shRNA (shCtrl) group and anti-COA1 shRNA (shCOA1) group. (D) The expression of COA1 in matched tumor tissues and adjacent tissues. (E) Kaplan–Meier survival curves of patients with CRC based on COA1 expression status. The green line represents the group with low expression of COA1, while the blue line represents the group with high expression of COA1. |
Correlation Between COA1 Expression and Clinicopathological Factors of CRC Patients
In order to analyze the relationship between COA1 and the clinicopathological characteristics of CRC, we measured COA1 expression by RT-qPCR in 90 CRC tissue samples. The results showed that COA1 expression in tumor tissues was significantly higher than that in normal tissues (P<0.01, Figure 1D). Based on the median expression of COA1, our cohort of patients (n=90) with CRC were stratified into two groups. As summarized in Table 2, the expression of COA1 in CRC was significantly associated with pathologic differentiation (P=0.012), tumor size (P=0.003), and tumor depth (P=0.033). However, the expression of COA1 was not correlated with age (P=0.371), sex (P=0.664), lymph node metastasis (P=0.057), or tumor site (P=0.822) in CRC patients.
 |
Table 2 Correlation Between COA1 Expression and Clinicopathological Factors of Patients with CRC |
In addition, we found that the expression of COA1 was associated with the prognosis of CRC patients. The results of the Kaplan-Meier method and Log rank test showed that CRC patients with high COA1 expression had shorter overall survival (OS) than those with low COA1 expression (Figure 1E). Univariate analysis using the Cox proportional hazards model identified five prognostic factors: pathologic differentiation, tumor size, tumor depth, lymph node metastasis, and COA1 expression (Table 3). Further multivariate analysis revealed that COA1 expression (P<0.05, Table 3) might be an independent prognostic factor for OS in CRC.
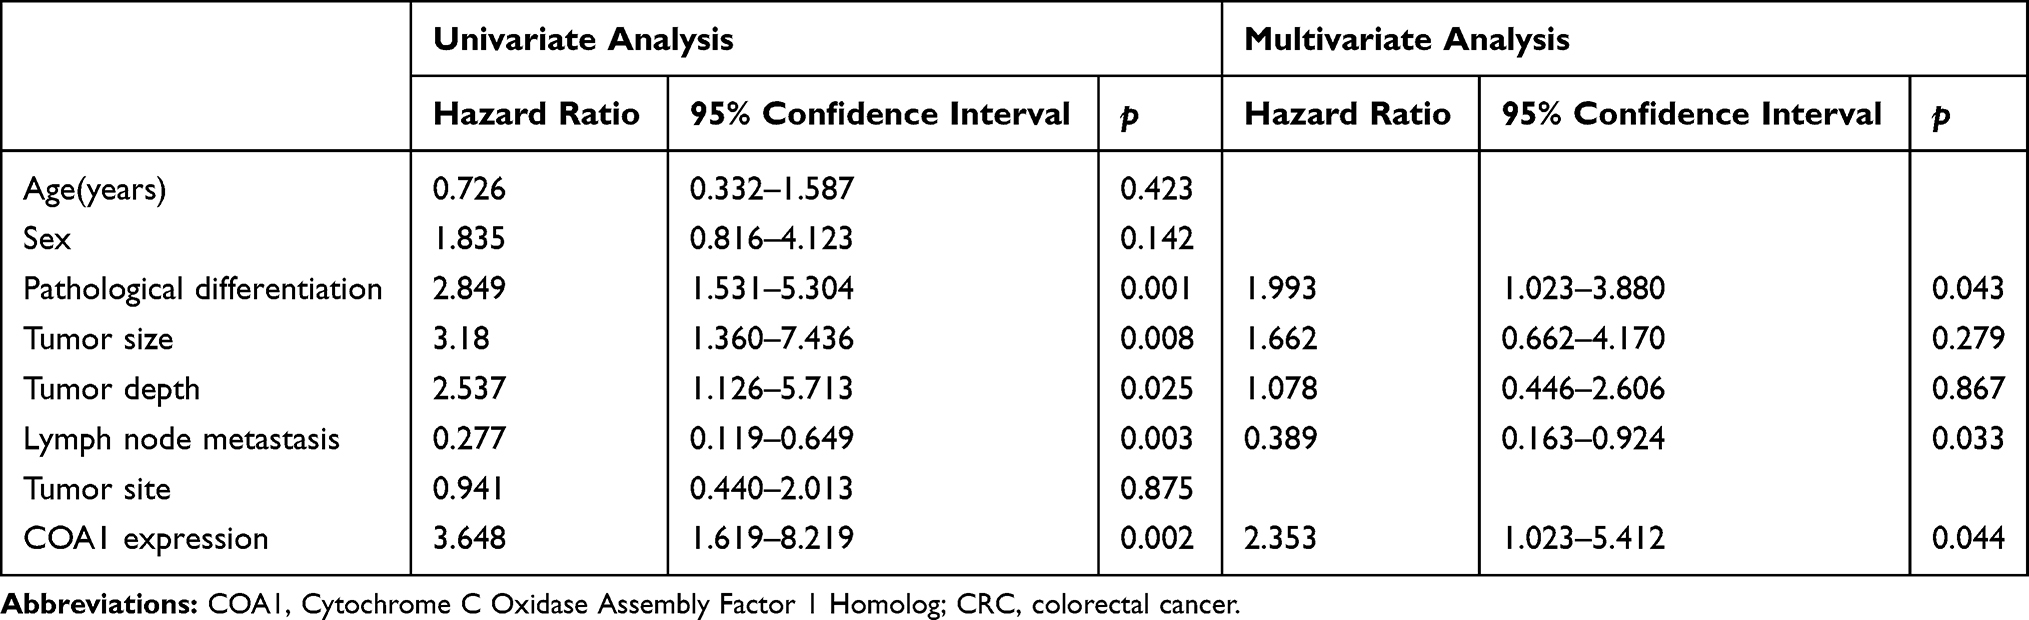 |
Table 3 Univariate and Multivariate Analyses of Cox Proportional Hazard Model for Prognosis of CRC |
Knockdown of COA1 Suppressed CRC Cell Proliferation in vitro
To further examine the functions of COA1 in CRC development, stable knockdown of COA1 expression in HCT116 and SW480 cell lines was established using a lentiviral delivery system. As shown in Figure 2A, RT-qPCR evaluation showed that the COA1 mRNA expression of the shCOA1 group was markedly lower than that of the shCtrl group both in HCT116 (p<0.01) and SW480 (p<0.01) cell lines. Moreover, Western blotting was used to confirm the efficiency of shCOA1 knockdown at the protein level (Figure 2B). After infection with shCOA1 or shCtrl, Celigo and MTT assay revealed that decreased COA1 significantly reduced the HCT116 cell and SW480 cell numbers on days 4 and 5 (Figure 2C and D).
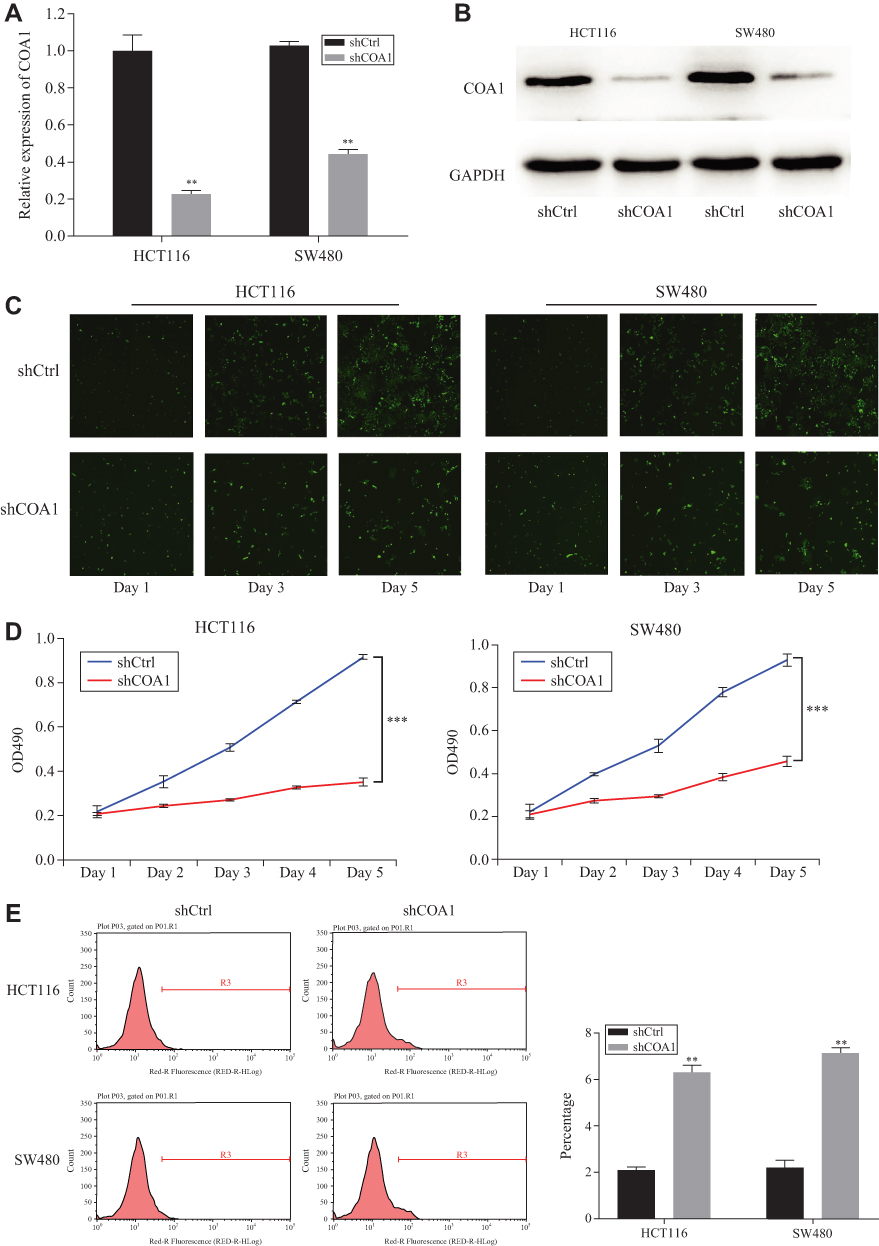 |
Figure 2 The effect of COA1 knockdown on colorectal cancer (CRC) cell proliferation and apoptosis. (A) RT-qPCR and (B) Western blotting was used to detect the expression of COA1 in HCT116 and SW480 cells transfected with negative control shRNA (shCtrl) lentivirus or anti-COA1 shRNA (shCOA1) lentivirus. (C) Representative fluorescence images of shCOA1 group and shCtrl group with HCT116 and SW480 cells by Celigo assay for 5 days. (D) Effect of COA1 knockdown on CRC cell proliferation by MTT assay. (E) Effect of COA1 knockdown on CRC cell apoptosis by flow cytometry. The results represent mean±standard deviation (SD) of three separate experiments. **P<0.01, ***P<0.001. |
Knockdown of COA1 Promotes CRC Cell Apoptosis
To further investigate whether COA1 expression affects the apoptosis of CRC cells, we assessed apoptosis using Annexin V staining followed by flow cytometry. We observed that the apoptosis of HCT116 cells and SW480 cells in the shCOA1 group was significantly increased compared with the shCtrl group (Figure 2E). The expression of COA1 had a significant impact on the apoptosis of CRC cells. These results suggested that knockdown of COA1 significantly inhibited the proliferation of CRC cells.
Knockdown of COA1 Suppressed the Colony-Formation Capacity of CRC Cells and Tumorigenicity of CRC in vivo
The colony formation assay was used to evaluate the ability of colony formation following COA1 knockdown. The results suggested that COA1 inhibition significantly suppressed the colony-formation capacity of CRC cells (Figure 3A). To further investigate the contribution of COA1 in vivo, we constructed a subcutaneous xenograft mouse model. As shown in Figure 3B and C, the xenograft tumor volume of the shCOA1 group was significantly reduced compared with the shCtrl group. Accordingly, the average tumor weight of the COA1 knockdown group was markedly lower than that of control group (Figure 3D). Hence, these results indicated that silencing COA1 suppressed CRC cell growth.
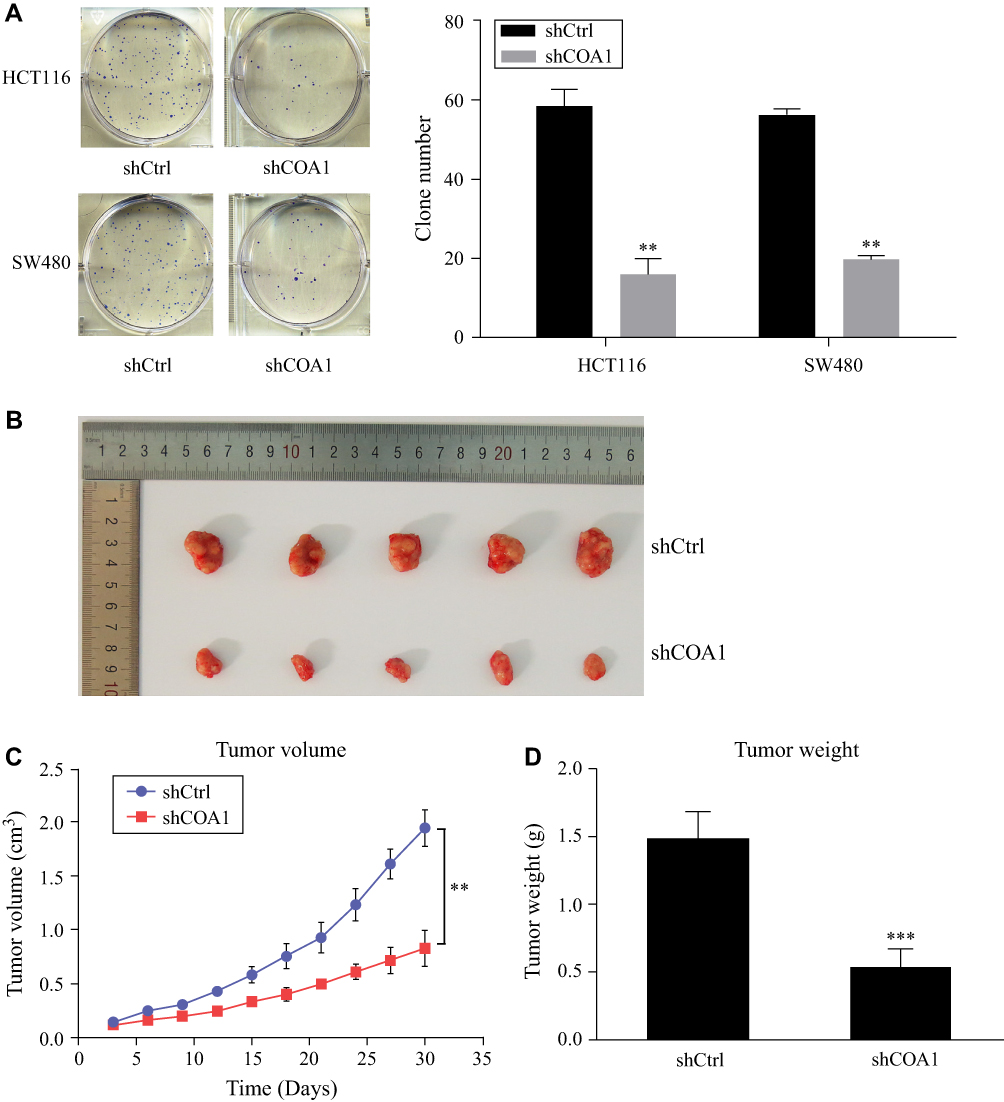 |
Figure 3 The effect of COA1 knockdown on colorectal cancer (CRC) cell growth. (A) The colony-formation capacity of HCT116 and SW480 cells transfected with negative control shRNA (shCtrl) lentivirus or anti-COA1 shRNA (shCOA1) lentivirus. (B) Representative images of excised tumors between the shCtrl group and shCOA1 group. (C) The volumes of tumors were measured at the appointed time. (D) Comparison of the average weight of tumors between the two groups at the end of the experiment. **P<0.01, ***P<0.001. |
Comparison of DEGs in shCOA1-Transfected HCT116 Cells with Controls
After transfection with shCOA1 or shCtrl as a negative control, HCT116 cells were harvested for subsequent microarray assay. The values of |log2(Fold Change)|≥1.3 and FDR<0.05 were used to identify the DEGs. A total of 437 upregulated genes and 356 downregulated genes were identified. Hierarchical clustering was performed for the shCOA1 and shCtrl groups, red and green represent upregulated and downregulated DEGs, respectively in Figure 4A.
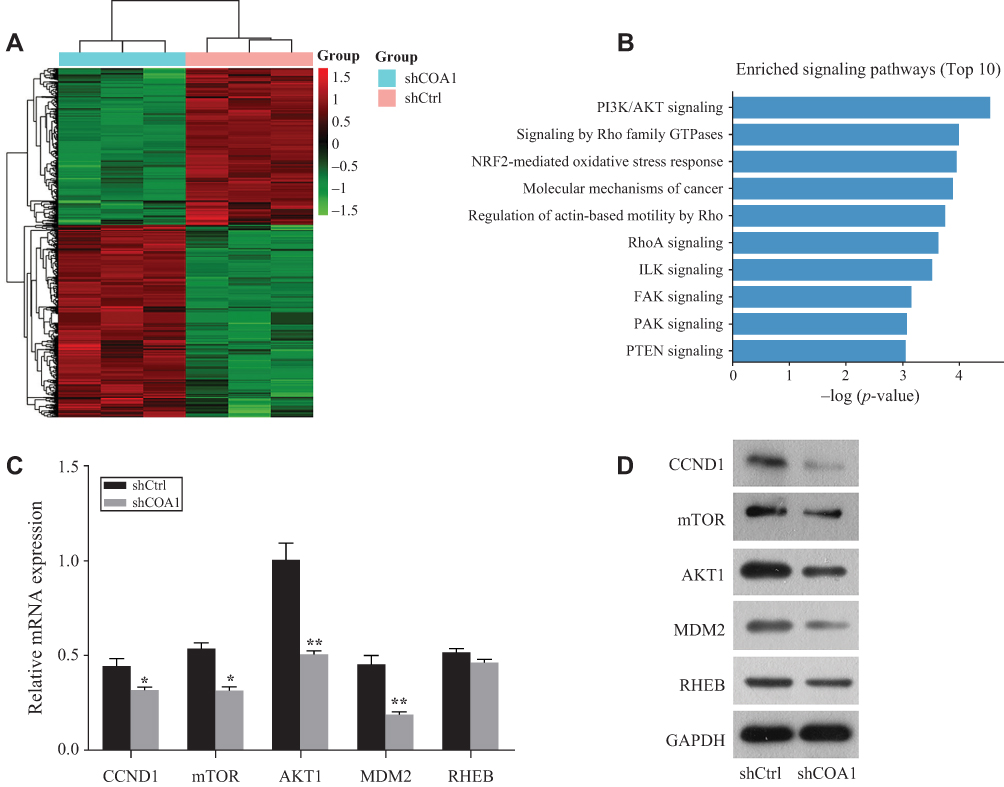 |
Figure 4 COA1 functions as an oncogene in colorectal cancer (CRC) by regulating the PI3K/AKT signaling pathway. (A) Differentially expressed genes (DEGs) between HCT116 cells transfected with anti-COA1 shRNA (shCOA1) or negative control shRNA (shCtrl) are identified by microarray assay (screening conditions of log2≥1.3 and FDR <0.05). (B) The pathway enrichment analysis of differentially expressed genes by IPA (ingenuity pathway analysis) software shows the top 10 enriched tumor-related signaling pathways. RT-qPCR (C) and Western blotting (D) show the relative expression of CCND1, mTOR, AKT1, MDM2, and RHEB in transduced HCT116 cells. *P<0.05, **P<0.01. |
IPA Analysis Indicated DEGs Were Enriched in Several Signaling Pathways
To explore the roles and molecular functions of DEGs in regulating signaling pathways, we performed pathway enrichment analysis using an integrated online analysis software IPA. Figure 4B shows the top 10 enriched tumor-related signaling pathways associated with the downregulation of COA1. IPA revealed that the PI3K/AKT signaling pathway, which enriched a total of 15 genes (Supplementary Table S1), and was the most markedly DEGs of the top 10 identified pathways (Figure 4B).
Knockdown of COA1 Regulated the Expression of CCND1, mTOR, AKT1, and MDM2
Based on the results of the microarray assay and pathway enrichment analysis, we predicted that 5 genes (CCND1, mTOR, AKT1, MDM2, and RHEB) involved in PI3K/AKT signaling might be the downstream targets of COA1. To explore the mechanism of COA1 in CRC proliferation, we evaluated the expression of CCND1, mTOR, AKT1, MDM2, and RHEB. Knockdown of COA1 reduced the expression of CCND1, mTOR, AKT1, and MDM2 both at mRNA and protein levels (Figure 4C and D), but there were no significant differences in RHEB expression.
Discussion
An effective approach to improving the overall prognosis of CRC is to screen for early diagnosis of CRC in high-risk populations and to identify potential targets for controlling early development of CRC.13 Colonoscopy is the gold-standard method for CRC screening.14 However, the beneficial effects of colonoscopy to detect early CRC during screening is limited by the cumbersome bowel preparation required and the invasiveness of the procedure. Hence, identification of new potential biomarkers to guide diagnosis, treatment, and prognosis for CRC patients is urgently needed.15
In this study, we found that COA1 is a CRC-associated gene using microarray assays and high-content screening. COA1, also known as MITRAC15, is a member of the MITRAC family of genes which contains a total of 61 members. COA1 is required for mitochondrial respiratory chain complex I (coenzyme Q oxidoreductase) and complex IV (Cytochrome c oxidase) assembly.16,17 Inherited variation in mitochondrial genes may influence cancer development through changes in the expression of mitochondrial proteins.18 The accumulated evidence demonstrates that complex I and complex IV are closely related to CRC.19,20 Moreover, COA1 is necessary for coordinating COX1 (a subunit of complex IV) translation and cofactor assembly of this subunit.21 Complex IV is a critical enzyme that controls mitochondrial respiration and has been associated with cell apoptosis.22 CRC arises in a field of crypts with abnormal expression of COX1.23 This evidence suggests that COA1 may play an important role in CRC.
The present study suggested that COA1 expression in CRC was significantly associated with pathological differentiation, tumor size, and tumor depth. However, our study did not identify any significant correlation between COA1 expression and lymph node metastasis. Further, our results indicated that COA1 might be involved in CRC progression, and especially in the process of cell proliferation. Subsequently, we demonstrated that downregulation of COA1 could significantly suppress proliferation and promote apoptosis of CRC cells. More importantly, our study demonstrated that COA1 expression was significantly associated with the OS of CRC patients. Kaplan-Meier analysis showed that high COA1 levels were a marker of poor prognosis for patients with CRC. Moreover, Cox regression analysis indicated that COA1 was an independent prognostic factor for OS of CRC patients. Thus, it may serve as a prognostic marker for CRC patients to determine higher risk of death.
In order to understand the underlying mechanism of COA1 activity in CRC, microarray assay was carried out to identify the DEGs between HCT116 cells transfected with lentivirus encoding anti-COA1 shRNA or negative control shRNA. Subsequent, the IPA analysis of DEGs revealed that COA1 was associated with many tumor-related pathways, including the PI3K/AKT signaling pathway. The PI3K/AKT signaling pathway mediates signal transduction and is involved in many biological processes such as cell proliferation, apoptosis, differentiation, and invasion.24 Aberrations of components at the epigenetic, transcriptional, and translational level have been reported to activate PI3K/AKT signaling and contribute to colorectal carcinogenesis.25
IPA confirmed that a total of 15 genes were enriched in the PI3K/AKT signaling pathway, many of these DEGs, including CCND1, mTOR, AKT1, MDM2, and RHEB, have been confirmed to be associated with proliferation and regulation of the cell cycle of CRC cells. We therefore selected 5 genes for further investigation. CCND1 is a cell cycle family protein and plays an important role in cell cycle progression by regulating G1 to S-phase transition.26 Downregulation of CCND1 may repress the progression of CRC.27 mTOR is an atypical serine/threonine protein kinase that belongs to the PI3K family and serves as a downstream effector of the PI3K/Akt pathway signaling to regulate cellular functions.28 The activation of mTOR accelerates cell growth and proliferation, and the inhibition of mTOR limits cell growth. mTOR functions as an oncogene and is frequently upregulated in many cancers.29 Zhang et al demonstrated that mTOR is overexpressed in CRC tissue, and silencing of mTOR decreases proliferation and promotes the apoptosis of CRC cells, as well as induces cell-cycle arrest.30 AKT1 is essential for cell survival, and overexpression of AKT1 has been observed in certain human cancers, such as gastric cancer, thyroid, and breast cancer.31 Some tumor suppressors (such as P53, miR-422a) may inhibit CRC progression by downregulating AKT1 expression.32,33 MDM2 is known as an oncogene. The major function of MDM2 is to negatively regulate p53 via ubiquitination of p53 for proteasomal degradation, by decreasing p53 protein levels, by inhibiting the transcriptional activity of p53, and by negatively regulating of p53 translation.34 A previous study showed that MDM2 gene amplification was observed in 19 human tumor types.35 As an oncogene, MDM2 is significantly correlated with CRC. Yu et al reported that downregulation of MDM2 expression inhibits CRC cell growth.36 Knockdown of RHEB can inactivate the mTOR signaling pathway, and thereby inhibits the proliferation and differentiation of CRC cells, while promoting apoptosis.37 Our results confirmed that loss of COA1 reduced the expression of CCND1, mTOR, AKT1, and MDM2 in CRC cells both at protein and mRNA levels. Overall, these findings suggest the potential mechanisms of COA1 in CRC tumor progression involve the regulation of the PI3K/AKT signaling pathway through CCND1, mTOR, AKT1, and MDM2.
To our knowledge, this is the first study to demonstrate the biological function of the COA1 gene in human CRC. However, the precise molecular mechanisms involving COA1 in CRC require further studies. In addition, the number of samples in the present study was relatively small, and a large of sample prospective studies is necessary to assess the clinical significance of COA1.
Conclusion
The present study indicates that COA1 promotes CRC cell proliferation and inhibits apoptosis by regulating the PI3K/AKT signaling pathway. COA1 may serve as a specific biomarker and a potential therapeutic target for CRC.
Abbreviations
CRC, colorectal cancer; COA1, Cytochrome C Oxidase Assembly Factor 1 Homolog; IPA, ingenuity pathway analysis; DEGs, differentially expressed genes; HCS, high-content screening.
Funding
This study was supported by the Scientific and Technological Cooperation Project of Nanchong City (18SXHZ0577, 19SXHZ0283), the Key Scientific Project of Sichuan health and Health Committee (19ZD005), and the Key Scientific Project of The Affiliated Hospital of North Sichuan Medical College (2019ZD004).
Disclosure
The authors report no conflicts of interest in this work.
References
1. Bray F, Ferlay J, Soerjomataram I, et al. Global cancer statistics 2018: GLOBOCAN estimates of incidence and mortality worldwide for 36 cancers in 185 countries. CA Cancer J Clin. 2018;68(6):394–424. doi:10.3322/caac.21492
2. Sharma R. An examination of colorectal cancer burden by socioeconomic status: evidence from GLOBOCAN 2018. EPMA J. 2020;11:95–117. doi:10.1007/s13167-019-00185-y
3. Arnold M, Sierra MS, Laversanne M, et al. Global patterns and trends in colorectal cancer incidence and mortality. Gut. 2017;66(4):683–691. doi:10.1136/gutjnl-2015-310912
4. Brenner H, Kloor M, Pox CP. Colorectal cancer. Lancet. 2014;383(9927):1490–1502. doi:10.1016/S0140-6736(13)61649-9
5. Akazawa Y, Sudo M, Furuya S, et al. Investigation of lateral lymph node dissection for rectal cancer in our department. Gan to Kagaku Ryoho. 2019;46:1537–1541.
6. Atkin WS, Edwards R, Kralj-Hans I, et al. Once-only flexible sigmoidoscopy screening in prevention of colorectal cancer: a multicentre randomised controlled trial. Lancet. 2010;375(9726):1624–1633. doi:10.1016/S0140-6736(10)60551-X
7. Balchen V, Simon K. Colorectal cancer development and advances in screening. Clin Interv Aging. 2016;11:967–976. doi:10.2147/CIA.S109285
8. Mick DU, Dennerlein S, Wiese H, et al. MITRAC links mitochondrial protein translocation to respiratory-chain assembly and translational regulation. Cell. 2012;151(7):1528–1541. doi:10.1016/j.cell.2012.11.053
9. Ahn CS, Metallo CM. Mitochondria as biosynthetic factories for cancer proliferation. Cancer Metab. 2015;3:1.
10. Gogvadze V, Orrenius S, Zhivotovsky B. Mitochondria as targets for cancer chemotherapy. Semin Cancer Biol. 2009;19(1):57–66. doi:10.1016/j.semcancer.2008.11.007
11. Herr I, Sahr H, Zhao Z, et al. MiR-127 and miR-376a act as tumor suppressors by in vivo targeting of COA1 and PDIA6 in giant cell tumor of bone. Cancer Lett. 2017;409:49–55. doi:10.1016/j.canlet.2017.08.029
12. Livak KJ, Schmittgen TD. Analysis of relative gene expression data using real-time quantitative PCR and the 2−ΔΔCT method. Methods. 2001;25(4):402–408. doi:10.1006/meth.2001.1262
13. Yang W, Shi J, Zhou Y, et al. Integrating proteomics and transcriptomics for the identification of potential targets in early colorectal cancer. Int J Oncol. 2019;55:439–450.
14. Singh H, Nugent Z, Demers AA, et al. The reduction in colorectal cancer mortality after colonoscopy varies by site of the cancer. Gastroenterology. 2010;139(4):1128–1137. doi:10.1053/j.gastro.2010.06.052
15. Barchitta B, Maugeri M, Destri D, et al. Epigenetic biomarkers in colorectal cancer patients receiving adjuvant or neoadjuvant therapy: a systematic review of epidemiological studies. Int J Mol Sci. 2019;20(15):3842. doi:10.3390/ijms20153842
16. Mick DU, Wagner K, van der Laan M, et al. Shy1 couples Cox1 translational regulation to cytochrome c oxidase assembly. EMBO J. 2007;26(20):4347–4358. doi:10.1038/sj.emboj.7601862
17. Wang C, Richter-Dennerlein R, Pacheu-Grau D, et al. MITRAC15/COA1 promotes mitochondrial translation in a ND2 ribosome-nascent chain complex. EMBO Rep. 2020;21:e48833. doi:10.15252/embr.201948833
18. Li Y, Beckman KB, Caberto C, et al. Association of genes, pathways, and haplogroups of the mitochondrial genome with the risk of colorectal cancer: the multiethnic cohort. PLoS One. 2015;10:e136796.
19. Huang Q, Chen Z, Cheng P, et al. LYRM2 directly regulates complex I activity to support tumor growth in colorectal cancer by oxidative phosphorylation. Cancer Lett. 2019;455:36–47. doi:10.1016/j.canlet.2019.04.021
20. Zhdanov AV, Andreev DE, Baranov PV, et al. Low energy costs of F1Fo ATP synthase reversal in colon carcinoma cells deficient in mitochondrial complex IV. Free Radic Biol Med. 2017;106:184–195. doi:10.1016/j.freeradbiomed.2017.02.025
21. Pierrel F, Bestwick ML, Cobine PA, et al. Coa1 links the Mss51 post-translational function to Cox1 cofactor insertion in cytochrome c oxidase assembly. EMBO J. 2007;26(20):4335–4346. doi:10.1038/sj.emboj.7601861
22. Payne CM, Holubec H, Bernstein C, et al. Crypt-restricted loss and decreased protein expression of cytochrome C oxidase subunit I as potential hypothesis-driven biomarkers of colon cancer risk. Cancer Epidemiol Biomarkers Prev. 2005;14:2066–2075. doi:10.1158/1055-9965.EPI-05-0180
23. Hewedi IH, Farid RM, Sidhom KF, et al. Differential expression of cytochrome C oxidase subunit i along the colorectal adenoma: carcinoma progression. Appl Immunohistochem Mol Morphol. 2018;26:689–696.
24. Xu F, Na L, Li Y, et al. Roles of the PI3K/AKT/mTOR signalling pathways in neurodegenerative diseases and tumours. Cell Biosci. 2020;10(1):54. doi:10.1186/s13578-020-00416-0
25. Danielsen SA, Eide PW, Nesbakken A, et al. Portrait of the PI3K/AKT pathway in colorectal cancer. Biochim Biophys Acta. 2015;1855:104–121.
26. Cao L, Zhang P, Li J, et al. LAST, a c-Myc-inducible long noncoding RNA, cooperates with CNBP to promote CCND1 mRNA stability in human cells. Elife. 2017;6. doi:10.7554/eLife.30433
27. Guo F, Xue J. MicroRNA6285p inhibits cell proliferation and induces apoptosis in colorectal cancer through downregulating CCND1 expression levels. Mol Med Rep. 2020;21:1481–1490.
28. Wang Y, Xing QF, Liu XQ, et al. MiR-122 targets VEGFC in bladder cancer to inhibit tumor growth and angiogenesis. Am J Transl Res. 2016;8:3056–3066.
29. Feng Z, Zhang H, Levine AJ, et al. The coordinate regulation of the p53 and mTOR pathways in cells. Proc Natl Acad Sci U S A. 2005;102(23):8204–8209. doi:10.1073/pnas.0502857102
30. Zhang Y-J, Dai Q, Sun D-F, et al. mTOR signaling pathway is a target for the treatment of colorectal cancer. Ann Surg Oncol. 2009;16(9):2617–2628. doi:10.1245/s10434-009-0555-9
31. Romano G. The role of the dysfunctional akt-related pathway in cancer: establishment and maintenance of a malignant cell phenotype, resistance to therapy, and future strategies for drug development. Scientifica (Cairo). 2013;2013:317186.
32. Sahlberg SH, Mortensen AC, Haglof J, et al. Different functions of AKT1 and AKT2 in molecular pathways, cell migration and metabolism in colon cancer cells. Int J Oncol. 2017;50(1):5–14. doi:10.3892/ijo.2016.3771
33. Wei WT, Nian XX, Wang SY, et al. miR-422a inhibits cell proliferation in colorectal cancer by targeting AKT1 and MAPK1. Cancer Cell Int. 2017;17:91. doi:10.1186/s12935-017-0461-3
34. Zhao Y, Yu H, Hu W. The regulation of MDM2 oncogene and its impact on human cancers. Acta Biochim Biophys Sin (Shanghai). 2014;46:180–189.
35. Momand J, Jung D, Wilczynski S, et al. The MDM2 gene amplification database. Nucleic Acids Res. 1998;26:3453–3459. doi:10.1093/nar/26.15.3453
36. Yu Y, Sun P, Sun LC, et al. Downregulation of MDM2 expression by RNAi inhibits LoVo human colorectal adenocarcinoma cells growth and the treatment of LoVo cells with mdm2siRNA3 enhances the sensitivity to cisplatin. Biochem Biophys Res Commun. 2006;339:71–78. doi:10.1016/j.bbrc.2005.10.181
37. Tian Y, Shen L, Li F, et al. Silencing of RHEB inhibits cell proliferation and promotes apoptosis in colorectal cancer cells via inhibition of the mTOR signaling pathway. J Cell Physiol. 2020;235(1):442–453. doi:10.1002/jcp.28984
 © 2020 The Author(s). This work is published and licensed by Dove Medical Press Limited. The full terms of this license are available at https://www.dovepress.com/terms.php and incorporate the Creative Commons Attribution - Non Commercial (unported, v3.0) License.
By accessing the work you hereby accept the Terms. Non-commercial uses of the work are permitted without any further permission from Dove Medical Press Limited, provided the work is properly attributed. For permission for commercial use of this work, please see paragraphs 4.2 and 5 of our Terms.
© 2020 The Author(s). This work is published and licensed by Dove Medical Press Limited. The full terms of this license are available at https://www.dovepress.com/terms.php and incorporate the Creative Commons Attribution - Non Commercial (unported, v3.0) License.
By accessing the work you hereby accept the Terms. Non-commercial uses of the work are permitted without any further permission from Dove Medical Press Limited, provided the work is properly attributed. For permission for commercial use of this work, please see paragraphs 4.2 and 5 of our Terms.