")
Back to Journals » OncoTargets and Therapy » Volume 11
Cytidine monophosphate N-acetylneuraminic acid synthetase enhances invasion of human triple-negative breast cancer cells
Authors O'Day EM, Idos GE , Hill C, Chen JW , Wagner G
Received 19 June 2018
Accepted for publication 24 August 2018
Published 11 October 2018 Volume 2018:11 Pages 6827—6838
DOI https://doi.org/10.2147/OTT.S177639
Checked for plagiarism Yes
Review by Single anonymous peer review
Peer reviewer comments 2
Editor who approved publication: Dr Leo Jen-Liang Su
Elizabeth M O’Day,1,2 Greg E Idos,3 Collin Hill,4 Joan W Chen,5 Gerhard Wagner1
1Department of Biological Chemistry and Molecular Pharmacology, Harvard Medical School, Boston, MA 02115, USA; 2Olaris Therapeutics, Cambridge, MA 02138, USA; 3Division of Gastroenterology and Liver Disease, Keck School of Medicine of University of Southern California, Los Angeles, CA 90033, USA; 4PerkinElmer, Waltham, MA 02451, USA; 5Rancho Biosciences, San Diego, CA 92127, USA
Background: Cancer cells have altered bioenergetics, which contributes to their ability to proliferate, survive in unusual microenvironments, and invade other tissues. Changes in glucose metabolism can have pleomorphic effects on tumor cells.
Methods: To investigate potential mechanisms responsible for the increased malignancy associated with altered glucose metabolism, we used an unbiased nuclear magnetic resonance spectroscopy screening method to identify glucose metabolites differentially produced in a highly malignant human triple-negative breast cancer (TNBC) cell line (BPLER) and a less malignant isogenic TNBC cell line (HMLER).
Results: N-acetylneuraminic acid (Neu5Ac), the predominant sialic acid derivative in mammalian cells, which forms the terminal sugar on mucinous cell surface glycoproteins, was the major glucose metabolite that differed. Neu5Ac was ~7-fold more abundant in BPLER than HMLER. Loss of Neu5Ac by enzymatic removal or siRNA knockdown of cytidine monophosphate N-acetylneuraminic acid synthetase (CMAS), which activates cellular sialic acids for glycoprotein conjugation, had no significant effect on cell proliferation, but decreased the ability of BPLER to invade through a basement membrane. Conversely, overexpressing CMAS in HMLER increased invasivity. TNBCs in The Cancer Genome Atlas also had significantly more CMAS copy number variations and higher mRNA expression than non-TNBC, which have a better prognosis. CMAS knockdown in BPLER ex vivo blocked xenograft formation in mice.
Conclusion: Neu5Ac is selectively highly enriched in aggressive TNBC, and CMAS, the enzyme required for sialylation, may play an important role in TNBC tumor formation and invasivity.
Keywords: triple-negative breast cancer, metabolism, invasion, cytidine monophosphate N-acetylneuraminic acid, sialic acid, NMR spectroscopy, metabolomics
Introduction
To maintain high proliferation rate, cancer cells must efficiently take up and metabolize nutrients from the environment to produce sufficient ATP to fuel rapid cell growth and synthesize cellular building blocks. Metabolic reprogramming is essential for many cancers.1,2 Cancer cells often abandon oxidative phosphorylation, switching to aerobic glycolysis, a phenomena known as “the Warburg effect.”3 Glycolysis generates lactate from glucose and produces only two molecules of ATP per glucose molecule rather than the 36 produced in oxidative phosphorylation.4 Rather than maximizing ATP output, cancer cells divert part of their glucose catabolism to biomass production.2,5 How glucose usage within cancer cells differs from that of normal cells and why altered glucose metabolism enhances malignancy are not well understood.
We used an unbiased nuclear magnetic resonance (NMR) metabolite-profiling platform to follow the metabolic fate of glucose, comparing a highly malignant human triple-negative breast cancer (TNBC) cell line (BPLER) with a less malignant isogenic TNBC cell line (HMLER) generated from the same donor. TNBCs, defined by lack of expression of the estrogen, progesterone, and HER2 receptors, are the subset of breast cancers with the worst prognosis. BPLER and HMLER cells were derived from the same normal primary breast tissue, transformed with identical genetic factors (hTERT, SV40 LT, and HRASv12).6 BPLER cells have high tumor initiating capacity. Only 50 BPLER cells are needed to form tumors in mice, compared to 1×10⁶ HMLER cells.7 BPLER has the bipotent epithelial progenitor phenotype of many basal-like TNBCs and forms tumors that resemble basal-like TNBCs histologically and by gene expression. HMLER gives rise to squamous tumors, an uncommon form of breast cancer. Thus, these two genetically well-defined, virtually isogenic cell lines offer the opportunity to pinpoint selective dependencies associated with a basal-like, poorly differentiated malignant phenotype. Based on their dramatic differences in malignancy, we hypothesized that BPLER cells might utilize glucose differently. We compared glucose metabolites in BPLER cells and HMLER cells as a way to uncover malignant pathways important for TNBC cells. We found increased production of N-acetylneuraminic acid (Neu5Ac) in BPLER cells and that Neu5Ac expression is critical for the invasivity of TNBC cells. Further we observed that inhibition of the Neu5Ac biosynthetic enzyme, cytidine monophosphate N-acetylneuraminic acid synthetase (CMAS), has anticancer activity in TNBC xenografts, suggesting that the Neu5Ac biosynthetic pathway could be potential therapeutic target for TNBC.
Methods
Cell culture
BPLER and HMLER cells were provided by R Weinberg and T Ince and grown in WIT medium (Stemgent, Cambridge, MA, USA) and used according to Harvard Medical School and Boston Children’s Hospital approval. MB468 cells were obtained from ATCC (Manassas, VA, USA) and grown in Dulbecco’s Modified Eagle’s Medium supplemented with 10% fetal bovine serum. For all transfections, BPLER cells were reverse transfected with 50 nM siRNA using DharmaFECT 1 (Dharmacon, Lafayette, CO, USA) in WIT medium. siGenome Smartpool siRNAs for human N-acetylneuraminic acid synthase (NANS; M-013399) and CMAS (M-009780) and Non-Targeting siRNA #1 (D-001210) were obtained from Thermo Fisher Scientific (Waltham, MA, USA).
NMR sample preparation
For labeling experiments, 1.5×10⁷ BPLER and HMLER cells were grown in WIT medium. Cells were washed twice with warm PBS and then incubated in OPTIMEM medium without glucose for ~30 minutes. Unlabeled or uniformly labeled 13C-glucose (Cambridge Isotope Laboratories, Cambridge, MA, USA) was added directly to the medium and cells were incubated for an additional ~2 hours. Cells were washed twice with PBS, trypsinized with Tryple Express (Invitrogen, Carlsbad, CA, USA), and counted using Trypan blue staining. Equal numbers of cells were harvested by centrifugation at 500× g for 5 minutes. Cell pellets were immediately flash frozen in liquid nitrogen and stored at −80°C until ready for analysis. Cell pellets were thawed on ice and lysed by the addition of ice cold methanol and vortexed vigorously. Equal parts of chloroform and water were added to the extract and vortexed vigorously. Extracts were incubated overnight at −20°C for phase separation. The extract mixture was centrifuged at 10,000× g for 40 minutes to complete phase separation and separate macromolecules. After centrifugation, three layers were visible. The bottom phase contained organic metabolites. The interphase layer (white clumps) contained proteins and macromolecules. The top 2/3 water:methanol layer contained water-soluble metabolites. The top layer was collected and methanol was removed under vacuum. The water metabolites were flash frozen with liquid nitrogen and lyophilized. The completely dried samples were resuspended in 250 μL D2O containing 1 mM 4,4-dimethyl-4-silapentane-1-sulfonic acid (DSS) standard (Cambridge Isotope Laboratories). Samples were run in Shigemi tubes (Bruker, Billerica, MA, USA).
NMR spectroscopy
The NMR spectra were collected on a Bruker 500 MHz spectrometer (Bruker) equipped with a cryoprobe. 2D 13C-1H heteronuclear single quantum coherence (HSQC) spectra were collected with a relaxation delay of 1 second. A total of 2,048 points with a spectral width of 4,734.9 and 13,834.3 Hz were collected in the 1H and 13C dimensions, respectively, with 128 data points. NMR data were processed using NMRPipe34 and Sparky35 to identify chemical shift resonances. Spectra were aligned and intensities scaled using resonances from the 1 mM DSS control.
Liquid chromatography–mass spectrometry
Standards of Neu5Ac were used to optimize chromatography and determine retention time using a Waters Acquity UPLC (Waters, Milford, MA, USA) coupled to an AbSciex-4000 mass spectrometer (AbSciex, Framingham, MA, USA) operating in the negative mode. Reverse-phase chromatography was performed using a Waters Acquity HSS T3 2.1×50 mm column (Waters) with 1.8 μm particle size with mobile phase A of 15 mM acetic acid, 10 mM tributylamine, 5% methanol and mobile phase B of 100% methanol. Neu5Ac was detected using multiple reaction monitoring for fragments 307.987 and 307.9170. 2-Ketobutyric acid (1 μg/mL) was used as an injection standard. About 3×10⁵ BPLER and HMLER water-soluble metabolites were prepared as for the NMR samples. Dried metabolites were dissolved in 1 mL high-performance liquid chromatography-grade water. Neu5Ac levels were measured using 10 μL injections.
Fluorescence microscopy
A total of 10,000 BPLER and HMLER cells were grown on glass cover slips, washed with warm PBS and fixed with 4% paraformaldehyde for 20 minutes at room temperature. Cells were washed twice and incubated with rhodamine-labeled wheat germ agglutinin (WGA) (Vector Laboratories, Burlingame, CA, USA) in PBS at a 1:1,000 dilution for 10 minutes. Cells were washed five times with PBS then mounted onto slides. Images were acquired using a Zeiss Axiovert 200M fluorescent microscope (Carl Zeiss AG, Oberkochen, Germany).
Invasion assays
Cells were trypsinized and added (1.25×10⁵ cells/well) in WIT medium to three wells of BD BioCoat™ Matrigel Invasion Chambers (BD Biosciences, Franklin Lakes, NJ, USA). WIT medium containing 10% fetal calf serum was added to the lower chamber. The invasion chambers were processed 24 hours later as per the manufacturer’s protocols. Invading cells were stained with crystal violet. Five random fields from each of the triplicate invasion assays were counted using phase contrast microscopy.
Neuraminidase treatment
Cells were trypsinized and added (1.25×10⁵ cells/well) in WIT medium to three wells of BD BioCoat™ Matrigel Invasion Chambers (BD Biosciences) with 2 units of neuraminidase (New England Biolabs, Ipswich, MA, USA). The number of invading cells were stained with crystal violet and processed as for the invasion assays.
Cell viability
Cell viability was assessed using a CellTiterGlo kit (Promega, Madison, WI, USA) according to the manufacturer’s protocol. Chemiluminescence was measured using a BioTek Synergy 2 Multi-Detection Microplate Reader (BioTek Instruments, Inc., Winooski, VT, USA).
RNA analysis
Total RNA was extracted with Trizol (Invitrogen) and cDNA prepared from 1 μg total RNA using Thermoscript RT kit (Invitrogen) as per the manufacturer’s instructions. About 2.5 μL of diluted cDNA (1:20) was used as template for quantitative PCR using Power Sybr-Green Master Mix (Applied Biosystems, Foster City, CA, USA) and BioRad C1000 Thermal Cycler (BioRad, Hercules, CA, USA). Relative CT values were normalized to β-actin and converted to a linear scale using the −ΔCT method.
Western blot
Protein lysates were prepared using RIPA buffer (150 mM NaCl, 1.0% NP-40, 0.5% sodium deoxycholate, 0.1% SDS, 50 mM Tris pH 8.0, containing Complete Mini-protease Inhibitor Cocktail [Roche, Basel, Switzerland]). Protein concentration was determined using the BioRad DC Protein Assay Kit (BioRad) and samples were resolved on 10% SDS-PAGE gels and transferred using a Trans-Blot® SD Semi-Dry Transfer Cell (BioRad). Blots were probed with antibodies to NANS (Abcam mouse pAb ab88899; Abcam, Cambridge, UK), CMAS (Abcam mouse mAb ab57454; Abcam), and α-tubulin (Sigma mouse mAb clone B-5-1-2; Sigma, St Louis, MO, USA). Antibodies were diluted in 5% milk in TBS-T and incubated overnight at 4°C. Secondary mouse HRP-conjugated antibodies were from Amersham (Little Chalfont, UK). Protein signal was detected using the ECL Plus kit (Amersham).
Stably knocked down cell lines
To generate cells with stably knocked down CMAS, we used a modified pGreenPuro lentiviral vector (System Biosystems, Mountain View, CA, USA) in which GFP was replaced with RFP (pRFPpuro) vector. Oligos containing the CMAS siRNA sequence (5′-GTGTATGGGTTTCGACAGA-3′) and the complementary sequence (antisense CMAS) were synthesized into a short-hairpin RNA as (GATCC-siCMAS-CTTCCTGTCAGA-anti-sense CMAS-TTTTTG). Oligos were annealed and ligated into pRFPpuro. Resulting plasmids were verified by sequencing and used to transfect HEK293T packaging cells to generate lentivirus. Expression of RFP was used to sort cells by flow cytometry (FACSAria, Beckton Dickinson). After two rounds of sorting, we obtained a nearly homogenous cell line stably knocked down for CMAS. RNA and protein expression were reduced by >90% as verified by qRT-PCR and immunoblot.
Tumor models
All animal procedures are approved by the Animal Care and Use Committee of Harvard Medical School in compliance with American Veterinary Medicine Association guidelines. Exponentially growing cells were trypsinized with Tryple Express (Invitrogen) and 5×10⁵ cells were resuspended in a 1:1 WIT-Matrigel solution and injected subcutaneously in the flanks of 4-week old NOD/SCID/IL2Rγ-/- mice. Mice were palpated for tumor formation and tumor size was measured every 3 days by caliper. Cell injection and monitoring were in accordance with Harvard Center for Comparative Medicine Tumor Guidelines and Guidelines for Survival of Tumor-Bearing Animals. Tumor volumes were calculated as volume (μL) = L × W2×0.4. Mice were sacrificed when the tumor size exceeded 15 mm in diameter according to American Veterinarian Medical Association Guidelines for Euthanasia.
Results
Highly tumorigenic BPLER cells and less aggressive HMLER cells differentially catabolize glucose
To compare glucose metabolites generated in BPLER and HMLER cells, we cultured both cells in glucose-free media supplemented with uniformly labeled 13C-glucose. Metabolites derived from 13C-glucose were identified by 13C-1H HSQC spectroscopy. The HSQC spectra for both BPLER and HMLER cells had well-resolved intense peaks, and replicate samples showed nearly identical resonances. By overlaying the HSQC spectra from both, cells we found that the intensity and expression of some metabolite resonances differed between the two cells (Figure 1A). Although many resonances varied in intensity, we focused on the resonances that were unique to BPLER. To identify the metabolite(s) that correspond to the resonances upregulated in BPLER cells, we queried the Human Metabolome Database (HMDB), which contains reference NMR information for more than 7,000 detected metabolites.8,9 Most of the BPLER-enriched resonances match resonances for Neu5Ac (Figure 1C). To verify this assignment, the 13C-1H HSQC reference spectrum of Neu5Ac was downloaded from the HMDB and compared to the BPLER and HMLER spectra (positions indicated with circles in Figure 1B). Indeed, all of the Neu5Ac resonances overlapped with resonances specifically increased in the BPLER spectra, strongly suggesting that they correspond to Neu5Ac, and that BPLER cells have increased Neu5Ac compared with HMLER. To validate this assignment, we used liquid chromatography–mass spectrometry to compare Neu5Ac abundance in water-soluble metabolite extracts of BPLER and HMLER, using Neu5Ac as a standard to determine retention time. Neu5Ac abundance was analyzed using multiple reaction monitoring for two Neu5Ac fragments. Neu5Ac was ~7-fold more abundant in BPLER cells than in HMLER cells (Figure 1D).
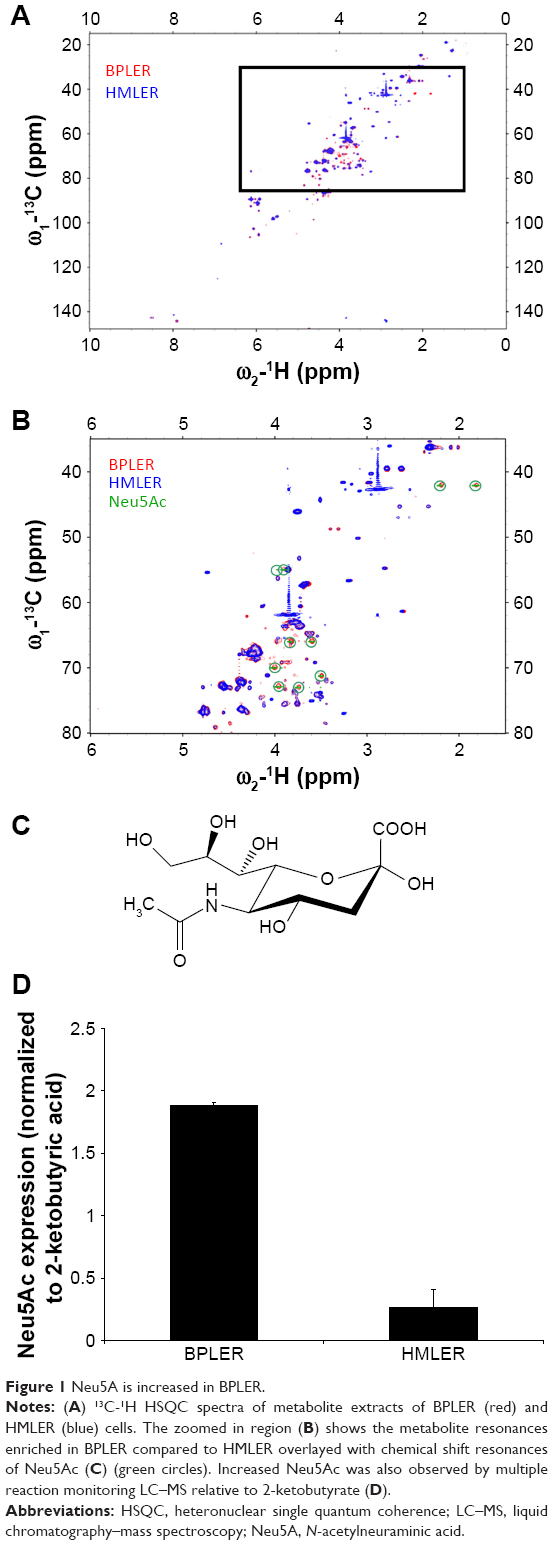 | Figure 1 Neu5A is increased in BPLER. |
N-acetylneuraminic acid expression correlates with invasiveness
Neu5Ac is the most abundant member of the sialic acid family of sugars.10 Sialic acids are terminating residues on glycosylation chains of cell surface glycoproteins.11 Increased sialic acid levels are associated with metastasis.12–14 The mechanism that leads to increased sialic acid expression remains unclear.15 Neu5Ac is generated through the hexosamine pathway, where multiple enzymes convert glucose to UDP-N-acetylglucosamine (UDP-GlcNAc)10 (Figure 2A). UDP-GlcNAc, the common precursor for all amino sugars of glycoproteins, lipids, and proteoglycans, is converted to Neu5Ac by sequential action of glucosamine (UDP-N-acetyl)-2-epimerase, NANS, and N-acetylneuraminic acid phosphatase.16,17 Neu5Ac is then activated by CMAS to cytidine-5-monophosphate N-acetylneuraminic acid (CMP-Neu5Ac), which is transported to the Golgi where Golgi sialyltransferases catalyze the transfer of Neu5Ac onto terminal residues of glycoproteins and glycolipids.
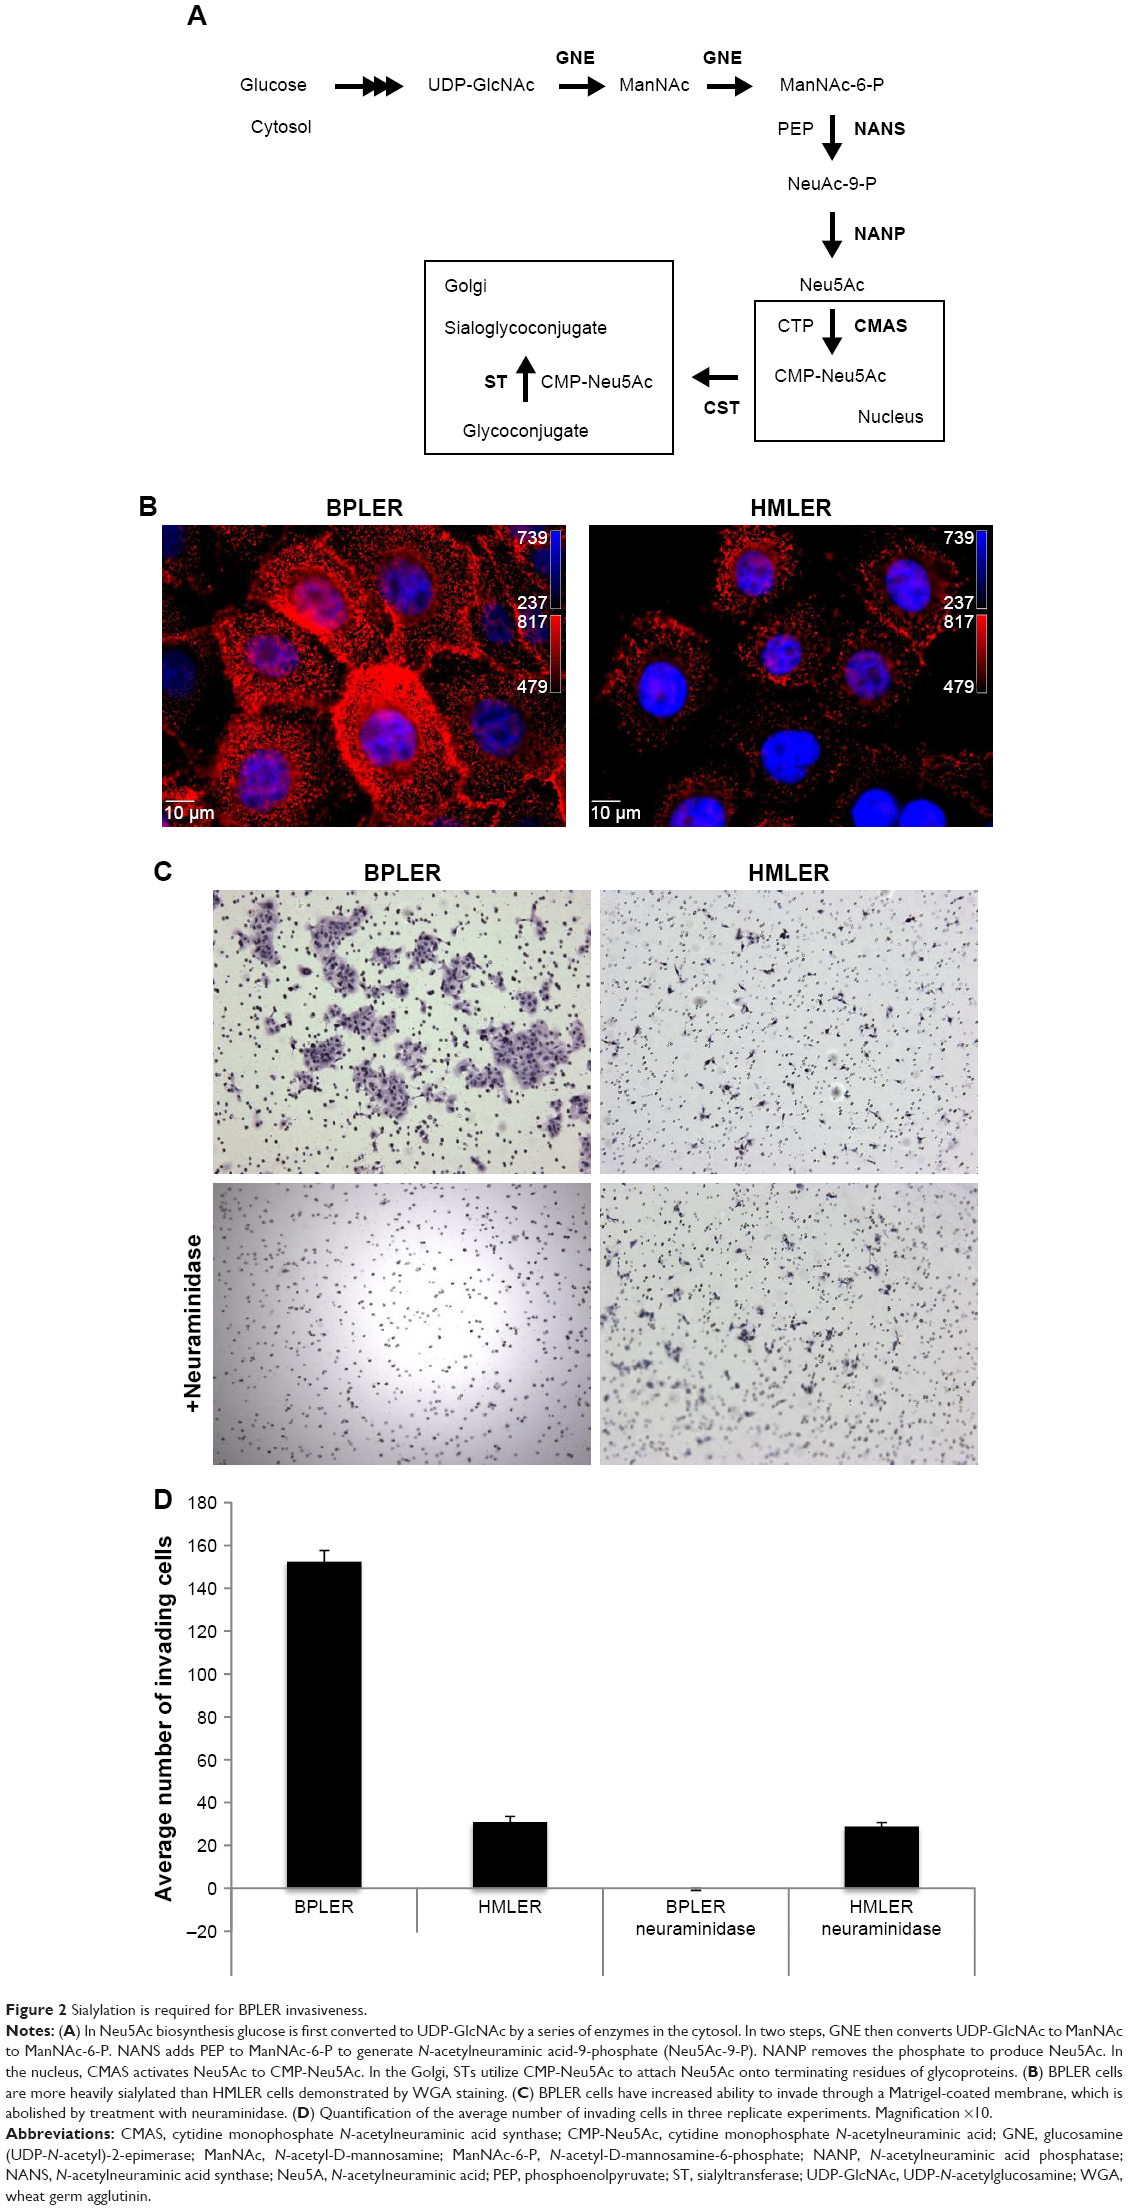 | Figure 2 Sialylation is required for BPLER invasiveness. |
Increased Neu5Ac could suggest increased sialylation of BPLER cell surface glycoproteins. To probe this, we compared levels of cell surface sialylation in BPLER and HMLER cells using a fluorescently labeled WGA that binds to Neu5Ac residues on glycoproteins.18 BPLER cells showed more intense fluorescence, suggesting BPLER cells are more heavily sialylated (Figure 2B). Since increased sialylation has been linked to metastasis,12–14 invasion assays were used to test if sialylation contributes to invasiveness of BPLER. Consistent with their increased malignancy, ~5-fold more BPLER than HMLER cells invaded through a 0.8 μm porous membrane overlaid with Matrigel (Figure 2C and D). Treating BPLER with 2 units of neuraminidase, which specifically removes α2–3, α2–6, and α2–8 linked Neu5Ac residues from cell surface glycoproteins,10 completely abolished BPLER invasiveness, but had no effect on HMLER invasivity (Figure 2C and D). Thus, sialylation contributes to the ability of BPLER cells to invade.
CMAS expression is increased in TNBC
The enzyme CMAS activates Neu5Ac to CMP-Neu5Ac, which is the critical common last step in glycoprotein sialylation. Loss of CMAS decreases sialylation and inhibits the growth of 231MFP breast xenografts in immunodeficient mice.19 To determine whether CMAS expression contributes to the aggressive phenotype of BPLER, we first compared CMAS protein levels in BPLER and HMLER by immunoblot. CMAS was readily detected in BPLER, but not HMLER, cell extracts (Figure 3A). Levels of NANS, another enzyme in Neu5Ac biosynthesis, and tubulin were similar in BPLER and HMLER. CMAS was also readily detected in MDA-MB468, another aggressive basal-like TNBC cell line, suggesting that elevated CMAS expression might be a general feature of highly malignant TNBC cell lines. To determine whether CMAS overexpression is a common feature of human TNBC, we used The Cancer Genome Atlas (TCGA) to analyze CMAS mRNA expression in 1,182 human invasive breast carcinomas. The tumors were separated into two groups, TNBC and non-TNBC, based on mRNA expression of the estrogen receptor (ESR1), progesterone (PGR), and HER2 (ERBB2) (Figure 3B). About 16.7% of the breast cancer samples in the TCGA were classified as TNBC, consistent with TNBC occurrence in 10%–20% of breast cancers.20 In the TNBC tumors compared to the non-TNBC tumors, CMAS copy number variation (CNV) and mRNA were modestly increased by 1.2-fold (P-value <8.7e-5) and 1.54-fold (P-value <2.2e-16), respectively (Figure 3C). TNBCs, as a diagnosis of exclusion, are very heterogeneous, and these results suggest that increased CMAS and sialylation may be a common feature of some subtypes of TNBC.
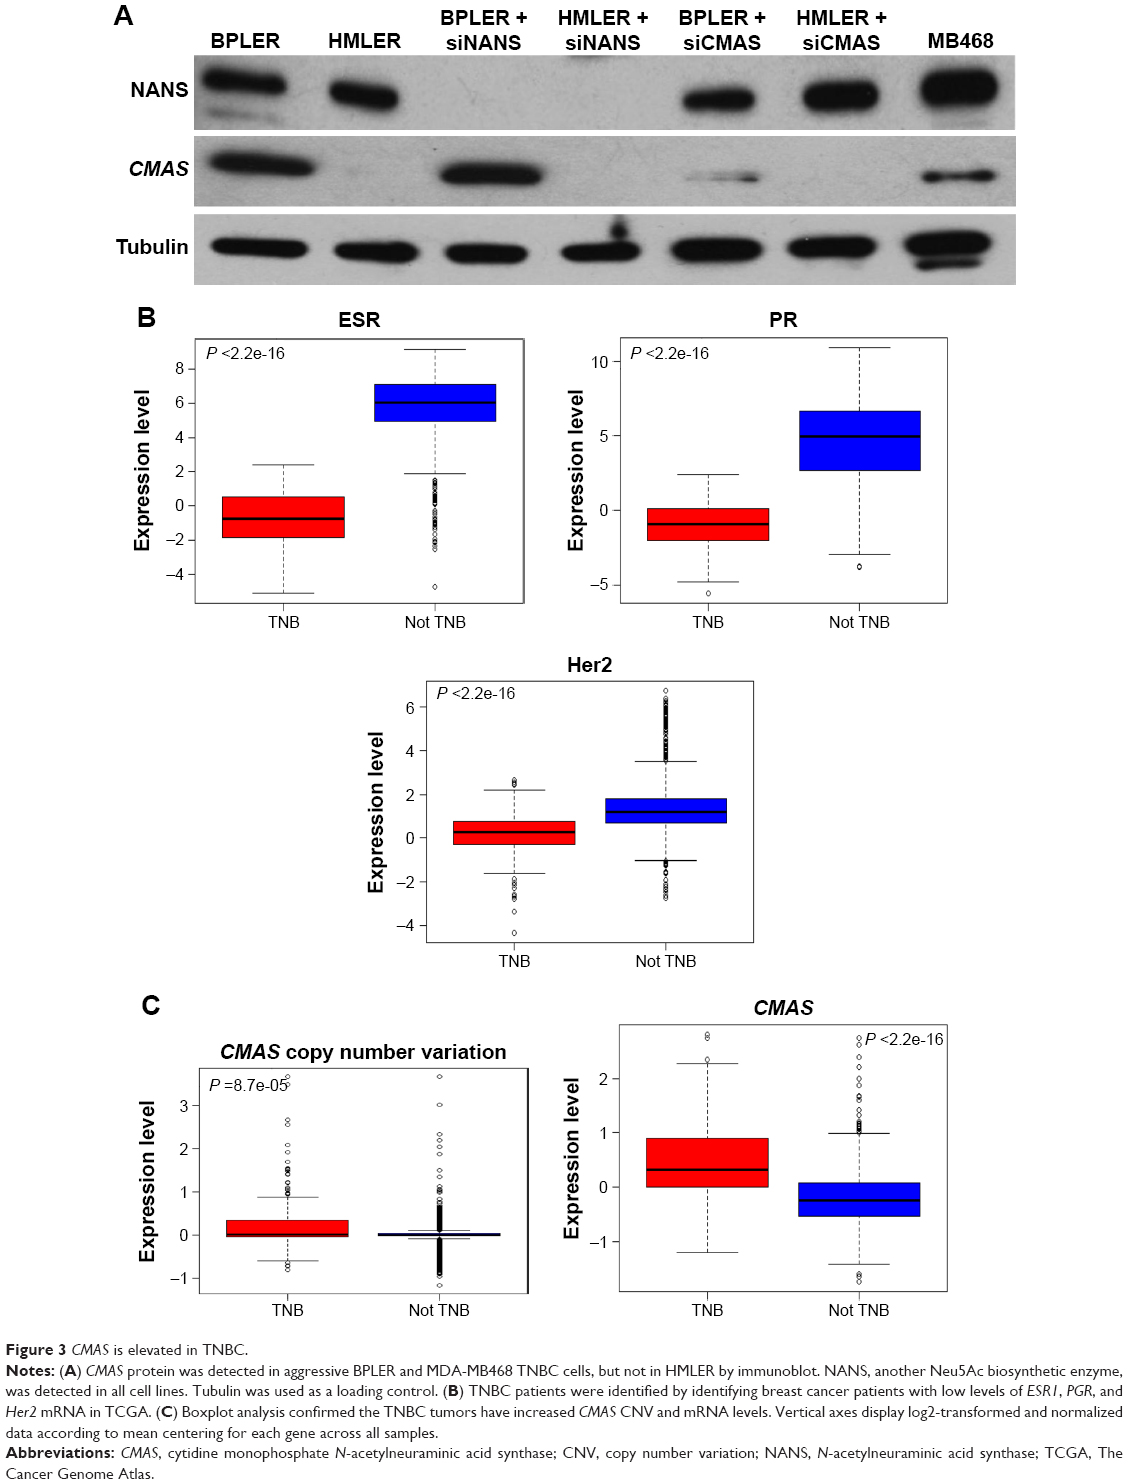 | Figure 3 CMAS is elevated in TNBC. |
CMAS contributes to cell invasiveness
To explore the contribution of CMAS to malignancy, BPLER cells were transfected with (siCMAS) or a nontargeting control siRNA. Near complete knockdown was observed (Figure 3A). Knockdown of CMAS modestly decreased BPLER proliferation, while knockdown of PLK1, which encodes a kinase required for cell division, as a positive control strongly inhibited cell growth (Figure 4A). However, CMAS knockdown nearly abolished BPLER invasiveness through Matrigel (Figure 4B and C). Conversely, overexpression of CMAS in previously noninvasive HMLER cells was sufficient to confer invasiveness. CMAS-overexpressing HMLER invaded 8-fold more than vector-control-transduced HMLER, surpassing the invasivity of BPLER (Figure 4D and E). These results suggest that CMAS plays an important role in invasion of these TNBC cell lines.
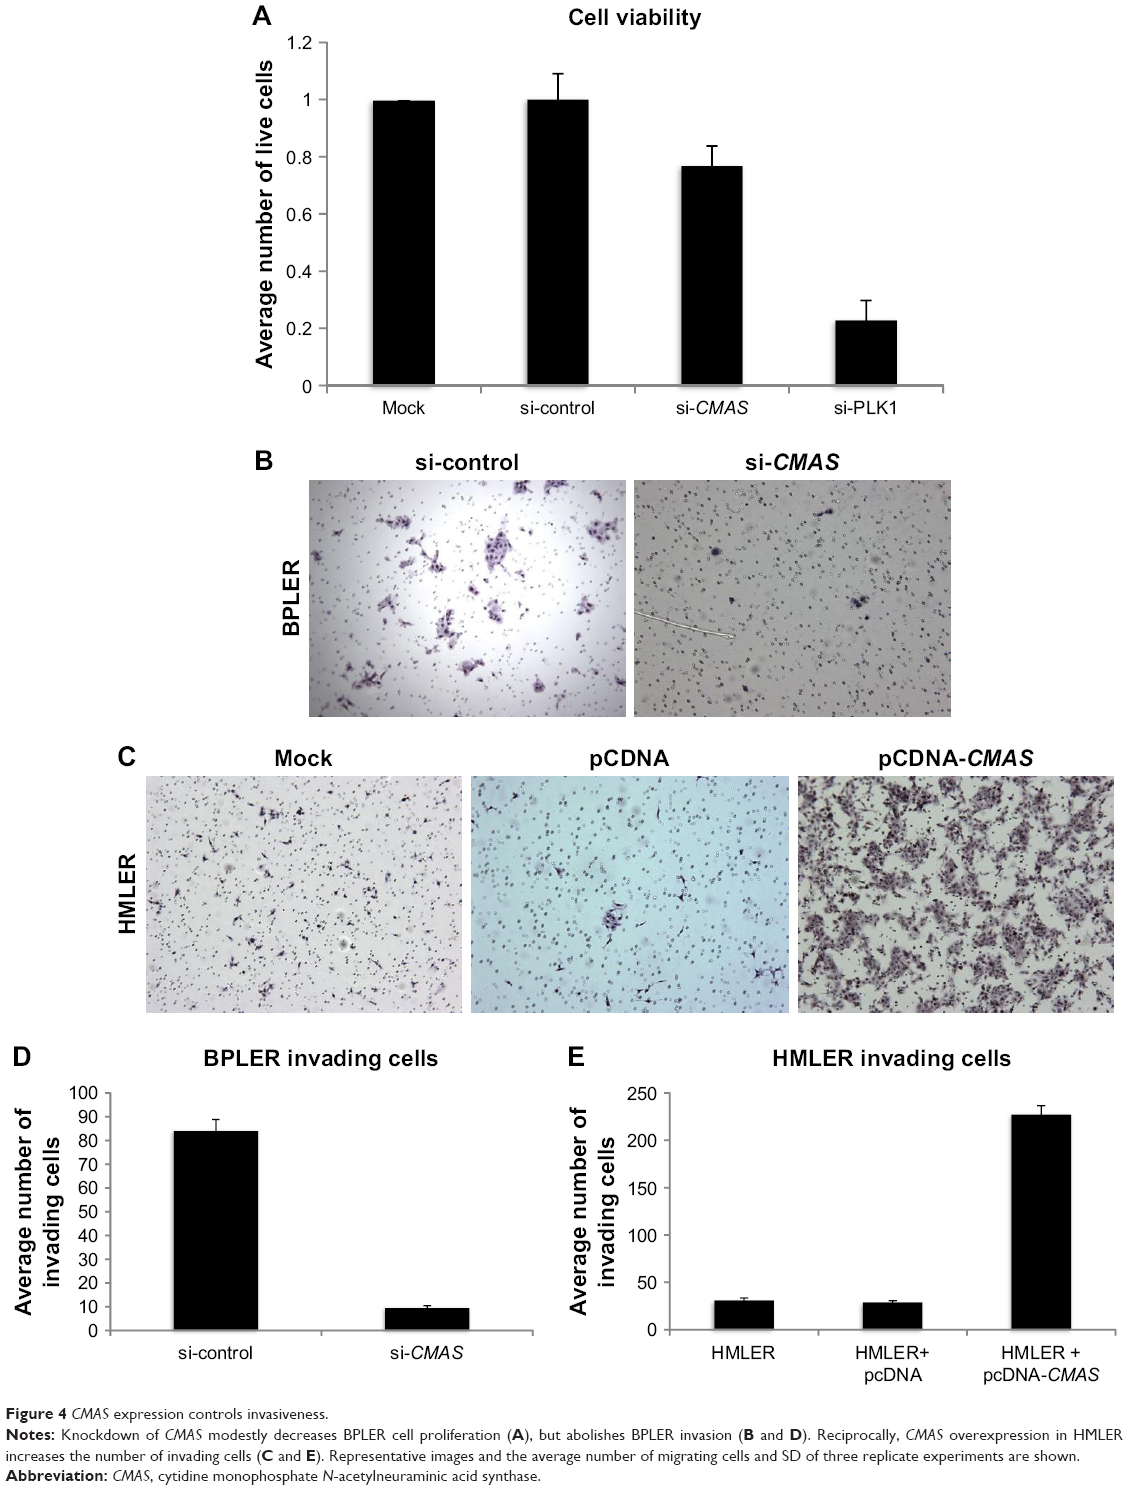 | Figure 4 CMAS expression controls invasiveness. |
CMAS knockdown blocks tumor initiation in mice
The ability to form xenografted tumors in vivo correlates with cancer stem cell function and tumor aggressiveness. To determine whether CMAS affects tumor initiation, we compared tumor initiation by BPLER cells stably knocked down for CMAS after infection with lentiviruses encoding a CMAS shRNA (BPLER-shCMAS) with BPLER cells infected with control lentiviruses (BPLER-EV) (Figure 5A and B). CMAS mRNA was reduced by >90% in BPLER-shCMAS compared to BPLER-EV, and CMAS protein was not detected in BPLER-shCMAS by immunoblot. When 5×10⁵ BPLER-shCMAS or BPLER-EV cells were injected subcutaneously into the flanks of 4-week old NOD/SCID/IL2Rγ-/- mice (N=4/group), the BPLER-EV tumors grew and exceeded 15 mm by day 60 when the mice had to be sacrificed (Figure 5C). By contrast, no tumors were detected in mice injected with BPLER-shCMAS. These results suggest that CMAS is critical, not only for invasivity, but also for tumor initiation.
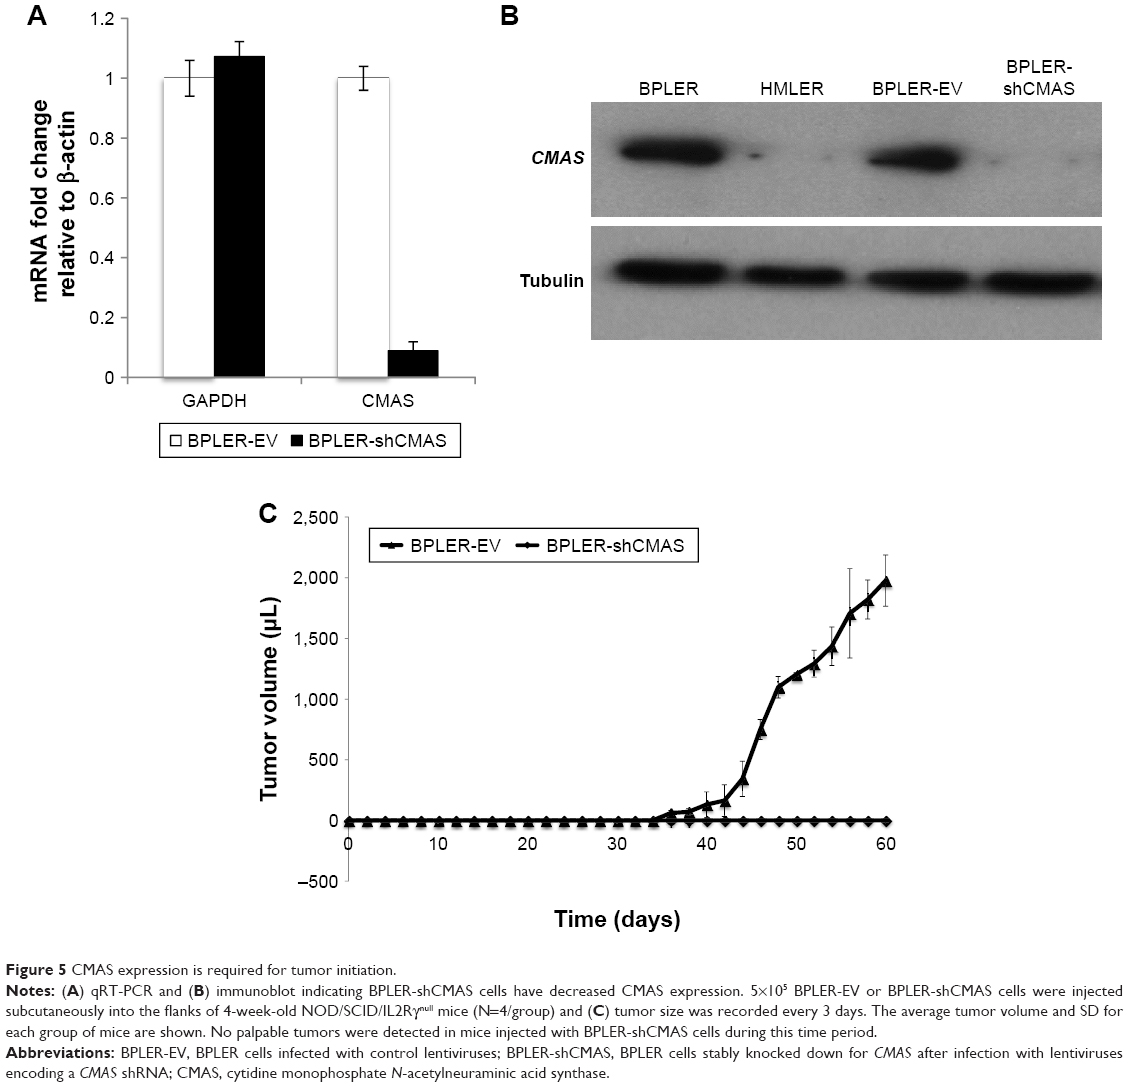 | Figure 5 CMAS expression is required for tumor initiation. |
Discussion
The metabolic output of a cell is influenced by functional genomic, transcriptomic, and proteomic networks. Here we utilized an unbiased NMR metabolite-screening platform to follow glucose catabolism in the highly tumorigenic BPLER cell line and compare it to glucose products in the less aggressive HMLER cell line. Many metabolite resonances were comparable between cells. A small number of metabolite resonances were only detected in BPLER. A similar number was unique to HMLER cells. To gain a complete understanding of the metabolic pathways in these cells, future work could examine all of these differences. Here we focused on the metabolite resonances unique to BPLER. We matched these resonances with reference compounds in the HMDB, which identified Neu5Ac as a potential metabolite enriched in BPLER cells. All the resonances in the reference 13C-1H HSQC spectra of Neu5Ac corresponded to resonances only detected in BPLER cells. Liquid chromatography–mass spectroscopy analysis further confirmed that Neu5Ac is ~7-fold more abundant in BPLER cells as compared to HMLER cells.
Neu5Ac is the most abundant sialic acid family sugar that is added as the terminal residue to cell surface glycoproteins.10,11,21,22 Expression of Neu5Ac confers mucinous properties to epithelial cell surfaces, providing a lubricant that makes them “slimy” and interferes with adhesion.14,23,24 Perhaps then it is not surprising that cells with more Neu5Ac have a more sialylated surface and are more invasive. Indeed, we found that BPLER was much more heavily sialylated than HMLER by staining with WGA. Sialylation mediates numerous biological processes including masking antigenic determinants,25,26 altering cell–cell recognition, cell-contact inhibition,27 cellular migration10,28 and new evidence suggests a role in transcriptional regulation.19
Increased Neu5Ac has also been observed in many metastatic tumors.12–14,29 Consistent with the literature, we observed Neu5Ac expression correlated with cellular invasiveness. Using invasion assays, we showed that more BPLER cells invaded through a 0.8 μm porous membrane overlaid with Matrigel as compared to HMLER cells. The ability of highly malignant BPLER cells to invade through the membrane was lost after neuraminidase treatment. Neuraminidase treatment only slightly reduced the ability of HMLER cells to invade. HMLER cells produce much less Neu5Ac and have much less surface sialylation. Identifying BPLER-specific Neu5Ac containing proteins in the future may pinpoint specific glycoproteins that are critical for invasion.
The activation step required to transfer Neu5Ac to glycoproteins is performed by the enzyme CMAS. CMAS is expressed in both eukaryotic and prokaryotic organisms.30 In pathogenic bacteria, CMAS is a virulence factor catalyzing the production of sialylated proteins that mimic host proteins.30,31 In humans, a prominent role of CMAS in cancer is just beginning to unfold. A report using cancer-specific high-throughput annotation of somatic mutations, identified genetic mutations in 18 genes including CMAS as important for pancreatic cancer.32 CMAS-dependent increased sialylation has been reported to drive tumorigenicity of transformed breast cancer cells.19 Knockout of CMAS decreases breast cancer metastasis to the lung in mouse models.33 Further, high levels of sialic acid genes including CMAS gene are associated with decreased patient survival.33 Here, we showed that CMAS protein expression was markedly increased in two highly tumorigenic TNBC cell lines. In addition, many TNBC patient tumors also have increased CMAS expression. Furthermore, siRNA knockdown of CMAS drastically reduced the number of invading BPLER cells while overexpressing CMAS in HMLER cells increased their invasiveness. BPLER cells with stably knocked down CMAS were unable to form tumors in mice. These results suggest that CMAS is a critical regulator of invasion and tumor initiation. Collectively, our results suggest CMAS could represent a metabolic node commonly heightened in TNBC and other cancers.
Conclusion
TNBCs are aggressive tumors, with high rates of metastasis and reoccurrence. Currently, no tailored treatments exist for this cancer subtype. We found that glucose metabolism in TNBC cell lines has increased production of Neu5Ac and that Neu5Ac modification of cell surface proteins is critical for the invasivity of TNBC cells. Knockdown of CMAS, a key enzyme in Neu5Ac biosynthesis, inhibits invasivity and has anticancer activity in TNBC xenografts. Our results identify the Neu5Ac biosynthetic pathway as a potential therapeutic target for TNBC.
Acknowledgment
We acknowledge National Institutes of Health funding (R01 CA200913) received for this work. We would like to thank Judy Lieberman, David Hessler, Justin Lim, Hari Arthanari, Mei-Ju Su, Akshay Badrinarayanan, Victoria D’Souza, Gary Ruvkun, and Jack Szostak for their helpful insights and suggestions.
Disclosure
Dr O’Day and Dr Wagner report a pending patent (20180164290). Dr O’Day and Dr Wagner co-founded Olaris Therapeutics which is developing therapies for TNBC. Dr Wagner is also the co-founder of PIC Therapeutics, ENANTA pharmaceuticals, Skinap Therapeutics, Cellmig Biolabs and NOW scientific. Dr Wagner also reports no financial support or personal fees from Olaris. The authors report no other conflicts of interest in this work.
References
vander Heiden MG, Cantley LC, Thompson CB. Understanding the Warburg effect: the metabolic requirements of cell proliferation. Science. 2009;324(5930):1029–1033. | ||
vander Heiden MG, Lunt SY, Dayton TL, et al. Metabolic pathway alterations that support cell proliferation. Cold Spring Harb Symp Quant Biol. 2011;76:325–334. | ||
Warburg O. On the origin of cancer cells. Science. 1956;123(3191):309–314. | ||
Lehninger AL, Nelson DL, Cox MM. Principles of Biochemistry. 2nd ed. Worth: International Union of Biochemistry and Molecular Biology, Inc; 1993. | ||
vander Heiden MG, Locasale JW, Swanson KD, et al. Evidence for an alternative glycolytic pathway in rapidly proliferating cells. Science. 2010;329(5998):1492–1499. | ||
Ince TA, Richardson AL, Bell GW, et al. Transformation of different human breast epithelial cell types leads to distinct tumor phenotypes. Cancer Cell. 2007;12(2):160–170. | ||
Petrocca F, Altschuler G, Tan SM, et al. A genome-wide siRNA screen identifies proteasome addiction as a vulnerability of basal-like triple-negative breast cancer cells. Cancer Cell. 2013;24(2):182–196. | ||
Wishart DS, Knox C, Guo AC, et al. HMDB: a knowledgebase for the human metabolome. Nucleic Acids Res. 2009;37(Database issue):D603–D610. | ||
Wishart DS, Tzur D, Knox C, et al. HMDB: the Human Metabolome Database. Nucleic Acids Res. 2007;35(Database issue):D521–D526. | ||
Varki A, Cummings RD, Esko JD, et al. Essentials of Glycobiology. 2nd ed. Cold Spring Harbor, NY: Cold Spring Harbor Laboratory Press; 2009. | ||
Schauer R. Sialic acids as regulators of molecular and cellular interactions. Curr Opin Struct Biol. 2009;19(5):507–514. | ||
Lin S, Kemmner W, Grigull S, Schlag PM. Cell surface alpha 2,6 sialylation affects adhesion of breast carcinoma cells. Exp Cell Res. 2002;276(1):101–110. | ||
Bolscher JG, Schallier DC, van Rooy H, Storme GA, Smets LA. Modification of cell surface carbohydrates and invasive behavior by an alkyl lysophospholipid. Cancer Res. 1988;48(4):977–982. | ||
Dennis J, Waller C, Timpl R, Schirrmacher V. Surface sialic acid reduces attachment of metastatic tumour cells to collagen type IV and fibronectin. Nature. 1982;300(5889):274–276. | ||
Harduin-Lepers A, Krzewinski-Recchi MA, Colomb F, Foulquier F, Groux-Degroote S, Delannoy P. Sialyltransferases functions in cancers. Front Biosci. 2012;4:499–515. | ||
Kean EL, Roseman S. The sialic acids. X. Purification and properties of cytidine 5′-monophosphosialic acid synthetase. J Biol Chem. 1966;241(23):5643–5650. | ||
Blacklow RS, Warren L. Biosynthesis of sialic acids by Neisseria meningitidis. J Biol Chem. 1962;237:3520–3526. | ||
Chazotte B. Labeling membrane glycoproteins or glycolipids with fluorescent wheat germ agglutinin. Cold Spring Harb Protoc. 2011;2011(5):pdb.prot5623. | ||
Kohnz RA, Roberts LS, Detomaso D, et al. Protein Sialylation Regulates a Gene Expression Signature that Promotes Breast Cancer Cell Pathogenicity. ACS Chem Biol. 2016;11(8):2131–2139. | ||
Aysola K, Desai A, Welch C, et al. Triple Negative Breast Cancer – An Overview. Hereditarty Genet. 2013;2013(Suppl 2):1–3. | ||
Audry M, Jeanneau C, Imberty A, et al. Current trends in the structure-activity relationships of sialyltransferases. Glycobiology. 2011;21(6):716–726. | ||
Vann WF, Tavarez JJ, Crowley J, Vimr E, Silver RP. Purification and characterization of the Escherichia coli K1 neuB gene product N-acetylneuraminic acid synthetase. Glycobiology. 1997;7(5):697–701. | ||
Brockhausen I, Yang JM, Burchell J, Whitehouse C, Taylor-Papadimitriou J. Mechanisms underlying aberrant glycosylation of MUC1 mucin in breast cancer cells. Eur J Biochem. 1995;233(2):607–617. | ||
Higa HH, Paulson JC. Sialylation of glycoprotein oligosaccharides with N-acetyl-, N-glycolyl-, and N-O-diacetylneuraminic acids. J Biol Chem. 1985;260(15):8838–8849. | ||
Schauer R. Chemistry, metabolism, and biological functions of sialic acids. Adv Carbohydr Chem Biochem. 1982;40:131–234. | ||
Ashwell G, Morell AG. The role of surface carbohydrates in the hepatic recognition and transport of circulating glycoproteins. Adv Enzymol Relat Areas Mol Biol. 1974;41(0):99–128. | ||
Revilla-Nuin B, Reglero A, Feo JC, Rodriguez-Aparicio LB, Ferrero MA. Identification, expression and tissue distribution of cytidine 5′-monophosphate N-acetylneuraminic acid synthetase activity in the rat. Glycoconj J. 1998;15(3):233–241. | ||
Alhadeff JA, Holzinger RT. Sialyltransferase, sialic acid and sialoglycoconjugates in metastatic tumor and human liver tissue. Int J Biochem. 1982;14(2):119–126. | ||
Yogeeswaran G, Salk PL. Metastatic potential is positively correlated with cell surface sialylation of cultured murine tumor cell lines. Science. 1981;212(4502):1514–1516. | ||
Mizanur RM, Pohl NL. Bacterial CMP-sialic acid synthetases: production, properties, and applications. Appl Microbiol Biotechnol. 2008;80(5):757–765. | ||
Hao J, Balagurumoorthy P, Sarilla S, Sundaramoorthy M. Cloning, expression, and characterization of sialic acid synthases. Biochem Biophys Res Commun. 2005;338(3):1507–1514. | ||
Carter H, Samayoa J, Hruban RH, Karchin R. Prioritization of driver mutations in pancreatic cancer using cancer-specific high-throughput annotation of somatic mutations (CHASM). Cancer Biol Ther. 2010;10(6):582–587. | ||
Teoh ST, Ogrodzinski MP, Ross C, Hunter KW, Lunt SY. Sialic Acid Metabolism: A Key Player in Breast Cancer Metastasis Revealed by Metabolomics. Front Oncol. 2018;8:174. | ||
Delaglio F, Grzesiek S, Vuister GW, Zhu G, Pfeifer J, Bax A. NMRPipe: a multidimensional spectral processing system based on UNIX pipes. J Biomol NMR. 1995;6(3):277–293. | ||
Lee W, Tonelli M, Markley JL. NMRFAM-SPARKY: enhanced software for biomolecular NMR spectroscopy. Bioinformatics. 2015:31(8):1325–1327. |
 © 2018 The Author(s). This work is published and licensed by Dove Medical Press Limited. The full terms of this license are available at https://www.dovepress.com/terms.php and incorporate the Creative Commons Attribution - Non Commercial (unported, v3.0) License.
By accessing the work you hereby accept the Terms. Non-commercial uses of the work are permitted without any further permission from Dove Medical Press Limited, provided the work is properly attributed. For permission for commercial use of this work, please see paragraphs 4.2 and 5 of our Terms.
© 2018 The Author(s). This work is published and licensed by Dove Medical Press Limited. The full terms of this license are available at https://www.dovepress.com/terms.php and incorporate the Creative Commons Attribution - Non Commercial (unported, v3.0) License.
By accessing the work you hereby accept the Terms. Non-commercial uses of the work are permitted without any further permission from Dove Medical Press Limited, provided the work is properly attributed. For permission for commercial use of this work, please see paragraphs 4.2 and 5 of our Terms.