")
Back to Journals » Pharmacogenomics and Personalized Medicine » Volume 14
CYP2C9 Variations and Their Pharmacogenetic Implications Among Diverse South Asian Populations
Authors Nizamuddin S, Dubey S, Singh S, Sharma S, Machha P, Thangaraj K
Received 20 July 2020
Accepted for publication 1 December 2020
Published 27 January 2021 Volume 2021:14 Pages 135—147
DOI https://doi.org/10.2147/PGPM.S272015
Checked for plagiarism Yes
Review by Single anonymous peer review
Peer reviewer comments 2
Editor who approved publication: Dr Martin H Bluth
Sheikh Nizamuddin,1,2 Shivendra Dubey,1 Sakshi Singh,1 Saurav Sharma1 ,† Pratheusa Machha,1,3 Kumarasamy Thangaraj1,3,4
1CSIR-Centre for Cellular and Molecular Biology, Hyderabad 500007, India; 2German Cancer Consortium (DKTK) c/o Zentrale Klinische Forschung (ZKF), University Medical Center, Freiburg, Germany; 3AcSIR (Academy of Scientific and Innovative Research), CSIR-Centre for Cellular and Molecular Biology, Hyderabad 500007, India; 4DBT-Centre for DNA Fingerprinting and Diagnostics, Hyderabad 500039, India
†Mr Sharma passed away on June 11, 2019.
Correspondence: Kumarasamy Thangaraj
CSIR-Centre for Cellular and Molecular Biology, Hyderabad, Telangana 500007, India
Fax +91-40-27160311
Email [email protected]
Introduction: Allelic frequency distribution of drug metabolizing enzyme genes among populations is important to identify risk groups for adverse drug reaction and to select representative populations for clinical trials. Although India emerged as an important hub for clinical trials, information about the pharmacogenetic diversity for this region is still lacking. Here, we investigated genetic diversity of cytochrome-P450-2C9 (CYP2C9) gene which metabolizes wide range of drugs and is highly expressed in the human liver.
Methods: In total, 1278 individuals from 36 diverse Indian populations, 210 individuals from in-house data-repository and 489 other South Asian samples from the 1000 Genomes Project were selected. Variants observed in CYP2C9 gene were subjected to various statistical analyses.
Results: High frequency of CYP2C9*3 (∼ 13%) and CYP2C9*3/*3 (∼ 1%) was observed among South Asians, compared to 21 populations living outside the Indian subcontinent. The allelic/genotypic frequency does not correlate with geographical location or linguistic affiliation, except populations speaking Tibeto-Burmans language, who have lower frequency of CYP2C9*3 and CYP2C9*3/*3. Since, South Asians practice strict endogamy, presence of unique mutation and high frequency of homozygous genotypes not surprising. CYP2C9*3 has been associated with therapeutic response.The effect of CYP2C9*3/*3 is more pronounced compared to heterozygous and wild type homozygous genotypes as evident in many in vitro studies. As South Asians have high frequency, it would be interesting to explore potential of CYP2C9*3 as a marker for personalized therapy. Our study revealed several rare functional variants, which form eight novel and rare haplotypes of CYP2C9 (CYP2C9*63–*70). Of which, CYP2C9*64, *65, *66, *68, *69 and *70 haplotypes are South Asian-specific.
Conclusion: Overall, we find high genetic heterogeneity within South Asians and identified South Asian-specific putative functional CYP2C9 haplotypes. High frequency of CYP2C9*3 and CYP2C9*3/*3 was observed in South Asian populations. Taken together, current study greatly enriches the knowledge of naturally occurring CYP2C9 variants and its diversity in South Asia, which are relevant to further CYP2C9-related functional research and for personalized medicine.
Keywords: pharmacogenetics, CYP2C9, South Asians, genetic diversity
Introduction
Heterogeneous drug response is the major hurdle in the successful treatment of diseases, which is due to genetic variations in the drug metabolizing enzyme genes. Knowledge of allelic frequency distribution of drug metabolizing enzymes within populations can be useful to identify risk groups for adverse drug reaction and to optimize drug doses. It can be utilized to select representative populations in clinical trials. The cytochrome P450 (CYP) family is an important enzyme of ADME (related to absorption, distribution, metabolism and excretion of drug) genes, of which CYP2C9 is the major constituent of CYP2C subfamily in the human liver. It metabolizes a wide range of drugs including anticoagulant (warfarin), nonsteroidal anti-inflammatory (celecoxib, diclofenac), antidiabetic (nateglinide, tolbutamide), antihypertensive (irbesartan, losartan) and anti-epileptic (phenytoin).1 Several variations in CYP2C9 have been reported, which affect metabolism of the drug. Most notable variations are CYP2C9*2 (R144C) and CYP2C9*3 (I359L), which significantly decreases enzyme activity.2 Interestingly, these variations are highly heterogeneous among world population; (1) 8–19% and 3.3–16.3% in Caucasian; (2) 0–0.1% and 1.1–3.6% in Asian; (3) 2.9% and 2.0% in African-American; and (4) 0–4.3% and 0–2.3% in Black/African, respectively.3 In addition, other rare and functionally relevant variations were also reported in various populations, which includes; (1) CYP2C9*6, 0.6% frequency in African-Americans;4 (2) CYP2C9*4, 0.5% in African-Americans and 6% in Caucasians;2,5 and (3) CYP2C9*13, 0.19–0.45% in Asian.6 Dai et al reported several rare variants in the Han Chinese population.7
Several studies have been performed on CYP2C9 in Indian populations. However, most of studies have focused only on CYP2C9*3 and CYP2C9*2 variants. Grik et al observed CYP2C9*3 only in the Indo-European population (0.38–1.85%), whereas it was absent in Dravidian, Austroasiatic and Tibeto-Burman populations.8 Indian populations are well known for their genetic diversity and practice of endogamy, hence they are expected to have high frequency of homozygous allele9. Many studies have shown that the variations in CYP2C9 are associated with therapeutic heterogeneity in Indian populations. CYP2C9*2 and *3 has been reported with less hydroxylation (or metabolism) of phenytoin in vivo in South Indian populations,10 compared to wild type CYP2C9*1. Ramasamy et al reported phenytoin toxicity in a patient with normal dose of 300 mg/day, who had CYP2C9*3/*3 genotype.11 The same symptoms were also reported by Thakkar et al in South Indian populations.12 Both of these drugs are metabolized by CYP2C9. Some of the drugs, metabolized by CYP2C9 have narrow therapeutic index eg warfarin, phenytoin, and tolbutamide. This is the reason that small change in the metabolizing activity of CYP2C9 may cause major changes in an individual’s response against a drug. Considering this, we explored genetic diversity of functionally relevant variations of CYP2C9 within the Indian subcontinent and compared with other world populations. The outcome of this study may be useful to understand heterogeneous therapeutic response and development of personalized therapy for the populations of Indian subcontinent. Moreover, identification of South Asian-specific putative functional variants and associated haplotypes will open opportunity for further study.
Materials and Methods
Details of Samples
A total of 1278 samples from 36 diverse Indian populations, in terms of ethnicity, linguistic and geographical locations, were included in this study (Table 1).9,13 Furthermore, 210 samples of South Asian origin were selected from our collection of whole genome/exome datasets. For comparison, 489 and 598 samples of South Asian origin were selected from the 1000 Genomes Project and GenomeAsia 100K Project, respectively.14,15 This work has been approved by the Institutional Ethical Committee of CSIR-Centre for Cellular and Molecular Biology (CSIR-CCMB), Hyderabad, India. Informed written consent has been obtained from all the participants. The present study is conducted in accordance with the Declaration of Helsinki.
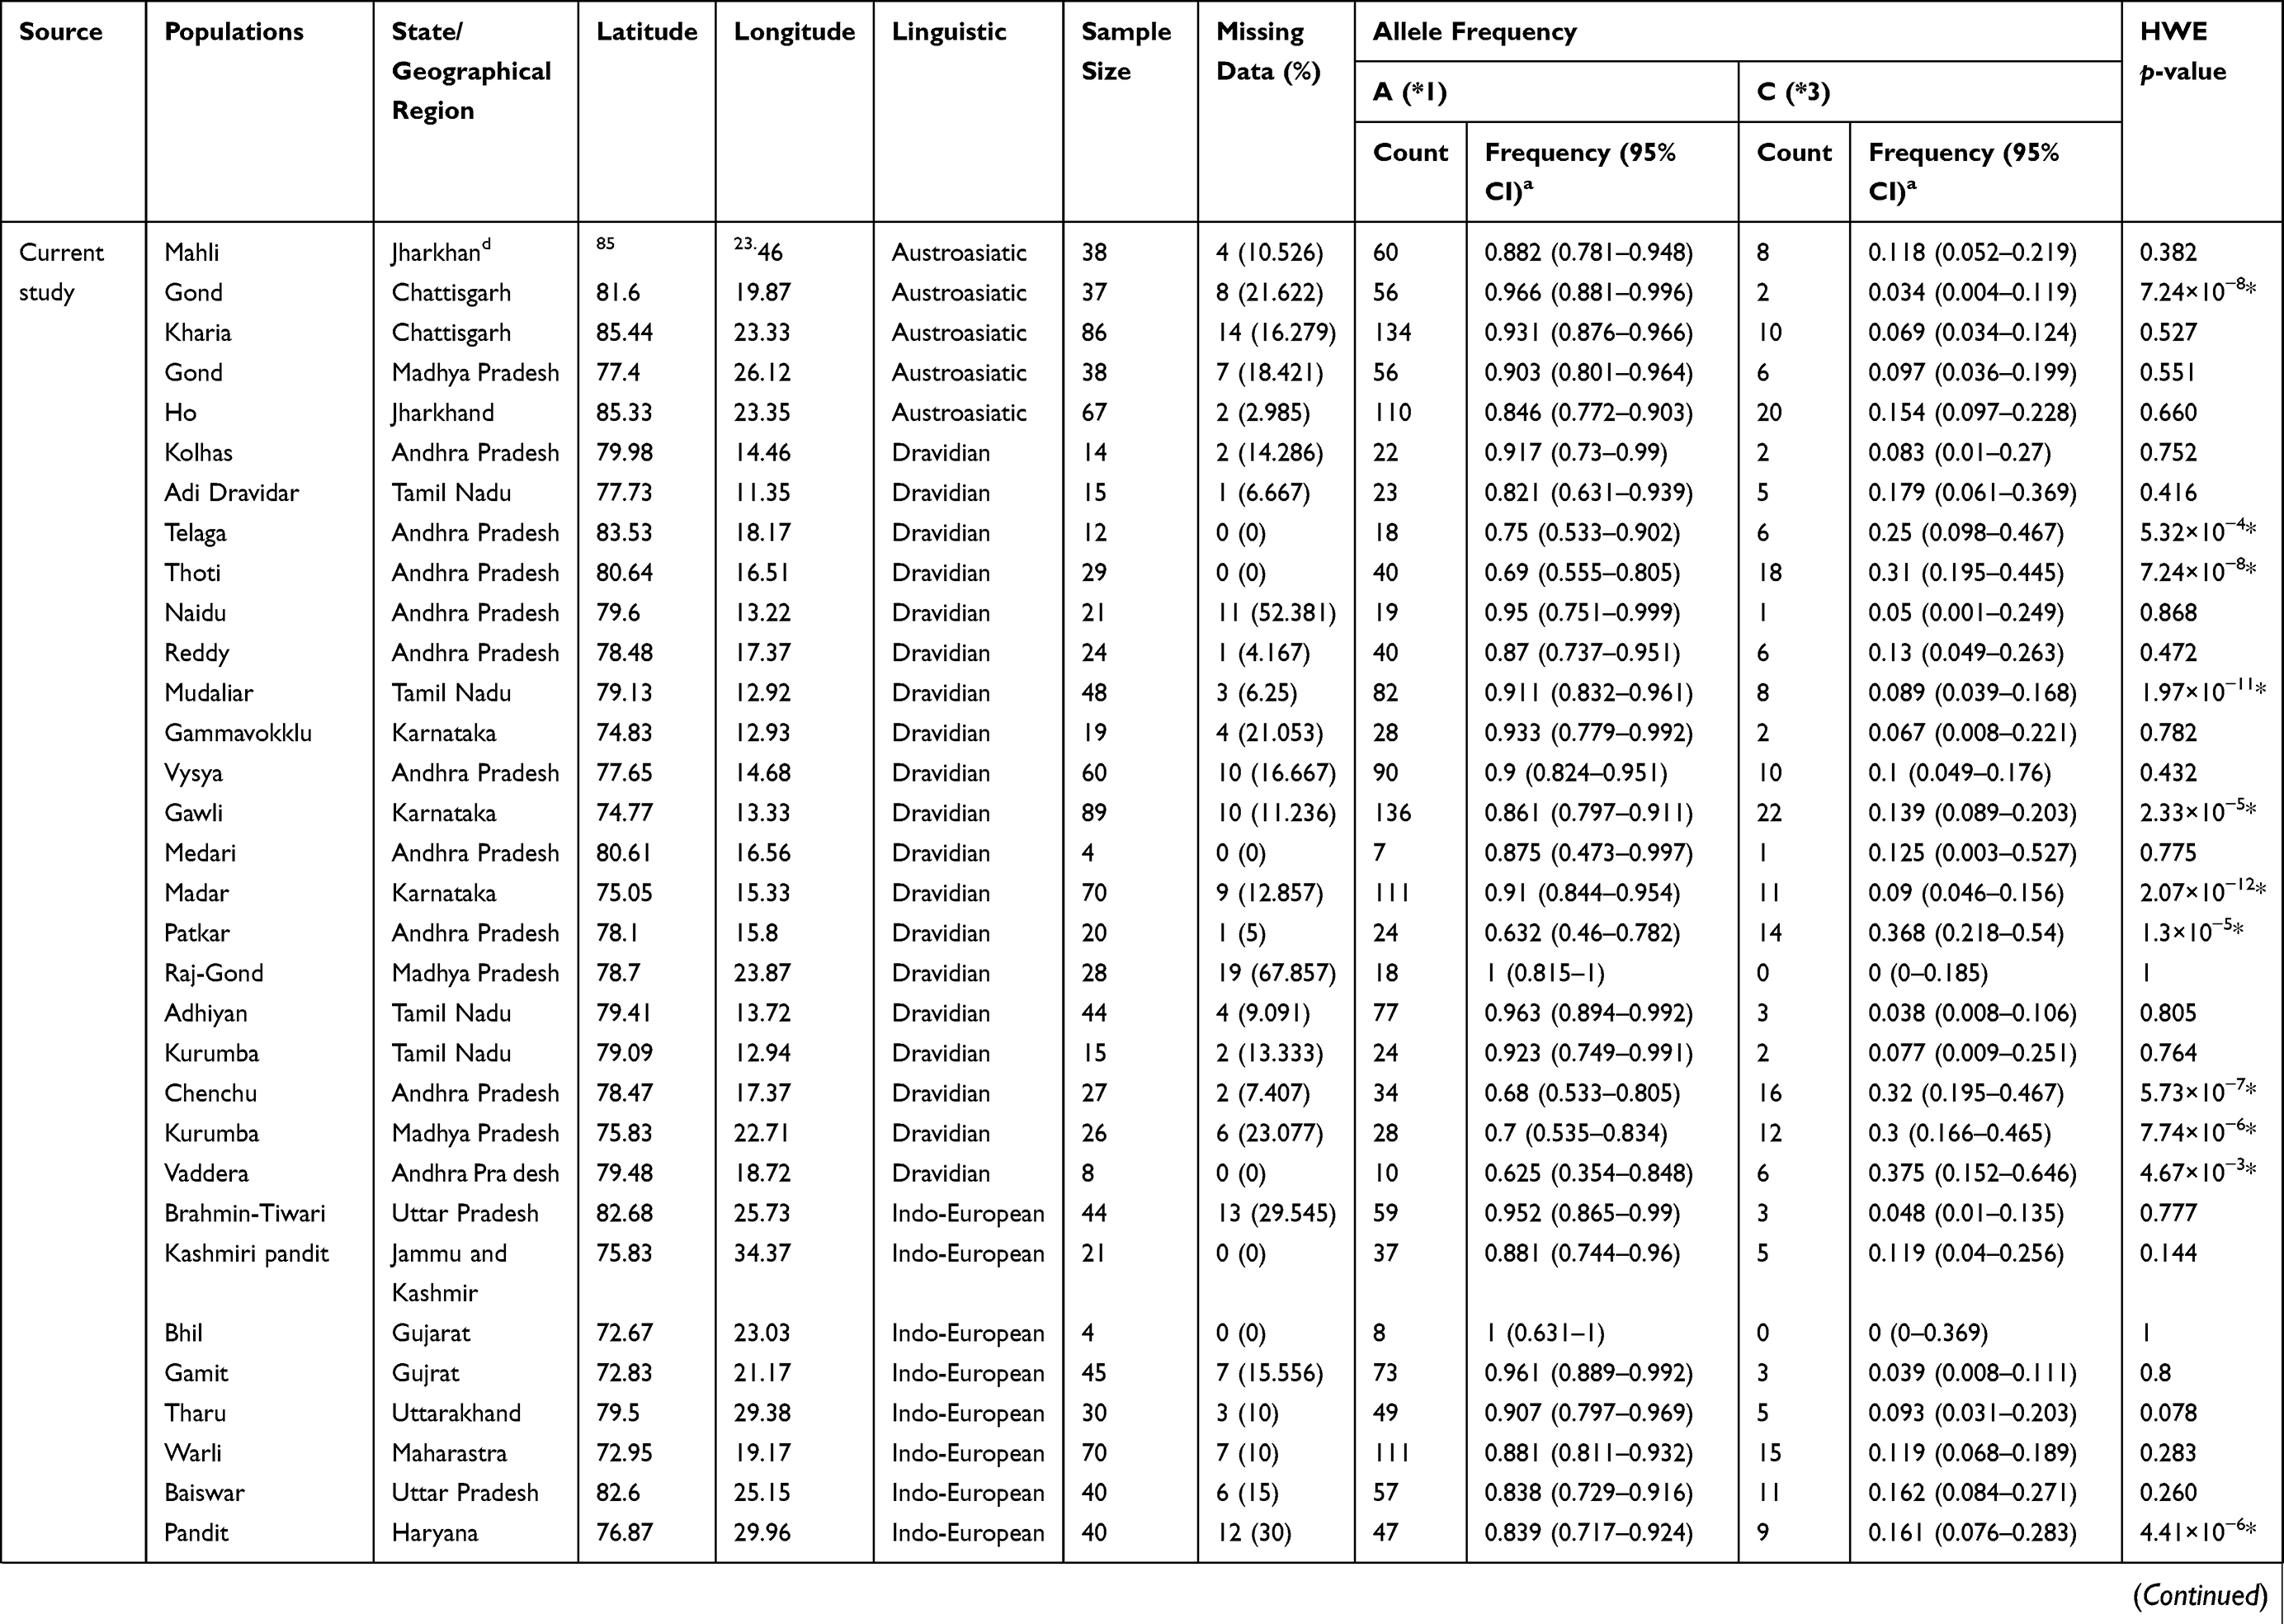 | 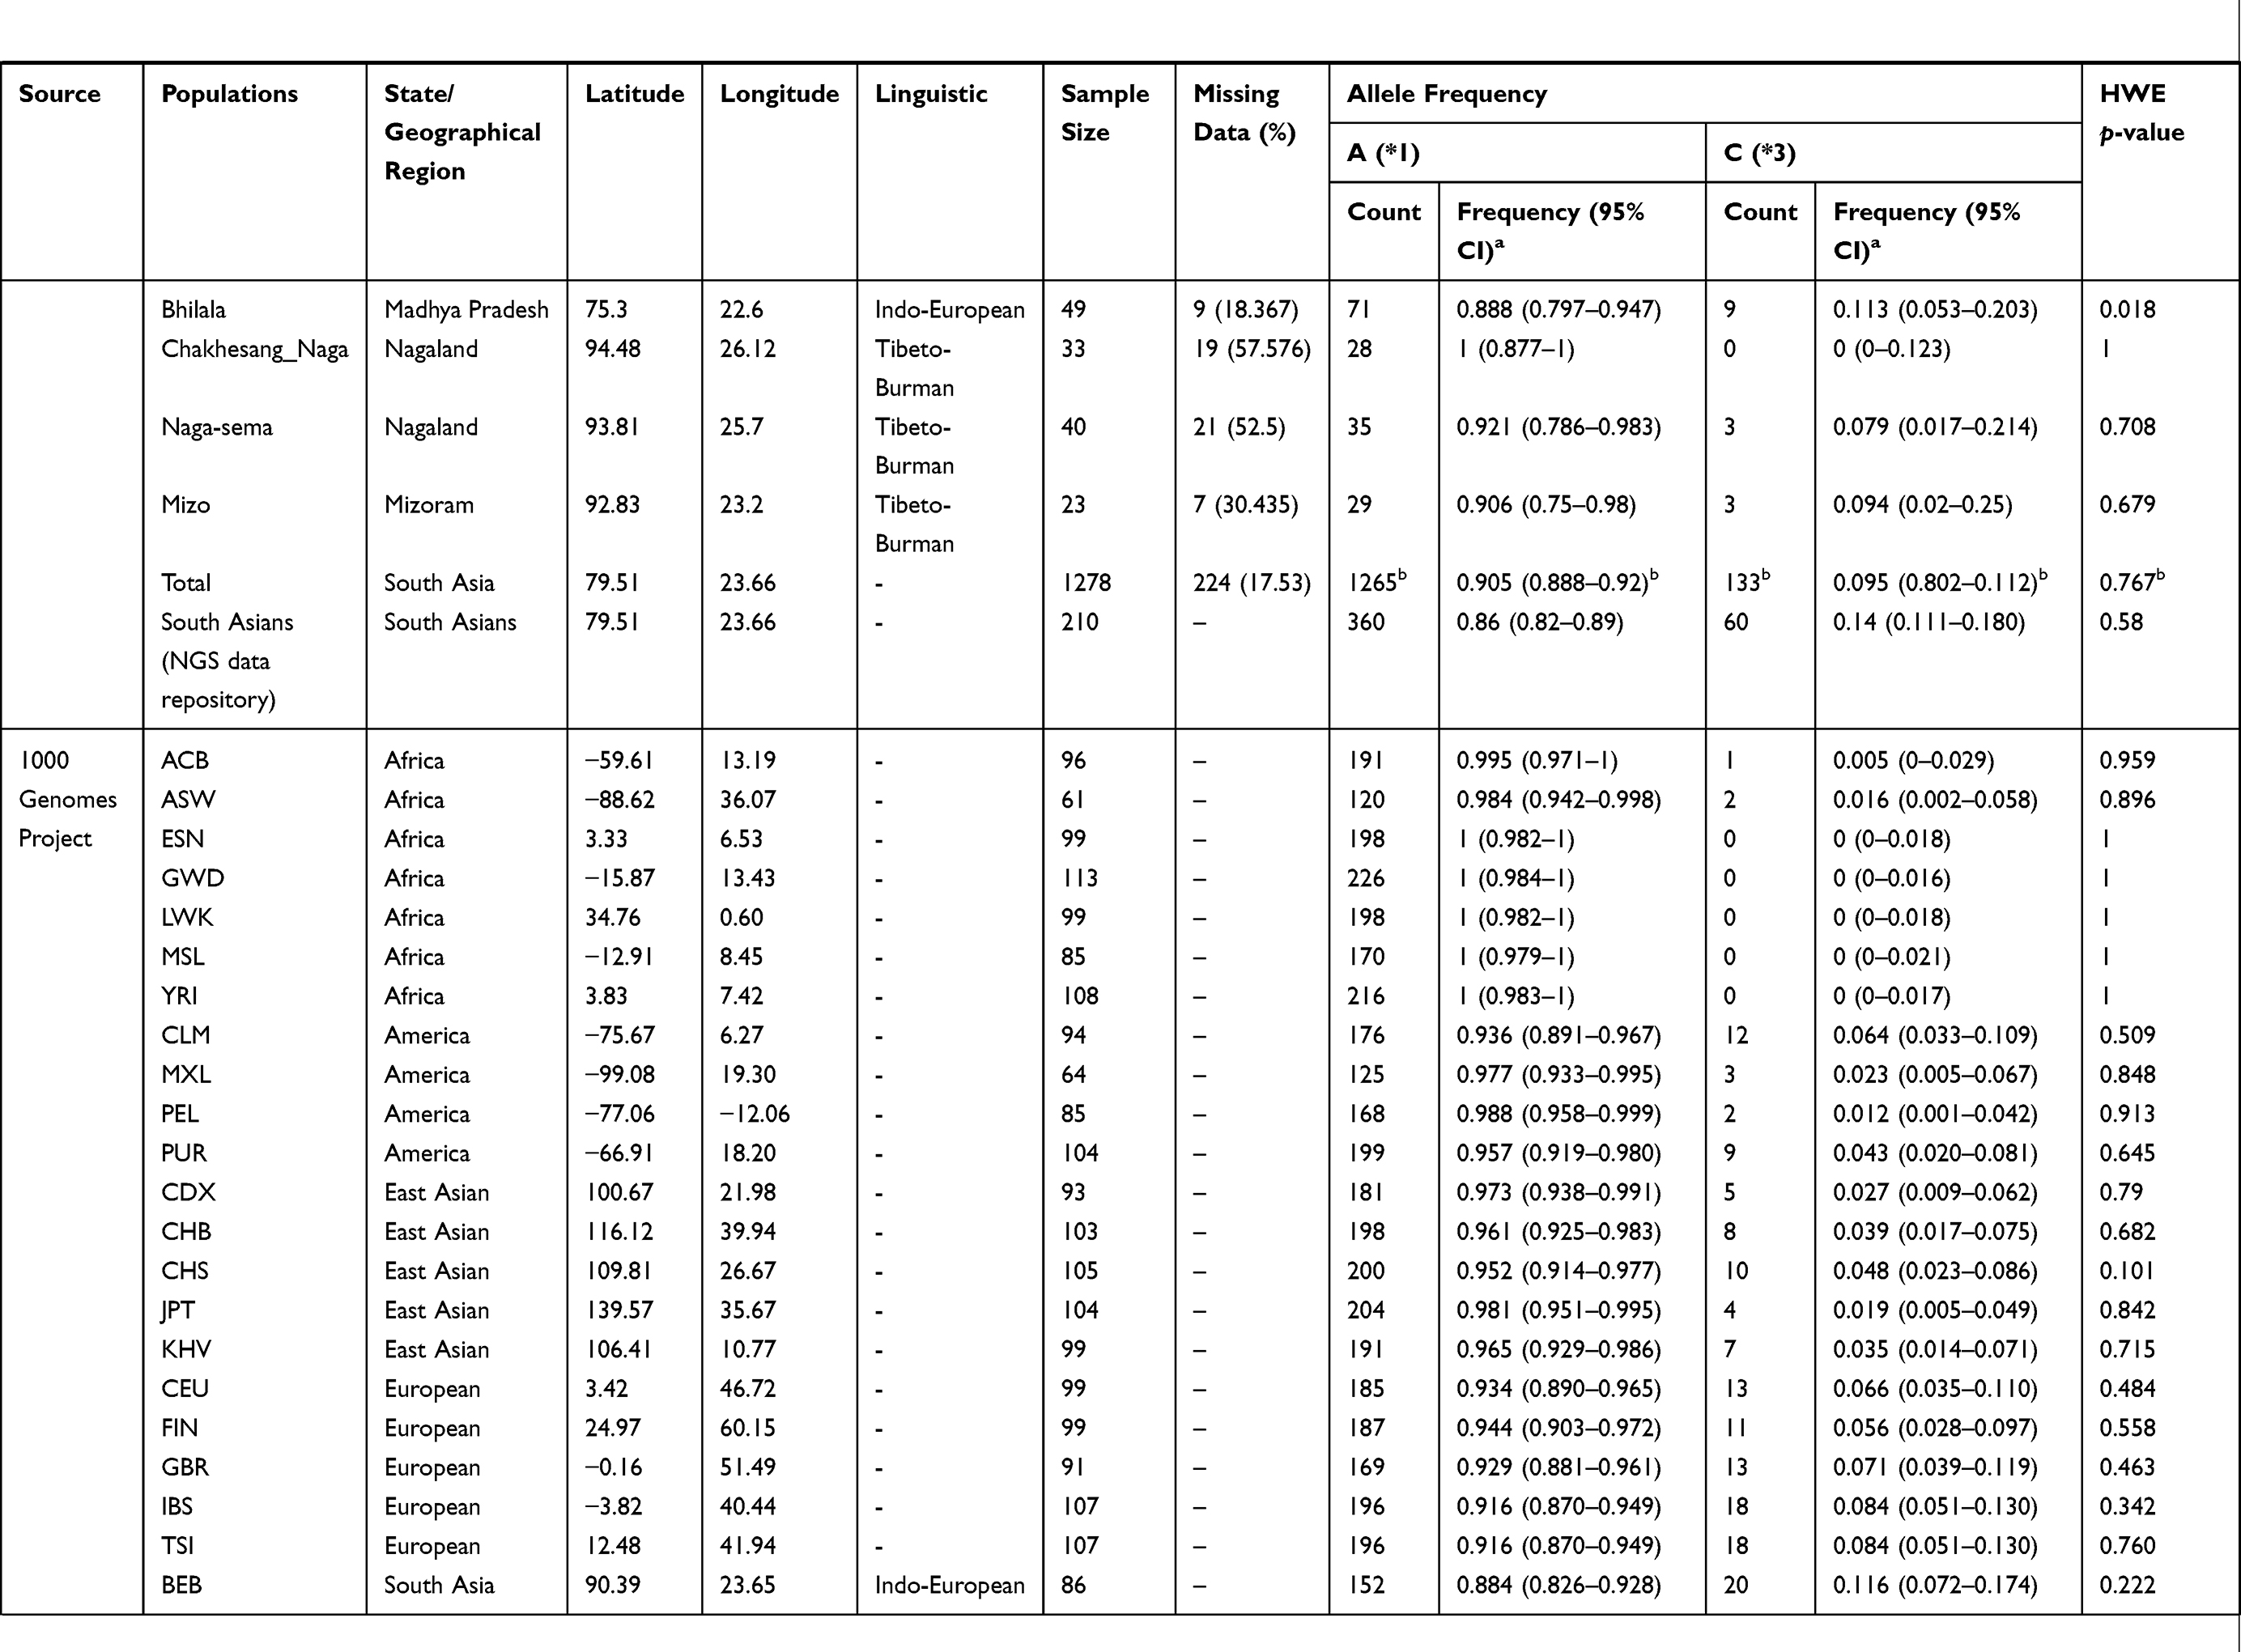 | 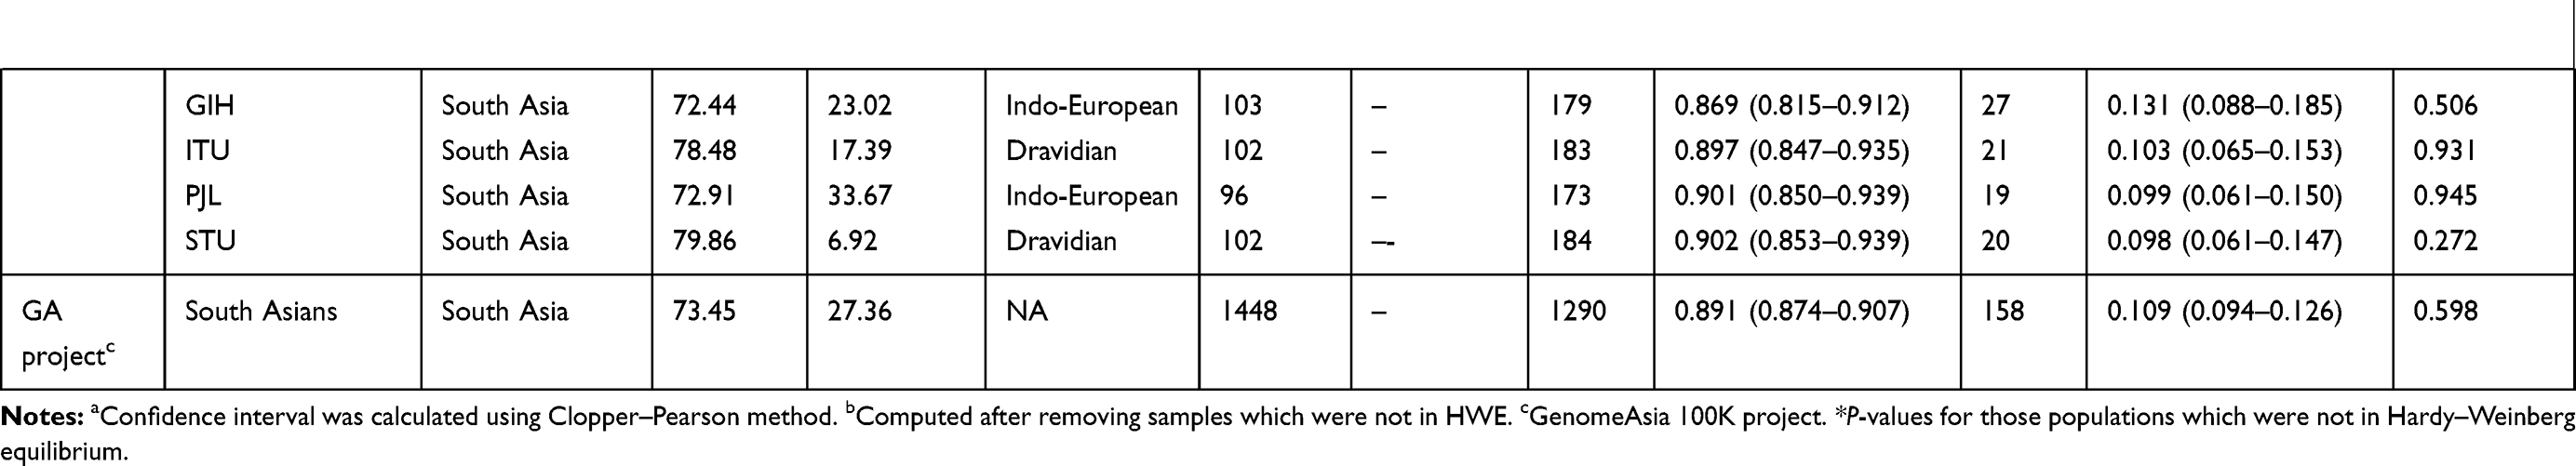 |
Table 1 Distribution of CYP2C9*1 and *3 Allele (I359L) in Different Ethnic Populations. |
Sample Collection and DNA Isolation
Ten milliliter intravenous blood samples of subjects were collected in an EDTA vacutainer, after obtaining informed written consent. Genomic DNA was extracted from whole blood, using the protocol described previously.16 These steps were followed for all samples which were subjected to either Sanger sequencing or next-generation sequencing (exome/genome).
Re-sequencing of CYP2C9, Genotyping and Analysis
All the nine exons, their respective intron-exon boundary, 3ʹ and 5ʹ UTR of CYP2C9 have been re-sequenced. For designing of primer, DNA sequence of ENST00000260682 from Ensembl (v75) has been used. Out of 3 mRNA of CYP2C9, only ENST00000260682 translate to protein. Primer3.0 web-based tool (http://simgene.com/Primer3) was used for designing the primers and further primers specificity were checked with NCBI-primer blast. The details of primer sequences are given in Supplementary Table 1. Polymerase chain reaction (PCR) was performed in 10.0 µL volume, which contains 5.0 µL of 2⨰ EmeraldAmp GT PCR master mix, 10.0 ng of genomic DNA and 0.1 p mole (final concentration) of each primer. Thermal cycling conditions used are as follows: initial denaturation step of five minutes at 94°C, followed by 35 cycles of denaturation step of 30 seconds. at 94°C, annealing step of 30 seconds. at 55°C, extension step of two minutes at 72°C, followed by single step of final extension of seven minutes at 72°C. PCR products were cleaned with Exo-SAP-IT (USB, Affymetrix, USA) with recommended protocol of the manufacturer. Cleaned PCR products (1.0 µL) were subjected to sequencing using BigDye terminator (v3.1) cycle sequencing kit (Thermo Fisher Scientific, USA) and analyzed using ABI 3730XL DNA Analyzer. Sequences were edited and assembled using AutoAssembler (v1.0) software. Statistical analysis was performed using R packages. Gap package was used to calculate HWE equilibrium. The 95% confidence interval of allelic and genotypic percentage was calculated with Clopper–Pearson and Sison–Glanz method using DescTools package of R. Surfer trial version (18.1.186) was used to interpolate frequency spectrum with Kriging gridding method and plots were generated using maps and spaMM package of R.
Next-Generation Sequencing (NGS)
For whole genome and exome sequencing, libraries were prepared as per manufacturer’s protocol using Illumina Nextera DNA Flex Library Prep kit and Illumina TrueSeq DNA LP for enrichment kit, respectively. Sequencing of above library was performed on Illumina NovaSeq 6000 system. On an average of 30⨰ and 100⨰ coverage was generated for the whole genome and exome, respectively.
Variants Calling, Annotation and Phasing
The sequencing data from all the samples was trimmed for adapters using Cutadapt (v2.7). The whole-genome datasets were aligned and processed to call variants using the pipeline of DRAGEN (v3.6.3), a Bio-IT platform for genome sequence data analysis. In case of whole-exome datasets, reads were aligned using the BWA tool (v0.7.10) and variants were called using the recommended pipeline of GATK4. The human reference genome version GRCh38 was used for the alignments of reads. The BCF tool was used to extract variants present in the CYP2C9. In the next step, all VCF files were combined with option “CombineGVCFs“ of GATK. Variants were annotated using “Variant Effect Predictor” tool of Ensembl (v95.3). For phasing of the variants, “PopgenPipeline Platform” (PPP) was used with PHASE algorithm of BEAGLE. Novel haplotypes obtained in the current study are deposited to PharmVar (https://www.pharmvar.org/).
Results
Diversity of CYP2C9*3 in Indian Populations
The A>C (rs1057910/CYP2C9*3) is a non-synonymous mutation, which replace isoleucine with leucine (ATT>CTT; Ile359Leu) and decreases enzyme activity. To explore the “C” allele frequency in Indian populations, initially we confirmed Hardy–Weinberg equilibrium (HWE). It was observed that 11 populations were not in HWE (p-value <0.01), which include one Indo-European population, Haryana Pandit (p-value=4.41×10⁻⁶), one Austroasiatic, Gond (p-value=7.24×10⁻⁸) and nine Dravidian populations; Mudaliar and Nadar from Tamil Nadu (p-value=1.97×10⁻¹¹ and 2.07×10⁻¹², respectively), Gawali from Karnataka (p-value=2.33×10⁻⁵), Kurumba from Kerala (p-value=7.74×10⁻⁶) and Thoti, Chenchu, Patkar and Vaddera from Andhra Pradesh (p-value=5.32×10⁻⁴, 7.24×10⁻⁸, 5.73×10⁻⁷, 1.3×10⁻⁵ and 4.67×10⁻³, respectively) (Table 1).
Initially, we excluded those samples, which were not in HWE and estimated 9.51% (133 out of 1398) “C” allele in Indian populations, similar (p-value=0.286 and 0.2425) to South Asian populations of the 1000 Genomes Project (107 out of 978) and the GenomeAsia 100K Project (158 out of 1448) (Figure 1A). Further, we categorized samples on the basis of their linguistic affiliation and observed that Tibeto-Burman have lowest percentage of “C” allele (6.12%; 6 out of 98). Moreover, we observed 9.82% (44 out of 448), 8.41% (32 out of 380) and 9.88% (51 out of 516) of “C” allele frequency in Austro-Asiatic, Dravidian and Indo-European populations, respectively (Table 1). Interestingly, Tibeto-Burmans are insignificantly different (p-value=0.1127) from East Asians (27 out of 1001). Adi Dravidiars (scheduled caste) of Tamil Nadu, Ho (scheduled tribe) of Jharkhand and Baiswar (caste) of Uttar Pradesh have 17.857%, 15.385% and 16.176% of CYP2C9*3, respectively, which are higher in their respective linguistic group; while “C” allele is completely absent in Bhil of Gujarat, Raj-Gond of Madhya Pradesh and Chakesang Naga of Nagaland (Table 1). Our findings suggest that a high level of local heterogeneity exists in Indian subcontinent and we did not find any correlation with geographical distance (Figure 1B and Table 1). It is evident in the allele frequency map that Indian populations have a high frequency of CYP2C9*3, compared to other world populations (Figure 1A and Table 1). We observed a decreasing gradient of “C” allele frequency from the Indian subcontinent to Europeans (Figure 1A).
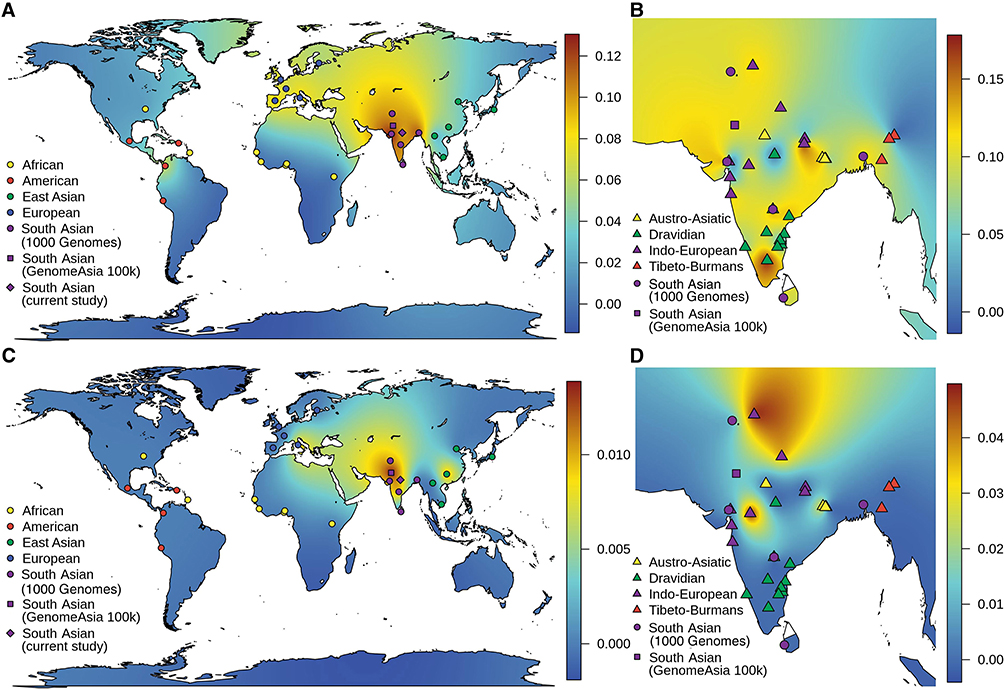 |
Figure 1 Geospatial frequency distribution of CYP2C9*3 and CYP2C9*3/*3. Genotypic and allelic frequency was interpolated with kriging method, and density map generated to explore geospatial frequency distribution. (A and C) represents the allelic (CYP2C9*3) and genotypic (CYP2C9*3/*3) distribution in world-wide population, while (B and D) represents distribution within South Asian populations. In (B and D), all samples from current study and the 1000 Genomes Project, present in HWE, were used in interpolation and represented as triangular and circle, respectively. It is evident in geospatial frequency map that South Asian populations have a high frequency of CYP2C9*3 and show high heterogeneity within the subcontinent. The same is true for CYP2C9*3/*3. |
On the basis of founder events and longtime practice of endogamy, we have already predicted a high frequency of homozygous alleles in Indian populations.9,17 Since CYP2C9*3/*3 significantly decreases metabolic activity of enzymes compared to both CYP2C9*1/*3 and CYP2C9*1/*1, it would be interesting to explore genotype frequencies also in Indian populations. As expected, we observed a higher percentage (<5%) of CYP2C9*3/*3 among Indians, comparative to other world populations, who have 0–1% (Figure 1C and Table 2). Out of 21 populations of the 1000 Genomes Project, who lived outside the Indian subcontinent, only TSI (Italian populations) and CHS (South Chinese populations) have homozygous genotype (0.9 and 1%), while out of five populations who are living in the Indian subcontinent, three (PJL, ITU, and GIH) have 1% of CYP2C9*3/*3 (Table 2). Moreover, 1.25% South Asian samples of the GenomeAsia 100K project, were homozygous for the CYP2C9*3 allele. In the present study, we observed 0–5% CYP2C9*3/*3, of which Bhilala of Madhya Pradesh and Ho of Jharkhand have 5% and 3%, respectively; higher in Indo-Europeans and Austro-Asiatic linguistic groups (Table 2 and Figure 1D). We did not observe homozygous genotype CYP2C9*3/*3 in Tibeto-Burman as well as in Dravidian populations after excluding the populations, which were not in HWE (Figure 1D). In the NGS data repository, “C” allele was observed in 14.28% (60 out of 420). Out of 210 subjects, five (2.39%) and 50 (23.81%) were homozygous and heterozygous for the “C” allele, respectively.
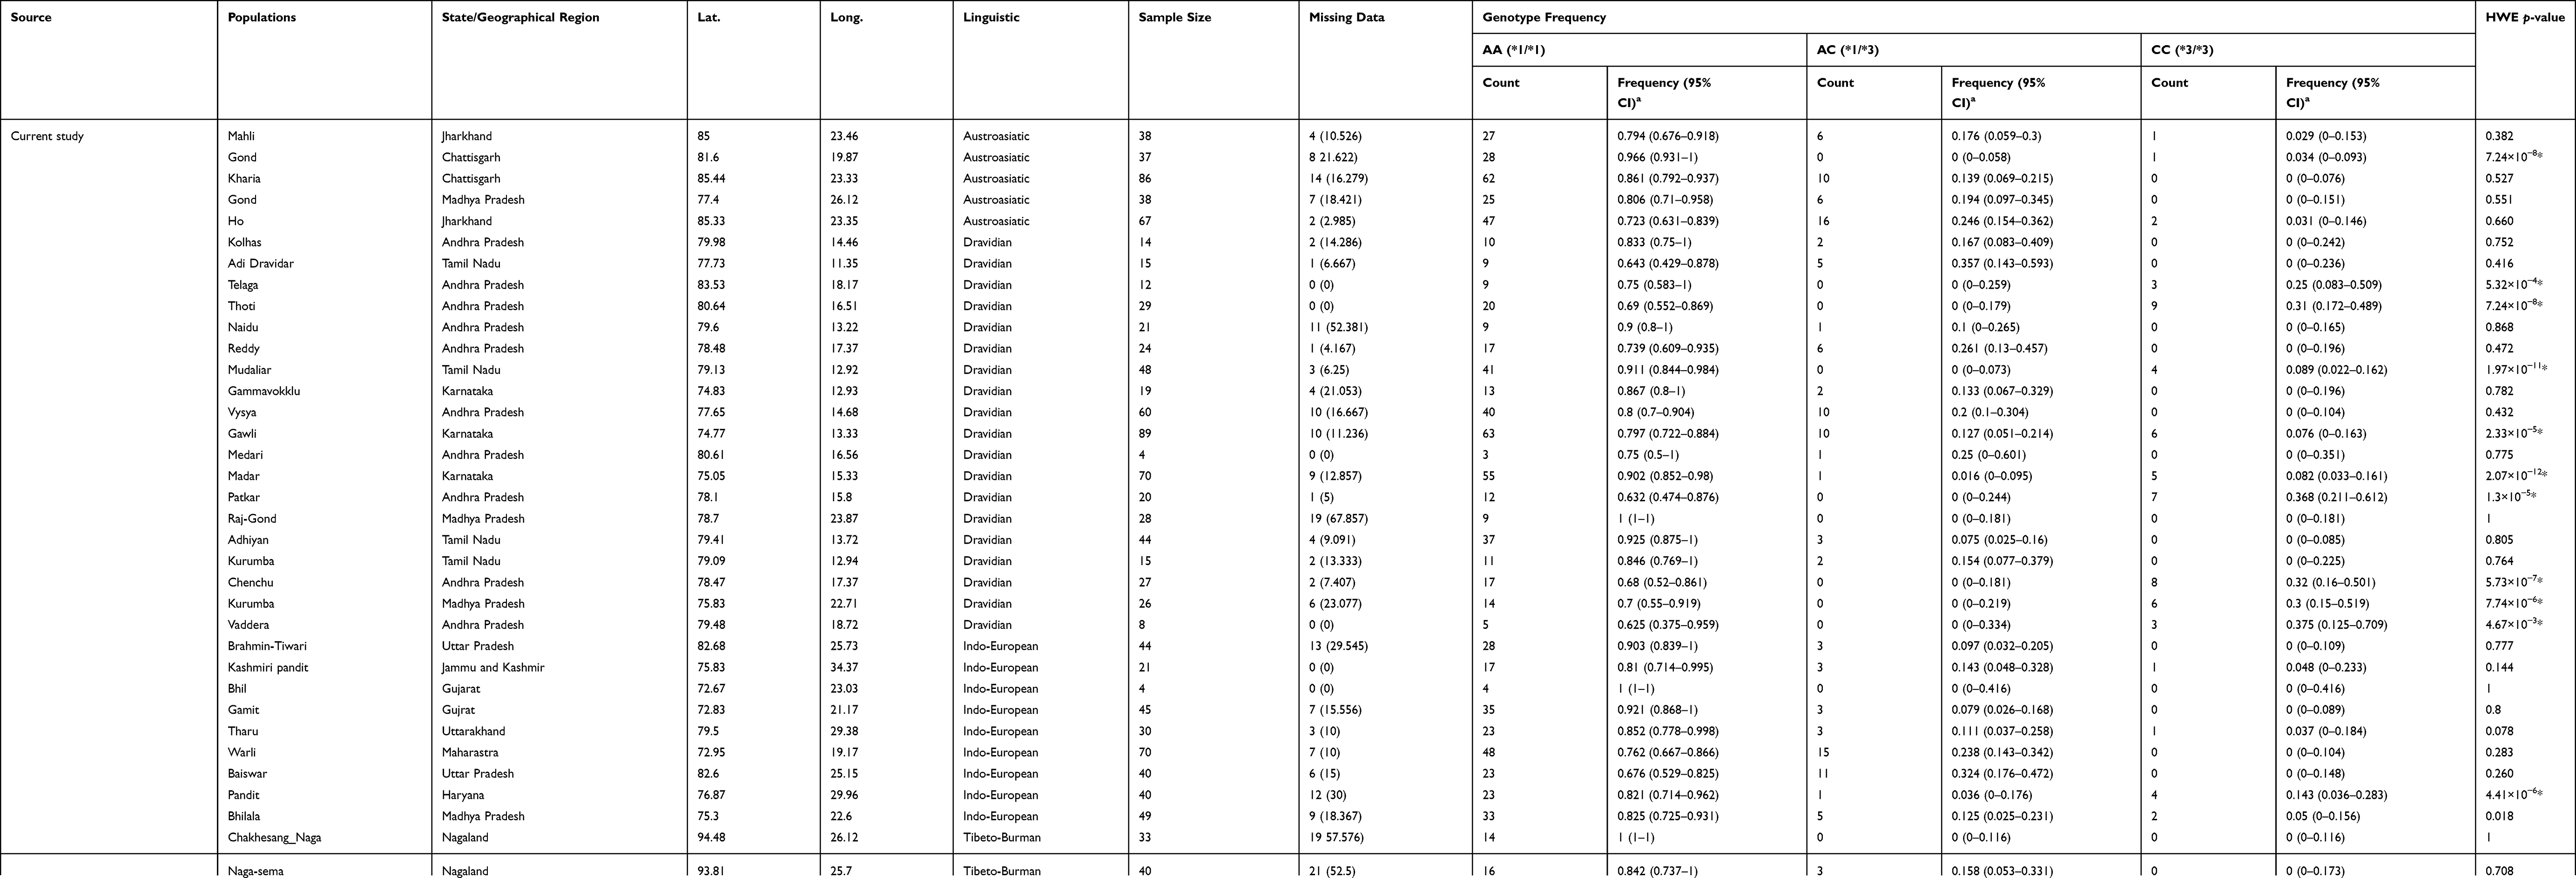 |
Table 2 Distribution of CYP2C9*1 and *3 Genotype in Different Ethnic Populations. |
Other Putative Functional Variants and Novel Haplotypes
A few rare nonsynonymous variants have also been observed in the current study. In 1278 samples, nonsynonymous C>T variant (rs28371685) which replaces the amino acid arginine with tryptophane (p.Arg335Trp) and determines the CYP2C9*11 haplogroup was found in three samples (one each in Chenchu, Telagas of Andhra Pradesh, and Mudliar of Tamil Nadu). Besides this, other functional variants rs1799853 (p.Arg144Cys) and rs72558189 (p.Arg335Trp) were observed in 10 and six samples of NGS data repository, respectively. These variants are associated with CYP2C9*2 and *14 haplotypes (Table 3).
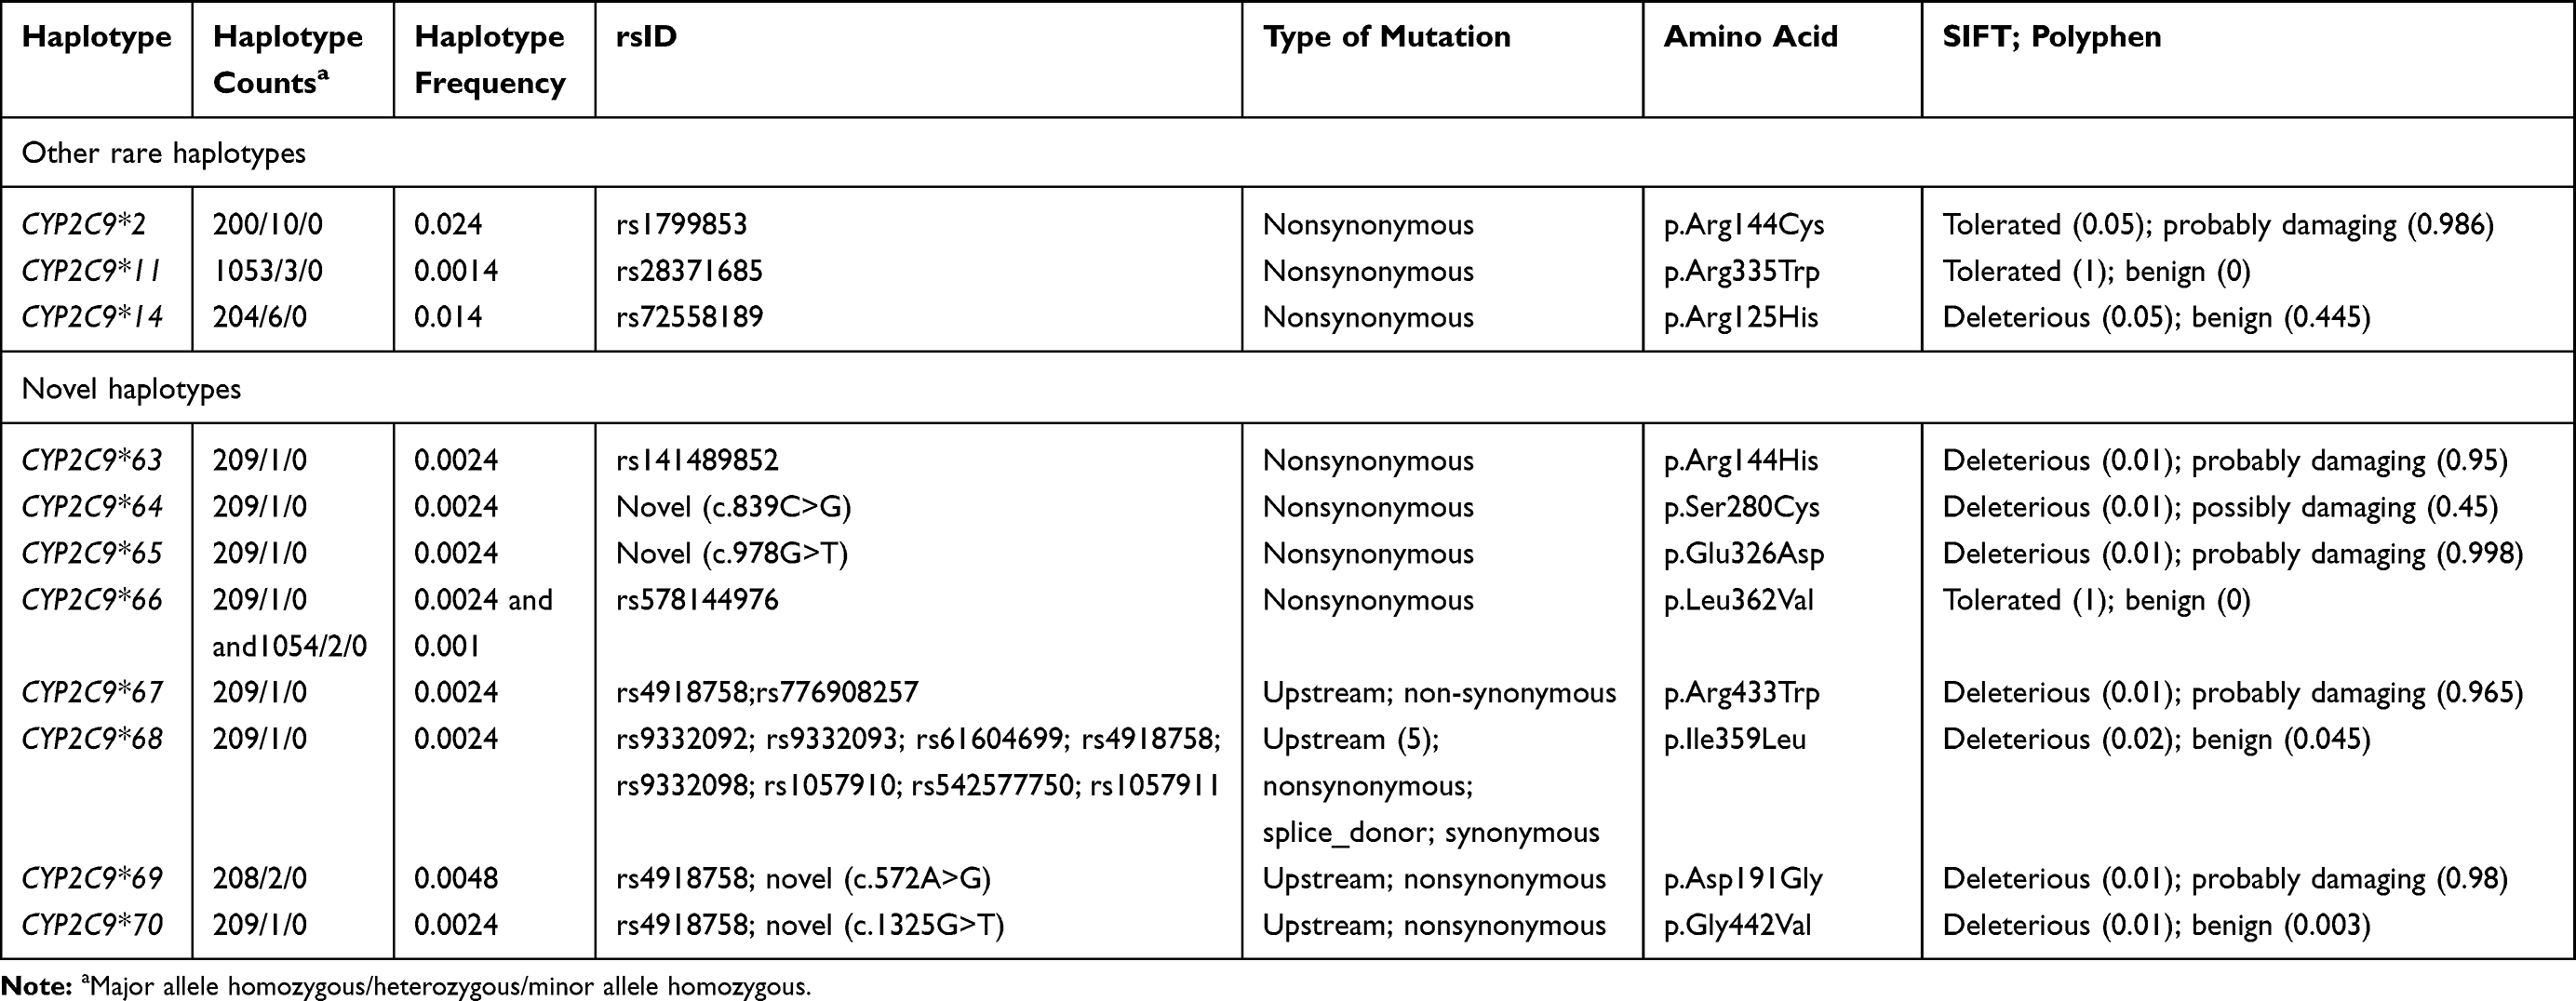 |
Table 3 Rare Putative Functional Variants and Associated CYP2C9 Haplotypes |
In total, eight rare and putative functional variants were not present in any reported CYP2C9 haplotypes. To determine the haplotypes, variants present within 3000 base-pair upstream and 250 base-pair downstream of CYP2C9 were utilized. In total, eight haplotypes were identified and annotation was obtained from PharmVar consortium (Table 3, Figure 2A and B). The haplotype CYP2C9*69 was identified in two subjects, CYP2C9*66 was identified in three subjects while other haplotypes were observed in only one subject. The nonsynonymous variants present in CYP2C9*63, *64, *65, *67 and *69 are predicted to be deleterious in both SIFT and Polyphen predictions. The p.Leu362Val present within CYP2C9*66 is predicted to be tolerated/benign. The Leu362 is present within hydrophobic substrate binding pocket of CYP2C9 and conversion from leucine to valine can affect assess of drug to the heme group of active site.24 A rare splice-site donor variant rs542577750 is present within CYP2C9*68 which can affect splicing of intron-7 (Figure 2B).
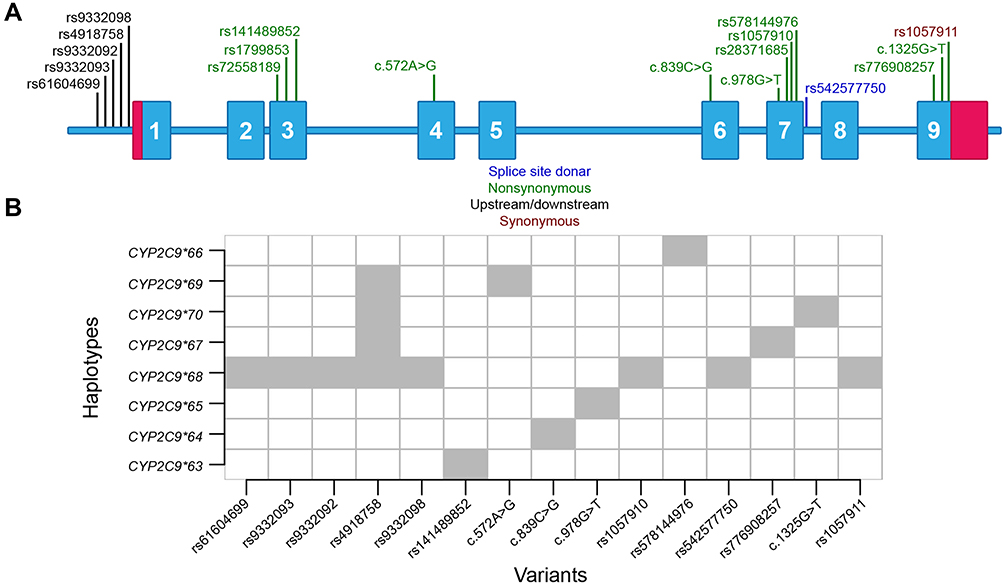 |
Figure 2 Distribution of variants in CYP2C9. (A) Rare and common putative functional variants observed in the current study. In total, 11 variants were nonsynonymous and one was splice donor variant. Other upstream and synonymous variants were used to determine haplotype of subjects. (B) Novel CYP2C9 haplotypes observed in current study. |
In the Genome Aggregation Database project (gnomAD), rs578144976 and rs542577750 is reported only in South Asian samples (allele frequency=0.00085 and 0.00049). Moreover, the c.839C>G, c.978G>T, c.572A>G and c.1325G>T was not observed in any subjects of the gnomAD project. Besides South Asian subjects, the rs141489852 and rs776908257 was observed in American and non-Finnish European populations also. It suggests that CYP2C9*64, *65, *66, *68, *69 and *70 haplotypes are South Asian-specific.
Discussion
CYP2C9 is highly expressed in the human liver and metabolizes a wide range of drugs. Several nonsynonymous mutations have been associated with less catalytic activity of CYP2C9 and intrinsic clearance of drugs. The CYP2C9*3 allele has been reported with hypersensitive reaction against phenytoin in epilepsy patients,18 and decreased metabolism of celecoxib.19 It was also reported with high incidence of response rate against sulfonamides, and urea derivatives.20 The in vitro studies suggest that CYP2C9*2 and CYP2C9*3 alleles reduce enzyme activity 29–94% and 71–91%, respectively, clearance rate of many drugs, which includes S-warfarin, tolbutamide, fluvastatin, glimepiride, tenoxicam, candesartan, celecoxib and phenytoin.21 Of which, S-warfarin, phenytoin and tolbutamide have a narrow therapeutic index and patients need the right amount of drug depending upon age, gender, and genetic make-up for successful treatment of disease. Moreover, homozygous mutations have more effect compared to heterozygous. The CYP2C9*3/*3 reduces 95% compared to 64% clearance rate by CYP2C9*1/*3.22 Considering the higher level of evidence of association between CYP2C9*3 and drug response, CPIC (Clinical Pharmacogenomics Implementation Consortium) categorized CYP2C9*3 under level-1A.23
Many studies have shown that the variations in CYP2C9 are associated with therapeutic heterogeneity in Indian populations. CYP2C9*2 and *3 have been reported with less hydroxylation (or metabolism) of phenytoin in vivo in South Indian populations,10 compared to wild type CYP2C9*1. Ramasamy et al reported phenytoin toxicity in a patient with normal dose of 300 mg/day, who had CYP2C9*3/*3 genotype.11 The same symptoms were also reported by Thakkar et al in South Indian populations.12 South Asians have a unique evolutionary history and have been practicing endogamy for many centuries, hence the high frequency of homozygous CYP2C9*3/*3 identified in the current study is not surprising. A similar trend was also observed in samples of the 1000 Genomes Project in which South Asians have high allelic and genotypic frequency of CYP2C9*3. Since CYP2C9*3/*3 has a more pronounced effect, we predict heterogeneous drug response in South Asians compared to other world populations. It would be interesting to find out if all South Asian populations have a high frequency of CYP2C9*3 and *3/*3 alleles. We explored the frequency distribution, but did not find any correlation with linguistic or geographical location. Some of the populations have a high frequency of CYP2C9*3, eg 35.7% of individuals from the Adi Dravidars have the CYP2C9*3 allele, while some of the populations have a low frequency of the CYP2C9*3 allele. Approximately 14–28%, 0–36%, 0–32%, and 0–19% of individuals speaking Austro-Asiatic, Dravidian, Indo-European and Tibeto-Burman languages had the CYP2C9*3 allele. This suggests that South Asians are highly heterogeneous for this locus. Moreover, patients from Vysya, Mahli, Warli, Medari, Reddy, Ho, Baiswar, and Adi Dravidar populations, who have >20% individuals with CYP2C9*3 allele, should be genotyped for better treatment of disease. But this approach must be established first and its efficacy must be evaluated. We also find other rare haplotypes. Of which, three were already reported and eight were novel. Out of eight novel haplotypes, CYP2C9*64, *65, *66, *68, *69*70 and haplotypes are South Asian-specific as variants present within these haplotypes are reported only in South Asian subjects of the gnomAD project. All of the novel haplotypes are predicted to be deleterious and may have effects on protein function. It would be interesting to explore the effects of these novel haplotypes on the metabolic activity of CYP2C9 and find genetic association with therapeutic response in large samples.
Conclusions
In conclusion, we identified high genetic heterogeneity in CYP2C9 locus among South Asian populations. We observed higher frequency of CYP2C9*3 and CYP2C9*3/*3 alleles among South Asian populations, compared to populations from the rest of the world. The CYP2C9*3 has been associated with therapeutic response. Moreover, in the in vitro studies, the effect of CYP2C9*3/*3 allele was seen more pronounced compared to heterozygous and wild type homozygous genotype. As South Asians have a high frequency of CYP2C9*3, it would be interesting to explore the potential of CYP2C9*3 as marker for personalized therapy. Furthermore, it would be interesting to compare frequency of responder and nonresponder patients among populations and to find correlation with frequency spectrum of pharmacologically important variations. We also observed several nonsynonymous rare variants and novel haplotypes (CYP2C9*63-*70) in the present study. Of which, CYP2C9*64, *65, *66, *68, *69 and *70 haplotypes are South Asian-specific. The SIFT and PolyPhen algorithm predicts that these variants are deleterious and damaging. Therefore, individuals having CYP2C9 haplotypes with deleterious variants may have different metabolic activity compared to wild type. Collectively, our data provide fundamental knowledge of CYP2C9 genetic polymorphisms in South Asia, which could be relevant to further CYP2C9-related functional research and for personalized medicine.
Acknowledgments
We express our deepest condolence on the passing away of Mr Saurav Sharma. This work was supported by Council of Scientific and Industrial Research (CSIR), Government of India. Sheikh Nizamuddin was supported by ICMR JRF-SRF research fellowship. KT was supported by J C Bose Fellowship from Science and Engineering Research Board (SERB), Department of Science and Technology, Government of India (GAP0542). We thank Prof. Andrea Gaedigk for her help in submission of haplotypes to the PharmVar consortium.
Disclosure
The authors report no conflicts of interest in this work.
References
1. Miners JO, Birkett DJ. Cytochrome P4502C9: an enzyme of major importance in human drug metabolism. Br J Clin Pharmacol. 1998;45(6):525–538. doi:10.1046/j.1365-2125.1998.00721.x
2. Sullivan-Klose TH, Ghanayem BI, Bell DA, et al. The role of the CYP2C9-Leu359 allelic variant in the tolbutamide polymorphism. Pharmacogenetics. 1996;6(4):341–349. doi:10.1097/00008571-199608000-00007
3. Yasuda SU, Zhang L, Huang SM. The role of ethnicity in variability in response to drugs: focus on clinical pharmacology studies. Clin Pharmacol Ther. 2008;84(3):417–423.
4. Kidd RS, Curry TB, Gallagher S, Edeki T, Blaisdell J, Goldstein JA. Identification of a null allele of CYP2C9 in an African-American exhibiting toxicity to phenytoin. Pharmacogenetics. 2001;11(9):803–808. doi:10.1097/00008571-200112000-00008
5. Kimura M, Ieiri I, Mamiya K, Urae A, Higuchi S. Genetic polymorphism of cytochrome P450s, CYP2C19, and CYP2C9 in a Japanese population. Ther Drug Monit. 1998;20(3):243–247. doi:10.1097/00007691-199806000-00001
6. Si D, Wang J, Zhang Y, Zhong D, Zhou H. Distribution of CYP2C9*13 allele in the Chinese Han and the long-range haplotype containing CYP2C9*13 and CYP2C19*2. Biopharm Drug Dispos. 2012;33(6):342–345. doi:10.1002/bdd.1804
7. Dai DP, Xu RA, Hu LM, et al. CYP2C9 polymorphism analysis in Han Chinese populations: building the largest allele frequency database. Pharmacogenomics J. 2014;14(1):85–92. doi:10.1038/tpj.2013.2
8. Giri AK, Khan NM, Grover S, et al. Genetic epidemiology of pharmacogenetic variations in CYP2C9, CYP4F2 and VKORC1 genes associated with warfarin dosage in the Indian population. Pharmacogenomics. 2014;15(10):1337–1354. doi:10.2217/pgs.14.88
9. Reich D, Thangaraj K, Patterson N, Price AL, Singh L. Reconstructing Indian population history. Nature. 2009;461(7263):489–494. doi:10.1038/nature08365
10. Rosemary J, Surendiran A, Rajan S, Shashindran CH, Adithan C. Influence of the CYP2C9 AND CYP2C19 polymorphisms on phenytoin hydroxylation in healthy individuals from south India. Indian J Med Res. 2006;123(5):665–670.
11. Ramasamy K, Narayan SK, Chanolean S, Chandrasekaran A. Severe phenytoin toxicity in a CYP2C9*3*3 homozygous mutant from India. Neurol India. 2007;55(4):408–409. doi:10.4103/0028-3886.33300
12. Thakkar AN, Bendkhale SR, Taur SR, Gogtay NJ, Thatte UM. Association of CYP2C9 polymorphisms with phenytoin toxicity in Indian patients. Neurol India. 2012;60(6):577–580. doi:10.4103/0028-3886.105189
13. Moorjani P, Thangaraj K, Patterson N, et al. Genetic evidence for recent population mixture in India. Am J Hum Genet. 2013;93(3):422–438. doi:10.1016/j.ajhg.2013.07.006
14. Genomes Project C, Auton A, Brooks LD, et al. A global reference for human genetic variation. Nature. 2015;526(7571):68–74.
15. GenomeAsia KC. The GenomeAsia 100K Project enables genetic discoveries across Asia. Nature. 2019;576(7785):106–111.
16. Thangaraj K, Joshi MB, Reddy AG, Gupta NJ, Chakravarty B, Singh L. CAG repeat expansion in the androgen receptor gene is not associated with male infertility in Indian populations. J Androl. 2002;23(6):815–818.
17. Nakatsuka N, Moorjani P, Rai N, et al. The promise of discovering population-specific disease-associated genes in South Asia. Nat Genet. 2017;49(9):1403–1407. doi:10.1038/ng.3917
18. Ramasamy K, Narayan SK, Shewade DG, Chandrasekaran A. Influence of CYP2C9 genetic polymorphism and undernourishment on plasma-free phenytoin concentrations in epileptic patients. Ther Drug Monit. 2010;32(6):762–766. doi:10.1097/FTD.0b013e3181fa97cc
19. Tang C, Shou M, Rushmore TH, et al. In-vitro metabolism of celecoxib, a cyclooxygenase-2 inhibitor, by allelic variant forms of human liver microsomal cytochrome P450 2C9: correlation with CYP2C9 genotype and in-vivo pharmacokinetics. Pharmacogenetics. 2001;11(3):223–235. doi:10.1097/00008571-200104000-00006
20. Zhou K, Donnelly L, Burch L, et al. Loss-of-function CYP2C9 variants improve therapeutic response to sulfonylureas in type 2 diabetes: a Go-DARTS study. Clin Pharmacol Ther. 2010;87(1):52–56.
21. Lee CR, Goldstein JA, Pieper JA. Cytochrome P450 2C9 polymorphisms: a comprehensive review of the in-vitro and human data. Pharmacogenetics. 2002;12(3):251–263. doi:10.1097/00008571-200204000-00010
22. Yasar U, Tybring G, Hidestrand M, et al. Role of CYP2C9 polymorphism in losartan oxidation. Drug Metab Dispos. 2001;29(7):1051–1056.
23. Thorn CF, Klein TE, Altman RB. PharmGKB: the pharmacogenomics knowledge base. Methods Mol Biol. 2013;1015:311–320.
24. Williams PA, Cosme J, Ward A, Angove HC, MatakVinkovic D, Jhoti H. Crystal structure of human cytochrome P450 2C9 with bound warfarin. Nature. 2003;424(6947):464–468. doi:10.1038/nature01862
 © 2021 The Author(s). This work is published and licensed by Dove Medical Press Limited. The full terms of this license are available at https://www.dovepress.com/terms.php and incorporate the Creative Commons Attribution - Non Commercial (unported, v3.0) License.
By accessing the work you hereby accept the Terms. Non-commercial uses of the work are permitted without any further permission from Dove Medical Press Limited, provided the work is properly attributed. For permission for commercial use of this work, please see paragraphs 4.2 and 5 of our Terms.
© 2021 The Author(s). This work is published and licensed by Dove Medical Press Limited. The full terms of this license are available at https://www.dovepress.com/terms.php and incorporate the Creative Commons Attribution - Non Commercial (unported, v3.0) License.
By accessing the work you hereby accept the Terms. Non-commercial uses of the work are permitted without any further permission from Dove Medical Press Limited, provided the work is properly attributed. For permission for commercial use of this work, please see paragraphs 4.2 and 5 of our Terms.