")
Back to Journals » OncoTargets and Therapy » Volume 9
CX-5461 induces autophagy and inhibits tumor growth via mammalian target of rapamycin-related signaling pathways in osteosarcoma
Authors Li L, Li Y, Zhao J , Fan S, Wang L, Li X
Received 18 January 2016
Accepted for publication 3 May 2016
Published 29 September 2016 Volume 2016:9 Pages 5985—5997
DOI https://doi.org/10.2147/OTT.S104513
Checked for plagiarism Yes
Review by Single anonymous peer review
Peer reviewer comments 3
Editor who approved publication: Dr Faris Farassati
Leiming Li,1,* Yan Li,2,* Jiansong Zhao,2 Shuli Fan,3 Liguo Wang,1 Xu Li1
1Department of Joint Surgery and Sports Medicine, The First Affiliated Hospital, 2Department of Spine and Joint Surgery, Sheng Jing Hospital, 3Department of Geriatrics, The First Affiliated Hospital, China Medical University, Shenyang, People’s Republic of China
*These authors contributed equally to this work
Abstract: Osteosarcoma (OS) is the most common primary bone tumor, but molecular mechanisms of the disease have not been well understood, and treatment of metastatic OS remains a challenge. Rapid ribosomal RNA synthesis in cancer is transcribed by RNA polymerase I, which results in unbridled cell growth. The recent discovery of CX-5461, a selective RNA polymerase I inhibitor, exerted its inhibitory effect of ribosomal RNA synthesis and antiproliferative potency. Here, we demonstrate that CX-5461 induces G2 arrest in the cell cycle and expression of microtubule-associated protein 1 light chain 3 II isoform in OS cell lines. Autophagic vacuoles could be observed in electron microscopy and 3-methyladenine prevented cell death mediated by CX-5461. Moreover, it significantly augmented phosphorylated AMP-Activated Protein Kinases α (p-AMPK α). (Thr172) expression in U2-OS cells and decreased p-Akt (Ser473) expression in MNNG cells, respectively, which repressed their downstream effector, mammalian target of rapamycin. On the other hand, CX-5461 increased p53 accumulation and messenger RNA level of its target genes, p21, MDM2, and Sestrin1/2 in U2-OS cells. Knockdown of p53 expression markedly impaired cell death as well as the expression of light chain 3-II and p21 induced by CX-5461. It also significantly enhanced doxorubicin-mediated cytotoxic effect in vitro and in vivo together with additive expression of p53, p21, and light chain 3-II in U2-OS cells. Our data indicate that CX-5461 might induce autophagy via mammalian target of rapamycin-associated signaling pathways dependent on p53 status and exert p53-dependent synergistic antitumor effect combined with doxorubicin in OS. These results suggest that CX-5461 might be promising in clinical therapy for OS, especially cases harboring wild-type p53.
Keywords: RNA polymerase I inhibitor, AMPK, combined chemotherapy
Introduction
Osteosarcoma (OS) is the most common primary malignant bone tumor in childhood and adolescence. Treatment modalities of neoadjuvant chemotherapy (high-dose methotrexate, adriamycin, and cisplatin) and limb salvage surgery have improved 5-year overall survival by 65%–70% in patients with local disease, but clinical outcome for patients with metastatic or relapsed OS was not satisfactory in the past 4 decades.1 OS appears to be a most heterogeneous disease with complex karyotypes in sarcoma. Despite evidence of genomic instability and a high frequency of chromothripsis and kataegis, OS carries few targetable mutations which can predict clinical prognosis and trials of target-therapy agents have been generally disappointing.2–4
In eukaryotes, transcription of nuclear genes is shared by three RNA polymerases (Pols), including Pol I, II, and III. RNA Pol I is dedicated exclusively to transcribing ribosomal RNA (rRNA) genes; RNA Pol II transcribes protein-coding genes as well as many genes that encode small nuclear RNA molecules; and RNA Pol III synthesizes various short untranslated RNA molecules, such as 5S rRNA and transfer RNA (tRNA). Ribosome biogenesis normally controls cell growth and rRNA synthesis in the nucleolus is its rate-limiting step.5 Deregulated rRNA synthesis plays a fundamental role in tumorigenesis.6–9 Although the link between nucleolar stress and cancer has been recognized for more than a century, several approved anticancer therapeutics which have been shown to inhibit rRNA synthesis, such as cisplatin, 5-fluorouracil, and actinomycin D, could not specially target Pol I transcription. CX-5461 is a recently discovered small-molecule selective Pol I inhibitor, which can inhibit Pol I-driven rRNA transcription via disrupting the recruitment of Pol I to rDNA promoter, but does not inhibit Pol II-driven messenger RNA (mRNA) synthesis or DNA replication or protein translation.10 Several studies demonstrated that CX-5461 could inhibit the initiation stage of rRNA synthesis and induce different types of programmed cell death in solid tumors and hematologic malignancies.10–12
In the present study, we have demonstrated that CX-5461 effectively inhibited cell proliferation and induced G2 cell cycle arrest, light chain 3 (LC3)-II expression, and the production of autophagic vacuoles in OS human cell lines by the suppression of mammalian target of rapamycin (mTOR)-associated signaling axis involved in its upstream regulators, AMPK in U2-OS cells, and Akt in MNNG cells, respectively. On the other hand, CX-5461 increased p53 stabilization and its transcriptional activity in U2-OS cells. Knockdown of p53 expression markedly impaired cell death as well as expression of LC3-II and p21 induced by CX-5461. It also significantly enhanced doxorubicin (DOX)-mediated antitumor effect in vitro and in vivo in U2-OS cells. Our study elucidates different molecular mechanisms underlying CX-5461-induced autophagy in a different genetic context of p53. This is also the first report showing that CX-5461 can induce p53-dependent autophagy and exert potential synergistic efficiency in combined chemotherapy for OS harboring wild-type p53.
Materials and methods
Cell lines and reagents
The OS cell lines MNNG/HOS (mutant p53), U2-OS (wild-type p53), and a murine fibroblast cell line NIH3T3 were obtained from Shanghai Institutes for Biological Science, Chinese Academy of Sciences (Shanghai, People’s Republic of China) and cultured in Dulbecco’s Modified Eagle’s Medium or Roswell Park Memorial Institute 1640 medium (Thermo Fisher Scientific, Waltham, MA, USA) supplemented with 10% fetal bovine serum and 100 μg/mL penicillin and streptomycin. The overall study was approved by the Institutional Research Boards of China Medical University.
DOX and CX-5461 compounds were purchased from Selleck Chemicals (Houston, TX, USA). A stock solution of 10 mM CX-5461 was prepared in 50 mM NaH2PO4 (pH 4.5) and diluted in growth media to working concentrations prior to treatment. 3-Methyladenine was obtained from Sigma-Aldrich (St Louis, MO, USA).
Cell viability assay
MNNG and U2-OS cells were seeded in 96-well plates and treated with CX-5461 for 72 hours; 3-(4, 5-Dimethylthiazol-2-yl)-2, 5-Diphenyl tetrazolium Bromide (MTT) assay was carried out according to the manufacturer’s protocol. For cell viability assay, the number of viable cells in each well was measured using a CellTiter-Glo Luminescent Cell Viability Assay kit (Promega Corporation, Fitchburg, WI, USA), according to the manufacturer’s protocol. The luminescence was measured by the Microplate Luminometer Varioskan Flash (Thermo Fisher Scientific, Waltham, MA, USA). Each MTT or cell viability assay was performed in triplicate and repeated three times. To confirm cell death induced by CX-5461, cells were harvested using trypsin-ethylenediaminetetraacetic acid and stained with 0.4% trypan blue solution. Living cells were counted by hemocytometer.
Flow cytometry analysis
Cell cycle analysis was performed as described previously.13 In brief, cells were harvested and fixed in 70% ethanol overnight at 4°C. DNA was stained by propidium iodide (50 μg/mL). Alterations in cell distribution and cell proportions were analyzed using a flow cytometer (Becton Dickinson, Franklin Lakes, NJ, USA).
Electron microscopy
MNNG and U2-OS cells were fixed with 1× fixing buffer (2.5% glutaraldehyde, 0.1 M sucrose, and 3 mM CaCl2 in 0.1 M cacodylate buffer pH 7.4) at room temperature for 1 hour. The cell pellets were processed in 1% OsO4 on ice for 1 hour, dehydrated in graded ethanol and propylene oxide, and embedded in Epon 812 resin. After thin sections were stained with uranylacetate for 10 minutes and lead acetate for 15 minutes, the samples were examined under a transmission electron microscope (JEM1200EX; JEOL, Tokyo, Japan).
Western blotting analysis
For Western blotting analysis, cells were harvested and solubilized in a Nonidet P-40-based lysis buffer and subjected to the analysis as described previously.13 The following antibodies were used: anti-p53 (DO-1) (Santa Cruz Biotechnology Inc., Dallas, TX, USA); anti-p21, anti-LC3B-II, anti-Akt, anti-phospho-Akt (Ser473), anti-mTOR, anti-phospho-mTOR (Ser2448), anti-AMPKα, and anti-phospho-AMPKα (Thr172) (Cell Signaling Technology); and anti-actin (Chemicon International, Inc., Temecula, CA, USA). Densitometry was done by means of the ImageJ software (Bethesda, MD, USA) to quantify relative amounts of protein detected on Western blot analysis.
Quantitative real-time reverse transcriptase polymerase chain reaction
For reverse transcriptase polymerase chain reaction (PCR), RNA was extracted using RNeasy Mini kit (Qiagen NV, Venlo, the Netherlands). First strand synthesis was done using 2 μg of RNA and Superscript II Reverse Transcriptase (Invitrogen). Real-time PCR was performed on the LightCycler ST300 PCR System (Hoffman-La Roche Ltd., Basel, Switzerland) using SYBR Green (TAKARA Bio Kusatsu, Japan) with primers for the detection of human p53 target genes transcripts (p21, forward 5′-GCAGACC AGCATGACAGATTT-3′ and reverse 5′-GGATTAGGGCTTCCTCTTGGA-3′; MDM2, forward 5′-CATTGTCCATGGCAAAACAG-3′ and reverse 5′-GGCAGGGC TTATTCCTTTTC-3′; p53 upregulated modulator of apoptosis (Puma), forward 5′-CGACCTCAACGCACAGTACGA-3′ and reverse 5′-GGCACCTAATTG GGCTCCATC-3′; sestrin1 [Sesn1], forward 5′-GCATGTTC CAACATTTCGTG-3′ and reverse 5′-TCCCACATCTGGATAAAGGC-3′; sestrin2 [Sesn2], forward 5′-GACCATGGCTACTCGCTGAT-3′ and reverse 5′-GCTGCCTGGAA CTTCTCATC-3′; damage-regulated autophagy modulator 1 (DRAM1), forward 5′-ATTCCAGAGGAAGAAGCAGCCCTT-3′ and reverse 5′-ACTTGGCCACACATGGGTTTATGC-3′; Alternate Reading Frame (ARF), forward 5′-CCCTCGTG CTGATGCTACTG-3′ and reverse 5′-CATCATGACCTGGTCTTCTAGGAA-3′). Results were expressed relative to glyceraldehyde-3-phosphate dehydrogenase (GAPDH) (forward primer: 5′-AGGA AGAGAGAGACCCTCACTGC-3′; reverse primer: 5′-ATGACAAGGTGCGGCTC C-3′) transcripts as an internal control.
Small interfering RNA transfection
p53 Small interfering RNA (siRNA) and scrambled siRNA (siScr) as a control were purchased from Santa Cruz Biotechnology Inc. siRNA transfection was carried out using OligofectAMINE (Invitrogen) according to the manufacturer’s protocol.
Animal experiments
Animal care and experimental protocols were approved by the Experimental Animal Ethics Committee of China Medical University, and were in accordance with the Guidelines for the care and Use of Laboratory Animals of the National Institutes of Health. OS U2-OS xenografts were developed in 5-week-old female athymic nu/nu mice. Each mouse received 5×10⁶ exponentially growing U2-OS cells (in 100 μL of sterile 1× phosphate-buffered saline) subcutaneously in the right flank area. Tumors became palpable (50–75 mm3) within 7–10 days of tumor cell injection, after which groups of eight animals were randomized and assigned to different treatment groups. Animals were given intraperitoneal injections with vehicle (50 mM NaH2PO4), CX-5461 alone (50 mg/kg), or a combination of DOX (2 mg/kg) with CX-5461 (50 mg/kg) for five consecutive days within a 1-week complete cycle for 3 weeks. Tumor size was measured in three dimensions with a caliper every 3 days and tumor volume was calculated by a formula of L×W2/2 (L and W represent the length and width of tumors).
Statistics
Data were analyzed by repeated measure analysis of variance with the Scheffe post hoc test. Statistical analyses were performed using StatView J-5.0 software (SAS Institute Inc., Cary, NC, USA). P-values <0.05 were considered significant. Synergistic effect of CX-5461 and DOX was estimated by coefficient drug interaction here. A coefficient drug interaction value <0.75 was considered significant.
Results
The effect of CX-5461 on cell proliferation and cell cycle in OS cell lines
We initially investigated the effect of CX-5461 on cell growth in OS cell lines. The MTT assay and trypan exclusion assay demonstrated that CX-5461 markedly reduced cell viability after a 72-hour treatment with half maximal inhibitory concentration (IC50) values of 0.5–1.5 μM in OS cells (Figures 1A and S1). However, the antiproliferative effect of CX-5461 could not be clearly observed in Saos-2 cells and murine normal NIH3T3 cells (Figure S2). Interestingly, CX-5461 seemed to inhibit cell proliferation at a little bit lower concentration in MNNG cells than in U2-OS cells. Furthermore, flow cytometry analysis displayed accumulation of populations in the G2 fraction, but no sub-G1 appearance in OS cells (Figure 1B). There was no significant change in cell cycle observed in NIH3T3 cells after treatment, which was consistent with a previous report.10 These data indicate that CX-5461 can suppress cell proliferation and induce G2 arrest, but not apoptosis in OS cell lines.
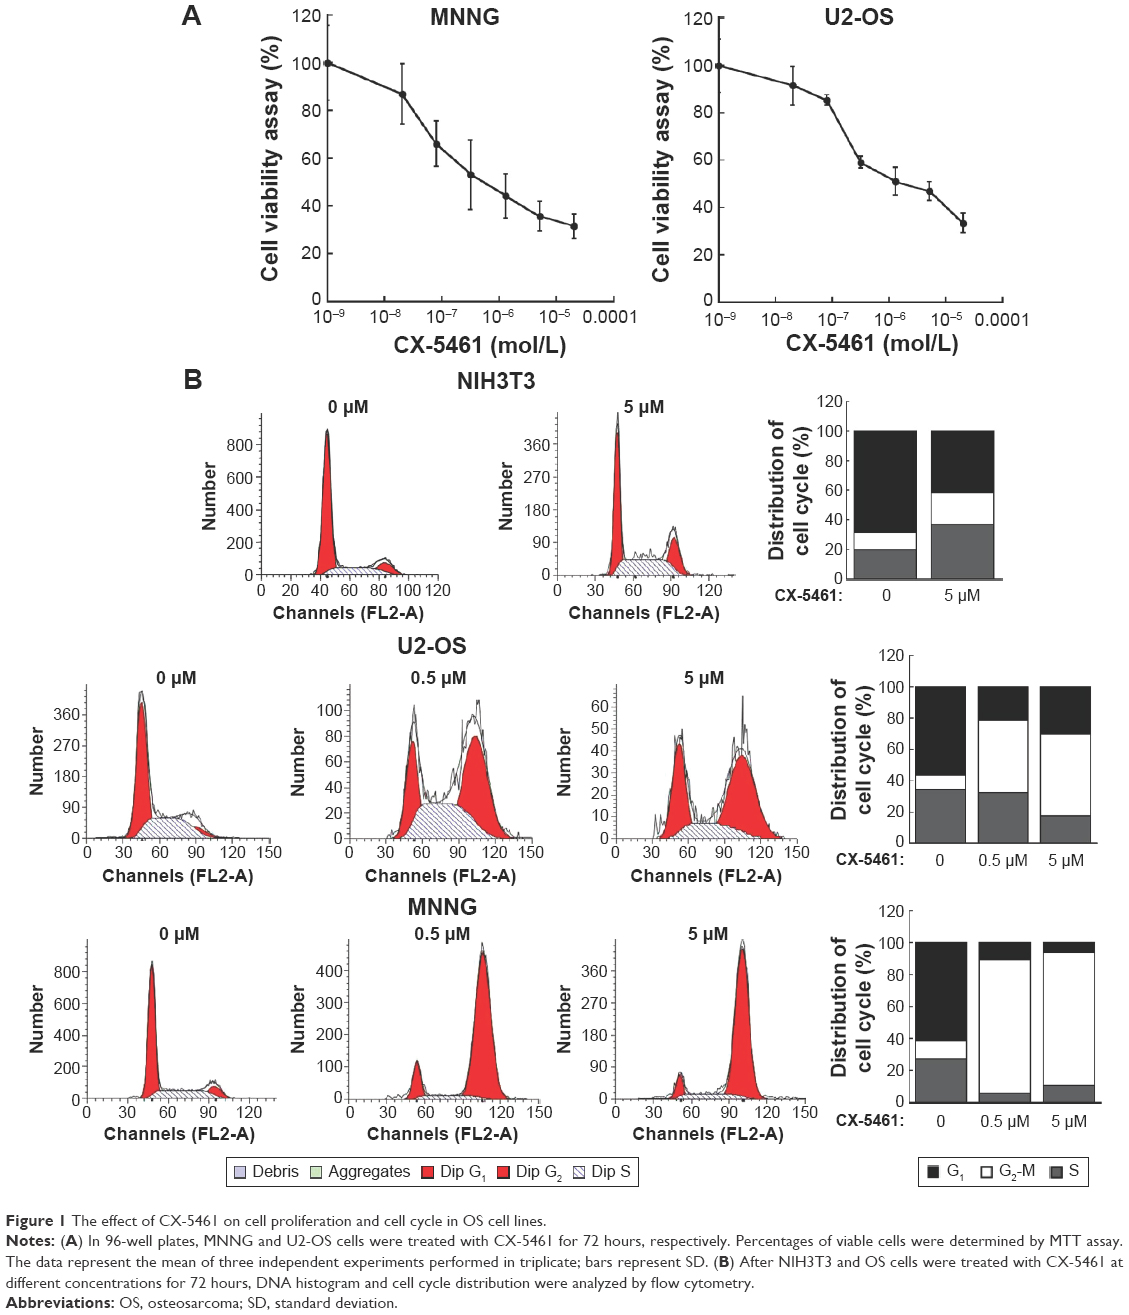 | Figure 1 The effect of CX-5461 on cell proliferation and cell cycle in OS cell lines. |
Autophagy-dependent cell death induced by CX-5461 in OS cell lines
To explore the manner of cell death mediated by CX-5461, electron microscopy was examined. There were many huge vacuoles in the cytoplasm in the ultrastructural morphology after CX-5461 treatment (Figure 2A). Generally, autophagosomes appear in the cytoplasm at the first stage of autophagy, and microtubule-associated protein 1 LC3, especially the type II isoform of LC3, is an autophagosome special protein. Figure 2B illustrated that CX-5461 induced expression of LC3-II in a dose-dependent manner in OS cell lines, though autophagosomes characterized by double or multiple-membrane vesicles were not clearly seen here. Cotreatment with 3-methyladenine, a common autophagy inhibitor, markedly reduced cell death mediated by CX-5461 (Figures 2C and S3). These data reveal that CX-5461 can induce autophagy-dependent programmed cell death in OS cell lines.
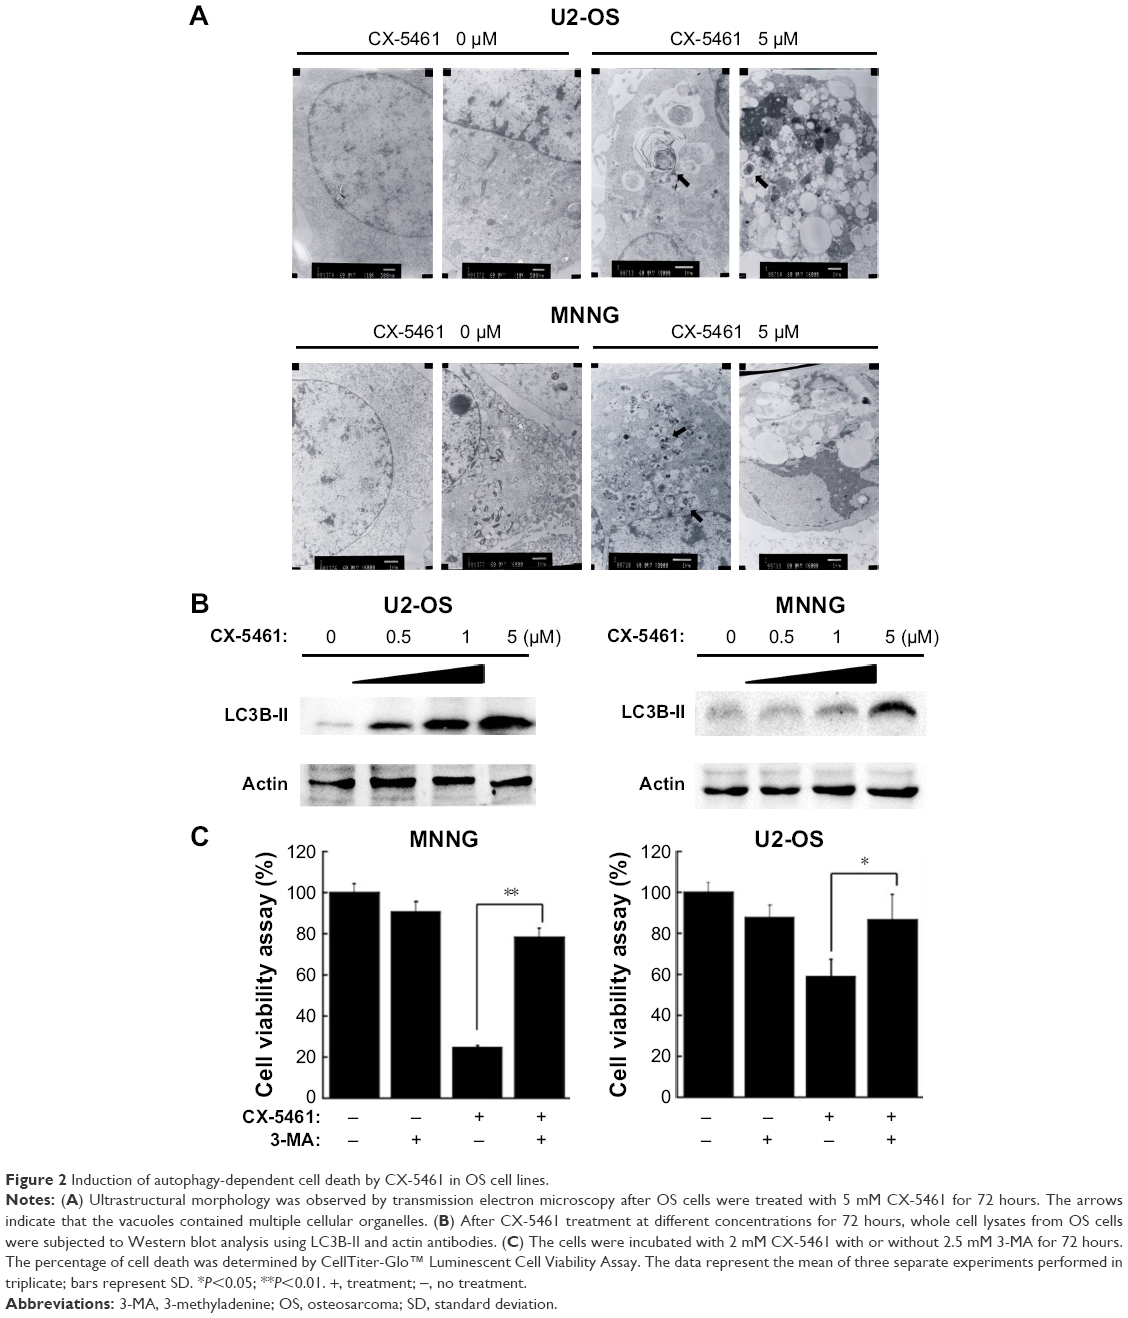 | Figure 2 Induction of autophagy-dependent cell death by CX-5461 in OS cell lines. |
p53-dependent autophagy induced by CX-5461 in U2-OS cell line
Here, we investigated the role of p53 in autophagy induced by CX-5461 in OS. Figure 3A showed that CX-5461 increased p21 mRNA level and protein expression in a dose-dependent manner in OS cell lines, but only p53 in U2-OS cells was activated. In the nucleus, p53 may transactivate multiple genes with pro-autophagic roles, including DRAM, ARF, PUMA, Sesn1/2, and so on.14 Real-time reverse transcriptase PCR analysis demonstrated that CX-5461 significantly upregulated Sesn1/2 and MDM2 mRNA level in U2-OS cells, but failed in MNNG except p21 as described earlier (Figure 3B). On the other hand, depletion of p53 protein by p53-siRNA displayed an altered response to treatment with CX-5461. As illustrated in Figure 3C and D and Figure S4, not only the protein level of p21 and LC3-II upregulated by CX-5461 was prevented in sip53-transfected cells compared with siScr-transfected cells but also knockdown of wild-type p53 was more resistant to CX-5461-induced cell death, which proved to be p53-dependent of CX-5461-induced cytotoxic effects. These data indicate that CX-5461 can induce p53-dependent autophagy in a U2-OS cell line, which might be different from that in MNNG cells.
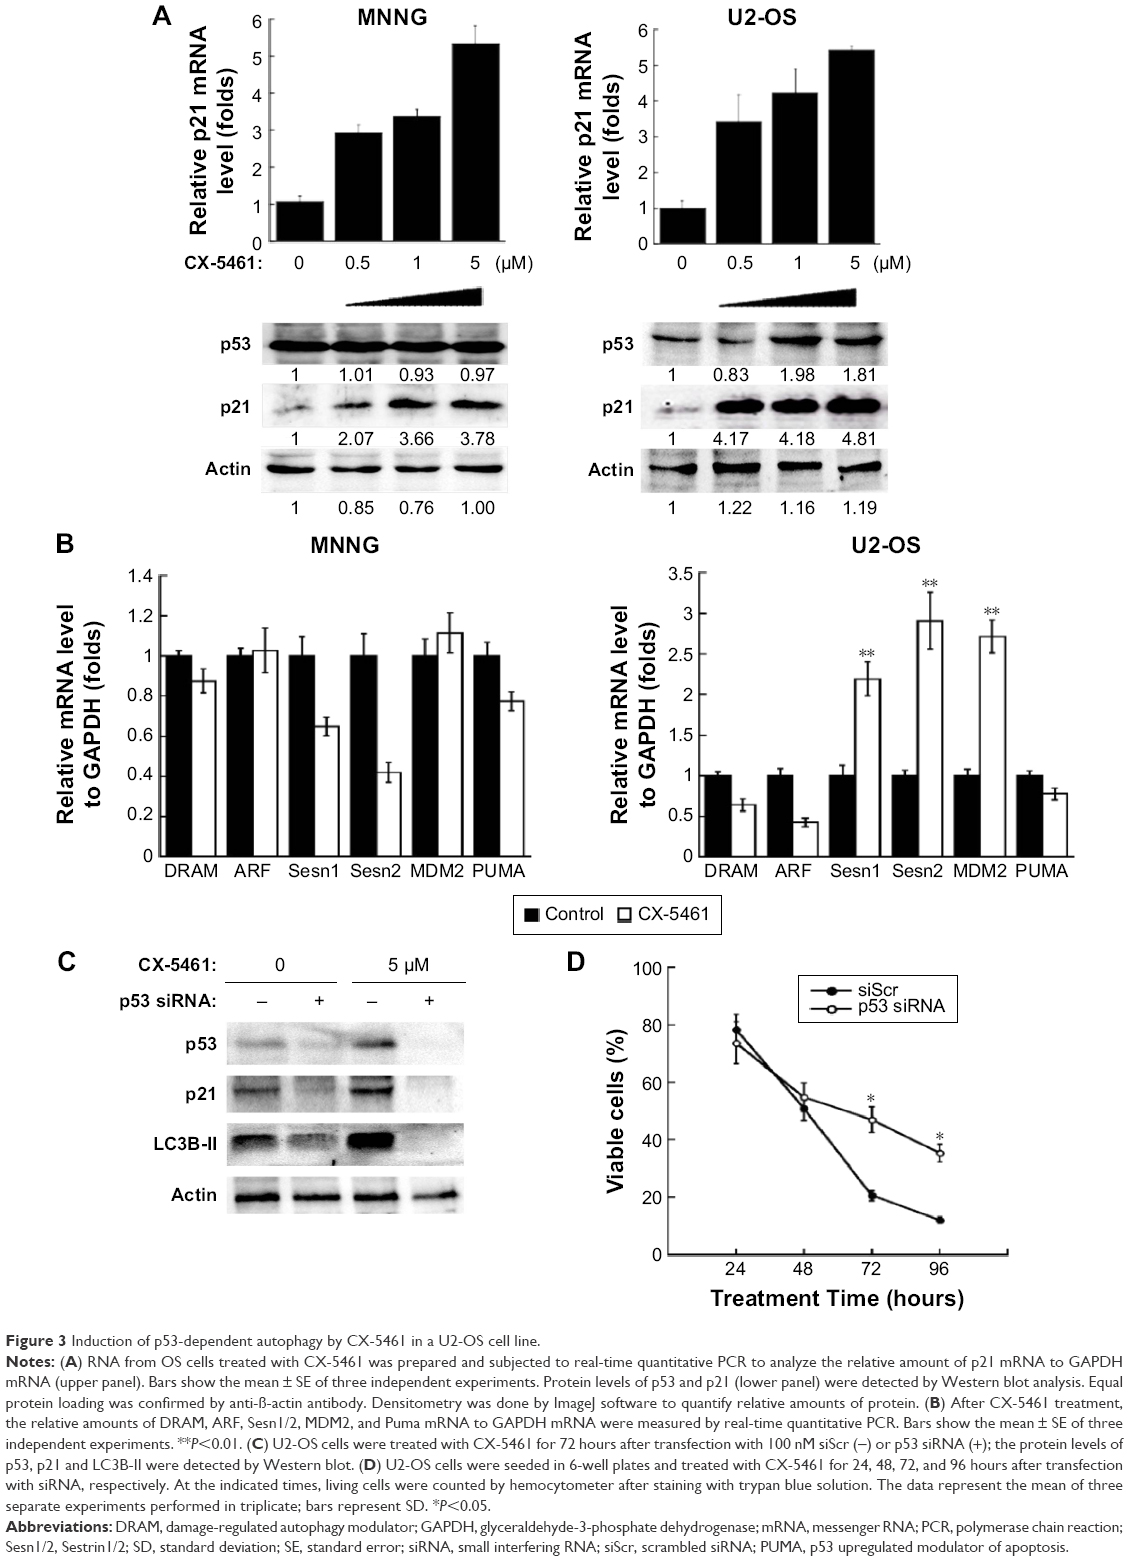 | Figure 3 Induction of p53-dependent autophagy by CX-5461 in a U2-OS cell line. |
Effect of CX-5461 on mTOR-related signaling pathways in OS cell lines
mTOR is an important component of the autophagy-associated pathway and multiple p53 target genes stimulate autophagic flux, which often result in the downregulation of the central metabolic sensor mTOR.15 Figure 4A showed that CX-5461 significantly inhibited p-mTOR (Ser2448) expression in a dose-dependent manner in MNNG and U2-OS cells, but failed to affect the total mTOR protein level. Moreover, as the upstream activator or inhibitor of mTOR, phosphorylation of Akt (Ser473) decreased after treatment in MNNG cells, but p-AMPK (Thr172) expression level was upregulated in CX-5461-treated U2-OS compared with control group. Relative amounts of p-mTOR, p-Akt, and p-AMPK expression to their total protein levels demonstrated that CX-5461 inhibited mTOR activity in OS cell lines, together with downregulation of Akt activity in MNNG cells and upregulation of AMPK activity in U2-OS cells (Figure 4B). On the other hand, AMPK inhibitor compound C significantly attenuated cell death mediated by CX-5461 in U2-OS, but not MNNG cells (Figure S5). These data suggested that CX-5461 could induce autophagy possibly via Akt/mTOR pathway in MNNG cells and AMPK/mTOR pathway in U2-OS cells, individually.
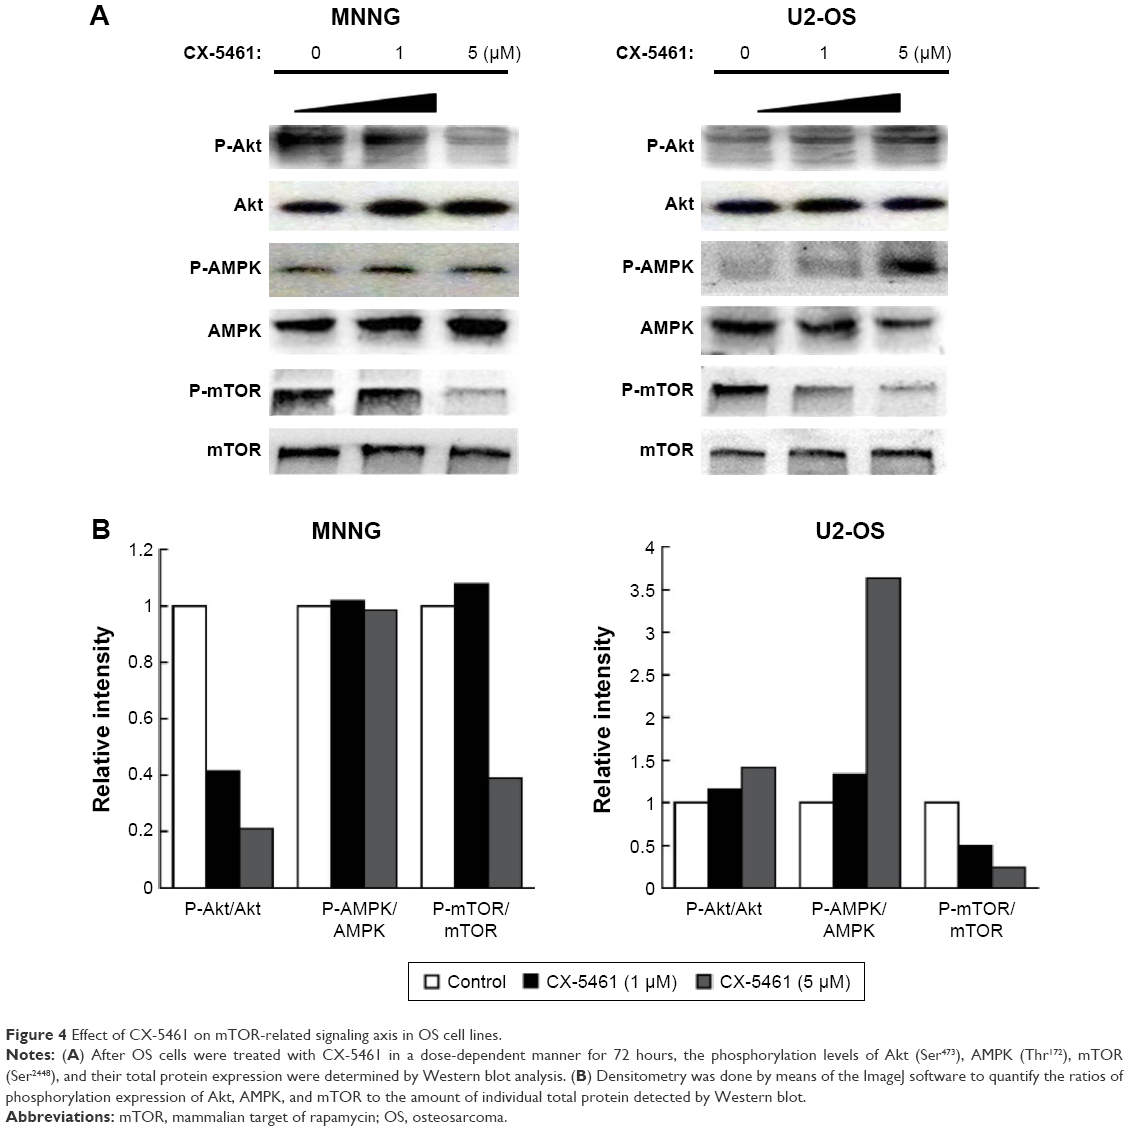 | Figure 4 Effect of CX-5461 on mTOR-related signaling axis in OS cell lines. |
Synergistic antitumor effect of CX-5461 and DOX in U2-OS cells
DOX is one of key drugs in the chemotherapy for OS, and we examined the efficacy of CX-5461 combined with DOX in OS. As illustrated in Figure 5A, CX-5461 significantly enhanced DOX-mediated cytotoxic effect in U2-OS cells, but not in MNNG cells. Moreover, Western blot analysis demonstrated a synergistic expression of p53, p21, and LC3-II after combined treatment (Figure 5B). In U2-OS xenograft models, CX-5461 (50 mg/kg) gradually exerted antitumor capacity and synergistic efficacy combined with DOX (2 mg/kg) after day 12 from treatment compared with control group (Figure 5C). The drug toxicity of CX-5461 was modest and no significant weight loss was observed in the two treatment groups compared with control group (Figure 5D). These data reveal that CX-5461 can synergistically enhance DOX-mediated antitumor effect in U2-OS cells in vitro and in vivo.
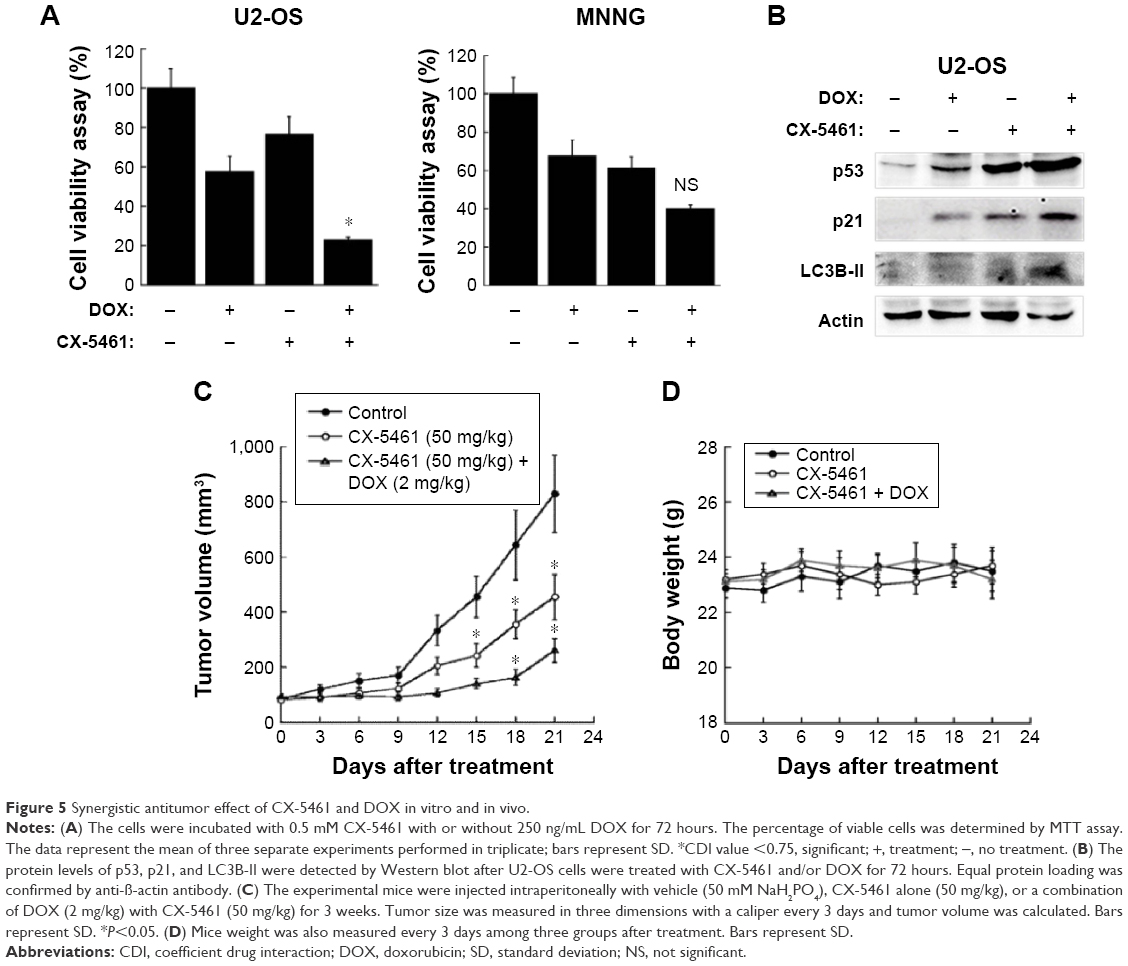 | Figure 5 Synergistic antitumor effect of CX-5461 and DOX in vitro and in vivo. |
Discussion
Ribosome biogenesis normally regulates cell growth, which is controlled by RNA Pol I–III.16 In carcinogenesis, deregulated signaling stimulates RNA Pol I to accelerate rRNA synthesis to adapt to the demand for unlimited cell proliferation.17,18 So a large variety of chemotherapeutic drugs targeting rRNA synthesis were clinically applied, for example, methotrexate and 5-fluorouracil.19,20 On the other hand, CX-3543, a novel small-molecule nucleolus-targeting agent was reported to selectively inhibit rRNA synthesis via interfering with elongation step of Pol I transcription and induce apoptosis in cancer cells.21 CX-5461 is another recently discovered RNA Pol I inhibitor and exerts selective antiproliferative capacity via disrupting the recruitment of Pol I to rDNA promoter.10 In the present study, we investigated the effect of CX-5461 on OS cell lines and molecular mechanisms underlying it. Our results exhibited inhibitory effects of CX-5461 on sarcoma cells due to induction of autophagy via mTOR-related signaling axis. Furthermore, to our knowledge, the present study successfully demonstrated, for the first time, potential synergistic efficiency of CX-5461 combined with DOX for OS carrying wild-type p53.
Autophagy is an important housekeeping process for degrading and recycling long-lived proteins, cellular aggregates, and damaged organelles.22 Under stressful conditions, such as starvation, hypoxia, and cytotoxicity, it serves as a source of energy, providing the cells amino acids to sustain cell survival.23,24 Nevertheless, autophagy exerts a dual role in tumorigenesis – either cell survival or cell death determined by tumor type, context, and disease stage.25 Here, when Pol I transcription activity is initially suppressed by CX-5461 in OS, nutrient availability of tumor cells decreases gradually, which gives rise to the activation of autophagy in order to enhance cell survival. However, it finally causes autophagic cell death when energy supply is inadequate to relieve high metabolic stress in OS. Likewise, there is minimal effect of CX5461 on normal NIH3T3 cells because inherent stress they suffer from is much less than that in OS cells. Therefore, our results might provide a potentially selective anticancer therapeutic strategy by means of autophagy modulation in sarcoma.
The dynamic processes of cell growth and cell division driven by ribosome biogenesis in the nucleolus remain under constant surveillance. P53 can act as one of primary “stress sensors” to maintain cellular homeostasis. Perturbation of ribosome biogenesis results in “nucleolar stress” and triggers RP-MDM2-p53 stress response pathway.26 Our data demonstrated that CX-5461 increased p53 stabilization in U2-OS cells, perhaps as a result of activation of nucleolar surveillance pathway via inhibiting Pol I transcription.11 On the other hand, recent reports have indicated that p53 plays dual roles in regulating autophagy depending on its subcellular localization, for example, nuclear p53 facilitates autophagy by transactivating its target genes, whereas cytoplasmic p53 mainly inhibits autophagy through transcription-independent mechanisms.27 In the present study, CX-5461 transactivated p21, MDM2, and Sesn1/2 in U2-OS cells, but fails to increase cytoplasmic p53 protein level in MNNG cells. Interestingly, p53 can stimulate autophagy by upregulation of some autophagy-related genes, such as Sesn1, Sesn2, or DRAM1.28 Both sestrins can trigger the AMPK and target it to phosphorylate and activate TSC1–TSC2 complex, thereby inhibiting the signaling of mTOR, a critical autophagy inhibitor of cells,29,30 and so CX-5461-induced autophagy through AMPK/mTOR signaling pathway in U2-OS cells might arise from the upregulation of Sesn1/2 by p53. Under the condition of nonfunctional p53, mTOR is controlled directly by PI3K/Akt signaling pathway. Moreover, Mitogen-Activated Protein Kinase (MAPK)/ERK1/2, p38, and c-Jun NH(2)-terminal kinase (JNK) also play a fundamental role in governing mTOR.31 Here, downregulation of Akt activity by CX-5461 might contribute to induction of autophagy via inhibiting mTOR in MNNG cells. On the other hand, p21 mRNA and protein level increased by CX-5461 here is p53-independent in MNNG cells. As yet, whether p21 regulates autophagy or autophagy controls p21 has remained unclear. Previous study indicated that p21 played an essential role in inhibition of autophagy,32 but several studies have recently reported that p21 is upregulated when autophagy is induced,33,34 which is consistent with our results. First, p21 upregulation by CX-5461 in MNNG cells might be mediated by transcription factor SP1, the major p53-independent regulator. Second, p21 could be inhibited by mTOR pathway,35 and so p53-independent p21 expression here might result from activation of autophagy and downregulation of mTOR pathway.
In untransformed cells, Rb and p53 repress Pol I transcription through interactions with upstream binding factor and SL1, respectively, which are likely to be lost in transformed cells especially OS due to p53/Rb mutation. Instead, elevated level of c-Myc and activation of ERK or PI3K pathway enable more efficient recruitment of SL1 to rDNA promoters and stimulate Pol I transcription.6,7 In addition, mTOR pathway has been shown to activate upstream binding factor to enhance recruitment of SL1 to rDNA promoters via p70S6 kinase-dependent phosphorylation.36 So, it is fairly reasonable that CX-5461 could selectively compete SL1 and inhibit Pol I transcription via disruption of SL1–rDNA complex as described previously,10,11 which ultimately induce autophagic cell death possibly by PI3K/Akt/mTOR pathway in MNNG cells as illustrated in our present study. In U2-OS cells, CX-5461 induced autophagy, but not apoptosis, which is indicated in hematologic malignancies. Otherwise, our preliminary experiment also demonstrated that sub-G1 peak in cell cycle could be observed upon CX-5461 treatment in Ewing sarcoma cell lines where p53 mutations are rare (data not shown). So, it is possible that malignancies frequently harboring wild-type p53 have a unique nucleolar biology, which makes them especially susceptible to activation of p53 and apoptotic cell death following acute perturbations of ribosome biogenesis.
Taken together, the present study has shown that CX-5461 effectively inhibited cell proliferation and induced G2 cell cycle arrest and autophagy by the suppression of mTOR-associated signaling axis in OS cells. Moreover, CX-5461 increased p53 stabilization and induced p53-dependent autophagy, which significantly enhanced DOX-mediated antitumor effect in vitro and in vivo in U2-OS cells. Our observations might provide new insights into the application of a selective Pol I inhibitor, CX-5461, in the combined chemotherapy for OS especially harboring wild-type p53.
Acknowledgments
This study was supported by National Natural Science Foundation of China (No 81272946) and Natural Science Foundation of Liaoning Province (No 2015020503 and 2015020473).
Disclosure
The authors declare no conflicts of interest in this work and acknowledge no financial or personal relationships with other people or organizations that could appropriately influence (bias) this work.
References
Gorlick R, Janeway K, Lessnick S, Randall RL, Marina N; COG Bone Tumor Committee. Children’s Oncology Group’s 2013 blueprint for research: bone tumors. Pediatr Blood Cancer. 2013;60:1009–1015. | ||
Kansara M, Teng MW, Smyth MJ, Thomas DM. Translational biology of osteosarcoma. Nat Rev Cancer. 2014;14:722–735. | ||
Isakoff MS, Bielack SS, Meltzer P, Gorlick R. Osteosarcoma: current treatment and a collaborative pathway to success. J Clin Oncol. 2015;33:3029–3035. | ||
Kobayashi E, Hornicek FJ, Duan Z. MicroRNA involvement in osteosarcoma. Sarcoma. 2012;2012:359739. | ||
Chedin S, Laferte A, Hoang T, Lafontaine DL, Riva M, Carles C. Is ribosome synthesis controlled by pol I transcription? Cell Cycle. 2007;6: 11–15. | ||
White RJ. RNA polymerases I and III, growth control and cancer. Nat Rev Mol Cell Biol. 2005;6:69–78. | ||
White RJ. RNA polymerases I and III, non-coding RNAs and cancer. Trends Genet. 2008;24:622–629. | ||
Drygin D, Rice WG, Grummt I. The RNA polymerase I transcription machinery: an emerging target for the treatment of cancer. Annu Rev Pharmacol Toxicol. 2010;50:131–156. | ||
Silvera D, Formenti SC, Schneider RJ. Translational control in cancer. Nat Rev Cancer. 2010;10:254–266. | ||
Drygin D, Lin A, Bliesath J, et al. Targeting RNA polymerase I with an oral small molecule CX-5461 inhibits ribosomal RNA synthesis and solid tumor growth. Cancer Res. 2011;71:1418–1430. | ||
Bywater MJ, Poortinga G, Sanij E, et al. Inhibition of RNA polymerase I as a therapeutic strategy to promote cancer-specific activation of p53. Cancer Cell. 2012;22:51–65. | ||
Negi SS, Brown P. rRNA synthesis inhibitor, CX-5461, activates ATM/ATR pathway in acute lymphoblastic leukemia, arrests cells in G2 phase and induces apoptosis. Oncotarget. 2015;6:18094–18104. | ||
Li Y, Tanaka K, Li X. Cyclin-dependent kinase inhibitor, flavopiridol, induces apoptosis and inhibits tumor growth in drug-resistant osteosarcoma and Ewing’s family tumor cells. Int J Cancer. 2007;121:1212–1218. | ||
Tang J, Di J, Cao H, Bai J, Zheng J. p53-mediated autophagic regulation: a prospective strategy for cancer therapy. Cancer Lett. 2015;363:101–107. | ||
Feng Z, Zhang H, Levine AJ, Jin S. The coordinate regulation of the p53 and mTOR pathways in cells. Proc Natl Acad Sci U S A. 2005;102:8204–8209. | ||
Lempiainen H, Shore D. Growth control and ribosome biogenesis. Curr Opin Cell Biol. 2009;21:855–863. | ||
Arabi A, Wu S, Ridderstrale K, et al. c-Myc associates with ribosomal DNA and activates RNA polymerase I transcription. Nat Cell Biol. 2005;7:303–310. | ||
Zhang C, Comai L, Johnson DL. PTEN represses RNA Polymerase I transcription by disrupting the SL1 complex. Mol Cell Biol. 2005;25:6899–6911. | ||
Burger K, Muhl B, Harasim T, et al. Chemotherapeutic drugs inhibit ribosome biogenesis at various levels. J Biol Chem. 2010;285:12416–12425. | ||
Boulon S, Westman BJ, Hutten S, Boisvert FM, Lamond AI. The nucleolus under stress. Mol Cell. 2010;40:216–227. | ||
Drygin D, Siddiqui-Jain A, O’Brien S, et al. Anticancer activity of CX-3543: a direct inhibitor of rRNA biogenesis. Cancer Res. 2009;69:7653–7661. | ||
Levine B, Kroemer G. Autophagy in the pathogenesis of disease. Cell. 2008;132:27–42. | ||
Duprez L, Wirawan E, Vanden Berghe T, Vandenabeele P. Major cell death pathways at a glance. Microbes Infect. 2009;11:1050–1062. | ||
Gozuacik D, Kimchi A. Autophagy as a cell death and tumor suppressor mechanism. Oncogene. 2004;23:2891–2906. | ||
White E, DiPaola RS. The double-edged sword of autophagy modulation in cancer. Clin Cancer Res. 2009;15:5308–5316. | ||
Deisenroth C, Zhang Y. Ribosome biogenesis surveillance: probing the ribosomal protein-Mdm2-p53 pathway. Oncogene. 2010;29:4253–4260. | ||
Tasdemir E, Chiara Maiuri M, Morselli E, et al. A dual role of p53 in the control of autophagy. Autophagy. 2008;4:810–814. | ||
Nikoletopoulou V, Markaki M, Palikaras K, Tavernarakis N. Crosstalk between apoptosis, necrosis and autophagy. Biochim Biophys Acta. 2013;1833:3448–3459. | ||
Budanov AV, Karin M. p53 target genes sestrin1 and sestrin2 connect genotoxic stress and mTOR signaling. Cell. 2008;134:451–460. | ||
Maiuri MC, Malik SA, Morselli E, et al. Stimulation of autophagy by the p53 target gene Sestrin2. Cell Cycle. 2009;8:1571–1576. | ||
Aredia F, Guaman Ortiz LM, Giansanti V, Scovassi AI. Autophagy and cancer. Cells. 2012;1:520–534. | ||
Fujiwara K, Daido S, Yamamoto A, et al. Pivotal role of the cyclin-dependent kinase inhibitor p21WAF1/CIP1 in apoptosis and autophagy. J Biol Chem. 2008;283:388–397. | ||
Li X, Wang J, Ye Z, Li JC. Oridonin up-regulates expression of P21 and induces autophagy and apoptosis in human prostate cancer cells. Int J Biol Sci. 2012;8:901–912. | ||
Gong FR, Wu MY, Shen M, et al. PP2A inhibitors arrest G2/M transition through JNK/Sp1-dependent down-regulation of CDK1 and autophagy-dependent up-regulation of p21. Oncotarget. 2015;6:18469–18483. | ||
Ji WT, Yang SR, Chen JY, et al. Arecoline downregulates levels of p21 and p27 through the reactive oxygen species/mTOR complex 1 pathway and may contribute to oral squamous cell carcinoma. Cancer Sci. 2012;103:1221–1229. | ||
Moss T. At the crossroads of growth control; making ribosomal RNA. Curr Opin Genet Dev. 2004;14:210–217. |
Supplementary materials
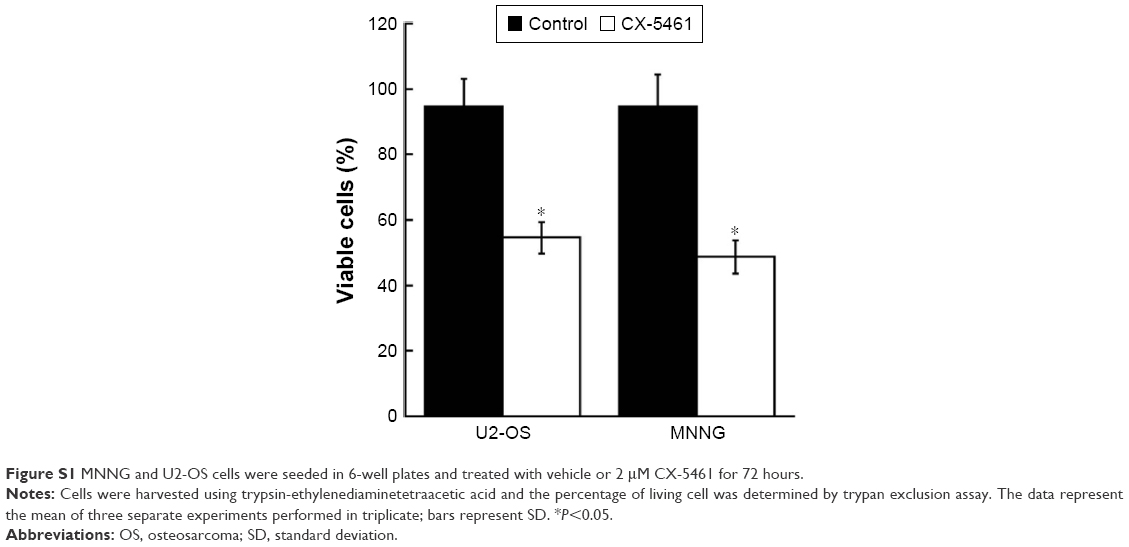 | Figure S1 MNNG and U2-OS cells were seeded in 6-well plates and treated with vehicle or 2 μM CX-5461 for 72 hours. |
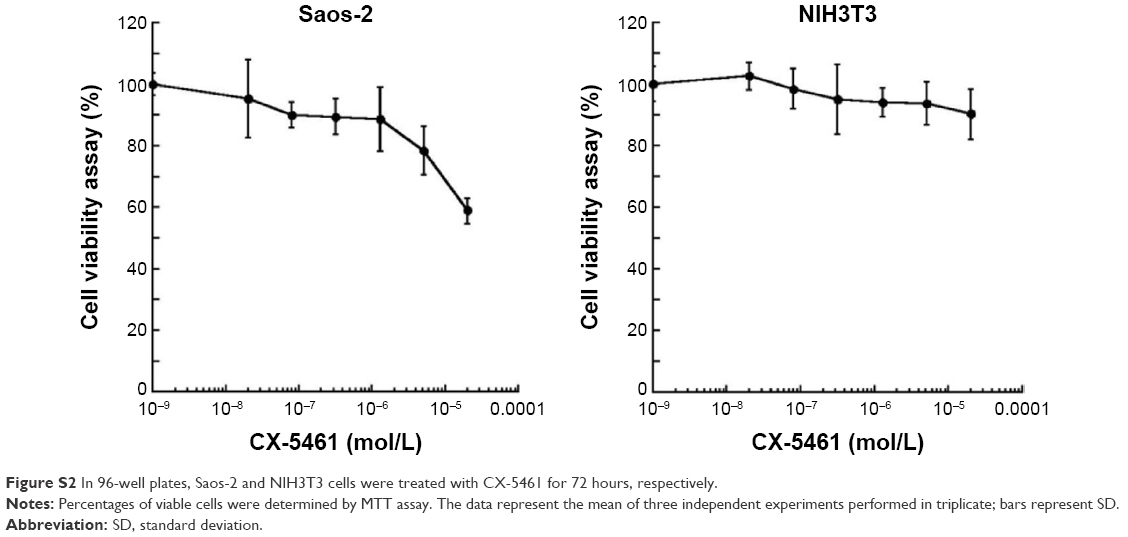 | Figure S2 In 96-well plates, Saos-2 and NIH3T3 cells were treated with CX-5461 for 72 hours, respectively. |
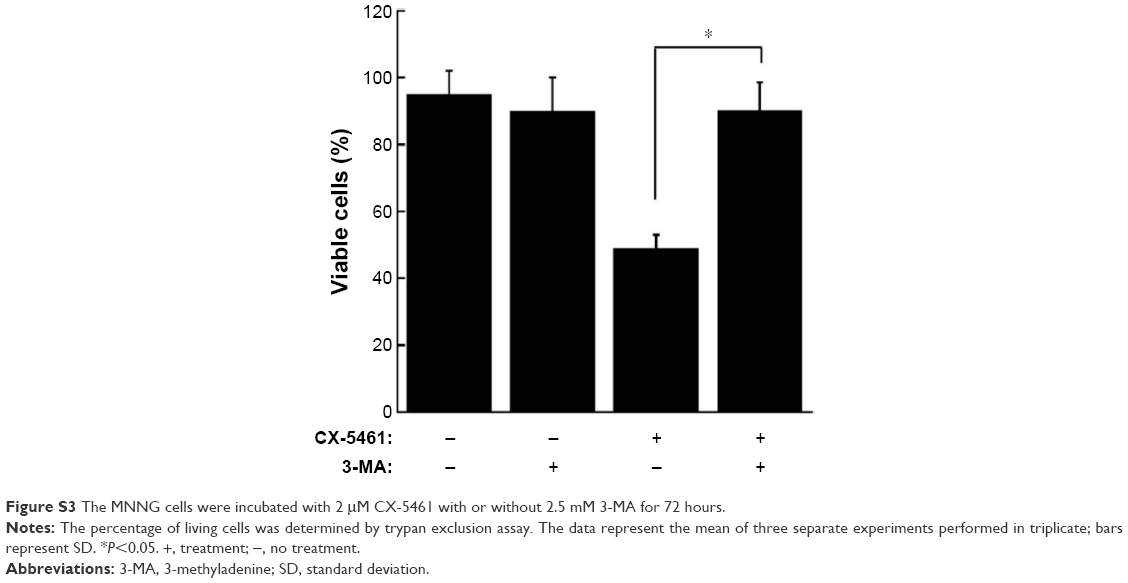 | Figure S3 The MNNG cells were incubated with 2 μM CX-5461 with or without 2.5 mM 3-MA for 72 hours. |
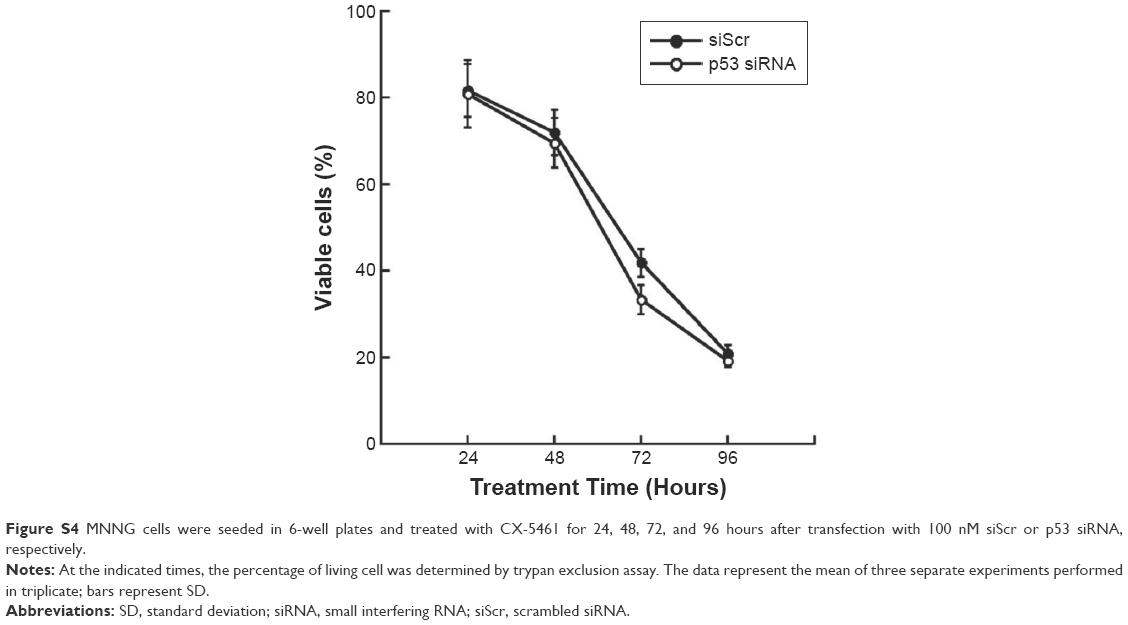 | Figure S4 MNNG cells were seeded in 6-well plates and treated with CX-5461 for 24, 48, 72, and 96 hours after transfection with 100 nM siScr or p53 siRNA, respectively. |
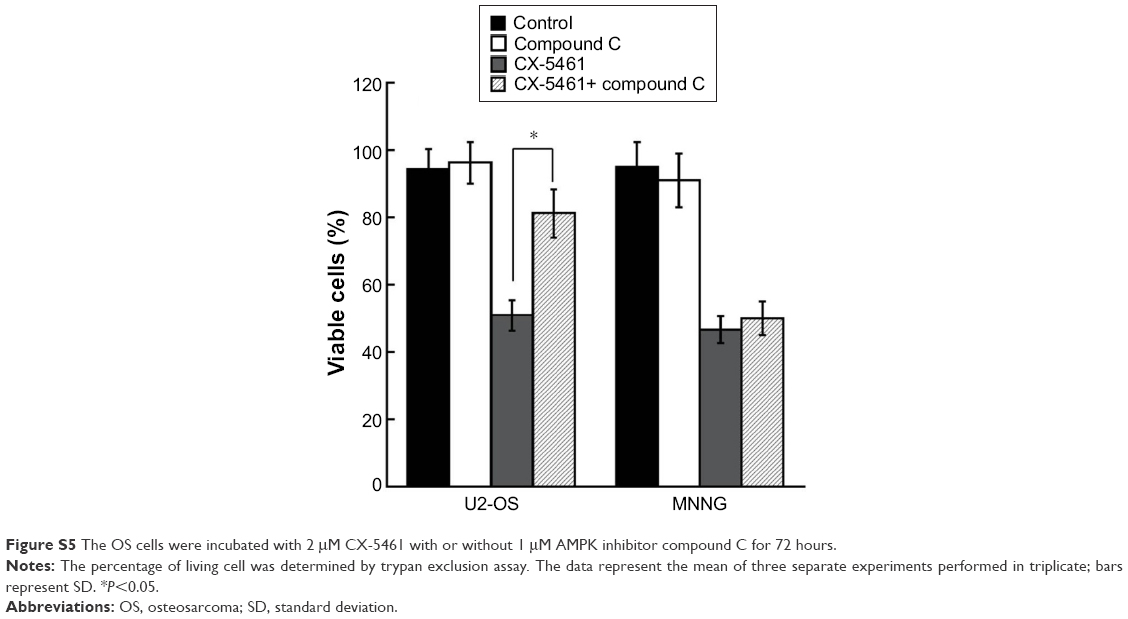 | Figure S5 The OS cells were incubated with 2 μM CX-5461 with or without 1 μM AMPK inhibitor compound C for 72 hours. |
 © 2016 The Author(s). This work is published and licensed by Dove Medical Press Limited. The full terms of this license are available at https://www.dovepress.com/terms.php and incorporate the Creative Commons Attribution - Non Commercial (unported, v3.0) License.
By accessing the work you hereby accept the Terms. Non-commercial uses of the work are permitted without any further permission from Dove Medical Press Limited, provided the work is properly attributed. For permission for commercial use of this work, please see paragraphs 4.2 and 5 of our Terms.
© 2016 The Author(s). This work is published and licensed by Dove Medical Press Limited. The full terms of this license are available at https://www.dovepress.com/terms.php and incorporate the Creative Commons Attribution - Non Commercial (unported, v3.0) License.
By accessing the work you hereby accept the Terms. Non-commercial uses of the work are permitted without any further permission from Dove Medical Press Limited, provided the work is properly attributed. For permission for commercial use of this work, please see paragraphs 4.2 and 5 of our Terms.