")
Back to Journals » Clinical Ophthalmology » Volume 15
Customized Slab-Segmentation Method for Projection-Artifact Elimination in Best Vitelliform Macular Dystrophy: A Swept-Source Optical Coherence Tomography Angiography Study
Authors Moussa M , Leila M , Moussa O, Hashem AO
Received 30 November 2020
Accepted for publication 18 January 2021
Published 25 February 2021 Volume 2021:15 Pages 825—834
DOI https://doi.org/10.2147/OPTH.S294204
Checked for plagiarism Yes
Review by Single anonymous peer review
Peer reviewer comments 4
Editor who approved publication: Dr Scott Fraser
Magdy Moussa,1,2 Mahmoud Leila,3 Omar Moussa,2,4 Ahmed Osama Hashem4
1Ophthalmology Department, Faculty of Medicine, Tanta University, Tanta, Egypt; 2MEDIC Eye Center, Tanta, Egypt; 3Retina Department, Research Institute of Ophthalmology, Giza, Egypt; 4Ophthalmology Department, Faculty of Medicine, Kafr El Sheikh University, Kafr El Sheikh, Egypt
Correspondence: Magdy Moussa
Ophthalmology Department, Faculty of Medicine, Tanta University Campus, Tanta, 31111, Egypt
Tel +20-12 2316-1495
Email [email protected]
Purpose: To assess the efficacy of customized slab segmentation in eliminating projection artifacts in swept-source optical coherence tomography angiography (SS-OCTA) images of Best vitelliform macular dystrophy (BVMD).
Methods: Prospective case series including different stages of BVMD. We analyzed SS-OCTA images for flow signals in the outer retina and coregistered B-scan images for distortion of the segmentation slabs defining the outer retina. We applied a customized method for slab realignment whenever BVMD lesions produced distortion of the slabs. Afterward, we checked the images to determine whether the previously noted flow signal had persisted or disappeared, described as “true flow” or “pseudoflow”, respectively. Categorical variables were analyzed with X2 or Fisher’s exact tests, while quantitative variables were analyzed with independent t-test at p< 0.05.
Results: The study included 39 eyes of 22 patients. We detected BVMD patterns I (dome-shaped hyperreflective lesion without neurosensory retinal detachment), II (knob-like hyperreflective lesion with localized neurosensory retinal detachment), and III (heterogeneous scattered hyperreflective material) in 49%, 23%, and 28% of eyes, respectively. Pseudoflow was evident mostly in eyes with pattern II lesions, presence of flow signal within BVMD lesions, and lesions whose height represented > 80% of the retinal thickness (p< 0.001).
Conclusion: Customized slab segmentation is effective in eliminating projection artifact in SS-OCTA images of BVMD.
Summary: Projection artifact is a significant confounding factor in emerging SS-OCTA technology through production of pseudoflow signals that can lead to misinterpretation of images of BVMD lesions. The present study proposes a customized method for correction of segmentation errors to eliminate projection artifacts in SS-OCTA images of BVMD patients.
Keywords: projection artifacts in SS-OCTA images, segmentation errors in BVMD images, SS-OCTA imaging of BVMD, customized slab segmentation in SS-OCTA images
Introduction
Swept-source optical coherence tomography angiography (SS-OCTA) is rapidly acquiring a stronghold in imaging Best vitelliform macular dystrophy (BVMD). Integrated swept-source technology offers in vivo insight into the vascular plexuses of the retina and choroidal vasculature, which had not been amenable to exploration by fundus fluorescein angiography (FFA).1–4 The ultrahigh acquisition and superior penetration of the integrated infrared laser provides en face images of the axially arranged superficial capillary plexus (SCP), deep capillary plexus (DCP), and the choriocapillaris, each layer separately.5 Consequently, SS-OCTA unveils a previously uncharted vascular pathological profile of BVMD that includes vascular alteration of the SCP and DCP layers, and reveals causal relationships between an abnormal vascular profile and pathological changes in retinal microstructure.1–4,6 Moreover, SS-OCTA depicts with pinpoint accuracy the development of secondary choroidal neovascular membrane (CNV), particularly in cases where FFA and structural OCT have revealed equivocal findings.7–9
Implementation of SS-OCTA technology requires thorough knowledge of its inherent artifacts, which often confound the quality of images produced and may lead to misinterpretation of the information rendered by the machine. Projection artifacts are of particular importance, because of their potential to produce a pseudoflow signal that can be misinterpreted as CNV formation, with consequent needless initiation of anti-VEGF therapy and misinterpretation of response to therapy in established CNV cases.4,10,11 Projection-artifact origin is dual-pronged and is caused by close proximity of a hyperreflective structure to the overlying SCP and DCP. This generates bidirectional scattering of incident light rays by the blood vessels onto the underlying hyperreflective static tissue and again of the back-reflected light from the same tissue as it traverses the vessel layers. This scattering generates a decorrelation signal that resembles blood flow, and is most prominent within the apex of the hyperreflective tissue, the maximum height and hence most proximal to the overlying vascular layers.12 In the present work, we assessed the efficacy of a proposed customized method for slab readjustment in SS-OCTA images of BVMD patients to eliminate projection artifacts.
Methods
This was a prospective cross-sectional observational case series that recruited consecutive patients diagnosed with BVMD in a private practice from January 2018 to December 2019. Diagnosis of BVMD was based on characteristic vitelliform lesions and decreased Arden ratio on electrophysiology (<1.5). We recruited patients with different stages of BVMD, except those classified as having the subclinical stage of the disease.13 Patients with secondary CNV were allowed to enter the study, regardless of the stage of the disease. We excluded patients with concomitant ocular disease that could cause localized serous detachment of the macula, high refractive error (>−6 diopters or 3 diopters), media opacities that precluded obtaining good-quality images, or those unable to maintain steady fixation. All recruited patients received full ophthalmological examinations, including best-corrected visual acuity (decimal notation), anterior-segment examination, applanation tonometry, slit-lamp biomicroscopy, and SS-OCT and SS-OCTA (DRI OCT Triton 10.11; Topcon, Tokyo, Japan) imaging. FFA (TRC 50DX fundus camera; Topcon) was performed whenever needed. Main outcome measures were detection of the incidence of pseudoflow artifact in SS-OCTA images of BVMD and assessment of the efficacy of custom slab adjustment in eliminating pseudoflow. All imaging modalities were performed at the same visit. Patient selection and image acquisition were performed by an experienced retina specialist (MM). Images were interpreted by three trained readers (ML, OM, and AOH). Whenever discrepancies arose between readers, the opinion of the senior author (MM) was obtained.
SS-OCT and SS-OCTA Image Acquisition
SS-OCT utilizes an infrared (1,050 nm) laser source and analogue-to-digital acquisition mode that minimizes variation in sensitivity with depth (sensitivity roll-off). The infrared laser operates at a scanning speed of 100,000 A-scans/second. The SS-OCT imaging protocol for each patient consisted of a radial scan mode that comprised 12 radial lines (9 mm in length, 1,024 A-scans ×12) centered on the fovea, and horizontal and vertical line scans (9 mm in length, 1,024 A-scans) centered on the fovea. We deployed high-definition line scans centered on the BVMD lesion whenever we required more detailed assessment of the lesion. The SS-OCT scans were evaluated for lesion morphology in relation to retinal microstructure. The maximum thickness of the lesion (LT) on vertical or horizontal scans was measured using built-in calipers and expressed as as a percentage of total retinal thickness (RT; LT/RT%). SS-OCTA uses a blood flow–detection algorithm: optical coherence tomography angiography ratio analysis (Topcon). The algorithm detects speckle variance between rapidly repeated SS-OCT B-scans at identical pixel locations.
Moving erythrocytes produce much more variance among speckles, ie, higher decorrelation signals, than static tissue, and are hence interpreted as blood flow. The machine processes this information to produce en face images of the SCP, DCP, outer retina, and choriocapillaris separately. In addition, the software generates color-coded flow-density maps of these layers, in which vessel density in a given area is inferred from the decorrelation motion–contrast signal provided by SS-OCTA, where high flow is represented by increased vessel density and vice versa. Different vessel densities are given color codes, where bright red represents areas of highest density and dark blue areas of no detectable vessels. Intermediate color shades represent variable grades of vessel density. The standard acquisition protocol for SS-OCTA images consisted of a 6×6 mm area centered on the fovea. Where we needed higher-resolution images, we used a 4.5×4.5 mm or 3×3 mm acquisition area. The interface produced by the SS-OCTA software displayed a coregistered SS-OCT B-scan image with flow overlay that showed the automatic segmentation slabs deployed by the software to delineate the SCP, DCP, outer avascular retina, and choriocapillaris, and provided a red code for the retinal vascular plexuses and purple for the choriocapillaris.
Image Analysis
Acquired SS-OCTA images were analyzed for the presence of flow signals denoting neovascular complex in the outer retina. Whenever that was detected, the image was correlated with the coregistered SS-OCT B-scan with flow overlay. Normally, the slabs defining the outer retina extended between the inner plexiform and inner nuclear layers (IPL–INL) with −70.2 offset and Bruch’s membrane with zero offset. If the coregistered SS-OCT B-scan image showed distortion of the default segmentation slabs defining the outer retina due to the BVMD lesion, we resorted to manual realignment of the contours of the segmentation to conform to its normal location, hence creating customized slabs. Henceforth, we proceeded to check whether or not the customized slabs affected the previously noted flow signal in the outer retina. If the flow signal remained unchanged, we described the case as “true flow”, whereas if the signal disappeared we described the case as “pseudoflow”.
Statistical Analysis
Data are given as means ± SD, and frequencies and percentages for quantitative and qualitative variables, respectively. Categorical variables were analyzed by X2 or Fisher’s exact tests, while differences in quantitative variables were analyzed by independent t-test with a significance level of 0.05. Power analysis revealed that a sample size of 39 would achieve 98% power to detect an effect size of 0.7 using two degrees of freedom with a X2 test, achieve 100% power to reject the null hypothesis of equal means when the population mean difference is −25, with SD of 9.3 for the normal group and 8.7 for the pseudoflow group and α=0.05 using a two-sided two-sample t-test.
Results
Characteristics of the Study Population
The study included 39 eyes of 22 patients. Mean age was 48±20 (16–80) years, 50% were male. We identified three SS-OCT patterns of BVMD lesions. Pattern I consisted of amorphous dome-shaped subretinal hyperreflective material with no surrounding neurosensory retinal detachment. Pattern II consisted of solitary subretinal hyperreflective lesion surrounded by localized neurosensory retinal detachment. This lesion protruded in a knob-like configuration and caused substantial elevation of the overlying inner retinal layers. Pattern III consisted of heterogeneous discrete subretinal hyperreflective material scattered within localized neurosensory retinal detachment (Figure 1). We detected patterns I, II, and III in 19 (49%), nine (23%), and eleven (28%) eyes, respectively. Pseudoflow was evident mostly in eyes with pattern II lesion: seven eyes (78%). In comparison, pseudoflow occurred in a single eye with pattern III (9%), whereas it was absent in eyes with pattern I lesions. Pattern II lesions had the highest mean LT/RT% (81%). Pattern I and III lesions had mean LT/RT% of 59% and 56%, respectively. Coregistered SS-OCT B-scan flow-overlay mode demonstrated flow signals within the apices of BVMD lesions in 78% of eyes with pattern II lesions compared to 5% and 9% in eyes with pattern I and pattern III lesions, respectively (Table 1).
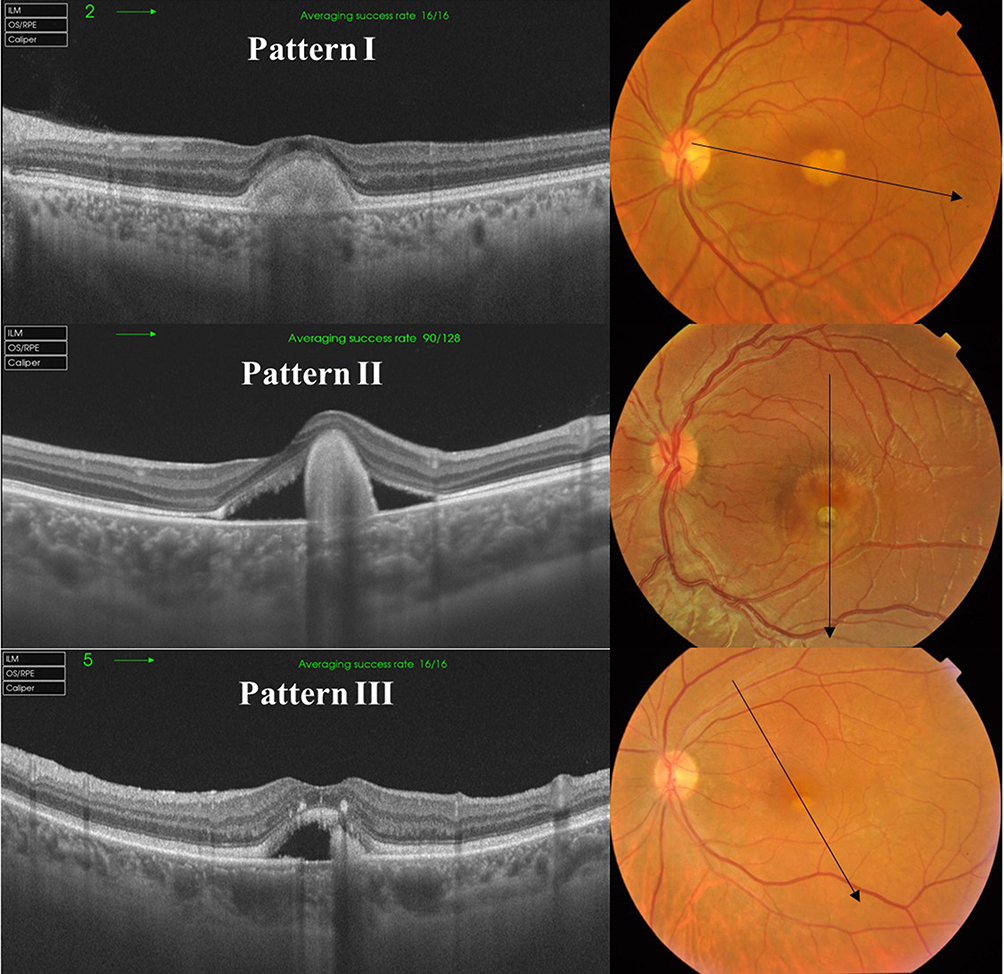 |
Figure 1 Patterns of BVMD lesion on SS-OCT scans. Pattern I consists of a homogeneous subretinal hyperreflective dome-shaped lesion with overlying retinal thinning and no neurosensory retinal detachment. Pattern II consists of a solitary subretinal hyperreflective elevated lesion surrounded by localized neurosensory retinal detachment. Pattern III consists of subretinal hyperreflective amorphous material scattered within localized neurosensory retinal detachment. |
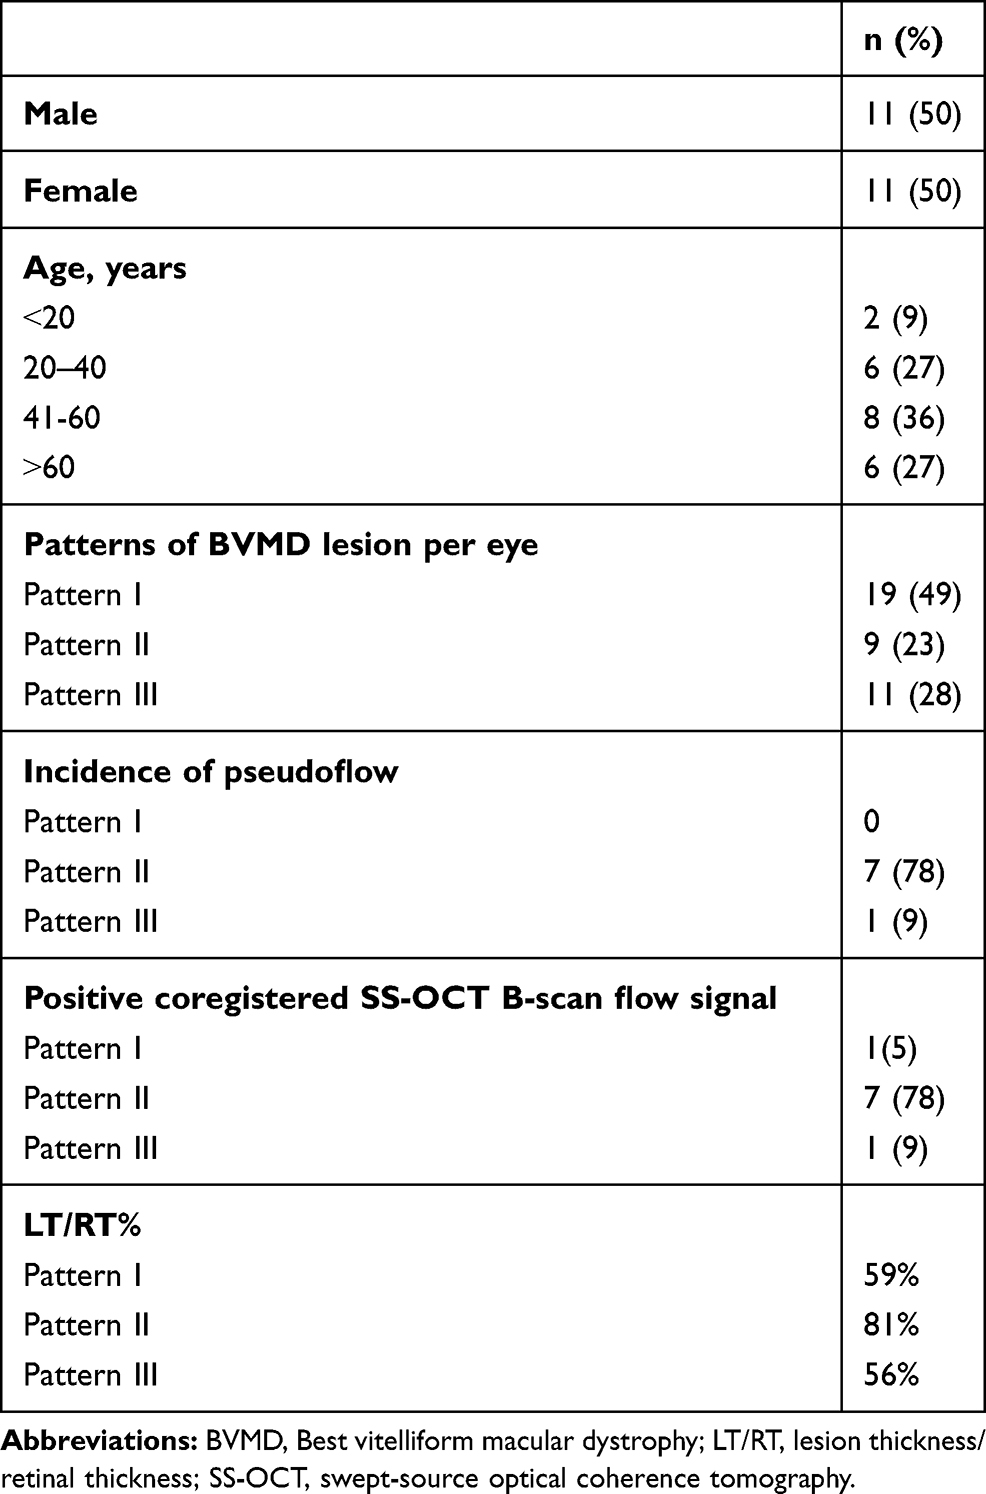 |
Table 1 Baseline characteristics of the study population |
Correlations
Statistical analysis revealed that pseudoflow occurred with highest frequency in association with pattern II lesions (p<0.001), presence of flow signal within the BVMD lesion (p<0.001), and lesions whose height represented >80% of the retinal thickness (p<0.001, Tables 2 and 3 and Figures 2–5).
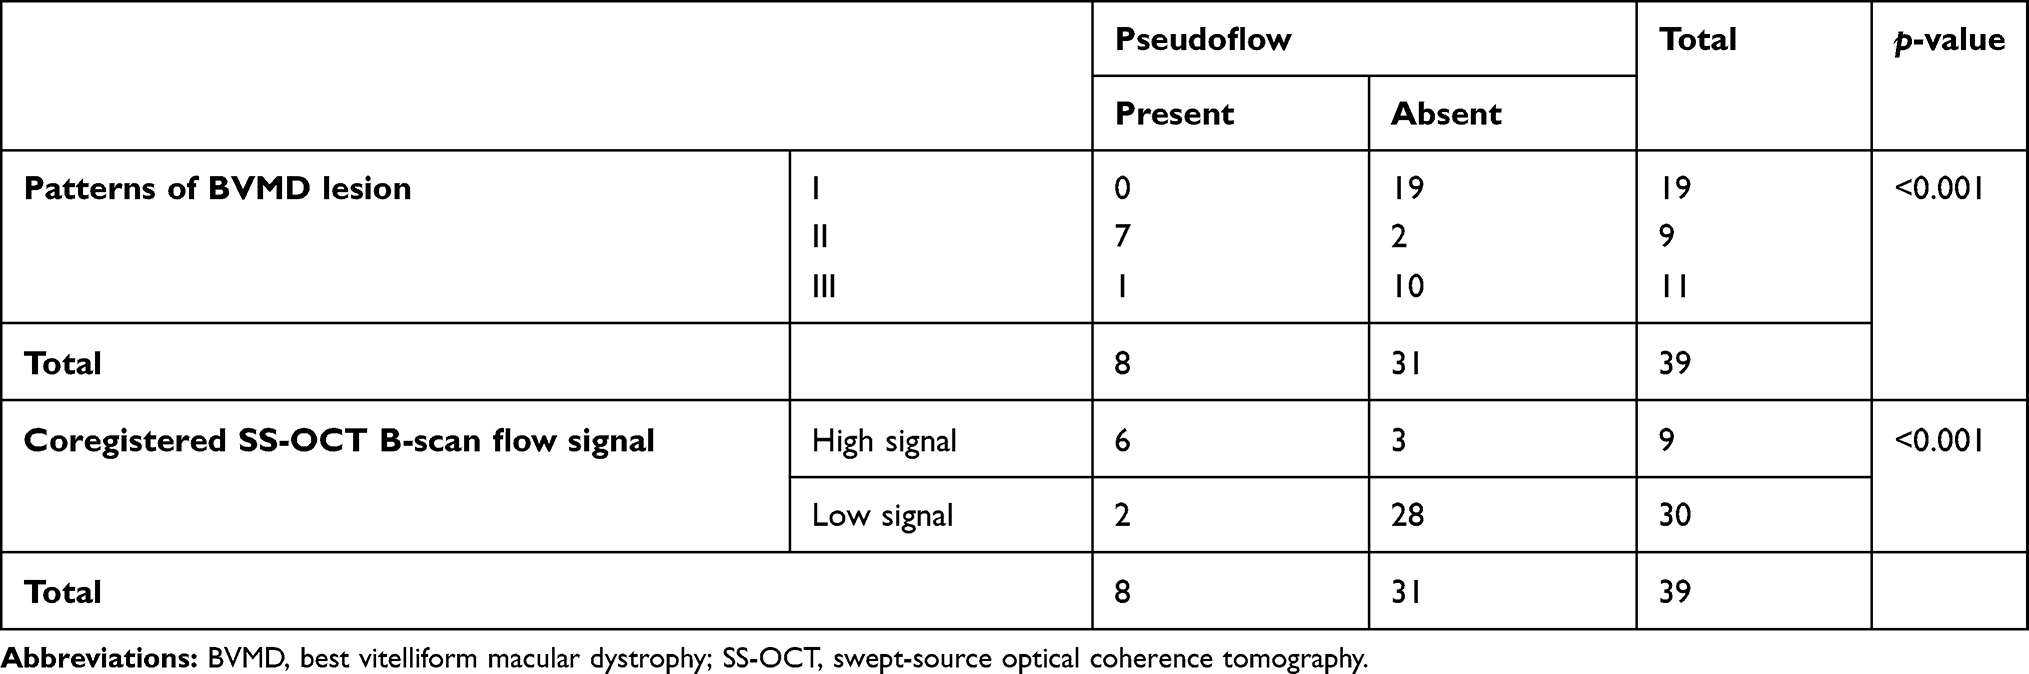 |
Table 2 Correlation between patterns of BVMD lesion and coregistered SS-OCT B-scan flow signals versus pseudoflow |
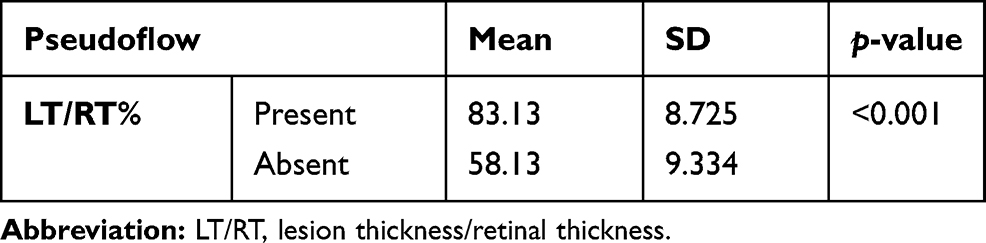 |
Table 3 Correlation between LT/RT% and pseudoflow |
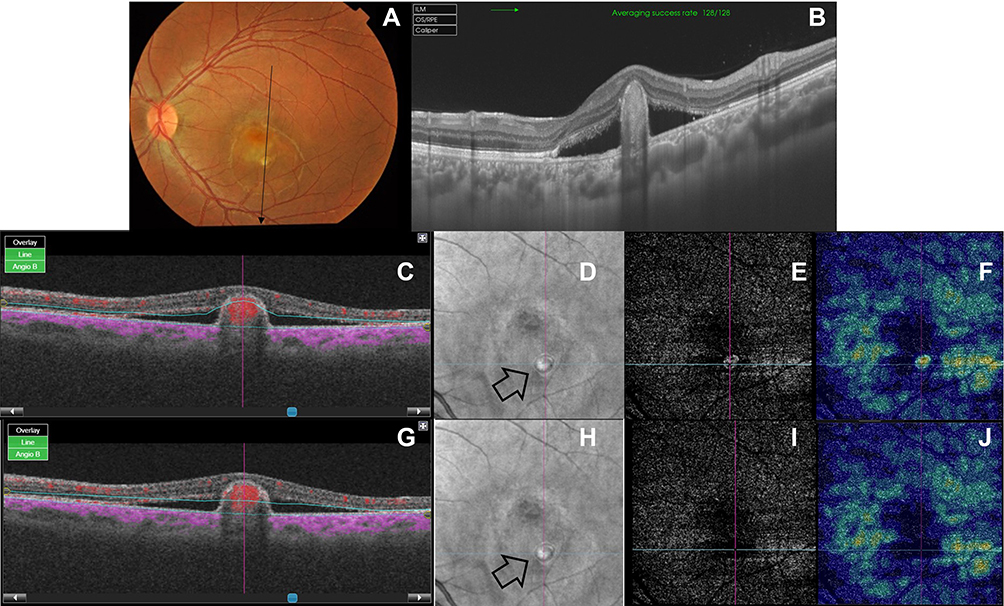 |
Figure 2 (A) Color fundus photo of the left eye of a 16-year-old male patient with BVMD. The paramacular lesion is composed of a single rounded yellowish-white subretinal nodule with sharply circumscribed boundaries. The nodule is surrounded by an area of neurosensory retinal detachment approximately three disc diameters (DD) in size. The macular area shows diffuse RPE mottling. (B) Corresponding structural SS-OCT in 9 mm-line scan mode shows a pattern II lesion. (C) Coregistered SS-OCT B-scan with flow overlay of the same eye before application of custom segmentation. Note the dense flow signal (red), significant elevation of the lesion, and relatively broad apical surface area. The default slab defining the IPL–INL is distorted by the vitelliform lesion. (D) En face structural SS-OCT image of the outer retina before application of custom segmentation. The image shows a hyperreflective lesion surrounded by a hyporeflective rim, possibly due to signal attenuation by neurosensory retinal detachment (black arrow). (E, F) En face SS-OCTA image of the outer retina of a 6×6 mm area and corresponding flow-density map. Note the hyperintense decorrelation signal suggestive of flow within a neovascular complex. (G) Coregistered SS-OCT B-scan with flow overlay of the same patient after adjustment of the contour of the segmentation slab to follow the IPL–INL junction. (H) En face structural SS-OCT image of the outer retina after application of custom segmentation. Note that the intensity of signal produced by the lesion is not affected by adjustment of the segmentation slab (black arrow). (I, J) En face SS-OCTA image of the outer retina and corresponding flow-density map after customized segmentation. Images show an avascular outer retina, which indicated that the previously noted hyperintense decorrelation signal was pseudoflow due to projection artifact. |
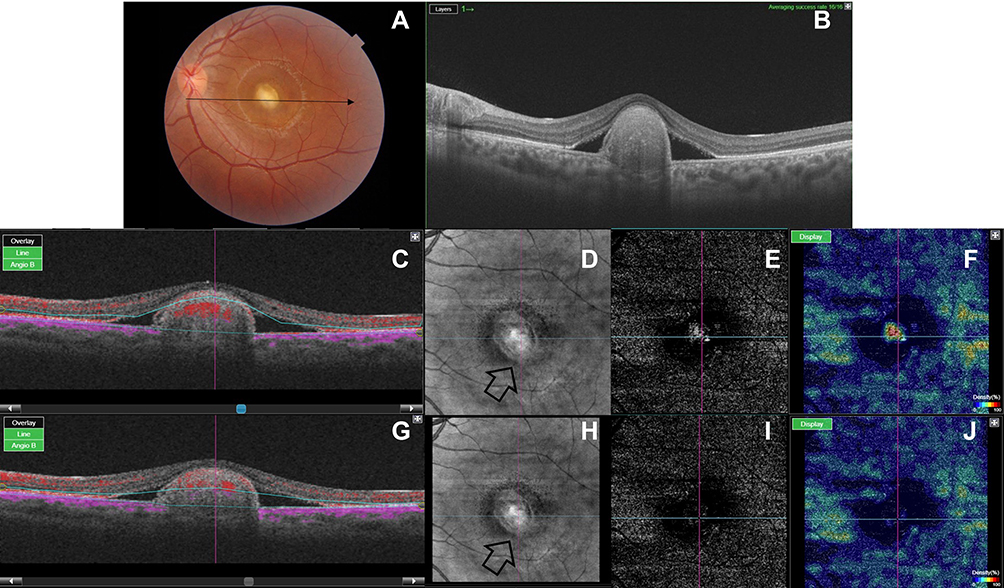 |
Figure 3 (A) Color fundus photo of the left eye of an 18-year-old male with BVMD. The macular area shows a yellowish-white solitary elevated subretinal lesion >0.5 DD in size. The lesion has well-defined boundaries and is surrounded by localized neurosensory retinal detachment. (B) Corresponding structural SS-OCT in 9 mm line-scan mode shows a pattern II lesion. (C) Coregistered SS-OCT B-scan with flow overlay of the same eye shows dense flow signal (red) within the apical portion of the lesion. Note that the lesion caused distortion of the default segmentation slab defining the IPL–INL junction. (D) En face structural SS-OCT image of the outer retina before application of custom segmentation. The image shows a hyperreflective lesion surrounded by a hyporeflective rim, possibly due to signal attenuation by neurosensory retinal detachment (black arrow). (E, F) En face SS-OCTA image of the outer retina and corresponding color-coded flow-density map of a 6×6 mm area show a hyperintense signal suggestive of flow within a neovascular network. (G) Coregistered SS-OCT B-scan with flow overlay after realignment of the contour of the IPL–INL slab. (H) En face structural SS-OCT image of the outer retina after application of custom segmentation. Note that the intensity of signal produced by the lesion is not affected by adjustment of the segmentation slab (black arrow). (I, J) En face SS-OCTA image of the outer retina and corresponding flow-density map after customized segmentation. Images show an avascular outer retina, indicating that the previously noted hyperintense decorrelation signal was pseudoflow due to projection artifact. |
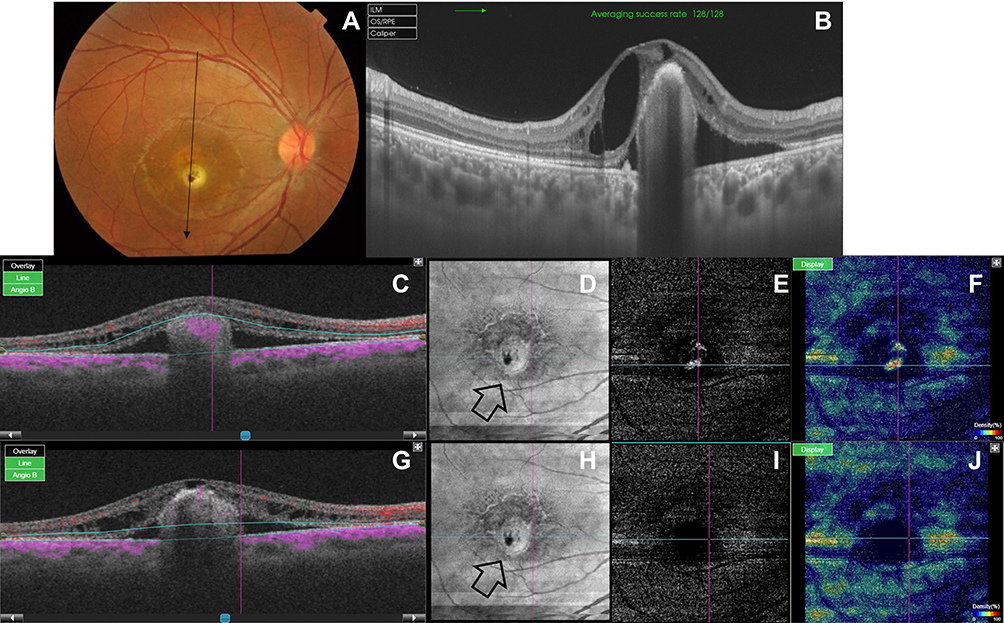 |
Figure 4 (A) Color fundus photo of the right eye of a 16-year-old male with BVMD. The macular area shows a solitary yellowish-white subretinal nodule with overlying RPE clumps. The lesion is approximately 0.3 DD in size and is surrounded by localized neurosensory retinal detachment. (B) Corresponding structural SS-OCT in 9 mm line-scan mode shows a pattern II lesion. (C) Coregistered SS-OCT B-scan image with flow overlay shows a flow signal at the apex of the lesion (purple). Note displacement of the default slab defining the IPL–INL by the lesion. (D) En face structural SS-OCT image of the outer retina before application of custom segmentation. The image shows a hyperreflective lesion surrounded by a hyporeflective rim, possibly due to signal attenuation by neurosensory retinal detachment (black arrow). The hyporeflective dot within the lesion corresponds to RPE clumps seen in the color photo. (E, F) En face SS-OCTA image of the outer retina and corresponding flow-density map show hyperintense decorrelation signal suggestive of a bilobe active neovascular complex. (G) Coregistered SS-OCT B-scan image with flow overlay after re-alignment of the displaced IPL–INL slab. (H) En face structural SS-OCT image of the outer retina after application of custom segmentation. Note that the intensity of the signal produced by the lesion is not affected by adjustment of the segmentation slab (black arrow). (I, J) En face SS-OCTA image of a 6×6 mm area of the outer retina and corresponding flow-density map after customized segmentation. The previously noted hyperintense decorrelation signal is not detectable, which indicated pseudoflow due to projection artifact. |
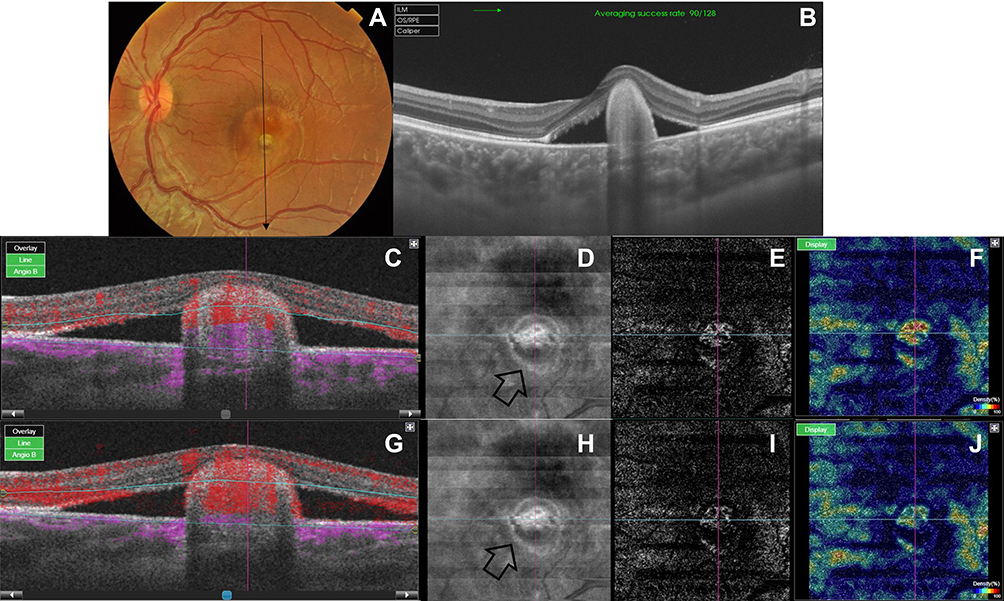 |
Figure 5 (A) Color fundus photo of the left eye of a 9-year-old male with BVMD. The macular area shows a solitary yellowish-white sub-retinal nodule <0.3 DD. The nodule is surrounded by localized neurosensory retinal detachment. (B) Corresponding structural SS-OCT in 9 mm line-scan mode shows a pattern II lesion. (C) Coregistered SS-OCT B-scan image with flow overlay shows a dense flow signal within the apex of the lesion (red). Note distorted default slabs defining IPL–INL and BM layers. (D) En face structural SS-OCT image of the outer retina before application of custom segmentation. The image shows a hyperreflective lesion surrounded by a hyporeflective rim, possibly due to signal attenuation by neurosensory retinal detachment (black arrow). (E, F) En face SS-OCTA image of a 3×3 mm area of the outer retina and corresponding flow-density map show a hyperintense decorrelation signal, denoting flow within a neovascular network. (G) Coregistered SS-OCT B-scan image with flow overlay after custom segmentation. (H) En face structural SS-OCT image of the outer retina after application of custom segmentation. Note that the intensity of the signal produced by the lesion is not affected by adjustment of the segmentation slab (black arrow). (I, J) Note substantial attenuation of the previously noted hyperintense decorrelation signal after elimination of pseudoflow. Note absent arborization, looping, and anastomosis, which indicates minimal activity or a vascularized scar. |
Discussion
In the present study, we detected pseudoflow associated with BVMD lesions in eight eyes, which representing 20.5% of the study population. Pseudoflow was significantly most evident in association with pattern II lesion morphology. Lesions in this category were composed of highly elevated vitelliform subretinal material. Their mean thickness represented 81% of the entire thickness of the retina for a given OCT line scan and had a broad apex. The apical portion of the lesion caused distortion of the overlying retinal layers and generated segmentation error in the default IPL–INL slab. We suggest that the triad of compactness, relatively large apical surface area, and proximity to the overlying retinal vascular plexuses provided an ideal platform for an artifactual flow signal to develop within the lesion. Furthermore, our results showed that whenever these criteria were absent, the incidence of pseudoflow declined dramatically or did not exist as in patterns I and III. Our findings are corroborated by Zheng et al,11 who reported in a prospective case series the presence of artifactual vascular flow suggestive of neovascular network in 100% of eyes with age-related macular degeneration (AMD) and drusen. Similarly, our results are in accordance with those of Hou et al,12 who detected pseudoflow associated with hard exudates in 100% of eyes with retinal vein occlusion and diabetic macular edema.
Further supporting evidence of the significant confounding potential of projection artifacts in OCTA-image analysis was illustrated by Zheng et al11 in their critique of the work by Querques et al14,15 that described subclinical type I neovascularization mimicking drusenoid RPE detachment in a series of cases with atrophic AMD. We concur with Zheng et al11 in that the neovascular network described by Querques and Souied14 in one of their cases was actually mimicked by a projection artifact cast by overlying retinal vasculature on hyperreflective drusen, leading the authors to drift from their original sound interpretation of the lesion as multilaminar sub-RPE lipid mineralization and misinterpret the decorrelation signal as flow within a neovascular network. In the current report, we deployed a customized slab-adjustment method whenever flow was detected in the en face SS-OCTA image of the outer retina. After slab realignment, the flow signal disappeared completely in seven of eight eyes, which would not be feasible had the lesion been truly vascularized, particularly considering the adjusted slabs encompassed the entire BVMD lesion except for its apical portion. In the single remaining eye, the signal diminished substantially in intensity, denoting lesser vascularity and size of the neovascular complex or denoting a vascularized scar (Figure 5). Zheng et al11 used a comparable approach for elimination of projection artifacts cast by retinal vasculature onto the underlying hyperreflective RPE on the surface of drusen. The authors succeeded in eliminating that artifact in all eyes using custom segmentation-derived slabs.
In comparison to the custom-segmentation strategy, other projection-artifact elimination algorithms include CNV masking, slab subtraction, and projection-resolved algorithms.16–22 The latter algorithm circumvented the drawbacks of the other two, which consisted mainly of replacing the eliminated projection artifact with a shadow artifact that cluttered components of the pathology in question, eg, a neovascular network and inability to eliminate the artifact in cross-sectional OCTA images. Nevertheless, Hou et al12 reported recently that the projection-resolved algorithm mitigated the intensity of the artifact, but without being able to completely eliminate it. To our knowledge, this report is the first series to describe pseudoflow in BVMD lesions and propose a customized slab-segmentation strategy to eliminate this artifact. The importance of this report is that it provides crucial information on a major confounding factor that could significantly undermine SS-OCTA performance in imaging BVMD, taking into consideration the increasing reliance on this technology. An important limitation of the customized slab-segmentation technique we used in our study is that it relies entirely on operator experience and judgment in readjusting the distorted slab and the potential for discrepant rendition in processing the images between different operators and between different visits for the same patient. In addition, the technique is time-consuming, which limits its practicability in a busy clinic. Future developments of the machine to integrate automated versions of this technique would render it more versatile.
Conclusion
Pattern II BVMD lesions are associated with the highest incidence of projection artifacts in SS-OCTA images. Customized slab segmentation is effective in eliminating projection artifacts in SS-OCTA-rendered images for BVMD and in delineating the actual size and vascularity of secondary neovascular complexes. Prospective comparative studies are required to assess the efficacy and reproducibility of customized slab segmentation using SS-OCTA compared to OCT devices operating with different algorithms.
Institution
The study was conducted in a retina tertiary-care center (MEDIC Eye Center), Tanta, Egypt.
Data Sharing Statement
- The data collected from history-taking and clinical examinations of patients recruited in the current study are confidential. Access to these data is restricted by the MEDIC Eye Center, in accordance with our patient data–protection policy. Data are available for researchers who meet the criteria for access to confidential data through contacting the corresponding author.
Statement of Ethics
- This study was approved by the institutional review board of MEDIC Eye Center, Tanta, Egypt.
- It adhered strictly to the tenets of the Declaration of Helsinki of 1975 and the revision of 2013.
- All participants received a thorough explanation of all imaging modalities entailed and expected complications whenever applicable. All patients/legal guardians signed informed consent prior to enrollment.
Disclosure
The authors report no conflicts of interest in this work.
References
1. Parodi MB, Rabiolo A, Cicinelli MV, Lacono P, Romano F, Bandello F. Quantitative analysis of optical coherence tomography angiography in adult-onset foveomacular vitelliform dystrophy. Retina. 2018;38:237–244. doi:10.1097/IAE.0000000000001539
2. Parodi MB, Romano F, Cicinelli MV, et al. Retinal vascular impairment in Best vitelliform macular dystrophy assessed by means of optical coherence tomography angiography. Am J Ophthalmol. 2018;187:61–70. doi:10.1016/j.ajo.2017.12.013
3. Treder M, Lauermann JL, Alnawaiseh M, Heiduschka P, Eter N. Quantitative changes in flow density in patients with adult-onset foveomacular vitelliform dystrophy: an OCT angiography study. Graefes Arch Clin Exp Ophthalmol. 2018;256:23–28. doi:10.1007/s00417-017-3815-6
4. Ehlers JP. The OCT angiography revolution: five emerging themes. Ophthalmol Retina. 2017;1(6):457–460. doi:10.1016/j.oret.2017.09.007
5. Bonnin S, Mané V, Couturier A, et al. New insight into the macular deep vascular plexus imaged by optical coherence tomography angiography. Retina. 2015;35:2347–2352. doi:10.1097/IAE.0000000000000839
6. Moussa M, Leila M. Novel insight into morphological features and vascular profile of selected macular dystrophies using swept-source optical coherence tomography and optical coherence tomography angiography. In: Lanza M, editor. OCT –Applications in Ophthalmology. London, UK: IntechOpen; 2018:3–22.
7. Lupidi M, Coscas G, Cagini C, Coscas F. Optical coherence tomography angiography of a choroidal neovascularization in adult onset foveomacular vitelliform dystrophy: pearls and pitfalls. Invest Ophthalmol Vis Sci. 2015;56:7638–7645. doi:10.1167/iovs.15-17603
8. Querques G, Zambrowski O, Corvi F, et al. Optical coherence tomography angiography in adult-onset foveomacular vitelliform dystrophy. Br J Ophthalmol. 2016;100:1724–1730. doi:10.1136/bjophthalmol-2016-308370
9. Guduru A, Gupta A, Tyagi M, Jalali S, Chhablani J. Optical coherence tomography angiography characterisation of Best disease and associated choroidal neovascularisation. Br J Ophthalmol. 2018;102:444–447. doi:10.1136/bjophthalmol-2017-310586
10. Spaide RF, Fujimoto JG, Waheed NK. Image artifacts in optical coherence tomography angiography. Retina. 2015;35:2163–2180. doi:10.1097/IAE.0000000000000765
11. Zheng F, Roisman L, Schaal KB, et al. Artifactual flow signals within drusen detected by OCT angiography. Ophthalmic Surg Lasers Imaging Retina. 2016;47:517–522. doi:10.3928/23258160-20160601-02
12. Hou KK, Au A, Kashani AH, Freund KB, Sadda SR, Sarraf D. Pseudoflow with OCT angiography in eyes with hard exudates and macular drusen. Trans Vis Sci Tech. 2019;8(3):1–15. doi:10.1167/tvst.8.3.50
13. Sohn EH, Mullins RF, Stone EM. Macular dystrophies. In: Schachat AP, editor. Ryan’s Retina 6th Ed. Netherlands: Elsevier; 2018:953–996.
14. Querques G, Souied EH. Vascularized drusen: slowly progressive type 1 neovascularization mimicking drusenoid retinal pigment epithelium elevation. Retina. 2015;35(12):2433–2439. doi:10.1097/IAE.0000000000000761
15. Querques G, Georges A, Ben Moussa N, Sterkers M, Souied EH. Appearance of regressing drusen on optical coherence tomography in age-related macular degeneration. Ophthalmology. 2014;121:173–179. doi:10.1016/j.ophtha.2013.06.024
16. Jia Y, Bailey ST, Wilson DJ, et al. Quantitative optical coherence tomography angiography of choroidal neovascularization in age-related macular degeneration. Ophthalmology. 2014;121(7):1435–1444. doi:10.1016/j.ophtha.2014.01.034
17. Liu L, Gao SS, Bailey ST, Huang D, Li D, Jia Y. Automated choroidal neovascularization detection algorithm for optical coherence tomography angiography. Biomed Opt Express. 2015;6(9):3564–3576. doi:10.1364/BOE.6.003564
18. Zhang A, Zhang Q, Wang RK. Minimizing projection artifacts for accurate presentation of choroidal neovascularization in OCT micro-angiography. Biomed Opt Express. 2015;6(10):4130–4143. doi:10.1364/BOE.6.004130
19. Zhang M, Hwang TS, Campbell JP, et al. Projection-resolved optical coherence tomography angiography. Biomed Opt Express. 2016;7(3):816–828. doi:10.1364/BOE.7.000816
20. Zhang Q, Zhang A, Lee CS, et al. Projection artifact removal improves visualization and quantitation of macular neovascularization imaged by optical coherence tomography angiography. Ophthalmol Retina. 2017;1(2):124–136. doi:10.1016/j.oret.2016.08.005
21. Patel R, Wang J, Campbell JP, et al. Classification of choroidal neovascularization using projection - resolved optical coherence tomographic angiography. Invest Ophthalmol Vis Sci. 2018;59:4285–4291. doi:10.1167/iovs.18-24624
22. Bhavsar KV, Jia Y, Wang J, et al. Projection-resolved optical coherence tomography angiography exhibiting early flow prior to clinically observed retinal angiomatous proliferation. Am J Ophthalmol Case Rep. 2017;8:53–57. doi:10.1016/j.ajoc.2017.10.001
 © 2021 The Author(s). This work is published and licensed by Dove Medical Press Limited. The full terms of this license are available at https://www.dovepress.com/terms.php and incorporate the Creative Commons Attribution - Non Commercial (unported, v3.0) License.
By accessing the work you hereby accept the Terms. Non-commercial uses of the work are permitted without any further permission from Dove Medical Press Limited, provided the work is properly attributed. For permission for commercial use of this work, please see paragraphs 4.2 and 5 of our Terms.
© 2021 The Author(s). This work is published and licensed by Dove Medical Press Limited. The full terms of this license are available at https://www.dovepress.com/terms.php and incorporate the Creative Commons Attribution - Non Commercial (unported, v3.0) License.
By accessing the work you hereby accept the Terms. Non-commercial uses of the work are permitted without any further permission from Dove Medical Press Limited, provided the work is properly attributed. For permission for commercial use of this work, please see paragraphs 4.2 and 5 of our Terms.