")
Back to Journals » International Journal of Nanomedicine » Volume 11
Current status and perspectives in atomic force microscopy-based identification of cellular transformation
Received 2 January 2016
Accepted for publication 18 February 2016
Published 17 May 2016 Volume 2016:11 Pages 2107—2118
DOI https://doi.org/10.2147/IJN.S103501
Checked for plagiarism Yes
Review by Single anonymous peer review
Peer reviewer comments 3
Editor who approved publication: Dr Thomas Webster
Chenbo Dong, Xiao Hu, Cerasela Zoica Dinu
Department of Chemical and Biomedical Engineering, West Virginia University, Morgantown, WV, USA
Abstract: Understanding the complex interplay between cells and their biomechanics and how the interplay is influenced by the extracellular microenvironment, as well as how the transforming potential of a tissue from a benign to a cancerous one is related to the dynamics of both the cell and its surroundings, holds promise for the development of targeted translational therapies. This review provides a comprehensive overview of atomic force microscopy-based technology and its applications for identification of cellular progression to a cancerous phenotype. The review also offers insights into the advancements that are required for the next user-controlled tool to allow for the identification of early cell transformation and thus potentially lead to improved therapeutic outcomes.
Keywords: atomic force microscopy (AFM), nanoindentation, malignant transformation, cancerous phenotype, bio-nano-mechanical signature
Malignant transformation: from a normal to a cancerous phenotype
As a cell or a community of cells, a biological system’s hierarchical organization allows for structure formation and system functionality. Alteration of biological processes, such as cell cycle1 or cell division,2 may lead to fundamental disorder at the molecular level and induce activation of genetic changes (Figure 1).3
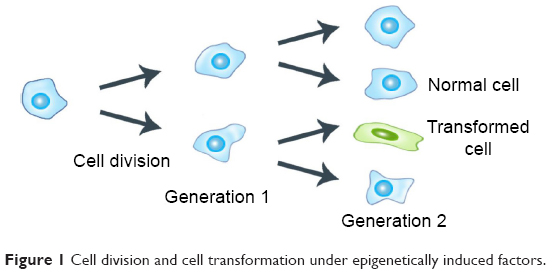 | Figure 1 Cell division and cell transformation under epigenetically induced factors. |
Particular hallmarks of cell transformation, tumor initiation, and subsequently progression have been related to the intricacies of cellular regulation.4 Similarly, epigenetic alterations inducing inflammation and microenvironment changes (Figure 2) have been shown to influence phenotype transformation.5 For instance, previous reports on epigenetic transformation revealed that metastatic properties are related to the abnormal expression of key regulatory genes. Tumor-suppressor genes could, for instance, restrain cell division as well as induce cell death, while loss of gene function could result in abnormal cellular behavior, perturbation of the cell cycle, and lack of cell regulation.6 Previous studies have also indicated that LIMD1 overexpression could retard cell-cycle progression and block S-phase entry, leading to cell accumulation in the G0/G1 phase and subsequent changes in cellular behavior;7 LIMD1 is a tumor-suppressor gene located at chromosome 3p21.3, a region commonly deleted in many malignancies.6 Another study found that deregulation of microcephalin and ASPM expression (involved in the regulation of neurogenesis)8 leads to abnormal cell division and subsequently to cancer progression.7 Microcephalin is involved in the DNA-damage response and has been linked to tumor formation and cancer invasion (Figure 3). Other analysis revealed that aberrant hypomethylation-mediated AGR2 overexpression could cause an aggressive phenotype in ovarian cancer cells;9 AGR2 is developmentally regulated initially discovered as an estrogen-responsive gene in breast cancer cell lines currently linked to tumors with poor outcome.10
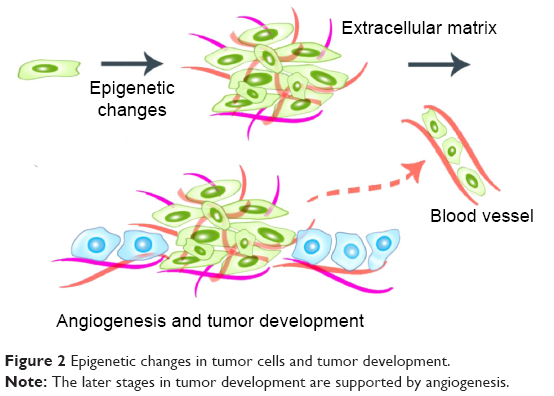 | Figure 2 Epigenetic changes in tumor cells and tumor development. |
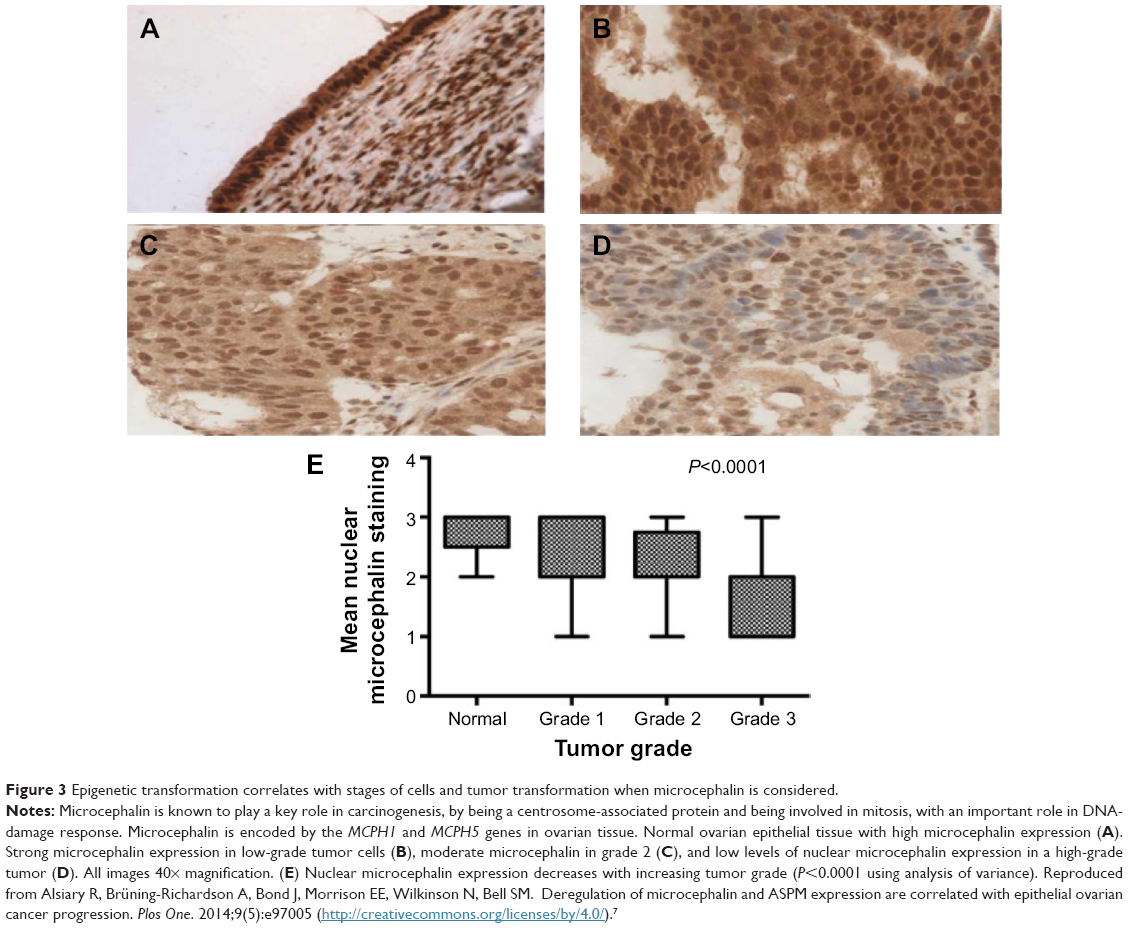 | Figure 3 Epigenetic transformation correlates with stages of cells and tumor transformation when microcephalin is considered. |
With regard to the influence of the microenvironment on cells and how changes in such microenvironments11 could lead to phenotypic progression and cancer transformation,12 analysis showed that alterations in external factors, such as the pH of a tissue, could trigger cellular changes13 and regulate cell transformation.14 An acidic environment (pH 6.5–6.9 compared with pH 7.2–7.4) could cause degradation of the extracellular matrix (ECM) and lead to the secretion of VEGF, as well as to angiogenesis, which can correlate with tumor transformation and cellular invasion (Figure 4).15 Analysis also showed that proteins in the ECM could interact directly with tumor cells, eg, via their integrin surface receptors, to influence and subsequently alter cellular behavior, proliferation, apoptosis, migration, or differentiation.16 Remodeling of the ECM could occur in tumor-fibroblast cells and subsequently accelerate cancer progression.17 During the remodeling process, the mechanical response of the ECM can change progressively,18 leading to enhanced cell migration19 followed by invasion at specific interfaces.20 Also, it was found that extracellular vesicles could regulate and modulate the microenvironment of the cancer cell21 by regulating cellular communication and playing an important role in phenotype transformation22 and cancer progression.23
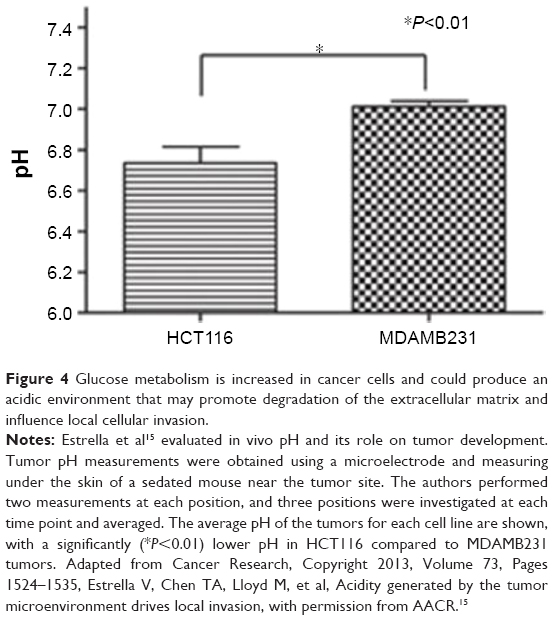 | Figure 4 Glucose metabolism is increased in cancer cells and could produce an acidic environment that may promote degradation of the extracellular matrix and influence local cellular invasion. |
The malignant transformation is accompanied by changes in cell structure24 and morphology,25 as well as changes in cellular responses to stimuli.26 Studies revealed that alterations in cell biophysical properties, especially in their biomechanical characteristics, represent an early indicator of disease progression,27–29 with phenotypic events being mostly a result of cytoskeleton remodeling.30 It was observed that BRMS1 expression in 435 cells caused changes in their architecture, leading to alterations in their biomechanical properties, with such changes being due to the reconstruction of actin cytoskeletal networks.31
However, even though the identification of the molecular link between chronic inflammation and cancer was elucidated through NFκB, the initial transformation and activation pathways remain to be clarified and chronic inflammation-induced tumorigenesis to be elucidated. Further, while significant advances have been made toward elucidating the molecular mechanisms that underlie cancer progression, fundamental questions associated with the biomechanical traits that lead to cancer development and subsequently to metastasis remain to be answered. For instance, with tumor progression being a result of the ability of transformed cells to communicate and influence one another, as well as their neighboring healthy cells,32 and with clinical observations of distinct tumors from different organs seeming to be cell-specific,33 it is unclear how and whether transformation of a cell or a community of cells in an organ could lead to different tumor phenotypes or if such transformation is propagated through the microenvironment.
Biomechanical cues help identify cell transformation
With the development of atomic force microscopy (AFM) technology, computer-assisted applications for biomedical fields for analyses of biological information in terms of biomechanical characteristics have spiked.34–37 Obtaining the “bio-nano-mechanical signature” of cells or tissues has thus been proposed as the next method that could possibly lead to the development of a differentiation tool of pathological conditions from normal ones. As such, nanoindentation or the ability to detect and measure changes in the elasticity or the elastic responses of soft materials, such as cells,38 manifested as a readout in displacement-versus-force curves (Figure 5), indicated that cancer cells have different characteristics when compared to healthy cells.26,39 In particular, studies have shown that the stiffness,40 migration ability,41 and morphology42 of cancer cells differ from healthy cells, with single cancer cells showing lower stiffness and higher deformability,43 and with such characteristics being dependent on the type of cell being analyzed.44 Further, complex examination of individual cells and their cellular components showed that the different elastic properties of cancer cells are a result of local or global changes that contribute to or induce their transformation.26
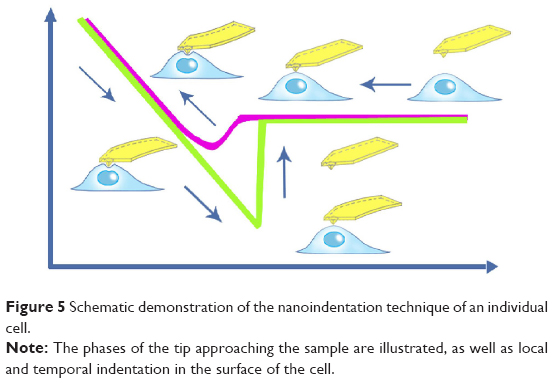 | Figure 5 Schematic demonstration of the nanoindentation technique of an individual cell. |
Analysis of the membranes of both cancer and healthy cells showed that while the surface of the latter revealed brush-like structures of one specific length and were formed from glycocalyx layers with pericellular coatings,45,46 the surface of cancer cells displayed both long and short brushes with significantly different geometries and densities. Such brush-like geometry is known to provide support for cell–cell interactions, cell migration, and differentiation.26
Paired with changes in the cellular membrane were changes in submembrane or cytoskeletal structures. For instance, analysis of malignant (MCF7) and nonmalignant (MCF10A) breast cells revealed that MCF10A cells had an apparent Young’s modulus significantly higher than that of their malignant counterparts,47 with topographic images of such cells revealing well-structured microfilaments that were different than the ones observed for the MCF7 cells (Figure 6). The differences in cytoskeletal organization were attributed to dissimilarities in the cell mechanical properties, and could possibly explain the increased migration and invasion ability of the malignant cells, especially during metastasis.
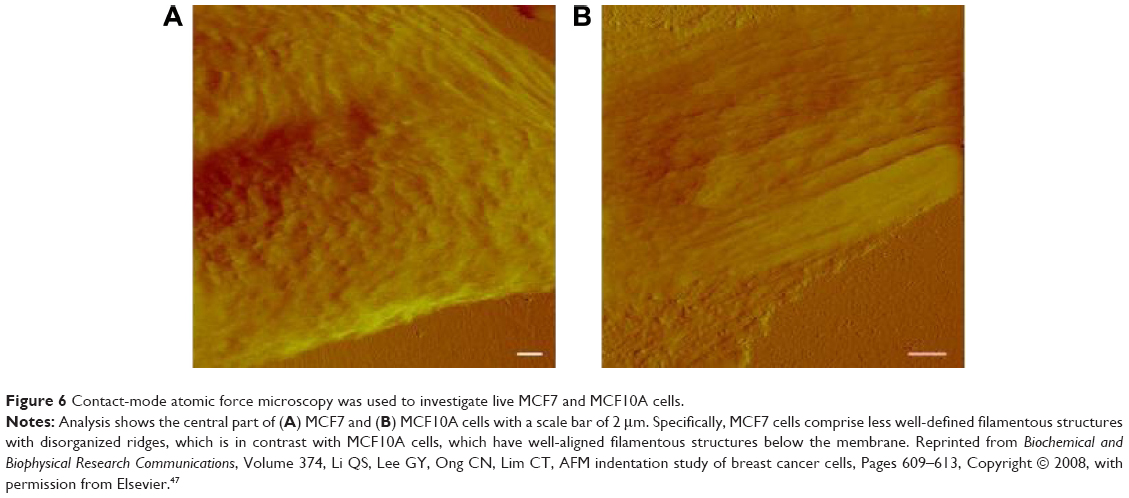 | Figure 6 Contact-mode atomic force microscopy was used to investigate live MCF7 and MCF10A cells. |
Studies also showed variations in the stiffness of the cytoskeleton of nonmalignant MCF10A and malignant MDAMB231 breast cells resulting from the growth media,48 with analysis revealing that the mean elastic modulus of MCF10A cells was higher than that of the MDAMB231 cells cultured in identical conditions. Furthermore, the characteristics of the malignant breast cells and their nonmalignant counterparts in the 27°C–34°C temperature range49 indicated that the malignant cells were softer than their counterparts. The significant difference in the cellular Young’s modulus between malignant and healthy cells was due to the structural differences recorded, especially in their three-dimensional cytoskeleton, with the cytoskeletal structures of the cancer cells showing a more fluidlike state than the cytoskeleton of the healthy cells.50
Membrane and cytoskeletal changes were largely accompanied by nuclear transformations, with AFM nanoindentation-based analysis of isolated nuclei of healthy (MCF10A) and malignant (MCF7) human breast epithelial cells showing mechanical changes in relation to individual cell type.51 In particular, the apparent Young’s modulus of MCF7 cell nuclei was much lower than that of MCF10A cell nuclei, mainly because of the alternation of their underlying lamina (lamin A/C) structure. The study also indicated that the nucleus’ deformability was tightly related to the softening of cancer cells. Complementary AFM nanomechanical-based analysis of several areas of healthy and cancer oligodendrocytes52 showed that the elastic modulus of the nuclear regions of the cancer cells was lower than that of the cell periphery, with cancer cells being threefold softer than healthy cells. Similar results were obtained for malignant thyroid cells,53 with the elastic analysis showing that such malignant cells were three- to fivefold softer relative to their primary and untransformed counterparts.
Nanoindentation allows cell-type and metastatic potential differentiation
Nanoindentation enabled detection of cancerous cells from a mixture with healthy cells.44 In particular, the elasticity of human kidney cell lines from different types of tumors (ie, carcinoma [A498] and adenocarcinoma [ACHN]) was compared with that of a benign cell line (RC124). For this, dozens of individual cells were mapped, and more than 15,000 data points per cell were generated to calculate the sample’s viscoelastic properties and the elastic modulus. Systematic comparisons indicated that cancer cells had distinctive elastic properties, with the Young modulus of the A498 carcinoma cell line being larger than that of the adenocarcinoma. Similarly, a direct comparison of elastic properties of human breast cancer cells (MCF7) and human cervical carcinoma cells (HeLa), known to have similar phenotypes,54 showed that HeLa cells were three times harder than MCF7 cells.
Different prostate cancer cells showed distinctive metastatic potential, which was subsequently correlated with variations in their elastic moduli.55 For instance, the elastic modulus of a primary benign prostate hyperplasia cell line was greater than that of the LNCaP-clone-FGC and PC3 cell lines, with the Young modulus of the highly invasive PC3 cells being higher than that of the noninvasive LNCaP-clone-FGC cells. Such variations point to distinctive clinical behavior and potentially hint at different therapeutic outcomes for such cells.
When nanoindentation was used to detect cancer progression in tissue sections originating from patients,56 analysis showed that the apparent Young modulus of the cancer region was half that of the nonneoplastic tissue. Moreover, elastic mapping conducted on healthy tissues showed homogeneous modulus profiles characterized by a single distinct peak. In contrast, malignant tissues had a distinctive broad distribution of their Young moduli mainly originating from the tissue heterogeneities, with cancer cells revealing prominent low-stiffness peaks.57 Further, such differences in cell stiffness could also be related to identification of biomarkers with potential invasive and metastatic characteristics (Figure 7).58
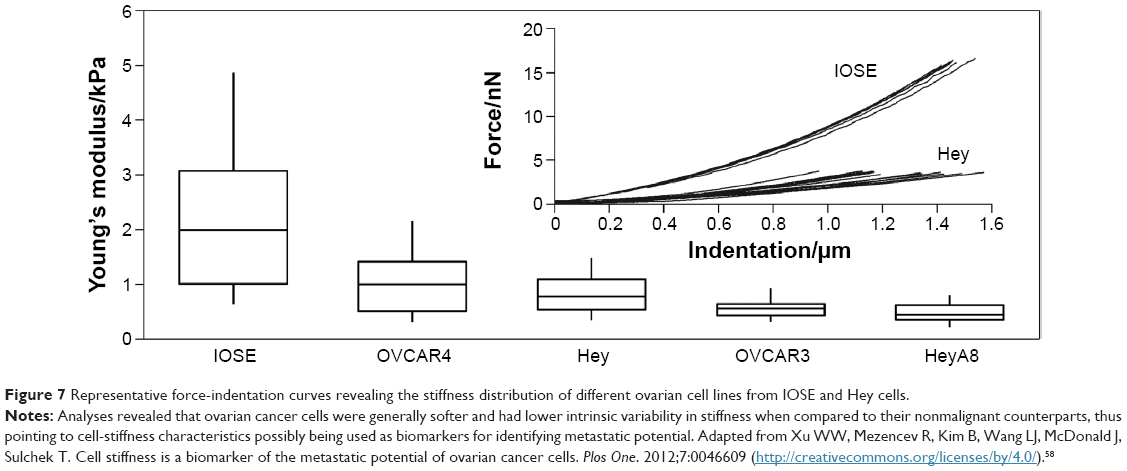 | Figure 7 Representative force-indentation curves revealing the stiffness distribution of different ovarian cell lines from IOSE and Hey cells. |
Bionanomechanical-based AFM functional analysis helped detect metastatic tumor cells in bodily fluids,57 with Cross et al showing that lung, breast, and pancreas cancer cells displayed significantly decreased stiffness when compared to healthy control counterparts.57 Rother et al investigated viscoelastic responses of nine cell lines (ie, NIH3T3 fibroblasts, MDCKII, NMuMG, A549, SW13, MCF7, MCF10A, MDAMB231, and Caki1 cells) from four different organs, all known to have variable metastatic potential,56 (Figure 8) and showed that cells from the organ exhibiting malignancy were generally softer than their benign cell counterparts.59
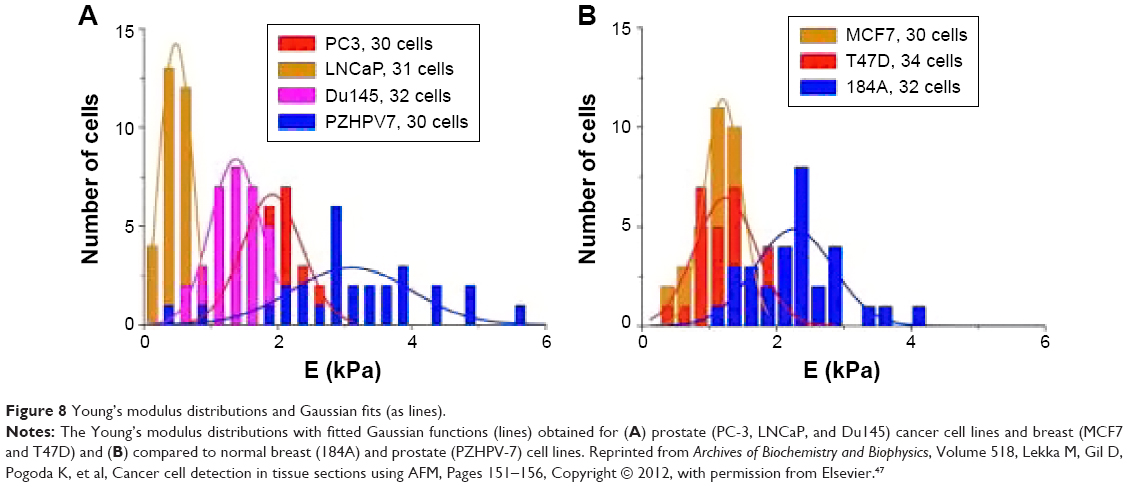 | Figure 8 Young’s modulus distributions and Gaussian fits (as lines). |
When elastic moduli and cell-substrate adhesion analyses for lowly (LNCaP) and highly (CL1, CL2) metastatic human prostate cancer cells were performed,60 results showed that the elastic moduli of CL1 and CL2 were greater than those of LNCaP, with CL1 and CL2 displaying a significantly larger area to cell-substrate adhesion relative to the LNCaP cells. The increased elastic moduli found in CL1 and CL2 were attributed to the enhanced tensile stress generated from the actin cytoskeleton anchored on more focal adhesion sites, hinting again at different metastatic potential of such cells. Complementary analysis of late-stage tumors in the lungs of mice indicated that migration and metastatic spreading characteristics were related to the low elasticity of hypoxia-associated cancer cells. In particular, bionanomechanical response experiments on benign mesothelial cells and metastatic cancer cells derived from human body fluids61 showed that the Young modulus of metastatic tumor cells was about 80% lower than that of the benign cells. Moreover, cell-adhesion analysis of these malignant cells revealed an overall 33% reduced adhesion when compared to the adhesion of benign cell counterparts.
A summary of the changes in elasticity of different types of tissues and cells, all relative to controls (noncancerous cells) is in Table 1. The results suggest that the morphology factor alone was sufficient to explain differences in stiffness for the cell types being considered and hint at mechanisms of cell invasion being based on reduced adhesion of cells to their three-dimensional environment.
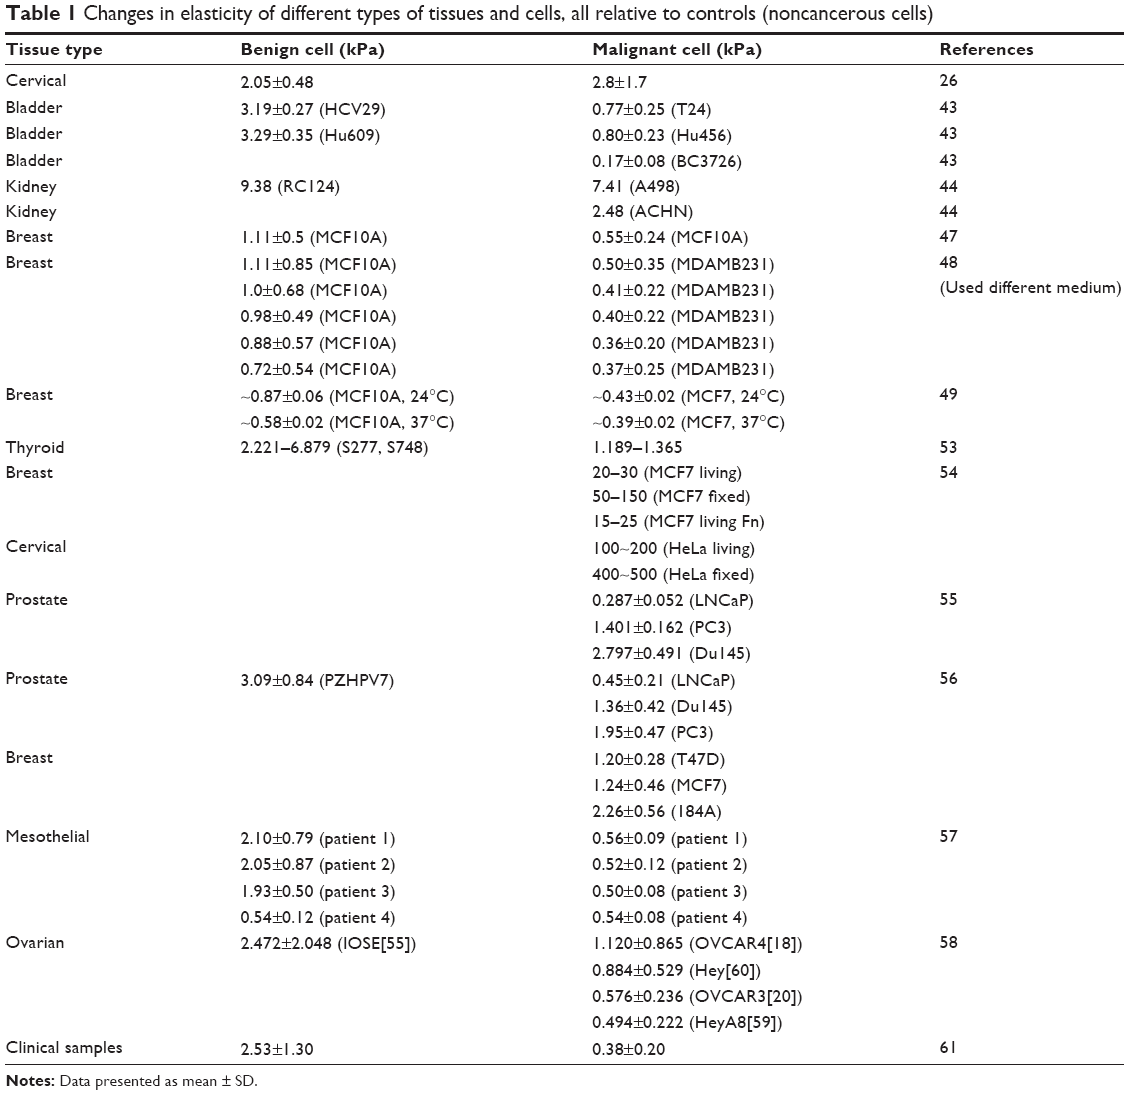 | Table 1 Changes in elasticity of different types of tissues and cells, all relative to controls (noncancerous cells) |
Is there a next generation of AFM-based tools to be used for clinical identification of pathological conditions?
To advance AFM-based technologies for clinical detection of cell transformation, a trained workforce and consecutive probing of cell characteristics are required. However, with reports showing that such consecutive measurements can influence the mechanics of individual cells,62 and with rigorous statistical analyses revealing that sample-preparation conditions need to be accounted for when reliability in cancer diagnosis is envisioned, the heterogeneity and complexity of a transformed cell is more than a mechanical cue indicator that permits evaluation and readability of changes in terms of cellular elasticity. As such, if AFM is to be used for advanced diagnosis and for clinical detection, the heterogeneity of the cellular sample needs to be accounted for. In particular, with analysis showing that molecular composition plays a critical role in the mechanics of the tissue,63 for AFM to be a viable and useful tool for clinicians, analysis of the plasticity of a cell population64,65 needs to be supported by biochemical assays,66 gene expression,67 and immunofluorescent labeling.68
Research combining AFM and biochemical assays has already shown that the interaction and bond formation of single P-selectin–ligand complexes can be quantified. P-selectin is located on the endothelial cell wall, and helps support the leukocyte when under hydrodynamic flow; the complex formed upon association with glycoproteins was shown to exhibit chain-like elasticity with a 5.3 pN·nm−1 molecular spring constant and a 0.35 nm persistence length.69 Other studies indicated that DNA-dependent protein kinase can bind at the DNA termini, with such binding being characterized by AFM.70 Also, high-speed AFM was used to reveal ATP-driven motor F1-rotary behavior and quantify its conformational changes, as well as confirm the dependence of the initial rates of ATP hydrolysis, as determined through biochemical assay (Figure 9).71 Lastly, stretching single polysaccharides and proteins in the presence of AFM has been demonstrated, thus contributing to the body of work illustrating the biophysics and chemical biology of a protein–protein bond or enzymatic reactions related to force applications.72
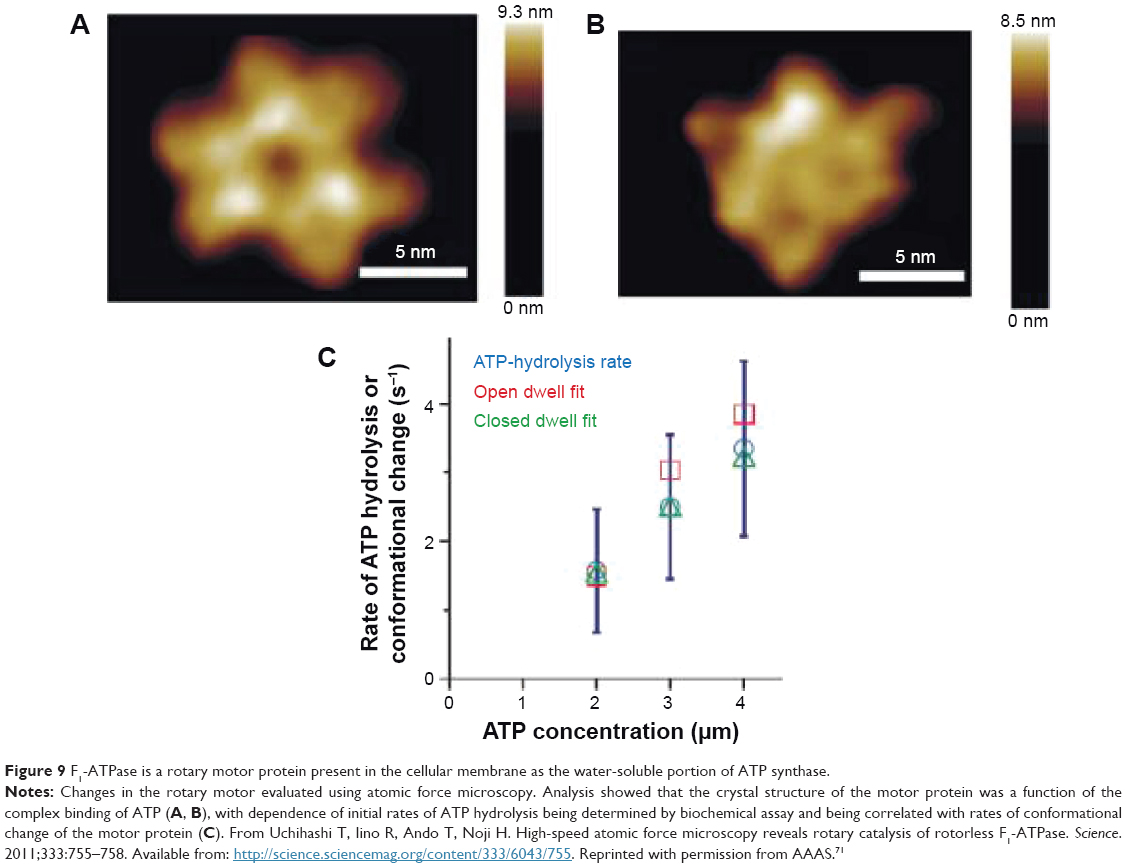 | Figure 9 F1-ATPase is a rotary motor protein present in the cellular membrane as the water-soluble portion of ATP synthase. |
Research combining AFM with gene-expression analysis has reported on DNA condensation and how this could be used for gene therapy.73 Polylysine covalently attached to the glycoprotein asialoorosomucoid was shown to enhance gene expression in the liver of a mouse model, with the enhancement being up to 50-fold higher when compared to polylysine alone. By combing AFM with confocal microscopy, scholars evaluated bioeffects of therapeutic ultrasound-mediated DNA on cells and nuclei,74 with the therapeutic ultrasound proving to be useful for increasing transfection efficiency. Zhu et al mapped the nucleotide-binding site of uncoupling protein 1 with the help of AFM and using both topographic and recognition modes of the mitochondrial membrane to elucidate the mechanism of the nucleotide binding, and thus helped explain how reactive oxygen-species generation can be used for obesity-, inflammation-, neurodegeneration-, or ischemia-related therapies.75 Kim et al investigated fundamental structural units in the Escherichia coli nucleoid using AFM,76 and showed that fibrous structures of 40 nm and 80 nm were found in the different growth phases of the bacteria.
Lastly, preliminary research combining AFM and immunolabeling has already demonstrated that cytoskeletal structures can be probed by combining AFM with stimulated emission depletion (STED)77,78 (Figure 10) and/or stochastic optical reconstruction microscopy,79 all to ensure high resolution.80 Research has also shown that by combining AFM with immunofluorescence, both HDAC6 and its role in mediating vimentin’s reorganization can be elucidated. Vimentin is known to modify the cytoskeleton structure and thus influence and regulate cellular mechanics.81 Specifically, the authors showed that the organization of vimentin fibers in the oncogene-expressing cells was different than in the controls, with STED revealing a more entangled structure and an increase in cellular stiffness relative to controls. Such ultrahigh-resolution analysis also showed increased cellular disorganization, consistent with the possibility that oncogenes induce an HDAC6-mediated collapse of the cytoskeletal network to contribute to changes in cellular stiffness and ultimately in cell invasion that could accompany epithelial-to-mesenchymal transition. Further, Harke et al demonstrated that by combining AFM and STED, a novel advanced nanoscopic tool can be created to allow for fluorescence, topographical, and elastic-modulus analysis of biosamples.82 Other studies also revealed cytoskeleton structures (such as actin filaments and microtubules) of living astrocytes in neural cells by coupling AFM with confocal microscopy. The results showed that the cytoskeleton fibers had high elastic moduli and demonstrated AFM’s great potential to differentiate the roles of the cytoskeleton in neurodegeneration.83 Cell-wall elongation and cytoskeleton changes have also been observed for Gram-negative bacteria using superresolution-fluorescence microscopy combining AFM and stochastic optical reconstruction microscopy.84
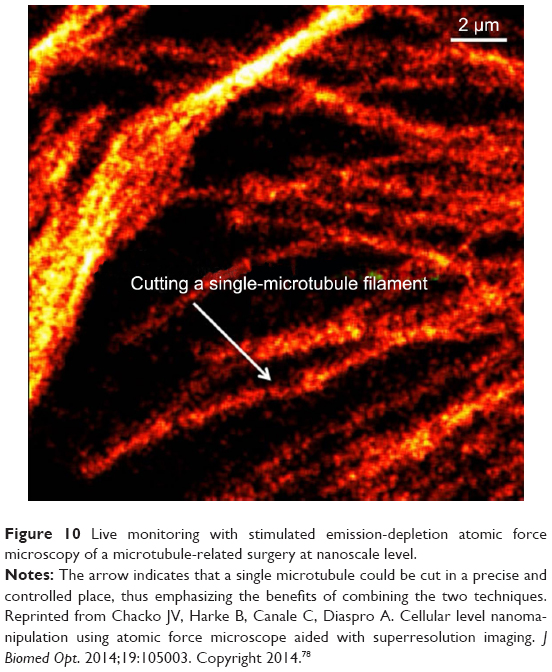 | Figure 10 Live monitoring with stimulated emission-depletion atomic force microscopy of a microtubule-related surgery at nanoscale level. |
While this information provides evidence that AFM integration with current diagnosis assays might become a useful tool for clinicians, concerns regarding this technique’s limited ability to allow for automation and real-time cell-transformation analysis and evaluation, all in the natural viscoelastic conditions of both the cell and its ECM, need to be addressed. In particular, with stiffness being a function of the time scale of the measurement,85 and knowing that well-controlled and tightly regulated balances of forces are required to help maintain homeostasis in a cell or a community of cells,86 and with the ECM controlling survival,87 cellular development,88 migration,89 proliferation,90 shape,91 and ultimately cellular fate and function, quantifying heterogeneity at the level of a single cell or a community of cells makes analysis even more challenging.
As such, the next generation of AFM-based technologies to be considered for the identification of cell transformation should allow for possible differentiation of the different tumor elements, as well as the capability to assess how such elements can work together synergistically to contribute to or define tumor heterogeneity. For instance, such a “clinician-friendly” tool should allow for parallel tests to be performed in individual labs on chip “rooms”, in which immobilized cell samples could permit evaluation of levels of protein expressions, changes in morphology, or changes in cellular elasticity (Figure 11). Moreover, an ideal instrument should also allow for real-time monitoring of cellular physiological changes in a nondestructive manner and in a fast and reliable way by combining such physiological changes with the morphological and biochemical cues in a manner that could be easily interpreted by the user, ie, the clinician. Without the complexity of the biology, the analysis of mechanical cues, while perhaps providing behavioral insights, cannot provide a time-dependent cell-transformation analysis nor can it allow for evaluation of heterogeneity based on the individual changes in the cell cycle.
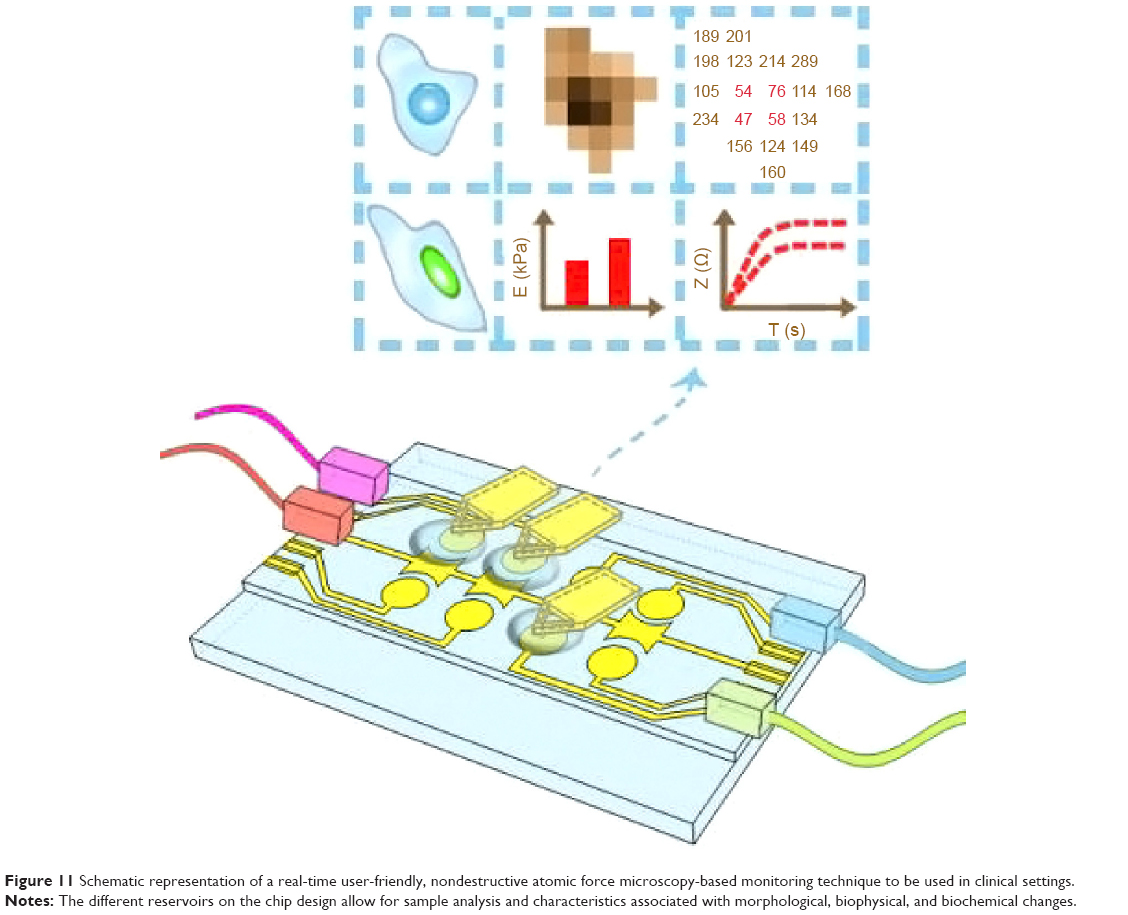 | Figure 11 Schematic representation of a real-time user-friendly, nondestructive atomic force microscopy-based monitoring technique to be used in clinical settings. |
Acknowledgment
This work was supported by National Science Foundation (NSF) grants 1300757 and 1434503.
Disclosure
The authors report no conflicts of interest in this work.
References
Mo W, Chen J, Patel A, et al. CXCR4/CXCL12 mediate autocrine cell-cycle progression in NF1-associated malignant peripheral nerve sheath tumors. Cell. 2013;152:1077–1090. | ||
Chaffer CL, Weinberg RA. A perspective on cancer cell metastasis. Science. 2011;331:1559–1564. | ||
Gordon DJ, Resio B, Pellman D. Causes and consequences of aneuploidy in cancer. Nat Rev Genet. 2012;13:189–203. | ||
Vermeulen K, Van Bockstaele DR, Berneman ZN, The cell cycle: a review of regulation, deregulation and therapeutic targets in cancer. Cell Prolif. 2003;36:131–149. | ||
Kwon OJ, Zhang L, Ittmann MM, Xin L. Prostatic inflammation enhances basal-to-luminal differentiation and accelerates initiation of prostate cancer with a basal cell origin. Proc Natl Acad Sci U S A. 2014;111:E592–E600. | ||
Mayank AK, Sharma S, Deshwal RK, Lal SK. LIMD1 antagonizes E2F1 activity and cell cycle progression by enhancing Rb function in cancer cells. Cell Biol Int. 2014;38:809–817. | ||
Alsiary R, Brüning-Richardson A, Bond J, Morrison EE, Wilkinson N, Bell SM. Deregulation of microcephalin and ASPM expression are correlated with epithelial ovarian cancer progression. Plos One. 2014;9:e97005. | ||
Kouprina N, Pavlicek A, Collins NK, et al. The microcephaly ASPM gene is expressed in proliferating tissues and encodes for a mitotic spindle protein. Hum Mol Genet. 2005;14:2155–2165. | ||
Sung HY, Choi EN, Lyu D, Park AK, Ju W, Ahn JH. Aberrant hypomethylation-mediated AGR2 overexpression induces an aggressive phenotype in ovarian cancer cells. Oncol Rep. 2014;32:815–820. | ||
Salmans ML, Zhao F, Andersen B. The estrogen-regulated anterior gradient 2 (AGR2) protein in breast cancer: a potential drug target and biomarker. Breast Cancer Res. 2013;15:204. | ||
Cairns RA, Harris IS, Mak TW. Regulation of cancer cell metabolism. Nat Rev Cancer. 2011;11:85–95. | ||
Goldstein AS, Witte ON. Does the microenvironment influence the cell types of origin for prostate cancer? Genes Dev. 2013;27:1539–1544. | ||
Allen M, Jones JL. Jekyll and Hyde: the role of the microenvironment on the progression of cancer. J Pathol. 2011;223:162–176. | ||
Bloom AB, Zaman MH. Influence of the microenvironment on cell fate determination and migration. Physiol Genomics. 2014;46:309–314. | ||
Estrella V, Chen TA, Lloyd M, et al. Acidity generated by the tumor microenvironment drives local invasion. Cancer Res. 2013;73:1524–1535. | ||
Nelson CM, Bissell MJ. Modeling dynamic reciprocity: engineering three-dimensional culture models of breast architecture, function, and neoplastic transformation. Semin Cancer Biol. 2005;15:342–352. | ||
Fullar A, Dudas J, Olah L, et al. Remodeling of extracellular matrix by normal and tumor-associated fibroblasts promotes cervical cancer progression. BMC Cancer. 2015;15:256. | ||
Malik R, Lelkes PI, Cukierman E. Biomechanical and biochemical remodeling of stromal extracellular matrix in cancer. Trends Biotechnol. 2015;33:230–236. | ||
Bi HX, Shi HB, Zhang T, Cui G. PRDM14 promotes the migration of human non-small cell lung cancer through extracellular matrix degradation in vitro. Chin Med J (Engl). 2015;128:373–377. | ||
Zhu JR, Liang L, Jiao Y, Liu LY. Enhanced invasion of metastatic cancer cells via extracellular matrix interface. Plos One. 2015;10:0118058. | ||
Webber J, Yeung V, Clayton A. Extracellular vesicles as modulators of the cancer microenvironment. Semin Cell Dev Biol. 2015;40:27–34. | ||
Rak J, Guha A. Extracellular vesicles – vehicles that spread cancer genes. Bioessays. 2012;34:489–497. | ||
Candelario KM, Steindler DA. The role of extracellular vesicles in the progression of neurodegenerative disease and cancer. Trends Mol Med. 2014;20:368–374. | ||
Fearon ER. Molecular genetics of colorectal cancer. Annu Rev Pathol. 2011;6:479–507. | ||
Yee DS, Tang YX, Li XS, et al. The Wnt inhibitory factor 1 restoration in prostate cancer cells was associated with reduced tumor growth, decreased capacity of cell migration and invasion and a reversal of epithelial to mesenchymal transition. Mol Cancer. 2010;9:162. | ||
Iyer S, Gaikwad RM, Subba-Rao V, Woodworth CD, Sokolov I. Atomic force microscopy detects differences in the surface brush of normal and cancerous cells. Nat Nanotechnol. 2009;4:389–393. | ||
Discher DE, Janmey P, Wang YL. Tissue cells feel and respond to the stiffness of their substrate. Science. 2005;310:1139–1143. | ||
Bercoff J, Chaffai S, Tanter M, et al. In vivo breast tumor detection using transient elastography. Ultrasound Med Biol. 2003;29:1387–1396. | ||
McKnight AL, Kugel JL, Rossman PJ, Manduca A, Hartmann LC, Ehman RL. MR elastography of breast cancer: preliminary results. AJR Am J Roentgenol. 2002;178:1411–1417. | ||
Shapiro IM, Cheng AW, Flytzanis NC, et al. An EMT-driven alternative splicing program occurs in human breast cancer and modulates cellular phenotype. PLoS Genet. 2011;7:e1002218. | ||
Wu YZ, McEwen GD, Harihar S, Baker SM, DeWald DB, Zhou AH. BRMS1 expression alters the ultrastructural, biomechanical and biochemical properties of MDA-MB-435 human breast carcinoma cells: an AFM and Raman microspectroscopy study. Cancer Lett. 2010;293:82–91. | ||
Antonyak MA, Li B, Boroughs LK, et al. Cancer cell-derived microvesicles induce transformation by transferring tissue transglutaminase and fibronectin to recipient cells. Proc Natl Acad Sci U S A. 2011;108: 4852–4857. | ||
Minn AJ, Kang YB, Serganova I, et al. Distinct organ-specific metastatic potential of individual breast cancer cells and primary tumors. J Clin Invest. 2005;115:44–55. | ||
Zhong J, Ma MJ, Zhou J, Wei DX, Yan ZG, He DN. Tip-induced micropatterning of silk fibroin protein using in situ solution atomic force microscopy. ACS Appl Mater Interfaces. 2013;5:737–746. | ||
Ma MJ, Zhong J, Li WY, et al. Comparison of four synthetic model peptides to understand the role of modular motifs in the self-assembly of silk fibroin. Soft Matter. 2013;9:11325–11333. | ||
Martines E, Zhong J, Muzard J, et al. Single-molecule force spectroscopy of the aplysia cell adhesion molecule reveals two homophilic bonds. Biophys J. 2012;103:649–657. | ||
Zhong J. From simple to complex: investigating the effects of lipid composition and phase on the membrane interactions of biomolecules using in situ atomic force microscopy. Integr Biol (Camb). 2011;3:632–644. | ||
Rettler E, Hoeppener S, Sigusch BW, Schubert US. Mapping the mechanical properties of biomaterials on different length scales: depth-sensing indentation and AFM based nanoindentation. J Mater Chem B Mater Biol Med. 2013;1:2789–2806. | ||
Plodinec M, Loparic M, Monnier CA, et al. The nanomechanical signature of breast cancer. Nat Nanotechnol. 2012;7:757–765. | ||
Baker EL, Lu J, Yu DH, Bonnecaze RT, Zaman MH. Cancer cell stiffness: integrated roles of three-dimensional matrix stiffness and transforming potential. Biophys J. 2010;99:2048–2057. | ||
Friedl P, Wolf K. Tumour-cell invasion and migration: diversity and escape mechanisms. Nat Rev Cancer. 2003;3:362–374. | ||
Deakin NO, Turner CE. Distinct roles for paxillin and Hic-5 in regulating breast cancer cell morphology, invasion, and metastasis. Mol Biol Cell. 2011;22:327–341. | ||
Lekka M, Pogoda K, Gostek J, et al. Cancer cell recognition – mechanical phenotype. Micron. 2012;43:1259–1266. | ||
Rebelo LM, de Sousa JS, Mendes J, Radmacher M. Comparison of the viscoelastic properties of cells from different kidney cancer phenotypes measured with atomic force microscopy. Nanotechnology. 2013;24:055122. | ||
Cohen M, Klein E, Geiger B, Addadi L. Organization and adhesive properties of the hyaluronan pericellular coat of chondrocytes and epithelial cells. Biophys J. 2003;85:1996–2005. | ||
Jones LM, Gardner MJ, Catterall JB, Turner GA. Hyaluronic acid secreted by mesothelial cells: a natural barrier to ovarian cancer cell adhesion. Clin Exp Metastasis. 1995;13:373–380. | ||
Li QS, Lee GY, Ong CN, Lim CT. AFM indentation study of breast cancer cells. Biochem Biophys Res Commun. 2008;374:609–613. | ||
Nikkhah M, Strobl JS, Schmelz EM, Agah M. Evaluation of the influence of growth medium composition on cell elasticity. J Biomech. 2011;44:762–766. | ||
Li QS, Lee GY, Ong CN, Lim CT. Probing the elasticity of breast cancer cells using AFM. IFMBE Proc. 2009;23:2122–2125. | ||
Coughlin MF, Bielenberg DR, Lenormand G, et al. Cytoskeletal stiffness, friction, and fluidity of cancer cell lines with different metastatic potential. Clin Exp Metastasis. 2013;30:237–250. | ||
Li QS, Lim CT. Structure-mechanical property changes in nucleus arising from breast cancer. In: Gefen A, editor. Cellular and Biomolecular Mechanics and Mechanobiology. Heidelberg: Springer; 2011:465–475. | ||
Wang JH, Yu M, Liu L, Zhao J, Liang YC, Dong S. Atomic force microscopy-based investigation on the elastic properties of oligodendrocytes. Mater Sci Forum. 2011;694:886–890. | ||
Prabhune M, Belge G, Dotzauer A, Bullerdiek J, Radmacher M. Comparison of mechanical properties of normal and malignant thyroid cells. Micron. 2012;43:1267–1272. | ||
Leporatti S, Vergara D, Zacheo A, et al. Cytomechanical and topological investigation of MCF-7 cells by scanning force microscopy. Nanotechnology. 2009;20:055103. | ||
Faria EC, Ma N, Gazi E, et al. Measurement of elastic properties of prostate cancer cells using AFM. Analyst. 2008;133:1498–1500. | ||
Lekka M, Gil D, Pogoda K, et al. Cancer cell detection in tissue sections using AFM. Arch Biochem Biophys. 2012;518:151–156. | ||
Cross SE, Jin YS, Rao J, Gimzewski JK. Nanomechanical analysis of cells from cancer patients. Nat Nanotechnol. 2007;2:780–783. | ||
Xu WW, Mezencev R, Kim B, Wang LJ, McDonald J, Sulchek T. Cell stiffness is a biomarker of the metastatic potential of ovarian cancer cells. Plos One. 2012;7:0046609. | ||
Rother J, Noding H, Mey I, Janshoff A. Atomic force microscopy-based microrheology reveals significant differences in the viscoelastic response between malign and benign cell lines. Open Biol. 2014;4:140046. | ||
Bastatas L, Martinez-Marin D, Matthews J, et al. AFM nano-mechanics and calcium dynamics of prostate cancer cells with distinct metastatic potential. Biochim Biophys Acta. 2012;1820:1111–1120. | ||
Cross SE, Jin YS, Tondre J, Wong R, Rao J, Gimzewski JK. AFM-based analysis of human metastatic cancer cells. Nanotechnology. 2008;19:384003. | ||
Pfreundschuh M, Martinez-Martin D, Mulvihill E, Wegmann S, Muller DJ. Multiparametric high-resolution imaging of native proteins by force-distance curve-based AFM. Nat Protoc. 2014;9:1113–1130. | ||
Sanchez-Adams J, Wilusz RE, Guilak F. Atomic force microscopy reveals regional variations in the micromechanical properties of the pericellular and extracellular matrices of the meniscus. J Orthop Res. 2013;31:1218–1225. | ||
Cerchiari AE, Garbe JC, Jee NY, et al. A strategy for tissue self-organization that is robust to cellular heterogeneity and plasticity. Proc Natl Acad Sci U S A. 2015;112:2287–2292. | ||
Schepeler T, Page ME, Jensen KB. Heterogeneity and plasticity of epidermal stem cells. Development. 2014;141:2559–2567. | ||
Han BG, Cho JW, Cho YD, et al. Expression, purification and biochemical characterization of the N-terminal regions of human TIG3 and HRASLS3 proteins. Protein Expr Purif. 2010;71:103–107. | ||
Sotiriou C, Pusztai L. Gene-expression signatures in breast cancer. N Engl J Med. 2009;360:790–800. | ||
Chen C, Peng J, Xia HS, et al. Quantum-dot-based immunofluorescent imaging of HER2 and ER provides new insights into breast cancer heterogeneity. Nanotechnology. 2010;21:095101. | ||
Fritz J, Katopodis AG, Kolbinger F, Anselmetti D. Force-mediated kinetics of single P-selectin ligand complexes observed by atomic force microscopy. Proc Natl Acad Sci U S A. 1998;95:12283–12288. | ||
Yaneva M, Kowalewski T, Lieber MR. Interaction of DNA-dependent protein kinase with DNA and with Ku: biochemical and atomic-force microscopy studies. EMBO J. 1997;16:5098–5112. | ||
Uchihashi T, Iino R, Ando T, Noji H. High-speed atomic force microscopy reveals rotary catalysis of rotorless F1-ATPase. Science. 2011;333:755–758. | ||
Billingsley DJ, Bonass WA, Crampton N, Kirkham J, Thomson NH. Single-molecule studies of DNA transcription using atomic force microscopy. Phys Biol. 2012;9:021001. | ||
Hansma HG, Golan R, Hsieh W, Lollo CP, Mullen-Ley P, Kwoh D. DNA condensation for gene therapy as monitored by atomic force microscopy. Nucleic Acids Res. 1998;26:2481–2487. | ||
Duvshani-Eshet M, Baruch L, Kesselman E, Shimoni E, Machluf M. Therapeutic ultrasound-mediated DNA to cell and nucleus: bioeffects revealed by confocal and atomic force microscopy. Gene Ther. 2006;13:163–172. | ||
Zhu R, Rupprecht A, Ebner A, et al. Mapping the nucleotide binding site of uncoupling protein 1 using atomic force microscopy. J Am Chem Soc. 2013;135:3640–3646. | ||
Kim J, Yoshimura SH, Hizume K, Ohniwa RL, Ishihama A, Takeyasu K. Fundamental structural units of the Escherichia coli nucleoid revealed by atomic force microscopy. Nucleic Acids Res. 2004;32:1982–1992. | ||
Vicidomini G, Moneron G, Han KY, et al. Sharper low-power STED nanoscopy by time gating. Nat Methods. 2011;8:571–573. | ||
Chacko JV, Harke B, Canale C, Diaspro A. Cellular level nanomanipulation using atomic force microscope aided with superresolution imaging. J Biomed Opt. 2014;19:105003. | ||
Chacko JV, Zanacchi FC, Harke B, Lanzano L, Canale C, Diaspro A. Insight into hybrid nanoscopy techniques: STED AFM & STORM AFM. Biophys J. 2014;106:396a. | ||
Chacko JV, Zanacchi FC, Diaspro A. Probing cytoskeletal structures by coupling optical superresolution and AFM techniques for a correlative approach. Cytoskeleton. 2013;70:729–740. | ||
Rathje LS, Nordgren N, Pettersson T, et al. Oncogenes induce a vimentin filament collapse mediated by HDAC6 that is linked to cell stiffness. Proc Natl Acad Sci U S A. 2014;111:1515–1520. | ||
Harke B, Chako JV, Haschke H, Canale C, Diaspro A. A novel nanoscopic tool by combining AFM with STED microscopy. Opt Nanoscopy. 2012;1:3. | ||
Efremov YM, Dzyubenko EV, Bagrov DV, Maksimov GV, Shram SI, Shaitan KV. Atomic force microscopy study of the arrangement and mechanical properties of astrocytic cytoskeleton in growth medium. Acta Naturae. 2011;3:93–99. | ||
Turner RD, Hurd AF, Cadby A, Hobbs JK, Foster SJ. Cell wall elongation mode in Gram-negative bacteria is determined by peptidoglycan architecture. Nat Commun. 2013;4:1496. | ||
Na S, Trache A, Trzeciakowski J, Sun Z, Meininger GA, Humphrey JD. Time-dependent changes in smooth muscle cell stiffness and focal adhesion area in response to cyclic equibiaxial stretch. Ann Biomed Eng. 2008;36:369–380. | ||
Humphrey JD. Vascular adaptation and mechanical homeostasis at tissue, cellular, and sub-cellular levels. Cell Biochem Biophys. 2008;50:53–78. | ||
Smits P, Lefebvre V. Sox5 and Sox6 are required for notochord extracellular matrix sheath formation, notochord cell survival and development of the nucleus pulposus of intervertebral discs. Development. 2003;130:1135–1148. | ||
Lu PF, Takai K, Weaver VM, Werb Z. Extracellular matrix degradation and remodeling in development and disease. Cold Spring Harb Perspect Biol. 2011;3:a005058. | ||
Wolf K, te Lindert M, Krause M, et al. Physical limits of cell migration: control by ECM space and nuclear deformation and tuning by proteolysis and traction force. J Cell Biol. 2013;201:1069–1084. | ||
Schlie-Wolter S, Ngezahayo A, Chichkov BN. The selective role of ECM components on cell adhesion, morphology, proliferation and communication in vitro. Exp Cell Res. 2013;319:1553–1561. | ||
Maruthamuthu V, Sabass B, Schwarz US, Gardel ML. Cell-ECM traction force modulates endogenous tension at cell-cell contacts. Proc Natl Acad Sci U S A. 2011;108:4708–4713. |
 © 2016 The Author(s). This work is published and licensed by Dove Medical Press Limited. The full terms of this license are available at https://www.dovepress.com/terms.php and incorporate the Creative Commons Attribution - Non Commercial (unported, v3.0) License.
By accessing the work you hereby accept the Terms. Non-commercial uses of the work are permitted without any further permission from Dove Medical Press Limited, provided the work is properly attributed. For permission for commercial use of this work, please see paragraphs 4.2 and 5 of our Terms.
© 2016 The Author(s). This work is published and licensed by Dove Medical Press Limited. The full terms of this license are available at https://www.dovepress.com/terms.php and incorporate the Creative Commons Attribution - Non Commercial (unported, v3.0) License.
By accessing the work you hereby accept the Terms. Non-commercial uses of the work are permitted without any further permission from Dove Medical Press Limited, provided the work is properly attributed. For permission for commercial use of this work, please see paragraphs 4.2 and 5 of our Terms.