")
Back to Journals » Journal of Hepatocellular Carcinoma » Volume 9
CTB-193M12.5 Promotes Hepatocellular Carcinoma Progression via Enhancing NSD1-Mediated WNT10B/Wnt/β-Catenin Signaling Activation
Authors Zhang S, Jiang M, Cao H, Xiong J, Xu J
Received 6 March 2022
Accepted for publication 26 May 2022
Published 7 June 2022 Volume 2022:9 Pages 553—569
DOI https://doi.org/10.2147/JHC.S365302
Checked for plagiarism Yes
Review by Single anonymous peer review
Peer reviewer comments 2
Editor who approved publication: Dr Manal Hassan
Shuhua Zhang,1 Mi Jiang,1 Huan Cao,1 Jun Xiong,1 Jianqun Xu2
1Department of Hepatobiliary Surgery of General Surgery, Union Hospital, Tongji Medical College, Huazhong University of Science and Technology, Wuhan, 430022, People’s Republic of China; 2Department of Respiratory Medicine, Wuhan Third Hospital, Tongren Hospital of Wuhan University, Wuhan, 430060, People’s Republic of China
Correspondence: Jianqun Xu, Department of Respiratory Medicine, Wuhan Third Hospital, Tongren Hospital of Wuhan University, Wuhan, 430060, People’s Republic of China, Email [email protected]
Background: Hepatocellular carcinoma (HCC) is the second lethal malignancy among all cancers. Many molecular alterations have been found in HCC. However, the interactions and modulatory mechanisms among these molecules in HCC are still unclear.
Methods: CTB-193M12.5 expression in tissues and cells were detected by quantitative polymerase chain reaction (qPCR). In vitro experiments were conducted to evaluate the function of CTB-193M12.5 in cell proliferation, apoptosis, migration and invasion. The interaction between CTB-193M12.5 and nuclear receptor binding SET domain-containing protein 1 (NSD1) was assessed by RNA–protein pull-down and RNA immunoprecipitation assays. The roles of CTB-193M12.5 on WNT10B and Wnt/β-catenin signaling was detected by chromatin immunoprecipitation assay, qPCR, Western blot, and dual luciferase reporter assay.
Results: We identified a novel prognosis-related long noncoding RNA (lncRNA) CTB-193M12.5 in HCC. CTB-193M12.5 was upregulated in HCC and its high expression was correlated with alpha fetoprotein, large tumor size, aggressive clinical characteristics, and poor survival. Functional experiments showed that CTB-193M12.5 enhanced HCC cellular proliferation, suppressed HCC cellular apoptosis, and promoted HCC cellular migration and invasion. CTB-193M12.5 knockdown exerted opposite effects in HCC. Mechanistic investigation demonstrated that CTB-193M12.5 was mainly distributed in nucleus. Histone methyltransferase NSD1 was identified as a CTB-193M12.5 interactor. CTB-193M12.5 bound and recruited NSD1 to the promoter of WNT10B, leading to an increase in di-methylation of histone H3 at lysine 36 (H3K36me2) and the reduction of tri-methylation of histone H3 at lysine 27 (H3K27me3) at WNT10B promoter. Therefore, CTB-193M12.5 epigenetically activated WNT10B transcription. Through upregulating WNT10B, CTB-193M12.5 further activated Wnt/β-catenin signaling. Functional rescue experiments demonstrated that overexpression of WNT10B reversed the tumor suppressive roles of CTB-193M12.5 knockdown, while Wnt/β-catenin signaling inhibitor ICG-001 abolished the oncogenic roles of CTB-193M12.5 overexpression.
Conclusion: CTB-193M12.5 was a highly expressed and poor prognosis-related lncRNA in HCC. CTB-193M12.5 functioned as an oncogenic lncRNA through promoting NSD1-mediated WNT10B/Wnt/β-catenin signaling activation.
Keywords: CTB-193M12.5, hepatocellular carcinoma, progression, histone methylation, Wnt/β-catenin signaling
Introduction
Liver cancer is the six most commonly diagnosed malignancy and the second leading cause of cancer-related death worldwide.1 Hepatocellular carcinoma (HCC) is the major histological subtype of liver cancer, which accounts for more than 90% of all liver cancers.2 Most HCC progress quickly and lead to median survival time of only 6–9 months for untreated patients.3 However, most HCC are insensitive to chemotherapy and targeted therapy, compared with other common cancers, such as lung cancer, breast cancer, and colorectal cancer.4–6 Therefore, the prognosis of HCC is very poor with a 5-year survival of only about 18% for unresectable HCC.7 Further, identifying the critical molecules driving HCC progression and designing novel targeted therapy are of clinical importance.
Recent genome and transcriptome sequencings have found that more than 90% of human genome transcribes RNAs, and while protein-coding genes only account for less than 2% of human genome.8 Therefore, most of the transcribed RNAs are non-coding RNAs.9,10 Among these non-coding RNAs, long non-coding RNAs (lncRNAs) represent a class of regulatory RNAs with important roles in gene expression regulation.11–14 lncRNAs have more than 200 nucleotides in length and lack protein coding potential. Increasing evidences have shown that through controlling gene expression, lncRNAs participate in almost every aspect of pathophysiological activities.15–18 In cancers, lncRNAs may regulate cellular proliferation, cell cycle, stemness, apoptosis, senescence, motility, and tumoral growth and metastasis.19–23 Thus, several lncRNAs show oncogenic or tumor suppressive roles in a variety of cancers.24–26 Furthermore, aberrant expressions of lncRNAs were also found in many diseases, including malignancies.27–29 Some of these aberrantly expressed lncRNAs were documented to be correlated with patients’ prognosis, which may be used as prognostic biomarkers for cancers.30
As regulatory noncoding RNAs, lncRNAs control gene expression at multiple levels, including transcription, post-transcriptional processing, translation, post-translational modification, etc. Several nuclear lncRNAs bind chromatin modifiers, change the genomic binding of chromatin modifiers, leading to change in chromatin modifications and further activation or repression of genes transcription.30,31 Some nuclear lncRNAs bind primary transcripts and further modulate their processing.32 Some cytoplasmic lncRNAs bind mature mRNAs, and further regulate their stabilities and/or translation.33 Some cytoplasmic lncRNAs were reported to bind microRNAs, relieve their repressive roles on microRNAs’ targets, leading to the upregulation of targets.34–36 Other cytoplasmic lncRNAs were revealed to bind proteins and modulate the expressions and/or functions of the interacted proteins.37,38 Given that more than 58,000 lncRNAs have been identified in human cells,8 the potential roles and regulatory mechanisms of other lncRNAs in HCC need further investigations.
In this study, we identified a novel HCC prognosis-related lncRNA CTB-193M12.5 via analyzing The Cancer Genome Atlas (TCGA) Liver hepatocellular carcinoma (LIHC) dataset. CTB-193M12.5 has 882 nucleotides in length and no protein coding potential, verified by Coding Potential Assessment Tool (CPAT) (http://lilab.research.bcm.edu/) and Coding Potential Calculator (CPC) (http://cpc2.gao-lab.org/).39,40 CTB-193M12.5 coding gene has the ensembl ID of ENSG00000280206.1, which is located at chromosome 16p13.11. We further explored the expression pattern, clinical significances, biological functions, and mechanisms of action of CTB-193M12.5 in HCC.
Materials and Methods
Patients and Tissue Samples
The study was approved by the Ethic Committee of Union Hospital, Tongji Medical College, Huazhong University of Science and Technology (Wuhan, China) and conducted following the ethical principles for medical research involving human subjects of the Helsinki Declaration. Eighty-eight pairs of HCC tissues and matched noncancerous liver tissues were acquired from HCC patients with written informed consents who received surgical resection at Union Hospital, Tongji Medical College, Huazhong University of Science and Technology (Wuhan, China). These tissue samples were confirmed by pathological diagnoses and stored at −80°C until use.
Cell Culture and Stable Cell Lines Construction
Human immortalized liver cell line THLE-3 and HCC cell lines SK-HEP-1 and SNU-398 were acquired from American Type Culture Collection (ATCC, Manassas, VA, USA). Human HCC cell line HuH-7 was acquired from Chinese Academy of Science Cell Bank (Shanghai, China). THLE-3 was maintained with BEGM Bullet Kit (Lonza, Walkersville, MD, USA) following the provided manual. SK-HEP-1, SNU-398, and HuH-7 were maintained in Eagle’s minimum essential medium (Invitrogen, Carlsbad, CA, USA), RPMI 1640 medium (Invitrogen), and Dulbecco’s modified Eagle’s medium (Invitrogen), respectively. All cells were cultured in the above described medium added with 10% fetal bovine serum (FBS, Invitrogen) at 37°C in an incubator with 5% CO2. To construct HCC cells with CTB-193M12.5 stable overexpression, SK-HEP-1 and SNU-398 cells were infected with CTB-193M12.5 overexpression lentivirus (GenePharma, Shanghai, China), followed by treatment with 2μg/mL puromycin to select CTB-193M12.5 stably overexpressed cells. To construct HCC cells with CTB-193M12.5 stable knockdown, SNU-398 and HuH-7 cells were infected with two independent CTB-193M12.5-specific shRNA lentiviruses (GenePharma), followed by treatment with 2μg/mL puromycin to select CTB-193M12.5 stably silenced cells. Scrambled non-targeting shRNA lentivirus was used as negative control. The shRNA sequences were as follows: 5’-GATCCGGTCAAAGAGGCTTTGTATGTTTCAAGAGAACATACAAAGCCTCTTTGACCTTTTTTG-3’ (sense) and 5’-AATTCAAAAAAGGTCAAAGAGGCTTTGTATGTTCTCTTGAAACATACAAAGCCTCTTTGACCG-3’ (antisense) for shRNA-CTB-193M12.5–1; 5’-GATCCGGACTTCATTCAAAGGCATAATTCAAGAGATTATGCCTTTGAATGAAGTCCTTTTTTG-3’ (sense) and 5’-AATTCAAAAAAGGACTTCATTCAAAGGCATAATCTCTTGAATTATGCCTTTGAATGAAGTCCG-3’ (antisense) for shRNA-CTB-193M12.5–2; 5’-GATCCGTTCTCCGAACGTGTCACGTTTCAAGAGAACGTGACACGTTCGGAGAACTTTTTTG-3’ (sense) and 5’-AATTCAAAAAAGTTCTCCGAACGTGTCACGTTCTCTTGAAACGTGACACGTTCGGAGAACG-3’ (antisense) for shRNA-control. To obtain HCC cells with both CTB-193M12.5 knockdown and WNT10B overexpression, WNT10B overexpression plasmid (iGene Biotechnology, Guangzhou, China) was transfected into SNU-398 cells with CTB-193M12.5 stable knockdown. Forty-eight hours after transfection, the cells were treated with 2μg/mL puromycin and 1000μg/mL neomycin to select SNU-398 cells with CTB-193M12.5 knockdown and concurrent WNT10B overexpression.
RNA Extraction and Quantitative Polymerase Chain Reaction (qPCR)
Total RNA was extracted from indicated tissues and cells using Trizol reagent (Invitrogen). After quantification by NanoDrop 2000 Spectrophotometer (Thermo Scientific, Waltham, MA, USA), the RNA was subjected to reverse transcription (RT) to generate the first strand cDNA using the PrimeScript II 1st Strand cDNA Synthesis Kit (Takara, Dalian, China). Quantitative polymerase chain reaction (qPCR) was conducted using the TB Green Premix Ex Taq II (Takara) on StepOnePlus Real-Time PCR System (Thermo Scientific) with the primers 5’-GTGTCCACTCATCACTGC-3’ (sense) and 5’-GGTAAGAAACCCACCATCG-3’ (antisense) for CTB-193M12.5, 5’-GAAGGTGAAGGTCGGAGTC-3’ (sense) and 5’-GAAGATGGTGATGGGATTTC-3’ (antisense) for GAPDH, 5’-GGAGCAGAAAACAGCAGG-3’ (sense) and 5’-GGAAGGGGTCAGGAGAAA-3’ (antisense) for MALAT1, 5’-GGAATGGGGTGGCTGTAAC-3’ (sense) and 5’-CGGTTGTGGGTATCAATGAAG-3’ (antisense) for WNT10B, 5’-CTTCCCCTACCCTCTCAA-3’ (sense) and 5’-CGATTTCTTCCTCATCTTCT-3’ (antisense) for Myc, 5’-ACAACTTCCTGTCCTACTACC-3’ (sense) and 5’-TCCTCTTCCTCCTCCTCG-3’ (antisense) for Cyclin D1. GAPDH was employed as internal control.
Western Blot
Total protein was extracted from indicated cells using radioimmunoprecipitation assay (RIPA) lysis buffer (Beyotime Biotechnology, Shanghai, China). Nuclear protein was extracted from indicated cells using the Nuclear and Cytoplasmic Protein Extraction Kit (Beyotime Biotechnology). After quantification using the Enhanced BCA Protein Assay Kit (Beyotime Biotechnology), protein was separated by 7.5% or 10% sodium dodecyl sulfate-polyacrylamide gel electrophoresis, followed by being transferred onto a polyvinylidene fluoride membrane (Millipore, Burlington, MA, USA). After blocking, the membranes were incubated with primary antibodies against NSD1 (H00064324-M08, 1:500, Novus Biologicals, Centennial, CO, USA), WNT10B (ab70816, 1:1000, Abcam, Cambridge, MA, USA), GAPDH (60,004-1-Ig, 1:10,000, Proteintech, Chicago, IN, USA), β-catenin (#8480, 1:1000, Cell Signaling Technology, Danvers, MA, USA), or histone H3 (AF0863, 1:1000, Affinity, Changzhou, Jiangsu, China) at 4°C overnight. After three washes, the membranes were further incubated with IRDye 680RD Goat anti-Mouse IgG Secondary Antibody (926–68,070, 1:10,000, Li-Cor Biosciences, Lincoln, NE, USA) or IRDye 800CW Goat anti-Rabbit IgG Secondary Antibody (926–32,211, 1:10,000, Li-Cor). Lastly, the membranes were scanned with the Odyssey infrared scanner (Li-Cor). GAPDH and histone H3 were employed as loading controls for total protein and nuclear protein, respectively.
Cellular Proliferation Assays
5-Ethynyl-2’-deoxyuridine (EdU) incorporation assay and cell counting kit-8 (CCK-8) assay were carried out to assess cellular proliferation ability. EdU incorporation assay was conducted using the Cell-Light EdU Apollo 567 In Vitro Kit (RiboBio, Guangzhou, China) as previously described.41 For CCK-8 assay, 5000 indicated cells were plated into 96-well plate. After culture for 72h, cellular proliferation ability was assessed with the CCK-8 reagent (Dojindo Laboratories, Kumamoto, Japan). The optical density value at 450nm was recorded to indicate cellular proliferation.
Cellular Apoptosis Assays
Terminal deoxynucleotidyl transferase-mediated dUTP nick end labelling (TUNEL) assay and caspase-3 activity assay were carried out to assess cellular apoptosis. TUNEL assay was conducted using the One-Step TUNEL Apoptosis Assay Kit (Beyotime Biotechnology) following the provided manual. Caspase-3 activity assay was conducted with the Caspase-3 Activity Assay Kit (Cell Signaling Technology) in accordance with the manufacturer’s manual.
Cellular Migration and Invasion Assays
Transwell migration assay was carried out to assess cellular migration. Transwell invasion assay was carried out to assess cellular invasion. The detailed method was described in our previous report.42 Indicated cells re-suspended in FBS-free medium were seeded into transwell chambers (pore size: 8 μm; Corning, NY, USA) coated with or without matrigel. Medium containing 20% FBS were added to the lower chamber. After culture for 24h, the cells in the upper chamber were removed. The cells on the outer layer of the membranes were fixed, stained, photographed, and counted.
Subcellular Fractionation
Cytoplasmic and nuclear RNA was extracted with the PARIS Kit (Thermo Scientific) following the manufacturer’s manual. The extracted RNA was detected using RT-qPCR as described above.
RNA–Protein Pull-Down Assay
CTB-193M12.5 full-length sequences were PCR-amplified with the primers 5’-GGGGTACCAAAAAAAAAAAAAAAGGTGTC-3’ (sense) and 5’-CCCAAGCTTGTGACCAGATGCTAATATG-3’ (antisense). The products were subcloned into the Kpn I and Hind III sites of pSPT19 vector (Roche, Basel, Switzerland) to construct CTB-193M12.5 in vitro transcription vector. This vector was used as a template to perform CTB-193M12.5 in vitro transcription with Sp6 RNA polymerase (Roche). After purification, CTB-193M12.5 RNA was end-labeled with desthiobiotin using the Pierce RNA 3’ End Desthiobiotinylation Kit (Thermo Scientific). RNA–protein pull-down reactions were performed using desthiobiotinylated RNAs and the Pierce Magnetic RNA–Protein Pull-Down Kit (Thermo Scientific) in accordance with the manufacturer’s protocol. The enriched proteins were measured using Western blot as described above.
RNA Immunoprecipitation (RIP) Assay
RIP assay was carried out with the Magna RIP RNA-Binding Protein Immunoprecipitation Kit (Millipore) and an antibody against NSD1 (H00064324-M08, 5 µg per reaction, Novus Biologicals) following the provided protocols. The enriched RNA was measured by RT-qPCR as described above.
Chromatin Immunoprecipitation (ChIP) Assay
ChIP assay was performed with the ChIP Kit (ab500, Abcam) and antibodies against NSD1 (H00064324-M08, 2 µg, Novus Biologicals), H3K36me2 (ab176921, 2 µg, Abcam), or H3K27me3 (ab192985, 2 µg, Abcam) in accordance with the instructions. The enriched DNA was measured by qPCR as described above using the primers 5’-GTCTGGCTCCATCCTCATCT-3’ (sense) and 5’-CTCTCTCACACACCCTCTCC-3’ (antisense) for WNT10B promoter.
Dual Luciferase Reporter Assay
Wnt/β-catenin reporter TOPflash (Addgene, Watertown, MA, USA) and pRL-TK (Promega, Madison, WI, USA) were co-transfected into indicated cells by Lipofectamine 3000 (Invitrogen). TOPflash expresses Firefly luciferase and while pRL-TK expresses Renilla luciferase. Forty-eight hours after co-transfection, the luciferase activities were measured using the Dual-Luciferase Reporter Assay System (Promega) following the manufacturer’s protocol. Renilla luciferase activity was used as control.
Statistical Analysis
Statistical analyses were performed with the GraphPad Prism v6.0 (San Diego, CA, USA). As presented in figures and table legends, Wilcoxon matched-pairs signed rank test, Log rank test (Kaplan–Meier survival analysis), one-way ANOVA followed by Dunnett’s multiple comparison test, two-tailed unpaired t test, Spearman correlation analysis, and Pearson chi-square test were conducted. p < 0.05 was considered as statistically significant.
Results
CTB-193M12.5 Was Upregulated in HCC and Predicted Poor Survival
The online in silico tool GEPIA (http://gepia.cancer-pku.cn/index.html) was employed to assess the expression pattern of CTB-193M12.5 in HCC based on The Cancer Genome Atlas (TCGA) Liver hepatocellular carcinoma (LIHC) dataset,43 which presented that the expression level of CTB-193M12.5 was significantly higher in HCC tissues than that in normal liver tissues (Figure 1A). TCGA LIHC dataset further presented that higher CTB-193M12.5 expression was associated with worse overall survival of HCC patients (Figure 1B), analyzed by GEPIA (http://gepia.cancer-pku.cn/index.html).43 To further assess the expression and clinical significance of CTB-193M12.5 in HCC, we measured CTB-193M12.5 expression in 88 pairs of HCC tissues and adjacent noncancerous liver tissues collected in our hospital, which presented that CTB-193M12.5 was also significantly upregulated in HCC tissues compared with that in liver tissues (Figure 1C). Kaplan–Meier curve presented that consistent with TCGA LIHC dataset, higher CTB-193M12.5 expression also predicted worse overall survival in our HCC cohort (Figure 1D). Cox proportional hazards regression analysis further revealed that high CTB-193M12.5 expression was an independent prognostic factor for worse overall survival (Supplementary Table 1). The relationship between CTB-193M12.5 expression and clinicopathological characteristics was further assessed, which presented that high CTB-193M12.5 expression was correlated with high alpha fetoprotein (AFP) concentration, large tumor size, encapsulation incomplete, vascular invasion, and advanced clinical stage (Table 1). CTB-193M12.5 expression in immortalized liver cell line THLE-3 and HCC cell lines SK-HEP-1, SNU-398, and HuH-7 were further measured using RT-qPCR, which presented that CTB-193M12.5 was also significantly upregulated in HCC cell lines compared with that in immortalized liver cell line (Figure 1E). Collectively, these results demonstrated that CTB-193M12.5 was upregulated in HCC, and its high expression was correlated with AFP, large tumor size, aggressive clinical characteristics, and poor survival.
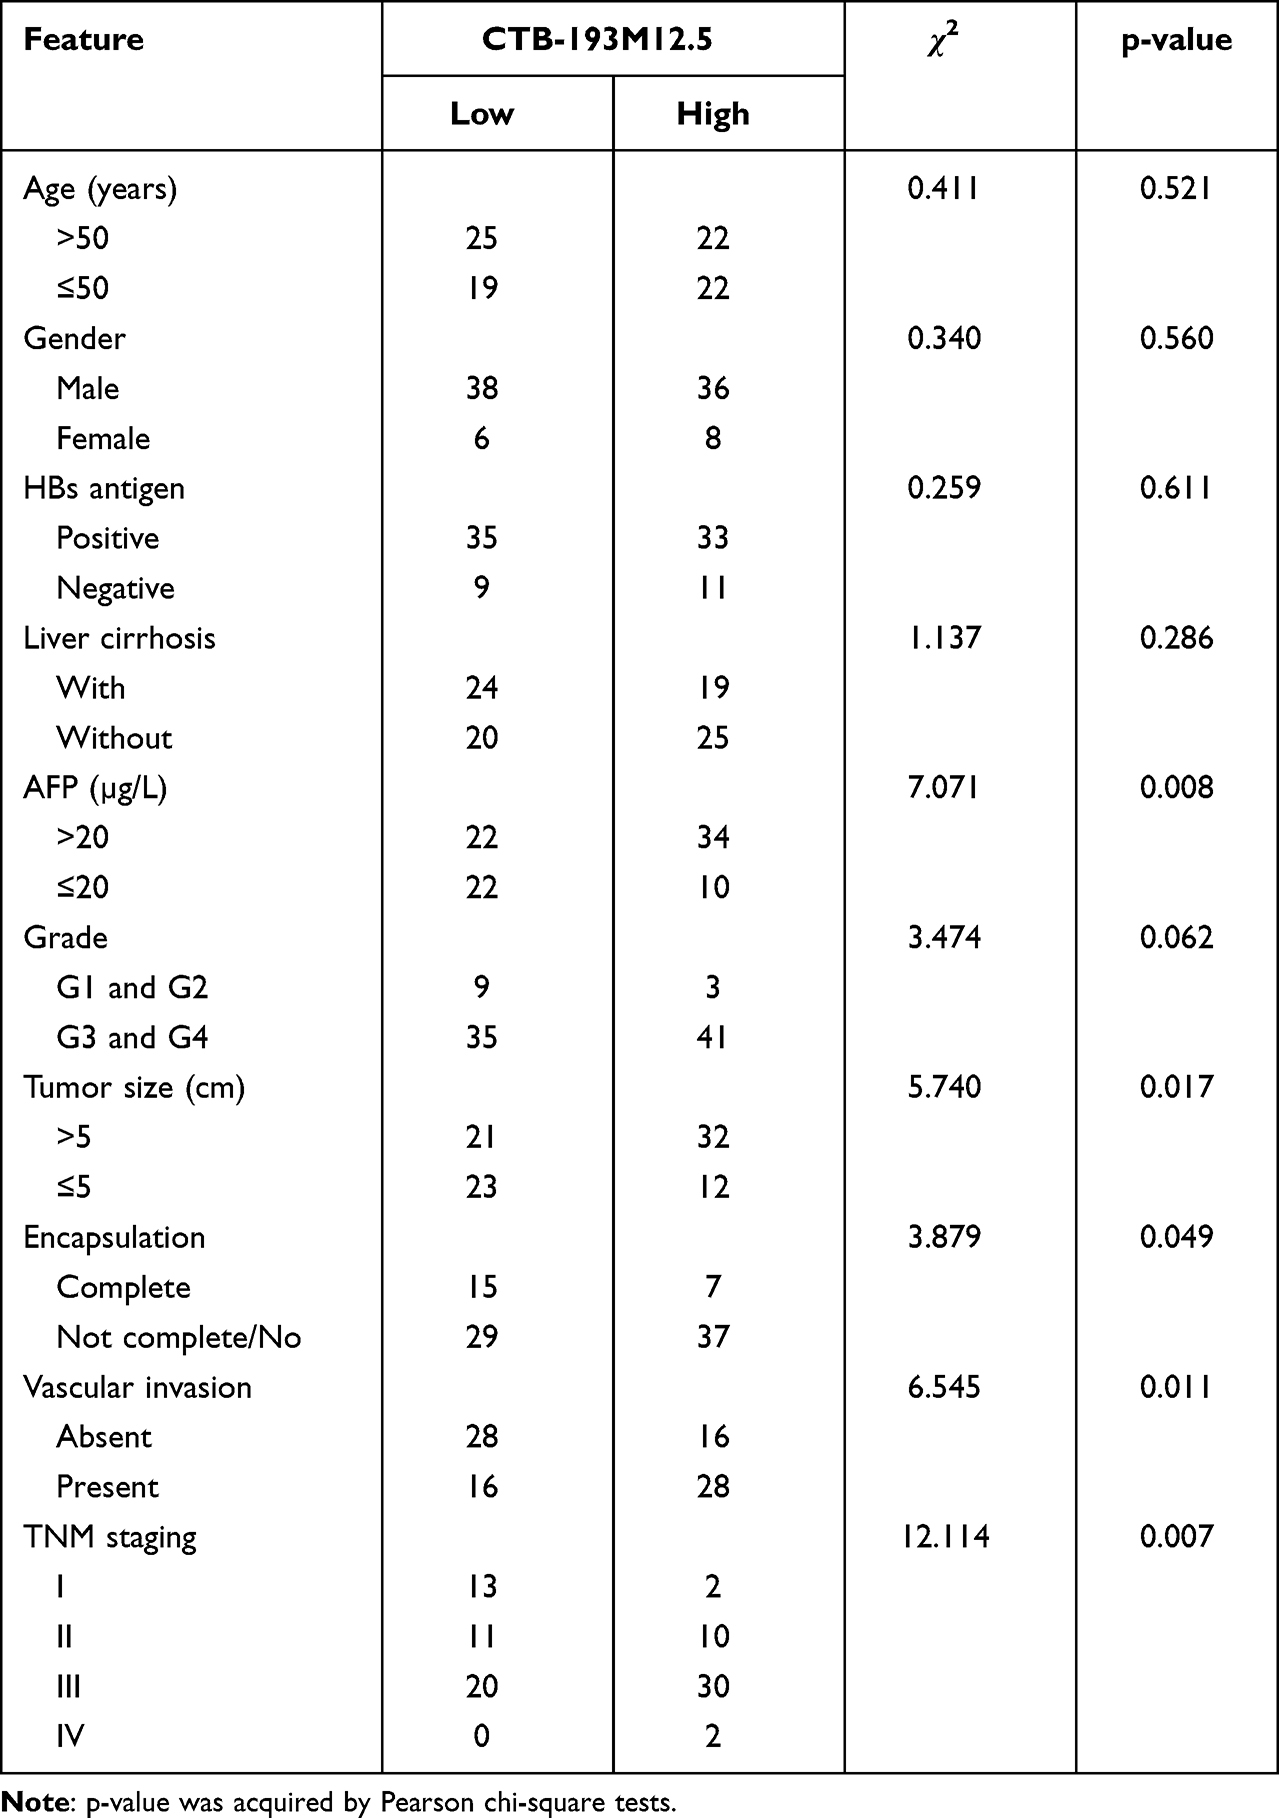 |
Table 1 Correlation Between CTB-193M12.5 Expression Levels and Clinicopathological Characteristics of 88 HCC Patients |
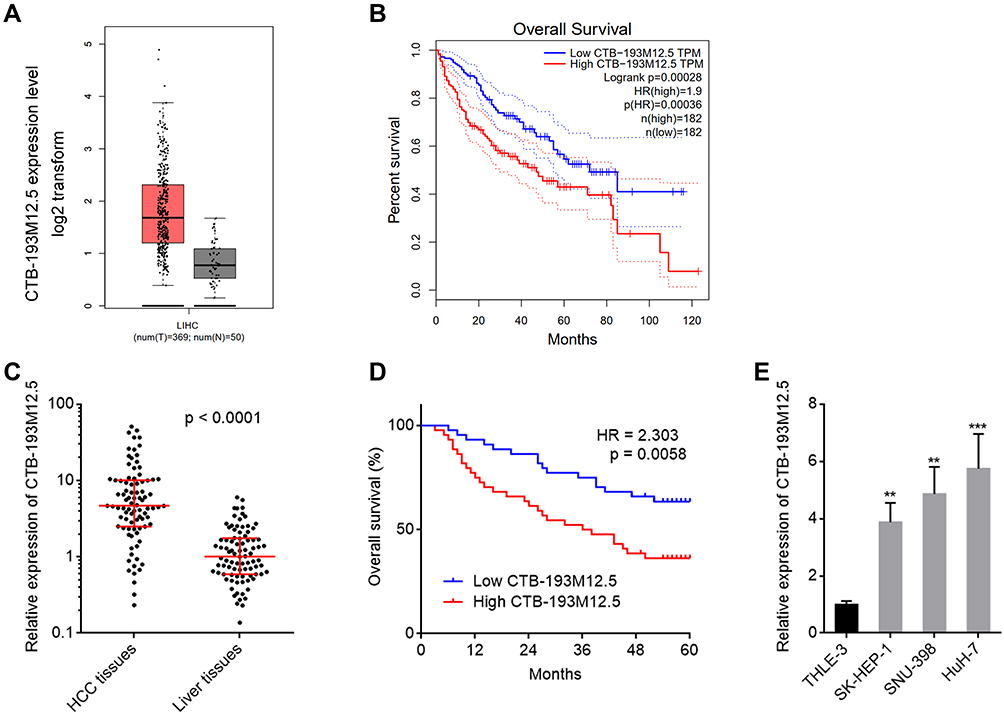 |
Figure 1 The expression and prognostic relevance of CTB-193M12.5 in HCC. (A) CTB-193M12.5 expression in HCC tissues and normal liver tissues based on TCGA LIHC dataset, analyzed by GEPIA. (B) The correlation between CTB-193M12.5 expression and overall survival of HCC patients based on TCGA LIHC dataset, analyzed by GEPIA. (C) CTB-193M12.5 expression in 88 pairs of HCC tissues and adjacent noncancerous liver tissues was measured by RT-qPCR. p < 0.0001 by Wilcoxon matched-pairs signed rank test. (D) Kaplan–Meier curve of 88 HCC patients stratified by CTB-193M12.5 expression (median CTB-193M12.5 expression was used as cut-off). HR = 2.303, p = 0.0058 by Log rank test. (E) CTB-193M12.5 expression in immortalized liver cell line THLE-3 and HCC cell lines SK-HEP-1, SNU-398, and HuH-7 was measured by RT-qPCR. Results are shown as mean ± SD based on three independent experiments. **p < 0.01, ***p < 0.001 by one-way ANOVA followed by Dunnett’s multiple comparisons test. |
CTB-193M12.5 Enhanced HCC Cellular Proliferation, Migration, and Invasion, and Suppressed HCC Cellular Apoptosis
To explore whether increased expression of CTB-193M12.5 participates in HCC progression, we next assessed the potential functions of CTB-193M12.5 in HCC. CTB-193M12.5 was stably overexpressed in SK-HEP-1 and SNU-398 cells through infection of CTB-193M12.5 overexpression lentivirus (Figure 2A). EdU incorporation and CCK-8 assays presented that overexpression of CTB-193M12.5 enhanced HCC cellular proliferation ability (Figure 2B and C). TUNEL and caspase-3 activity assays presented that overexpression of CTB-193M12.5 suppressed HCC cellular apoptosis (Figure 2D and E). Transwell migration assay presented that overexpression of CTB-193M12.5 enhanced HCC cellular migration ability (Figure 2F). Transwell invasion assay presented that overexpression of CTB-193M12.5 enhanced HCC cellular invasion ability (Figure 2G). Collectively, these results demonstrated that CTB-193M12.5 enhanced HCC cellular proliferation, migration, and invasion, and suppressed HCC cellular apoptosis.
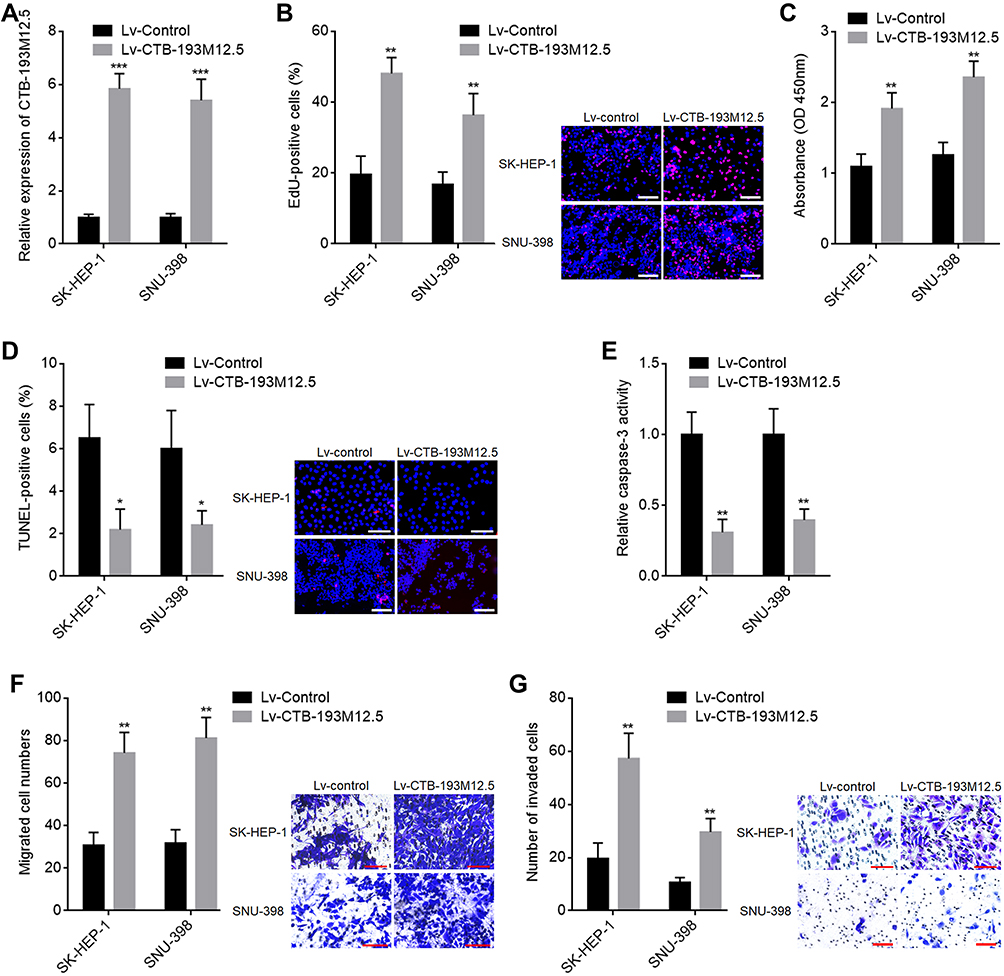 |
Figure 2 The functions of CTB-193M12.5 in HCC cellular proliferation, apoptosis, migration, and invasion. (A) CTB-193M12.5 expression in SK-HEP-1 and SNU-398 cells with CTB-193M12.5 stable overexpression or control was measured by RT-qPCR. (B) Cellular proliferation of SK-HEP-1 and SNU-398 cells with CTB-193M12.5 stable overexpression or control was assessed by EdU incorporation assays. Red color indicates EdU-positive and proliferative cells. Scale bars = 100 µm. (C) Cellular proliferation of SK-HEP-1 and SNU-398 cells with CTB-193M12.5 stable overexpression or control was assessed by CCK-8 assays. (D) Cellular apoptosis of SK-HEP-1 and SNU-398 cells with CTB-193M12.5 stable overexpression or control was assessed by TUNEL assays. Red color indicates TUNEL-positive and apoptotic cells. Scale bars = 100 µm. (E) Cellular apoptosis of SK-HEP-1 and SNU-398 cells with CTB-193M12.5 stable overexpression or control was assessed by caspase-3 activity assay. (F) Cellular migration of SK-HEP-1 and SNU-398 cells with CTB-193M12.5 stable overexpression or control was assessed by transwell migration assay. Scale bars = 100 µm. (G) Cellular invasion of SK-HEP-1 and SNU-398 cells with CTB-193M12.5 stable overexpression or control was assessed by transwell invasion assay. Scale bars = 100 µm. Results are shown as mean ± SD based on three independent experiments. *p < 0.05, **p < 0.01, ***p < 0.001 by two-tailed unpaired t test. |
Knockdown of CTB-193M12.5 Suppressed HCC Cellular Proliferation, Migration, and Invasion, and Promoted HCC Cellular Apoptosis
To further assess the functions of CTB-193M12.5 in HCC, CTB-193M12.5 was stably silenced in SNU-398 and HuH-7 cells through infection of CTB-193M12.5 knockdown lentiviruses (Figure 3A). EdU incorporation and CCK-8 assays presented that knockdown of CTB-193M12.5 suppressed HCC cellular proliferation ability (Figure 3B and C). TUNEL and caspase-3 activity assays presented that knockdown of CTB-193M12.5 promoted HCC cellular apoptosis (Figure 3D and E). Transwell migration assay presented that knockdown of CTB-193M12.5 suppressed HCC cellular migration ability (Figure 3F). Transwell invasion assay presented that knockdown of CTB-193M12.5 suppressed HCC cellular invasion ability (Figure 3G). Collectively, these results demonstrated that knockdown of CTB-193M12.5 suppressed HCC cellular proliferation, migration, and invasion, and promoted HCC cellular apoptosis.
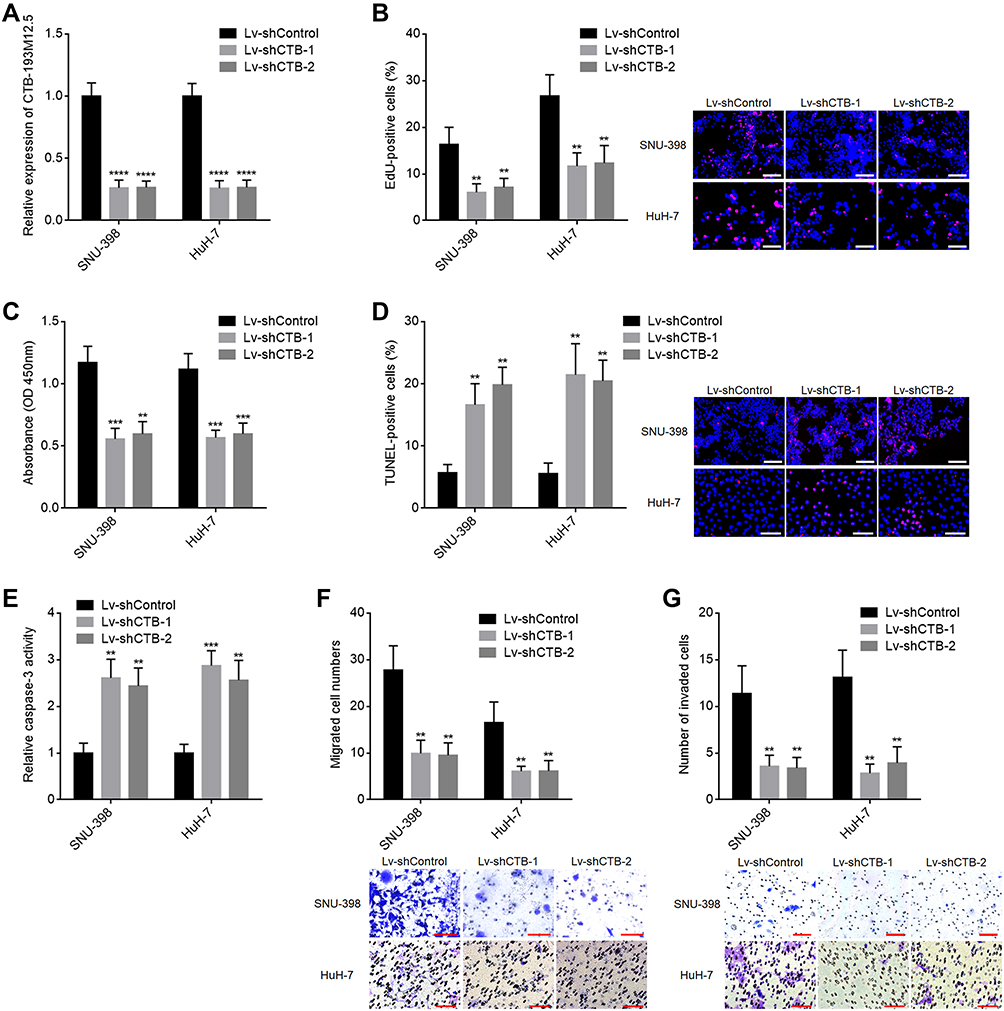 |
Figure 3 The functions of CTB-193M12.5 knockdown in HCC cellular proliferation, apoptosis, migration, and invasion. (A) CTB-193M12.5 expression in SNU-398 and HuH-7 cells with CTB-193M12.5 stable knockdown or control was measured by RT-qPCR. (B) Cellular proliferation of SNU-398 and HuH-7 cells with CTB-193M12.5 stable knockdown or control was assessed by EdU incorporation assays. Red color indicates EdU-positive and proliferative cells. Scale bars = 100 µm. (C) Cellular proliferation of SNU-398 and HuH-7 cells with CTB-193M12.5 stable knockdown or control was assessed by CCK-8 assays. (D) Cellular apoptosis of SNU-398 and HuH-7 cells with CTB-193M12.5 stable knockdown or control was assessed by TUNEL assays. Red color indicates TUNEL-positive and apoptotic cells. Scale bars = 100 µm. (E) Cellular apoptosis of SNU-398 and HuH-7 cells with CTB-193M12.5 stable knockdown or control was assessed by caspase-3 activity assay. (F) Cellular migration of SNU-398 and HuH-7 cells with CTB-193M12.5 stable knockdown or control was assessed by transwell migration assay. Scale bars = 100 µm. (G) Cellular invasion of SNU-398 and HuH-7 cells with CTB-193M12.5 stable knockdown or control was assessed by transwell invasion assay. Scale bars = 100 µm. Results are shown as mean ± SD based on three independent experiments. **p < 0.01, ***p < 0.001, ****p < 0.0001 by one-way ANOVA followed by Dunnett’s multiple comparisons test. |
CTB-193M12.5 Bound and Recruited NSD1 to the Promoter of WNT10B
To explore the potential mechanisms of CTB-193M12.5 mediating its oncogenic roles in HCC, we first assessed its subcellular location using cytoplasmic and nuclear RNA purification, followed by RT-qPCR, which presented that CTB-193M12.5 was mainly distributed in nucleus (Figure 4A). One of the critical mechanisms of nuclear lncRNAs is to bind epigenetic modifiers and modulate genes transcription.30 Intriguingly, the online in silico tool RNA–Protein Interaction Prediction (RPISeq) (http://pridb.gdcb.iastate.edu/RPISeq/) also predicted an interaction between CTB-193M12.5 and NSD1 with a score of 0.99. NSD1 (nuclear receptor binding SET domain protein 1), known as KMT3B (lysine N-methyltransferase 3B), catalyzes di-methylation of histone H3 at lysine 36 (H3K36me2).44 RNA–protein pull-down assays presented the specific enrichment of NSD1 protein in the CTB-193M12.5 group (Figure 4B). RIP assays further presented the specific enrichment of CTB-193M12.5 in the NSD1 antibody group (Figure 4C). Both the RNA–protein pull-down and RIP assays confirmed the interaction between CTB-193M12.5 and NSD1. Our previous study has found that NSD1 activated WNT10B transcription via increasing H3K36me2 and decreasing tri-methylation of histone H3 at lysine 27 (H3K27me3) at WNT10B promoter.42 Therefore, we further explored the potential influences of CTB-193M12.5 on histone modification of WNT10B promoter through binding NSD1. ChIP assays were undertaken in SNU-398 cells with CTB-193M12.5 overexpression or knockdown, which presented that overexpression of CTB-193M12.5 promoted the binding of NSD1 to WNT10B promoter (Figure 4D), and while knockdown of CTB-193M12.5 suppressed the binding of NSD1 to WNT10B promoter (Figure 4E), which indicated that CTB-193M12.5 recruited NSD1 to WNT10B promoter. ChIP assays further presented that overexpression of CTB-193M12.5 increased H3K36me2 and reduced H3K27me3 at WNT10B promoter (Figure 4F), and while knockdown of CTB-193M12.5 decreased H3K36me2 and increased H3K27me3 at WNT10B promoter (Figure 4G), which were consistent with the effects of CTB-193M12.5 on NSD1. Collectively, these results demonstrated that CTB-193M12.5 bound and recruited NSD1 to WNT10B promoter, increased H3K36me2 and reduced H3K27me3 at WNT10B promoter.
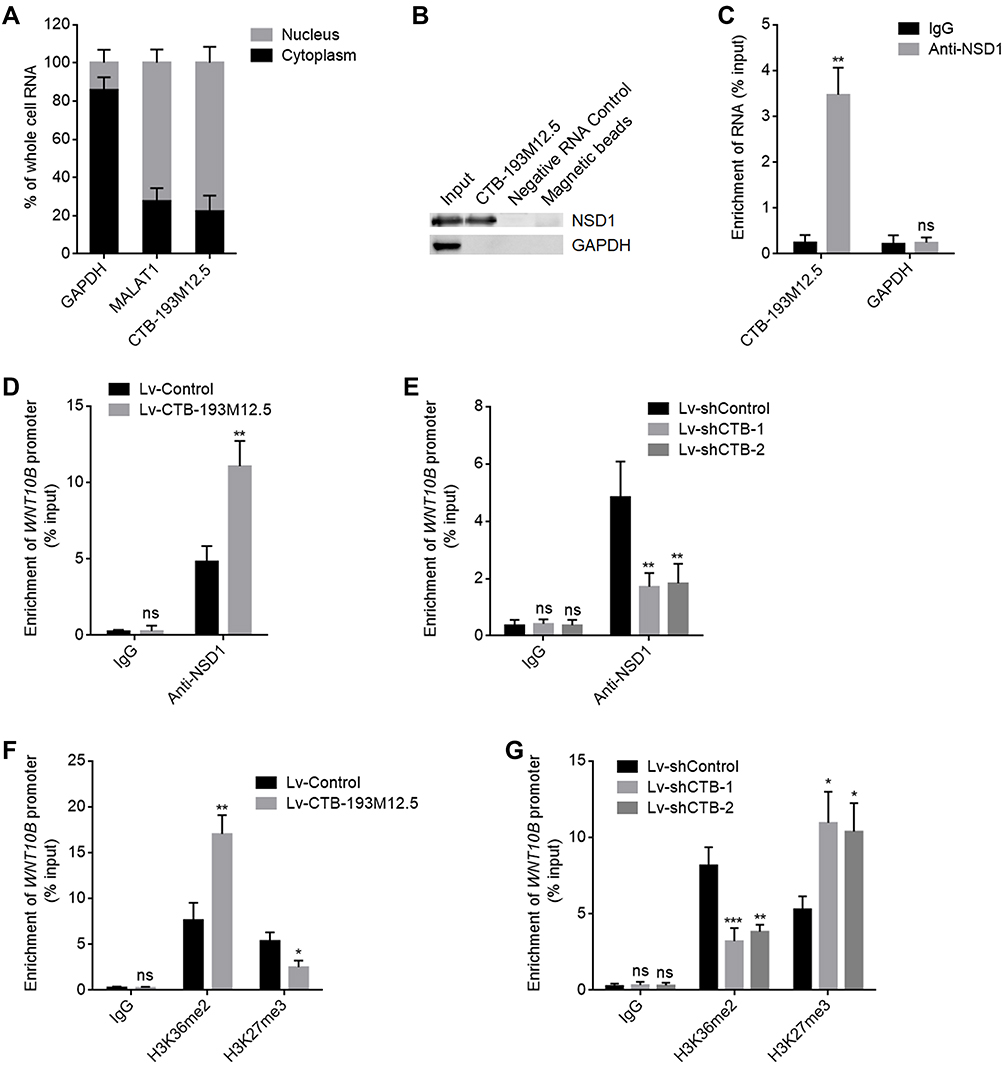 |
Figure 4 CTB-193M12.5 bound and recruited NSD1 to WNT10B promoter. (A) Subcellular distribution of CTB-193M12.5 in SNU-398 cells was assessed by cytoplasmic and nuclear RNA purification, followed by RT-qPCR. (B) RNA–protein pull-down assay were performed in SNU-398 cells using RNA end-labeled with desthiobiotin. Enrichment of protein was measured by Western blot. (C) RIP assays were performed in SNU-398 cells using NSD1-specific antibody or non-specific IgG. Enrichment of RNA was measured by RT-qPCR. (D) ChIP assays were performed in SNU-398 cells with CTB-193M12.5 overexpression or control using NSD1-specific antibody or non-specific IgG. Enrichment of WNT10B promoter was measured by qPCR. (E) ChIP assays were performed in SNU-398 cells with CTB-193M12.5 knockdown or control using NSD1-specific antibody or non-specific IgG. Enrichment of WNT10B promoter was measured by qPCR. (F) ChIP assays were performed in SNU-398 cells with CTB-193M12.5 overexpression or control using H3K36me2, H3K27me3-specific antibodies or non-specific IgG. Enrichment of WNT10B promoter was measured by qPCR. (G) ChIP assays were performed in SNU-398 cells with CTB-193M12.5 knockdown or control using H3K36me2, H3K27me3-specific antibodies or non-specific IgG. Enrichment of WNT10B promoter was measured by qPCR. Results are shown as mean ± SD based on three independent experiments. *p < 0.05, **p < 0.01, ***p < 0.001, ns, not significant by two-tailed unpaired t test (C, D, F) or one-way ANOVA followed by Dunnett’s multiple comparisons test (E and G). |
CTB-193M12.5 Upregulated WNT10B Expression
Our previous study has found that NSD1 promoted WNT10B transcription via increasing H3K36me2 and reducing H3K27me3 at WNT10B promoter.42 Therefore, we further explored the potential influences of CTB-193M12.5 on WNT10B transcription. WNT10B expression in SNU-398 cells with CTB-193M12.5 overexpression or knockdown was measured by RT-qPCR and Western blot. RT-qPCR results presented that WNT10B mRNA level was increased in SNU-398 cells with CTB-193M12.5 overexpression compared with control SNU-398 cells (Figure 5A), and while WNT10B mRNA level was reduced in SNU-398 cells with CTB-193M12.5 knockdown (Figure 5B). Western blot presented that WNT10B protein level was increased in SNU-398 cells with CTB-193M12.5 overexpression (Figure 5C), and while WNT10B protein level was reduced in SNU-398 cells with CTB-193M12.5 knockdown (Figure 5D). WNT10B expression in the same HCC tissues used in Figure 1C was measured by RT-qPCR, which presented that WNT10B expression was significantly positively correlated with CTB-193M12.5 expression in HCC tissues (Figure 5E). The positive correlation between WNT10B and CTB-193M12.5 expression in HCC tissues was further confirmed based on TCGA LIHC dataset (Figure 5F), analyzed by the online in silico tool ENCORI (https://starbase.sysu.edu.cn/).45 Collectively, these results demonstrated that CTB-193M12.5 upregulated WNT10B expression.
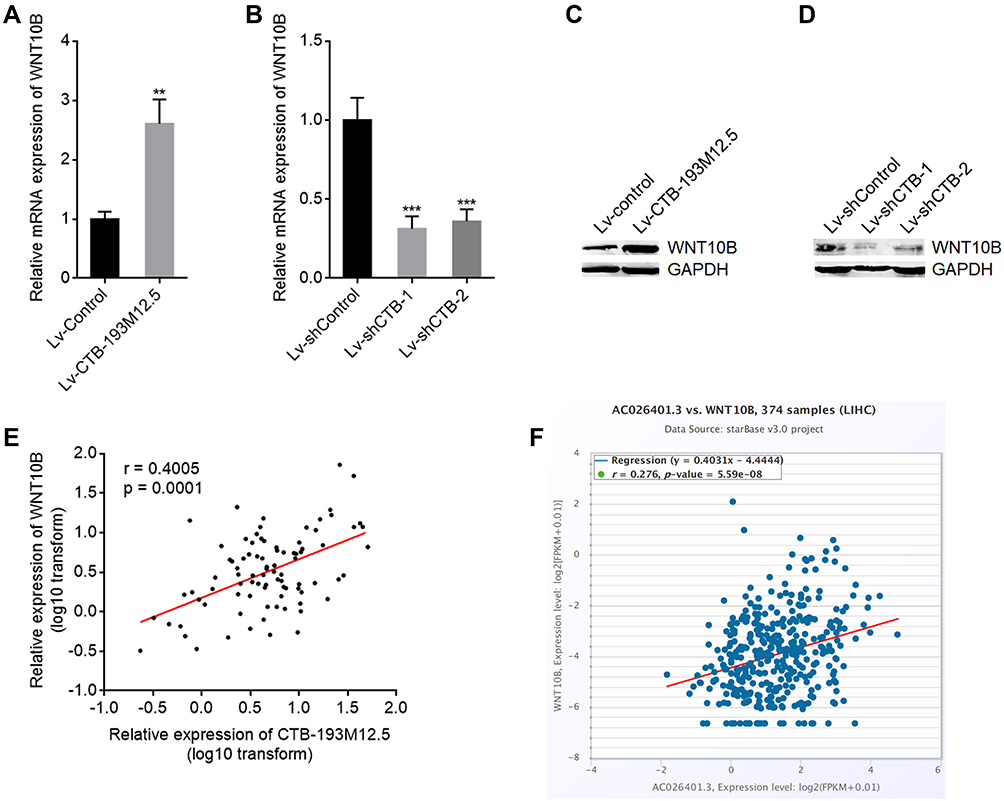 |
Figure 5 CTB-193M12.5 upregulated WNT10B expression. (A) WNT10B mRNA expression in SNU-398 cells with CTB-193M12.5 stable overexpression or control was measured by RT-qPCR. (B) WNT10B mRNA expression in SNU-398 cells with CTB-193M12.5 stable knockdown or control was measured by RT-qPCR. (C) WNT10B protein expression in SNU-398 cells with CTB-193M12.5 stable overexpression or control was measured by Western blot. (D) WNT10B protein expression in SNU-398 cells with CTB-193M12.5 stable knockdown or control was measured by Western blot. (E) The correlation between WNT10B and CTB-193M12.5 expression in 88 HCC tissues. r = 0.4005, p = 0.0001 by Spearman correlation analysis. (F) The correlation between WNT10B and CTB-193M12.5 (AC026401.3) expression in HCC tissues based on TCGA LIHC dataset, analyzed by ENCORI. For (A and B) results are shown as mean ± SD based on three independent experiments. **p < 0.01, ***p < 0.001 by two-tailed unpaired t test (A) or one-way ANOVA followed by Dunnett’s multiple comparisons test (B). |
CTB-193M12.5 Activated Wnt/β-Catenin Signaling
WNT10B belongs to the Wnt ligand family, which activates the Wnt/β-catenin signaling.46,47 Therefore, we further explored the potential influences of CTB-193M12.5 on Wnt/β-catenin signaling. Wnt/β-catenin reporter TOPflash was transfected into SNU-398 cells with CTB-193M12.5 overexpression or knockdown, followed by dual luciferase reporter assays, which presented that TOPflash luciferase activity was increased in SNU-398 cells with CTB-193M12.5 overexpression (Figure 6A), and while TOPflash luciferase activity was reduced in SNU-398 cells with CTB-193M12.5 knockdown (Figure 6B). Nuclear β-catenin levels of SNU-398 cells with CTB-193M12.5 overexpression or knockdown were measured by Western blot, which presented that nuclear β-catenin level was increased in SNU-398 cells with CTB-193M12.5 overexpression (Figure 6C), and while nuclear β-catenin level was reduced in SNU-398 cells with CTB-193M12.5 knockdown (Figure 6D). Wnt/β-catenin signaling downstream targets Myc and Cyclin D1 expressions were measured, which presented that Myc and Cyclin D1 expressions were increased in SNU-398 cells with CTB-193M12.5 overexpression (Figure 6E), and while Myc and Cyclin D1 expressions were reduced in SNU-398 cells with CTB-193M12.5 knockdown (Figure 6F). Collectively, these results demonstrated that CTB-193M12.5 activated Wnt/β-catenin signaling.
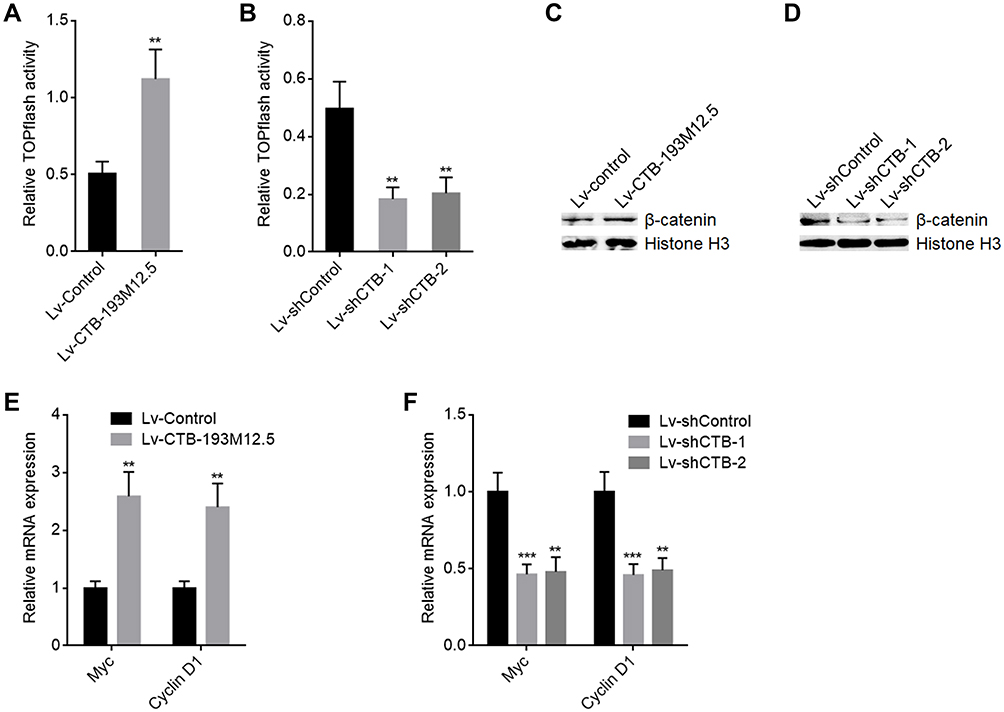 |
Figure 6 CTB-193M12.5 activated Wnt/β-catenin signaling. (A) Wnt/β-catenin reporter TOPflash was co-transfected with pRL-TK into SNU-398 cells with CTB-193M12.5 stable overexpression or control. TOPflash luciferase activity was measured by dual luciferase reporter assay, normalized by Renilla luciferase activity. (B) Wnt/β-catenin reporter TOPflash was co-transfected with pRL-TK into SNU-398 cells with CTB-193M12.5 stable knockdown or control. TOPflash luciferase activity was measured by dual luciferase reporter assay, normalized by Renilla luciferase activity. (C) Nuclear β-catenin level in SNU-398 cells with CTB-193M12.5 stable overexpression or control was measured by Western blot. (D) Nuclear β-catenin level in SNU-398 cells with CTB-193M12.5 stable knockdown or control was measured by Western blot. (E) Wnt/β-catenin signaling downstream targets Myc and Cyclin D1 expressions in SNU-398 cells with CTB-193M12.5 stable overexpression or control were measured by RT-qPCR. (F) Myc and Cyclin D1 expressions in SNU-398 cells with CTB-193M12.5 stable knockdown or control were measured by RT-qPCR. Results are shown as mean ± SD based on three independent experiments. **p < 0.01, ***p < 0.001 by two-tailed unpaired t test (A and E) or one-way ANOVA followed by Dunnett’s multiple comparisons test (B and F). |
The Oncogenic Roles of CTB-193M12.5 in HCC Were Dependent on the Activation of WNT10B/Wnt/β-Catenin Signaling Axis
To explore whether the role of CTB-193M12.5 in HCC was dependent on WNT10B/Wnt/β-catenin signaling axis, WNT10B was stably overexpressed in SNU-398 cells with CTB-193M12.5 stable knockdown. EdU incorporation and CCK-8 assays presented that overexpression of WNT10B reversed the reduced cellular proliferation ability caused by CTB-193M12.5 knockdown (Figure 7A and B). TUNEL and caspase-3 activity assays presented that overexpression of WNT10B reversed the increased cellular apoptosis caused by CTB-193M12.5 knockdown (Figure 7C and D). Transwell migration assay presented that overexpression of WNT10B reversed the reduced cellular migration ability caused by CTB-193M12.5 knockdown (Figure 7E). Transwell invasion assay presented that overexpression of WNT10B reversed the reduced cellular invasion ability caused by CTB-193M12.5 knockdown (Figure 7F). Moreover, SNU-398 cells with CTB-193M12.5 stable overexpression were treated with Wnt/β-catenin signaling inhibitor ICG-001. EdU incorporation and CCK-8 assays presented that ICG-001 treatment reversed the increased cellular proliferation ability caused by CTB-193M12.5 overexpression (Figure 8A and B). TUNEL and caspase-3 activity assays presented that ICG-001 treatment reversed the decreased cellular apoptosis caused by CTB-193M12.5 overexpression (Figure 8C and D). Transwell migration assay presented that ICG-001 treatment reversed the increased cellular migration ability caused by CTB-193M12.5 overexpression (Figure 8E). Transwell invasion assay presented that ICG-001 treatment reversed the increased cellular invasion ability caused by CTB-193M12.5 overexpression (Figure 8F). Collectively, these results demonstrated that the roles of CTB-193M12.5 in HCC were dependent on WNT10B/Wnt/β-catenin signaling axis.
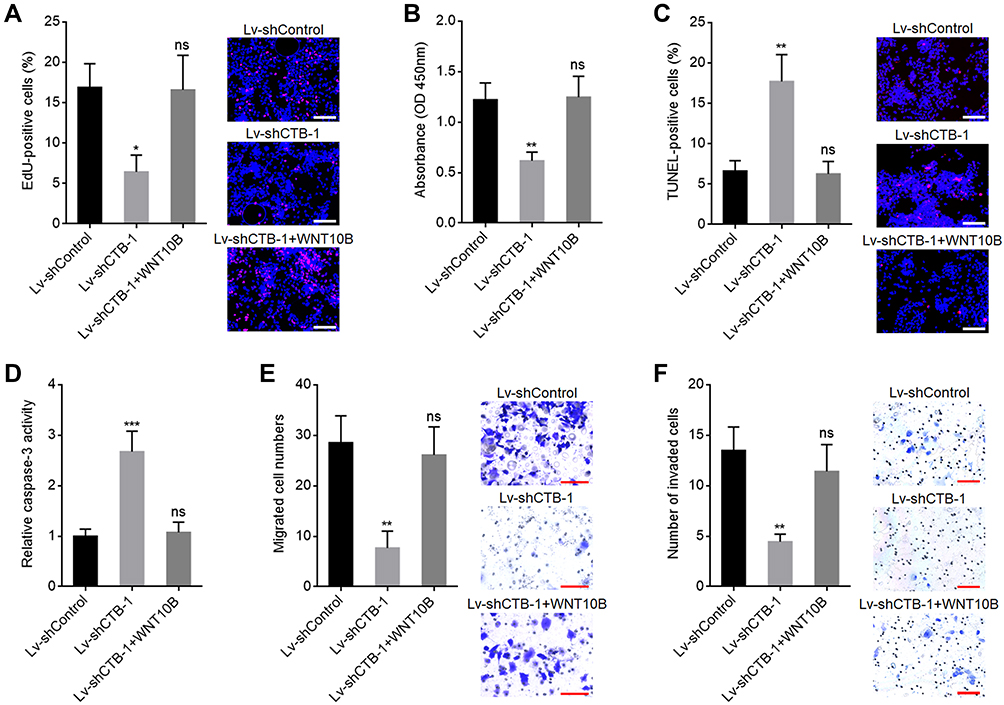 |
Figure 7 WNT10B reversed the tumor suppressive roles of CTB-193M12.5 knockdown in HCC. (A) Cellular proliferation of SNU-398 cells with CTB-193M12.5 knockdown and WNT10B overexpression was assessed by EdU incorporation assays. Red color indicates EdU-positive and proliferative cells. Scale bars = 100 µm. (B) Cellular proliferation of SNU-398 cells with CTB-193M12.5 knockdown and WNT10B overexpression was assessed by CCK-8 assays. (C) Cellular apoptosis of SNU-398 cells with CTB-193M12.5 knockdown and WNT10B overexpression was assessed by TUNEL assays. Red color indicates TUNEL-positive and apoptotic cells. Scale bars = 100 µm. (D) Cellular apoptosis of SNU-398 cells with CTB-193M12.5 knockdown and WNT10B overexpression was assessed by caspase-3 activity assay. (E) Cellular migration of SNU-398 cells with CTB-193M12.5 knockdown and WNT10B overexpression was assessed by transwell migration assay. Scale bars = 100 µm. (F) Cellular invasion of SNU-398 cells with CTB-193M12.5 knockdown and WNT10B overexpression was assessed by transwell invasion assay. Scale bars = 100 µm. Results are shown as mean ± SD based on three independent experiments. *p < 0.05, **p < 0.01, ***p < 0.001, by one-way ANOVA followed by Dunnett’s multiple comparisons test. Abbreviation: ns, not significant. |
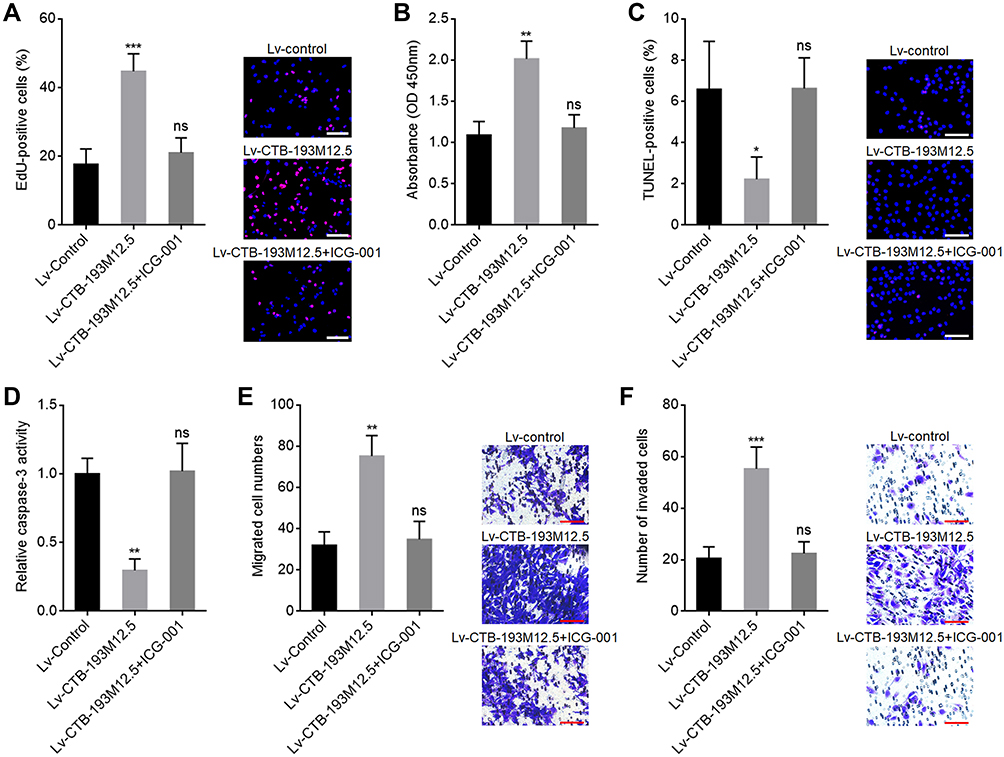 |
Figure 8 Wnt/β-catenin inhibitor ICG-001 abolished the oncogenic roles of CTB-193M12.5 in HCC. (A) Cellular proliferation of CTB-193M12.5 overexpressed SNU-398 cells treated with 5 μM ICG-001 was assessed by EdU incorporation assays. Red color indicates EdU-positive and proliferative cells. Scale bars = 100 µm. (B) Cellular proliferation of CTB-193M12.5 overexpressed SNU-398 cells treated with 5 μM ICG-001 was assessed by CCK-8 assays. (C) Cellular apoptosis of CTB-193M12.5 overexpressed SNU-398 cells treated with 5 μM ICG-001 was assessed by TUNEL assays. Red color indicates TUNEL-positive and apoptotic cells. Scale bars = 100 µm. (D) Cellular apoptosis of CTB-193M12.5 overexpressed SNU-398 cells treated with 5 μM ICG-001 was assessed by caspase-3 activity assay. (E) Cellular migration of CTB-193M12.5 overexpressed SNU-398 cells treated with 5 μM ICG-001 was assessed by transwell migration assay. Scale bars = 100 µm. (F) Cellular invasion of CTB-193M12.5 overexpressed SNU-398 cells treated with 5 μM ICG-001 was assessed by transwell invasion assay. Scale bars = 100 µm. Results are shown as mean ± SD based on three independent experiments. *p < 0.05, **p < 0.01, ***p < 0.001, by one-way ANOVA followed by Dunnett’s multiple comparisons test. Abbreviation: ns, not significant. |
Discussion
HCC is one of the most lethal malignancies with extremely poor prognosis.48,49 Most HCCs are resistant to chemotherapy and molecular targeted therapy, which are largely due to the complex molecular alterations of HCC.50–53 Although several genomic mutations have been found frequently in HCC, such as TP53, ARID1A, and CDKN2A, more genes show aberrant expressions in HCC.54,55 Further identifying these aberrantly expressed genes and uncovering their potential roles in HCC would provide novel therapeutic strategies for HCC.
In this study, we identified a lncRNA CTB-193M12.5, which is highly expressed in HCC tissues compared with noncancerous liver tissues. High expression of CTB-193M12.5 is associated with AFP concentration, large tumor size, aggressive clinical characteristics, advanced clinical stage, and poor overall survival. A previous report showed that CTB-193M12.5 was upregulated in lung adenocarcinoma tissues and correlated with poor overall survival of lung adenocarcinoma patients.56 Thus, we speculated that CTB-193M12.5 may be a popular cancer-related lncRNA, which needs further investigation in other cancers.
Functional experiments showed that CTB-193M12.5 enhanced HCC cellular proliferation, repressed HCC cellular apoptosis, and promoted HCC cellular migration and invasion, which indicated that CTB-193M12.5 functions as on oncogenic lncRNA in HCC. Targeted inhibition of CTB-193M12.5 repressed HCC cellular proliferation and mobility, and induced HCC cellular apoptosis. Therefore, our findings suggested CTB-193M12.5 as a potential therapeutic target for HCC.
As a class of regulatory RNAs, lncRNAs exert their oncogenic or tumor suppressive roles mainly through regulating oncogenic or tumor suppressive proteins.34 Epigenetic aberrances are critical factors contributing to aberrant expressions of many genes in malignancies, including HCC. Most epigenetic aberrances are caused by aberrant expressions and functions of epigenetic modifiers.57 In our previous study, we have identified an aberrantly highly expressed histone methyltransferase NSD1 in HCC, which exerts oncogenic roles in HCC.42 NSD1 catalyzes H3K36me2 at WNT10B promoter.42 The increasing of H3K36me2 induced the decreasing of H3K27me3, a classical repressive chromosome modification, leading to WNT10B transcriptional activation.42 In this study, we further found that CTB-193M12.5 is an important regulator of the roles of NSD1 in HCC. CTB-193M12.5 bound NSD1, recruited NSD1 to WNT10B promoter, induce H3K36me2 upregulation and H3K27me3 downregulation at WNT10B promoter, leading to transcriptional activation of WNT10B. This study provided novel evidences for the roles of lncRNAs in epigenetic modifications. Except H3K27me3, NSD1-induced H3K36me2 may also influence DNA methylation and acetylation of histone H3 at lysine 27 (H3K27ac) at other targets.44,58 Thus, the potential effects of CTB-193M12.5 on other targets of NSD1 need further investigations.
WNT10B is an important Wnt ligand, which activates Wnt/β-catenin signaling.46 Through upregulating WNT10B expression, CTB-193M12.5 also activated Wnt/β-catenin signaling. Wnt/β-catenin signaling plays important roles in liver development and HCC progression.59,60 In this study, functional rescue assays demonstrated that inhibition of Wnt/β-catenin signaling abolished the oncogenic roles of CTB-193M12.5 in HCC. Moreover, ectopic expression of WNT10B also reversed the tumor-suppressive roles of CTB-193M12.5 knockdown in HCC. These findings supported that CTB-193M12.5 exerts oncogenic roles in HCC through modulating WNT10B/Wnt/β-catenin signaling axis.
In conclusion, this study identifies CTB-193M12.5 as an oncogene in HCC. Increased expression of CTB-193M12.5 is correlated with poor survival of HCC patients. CTB-193M12.5 promotes HCC progression via enhancing NSD1-mediated WNT10B/Wnt/β-catenin signaling activation. This study suggested CTB-193M12.5 as a potential prognostic biomarker and therapeutic target for HCC.
Abbreviations
HCC, hepatocellular carcinoma; qPCR, quantitative polymerase chain reaction; TUNEL, terminal deoxynucleotidyl transferase-mediated dUTP nick end labelling; NSD1, SET domain-containing protein 1; lncRNA, long noncoding RNA; H3K36me2, di-methylation of histone H3 at lysine 36; H3K27me3, tri-methylation of histone H3 at lysine 27; TCGA, The Cancer Genome Atlas; LIHC, liver hepatocellular carcinoma; CPAT, Coding Potential Assessment Tool; CPC, coding potential calculator; ATCC, American Type Culture Collection; RT, reverse transcription; EdU, 5-ethynyl-2’-deoxyuridine; CCK-8, cell counting kit-8; RIP, RNA immunoprecipitation; ChIP, chromatin immunoprecipitation; RPISeq, RNA–protein interaction prediction.
Data Sharing Statement
The original contributions presented in the study are included in the article. Further inquiries can be directed to the corresponding author.
Ethics Approval and Consent to Participate
The studies involving human participants were reviewed and approved by the Ethic Committee of Union Hospital, Tongji Medical College, Huazhong University of Science and Technology. The patients/participants provided their written informed consent to participate in this study.
Funding
This work was supported by the Nature Science Foundation of Hubei Province, China (2020CFB796).
Disclosure
The authors declare that they have no competing interests.
References
1. Sung H, Ferlay J, Siegel RL, et al. Global cancer statistics 2020: GLOBOCAN estimates of incidence and mortality worldwide for 36 cancers in 185 countries. CA Cancer J Clin. 2021;71:209–249. doi:10.3322/caac.21660
2. Villanueva A, Longo DL. Hepatocellular carcinoma. N Engl J Med. 2019;380:1450–1462. doi:10.1056/NEJMra1713263
3. Giannini EG, Farinati F, Ciccarese F, et al. Prognosis of untreated hepatocellular carcinoma. Hepatology. 2015;61:184–190. doi:10.1002/hep.27443
4. Kudo Y, Sugimoto M, Arias E, et al. PKClambda/iota loss induces autophagy, oxidative phosphorylation, and NRF2 to promote liver cancer progression. Cancer Cell. 2020;38:247–262 e11. doi:10.1016/j.ccell.2020.05.018
5. Zhou G, Boor PPC, Bruno MJ, Sprengers D, Kwekkeboom J. Immune suppressive checkpoint interactions in the tumour microenvironment of primary liver cancers. Br J Cancer. 2021. doi:10.1038/s41416-021-01453-3
6. Zhao W, Ma B, Tian Z, et al. Inhibiting CBX4 efficiently protects hepatocellular carcinoma cells against sorafenib resistance. Br J Cancer. 2021;124:1237–1248. doi:10.1038/s41416-020-01240-6
7. Li Z, Lu X, Liu Y, et al. Gain of LINC00624 enhances liver cancer progression by disrupting the histone deacetylase 6/tripartite motif containing 28/zinc finger protein 354C corepressor complex. Hepatology. 2021;73:1764–1782. doi:10.1002/hep.31530
8. Iyer MK, Niknafs YS, Malik R, et al. The landscape of long noncoding RNAs in the human transcriptome. Nat Genet. 2015;47:199–208. doi:10.1038/ng.3192
9. Hanniford D, Ulloa-Morales A, Karz A, et al. Epigenetic silencing of CDR1as drives IGF2BP3-mediated melanoma invasion and metastasis. Cancer Cell. 2020;37:55–70 e15. doi:10.1016/j.ccell.2019.12.007
10. Daneshvar K, Ardehali MB, Klein IA, et al. lncRNA DIGIT and BRD3 protein form phase-separated condensates to regulate endoderm differentiation. Nat Cell Biol. 2020;22:1211–1222. doi:10.1038/s41556-020-0572-2
11. Li G, Kryczek I, Nam J, et al. LIMIT is an immunogenic lncRNA in cancer immunity and immunotherapy. Nat Cell Biol. 2021;23:526–537. doi:10.1038/s41556-021-00672-3
12. Arraiano CM. Regulatory noncoding RNAs: functions and applications in health and disease. FEBS J. 2021;288:6308–6309. doi:10.1111/febs.16027
13. Khalili-Tanha G, Moghbeli M. Long non-coding RNAs as the critical regulators of doxorubicin resistance in tumor cells. Cell Mol Biol Lett. 2021;26:39. doi:10.1186/s11658-021-00282-9
14. Ni J, Huang Z, Wang D. LncRNA TP73-AS1 promotes oxidized low-density lipoprotein-induced apoptosis of endothelial cells in atherosclerosis by targeting the miR-654-3p/AKT3 axis. Cell Mol Biol Lett. 2021;26:27. doi:10.1186/s11658-021-00264-x
15. Zhang Y, Li Y, Hu Q, et al. The lncRNA H19 alleviates muscular dystrophy by stabilizing dystrophin. Nat Cell Biol. 2020;22:1332–1345. doi:10.1038/s41556-020-00595-5
16. Li Y, Yan G, Zhang J, et al. LncRNA HOXA11-AS regulates calcium oxalate crystal-induced renal inflammation via miR-124-3p/MCP-1. J Cell Mol Med. 2020;24:238–249. doi:10.1111/jcmm.14706
17. Zhou X, Xu W, Wang Y, et al. LncRNA DNM3OS regulates GREM2 via miR-127-5p to suppress early chondrogenic differentiation of rat mesenchymal stem cells under hypoxic conditions. Cell Mol Biol Lett. 2021;26:22. doi:10.1186/s11658-021-00269-6
18. Zhang G, Xue C, Zeng Y. beta-elemene alleviates airway stenosis via the ILK/Akt pathway modulated by MIR143HG sponging miR-1275. Cell Mol Biol Lett. 2021;26:28. doi:10.1186/s11658-021-00261-0
19. Liu HT, Ma RR, Lv BB, et al. LncRNA-HNF1A-AS1 functions as a competing endogenous RNA to activate PI3K/AKT signalling pathway by sponging miR-30b-3p in gastric cancer. Br J Cancer. 2020;122:1825–1836. doi:10.1038/s41416-020-0836-4
20. Li JK, Chen C, Liu JY, et al. Long noncoding RNA MRCCAT1 promotes metastasis of clear cell renal cell carcinoma via inhibiting NPR3 and activating p38-MAPK signaling. Mol Cancer. 2017;16:111. doi:10.1186/s12943-017-0681-0
21. Sur S, Ray RB. Emerging role of lncRNA ELDR in development and cancer. FEBS J. 2021. doi:10.1111/febs.15876
22. Kong Q, Liang C, Jin Y, et al. The lncRNA MIR4435-2HG is upregulated in hepatocellular carcinoma and promotes cancer cell proliferation by upregulating miRNA-487a. Cell Mol Biol Lett. 2019;24:26. doi:10.1186/s11658-019-0148-y
23. Liu J, Yang C, Gu Y, et al. Knockdown of the lncRNA SNHG8 inhibits cell growth in Epstein-Barr virus-associated gastric carcinoma. Cell Mol Biol Lett. 2018;23:17. doi:10.1186/s11658-018-0070-8
24. Li T, Liu N, Gao Y, et al. Long noncoding RNA HOTAIR regulates the invasion and metastasis of prostate cancer by targeting hepaCAM. Br J Cancer. 2021;124:247–258. doi:10.1038/s41416-020-01091-1
25. Mo S, Zhang L, Dai W, et al. Antisense lncRNA LDLRAD4-AS1 promotes metastasis by decreasing the expression of LDLRAD4 and predicts a poor prognosis in colorectal cancer. Cell Death Dis. 2020;11:155. doi:10.1038/s41419-020-2338-y
26. Yang A, Liu X, Liu P, et al. LncRNA UCA1 promotes development of gastric cancer via the miR-145/MYO6 axis. Cell Mol Biol Lett. 2021;26:33. doi:10.1186/s11658-021-00275-8
27. Acha-Sagredo A, Uko B, Pantazi P, et al. Long non-coding RNA dysregulation is a frequent event in non-small cell lung carcinoma pathogenesis. Br J Cancer. 2020;122:1050–1058. doi:10.1038/s41416-020-0742-9
28. Knutsen E, Harris AL, Perander M. Expression and functions of long non-coding RNA NEAT1 and isoforms in breast cancer. Br J Cancer. 2022;126:551–561. doi:10.1038/s41416-021-01588-3
29. Kattan SW, Hobani YH, Shaheen S, et al. Association of cyclin-dependent kinase inhibitor 2B antisense RNA 1 gene expression and rs2383207 variant with breast cancer risk and survival. Cell Mol Biol Lett. 2021;26:14. doi:10.1186/s11658-021-00258-9
30. Zhu XT, Yuan JH, Zhu TT, Li YY, Cheng XY. Long noncoding RNA glypican 3 (GPC3) antisense transcript 1 promotes hepatocellular carcinoma progression via epigenetically activating GPC3. FEBS J. 2016;283:3739–3754. doi:10.1111/febs.13839
31. Li H, Yan R, Chen W, et al. Long non coding RNA SLC26A4-AS1 exerts antiangiogenic effects in human glioma by upregulating NPTX1 via NFKB1 transcriptional factor. FEBS J. 2020. doi:10.1111/febs.15325
32. Zhang L, Zhang J, Li S, et al. Genomic amplification of long noncoding RNA HOTAIRM1 drives anaplastic thyroid cancer progression via repressing miR-144 biogenesis. RNA Biol. 2021;18:547–562. doi:10.1080/15476286.2020.1819670
33. Yuan JH, Liu XN, Wang TT, et al. The MBNL3 splicing factor promotes hepatocellular carcinoma by increasing PXN expression through the alternative splicing of lncRNA-PXN-AS1. Nat Cell Biol. 2017;19:820–832. doi:10.1038/ncb3538
34. Yuan JH, Yang F, Wang F, et al. A long noncoding RNA activated by TGF-beta promotes the invasion-metastasis cascade in hepatocellular carcinoma. Cancer Cell. 2014;25:666–681. doi:10.1016/j.ccr.2014.03.010
35. Li MM, Liu XH, Zhao YC, et al. Long noncoding RNA KCNQ1OT1 promotes apoptosis in neuroblastoma cells by regulating miR-296-5p/Bax axis. FEBS J. 2020;287:561–577. doi:10.1111/febs.15047
36. Shen W, Huang B, He Y, Shi L, Yang J. Long non-coding RNA RP11-820 promotes extracellular matrix production via regulating miR-3178/MYOD1 in human trabecular meshwork cells. FEBS J. 2020;287:978–990. doi:10.1111/febs.15058
37. Wang F, Yuan JH, Wang SB, et al. Oncofetal long noncoding RNA PVT1 promotes proliferation and stem cell-like property of hepatocellular carcinoma cells by stabilizing NOP2. Hepatology. 2014;60:1278–1290. doi:10.1002/hep.27239
38. Ding J, Zhao J, Huan L, et al. Inflammation-induced long intergenic noncoding RNA (LINC00665) increases malignancy through activating the double-stranded RNA-activated protein kinase/nuclear factor Kappa B pathway in hepatocellular carcinoma. Hepatology. 2020;72:1666–1681. doi:10.1002/hep.31195
39. Wang L, Park HJ, Dasari S, Wang S, Kocher JP, CPAT: LW. Coding-potential assessment tool using an alignment-free logistic regression model. Nucleic Acids Res. 2013;41:e74. doi:10.1093/nar/gkt006
40. Kang YJ, Yang DC, Kong L, et al. CPC2: a fast and accurate coding potential calculator based on sequence intrinsic features. Nucleic Acids Res. 2017;45:W12–W16. doi:10.1093/nar/gkx428
41. Li J, Li MH, Wang TT, et al. SLC38A4 functions as a tumour suppressor in hepatocellular carcinoma through modulating Wnt/beta-catenin/MYC/HMGCS2 axis. Br J Cancer. 2021;125:865–876. doi:10.1038/s41416-021-01490-y
42. Zhang S, Zhang F, Chen Q, Wan C, Xiong J, Xu J. CRISPR/Cas9-mediated knockout of NSD1 suppresses the hepatocellular carcinoma development via the NSD1/H3/Wnt10b signaling pathway. J Exp Clin Cancer Res. 2019;38:467. doi:10.1186/s13046-019-1462-y
43. Tang Z, Li C, Kang B, Gao G, Li C, Zhang Z. GEPIA: a web server for cancer and normal gene expression profiling and interactive analyses. Nucleic Acids Res. 2017;45:W98–W102. doi:10.1093/nar/gkx247
44. Farhangdoost N, Horth C, Hu B, et al. Chromatin dysregulation associated with NSD1 mutation in head and neck squamous cell carcinoma. Cell Rep. 2021;34:108769. doi:10.1016/j.celrep.2021.108769
45. Li JH, Liu S, Zhou H, Qu LH, Yang JH. starBase v2.0: decoding miRNA-ceRNA, miRNA-ncRNA and protein-RNA interaction networks from large-scale CLIP-Seq data. Nucleic Acids Res. 2014;42:D92–D97. doi:10.1093/nar/gkt1248
46. Yang Z, Wang M, Ren Y, et al. Inhibition of Wnt10b/beta-catenin signaling alleviates pulmonary fibrogenesis induced by paraquat in vivo and in vitro. Life Sci. 2021;286:120027. doi:10.1016/j.lfs.2021.120027
47. Lin YC, Haas A, Bufe A, et al. Wnt10b-GSK3beta-dependent Wnt/STOP signaling prevents aneuploidy in human somatic cells. Life Sci Alliance. 2021;4. doi:10.26508/lsa.202000855
48. Ocal O, Ingrisch M, Umutlu MR, et al. Prognostic value of baseline imaging and clinical features in patients with advanced hepatocellular carcinoma. Br J Cancer. 2021. doi:10.1038/s41416-021-01577-6
49. Fountzilas C, Gupta M, Lee S, et al. A multicentre phase 1b/2 study of tivozanib in patients with advanced inoperable hepatocellular carcinoma. Br J Cancer. 2020;122:963–970. doi:10.1038/s41416-020-0737-6
50. Hajiev S, Allara E, Motedayеn Aval L, et al. Impact of age on sorafenib outcomes in hepatocellular carcinoma: an international cohort study. Br J Cancer. 2021;124(2):407–413. doi:10.1038/s41416-020-01116-9
51. Childs A, Zakeri N, Ma YT, et al. Biopsy for advanced hepatocellular carcinoma: results of a multicentre UK audit. Br J Cancer. 2021;125(10):1350–1355. doi:10.1038/s41416-021-01535-2
52. Chew SC, Choo SY, Chow PK. A new perspective on the immune escape mechanism in HCC: onco-foetal reprogramming. Br J Cancer. 2021;124:1897–1899. doi:10.1038/s41416-021-01286-0
53. Xing Y, Liu Y, Qi Z, Liu Z, Wang X, Zhang H. LAGE3 promoted cell proliferation, migration, and invasion and inhibited cell apoptosis of hepatocellular carcinoma by facilitating the JNK and ERK signaling pathway. Cell Mol Biol Lett. 2021;26:49. doi:10.1186/s11658-021-00295-4
54. Fujimoto A, Furuta M, Totoki Y, et al. Whole-genome mutational landscape and characterization of noncoding and structural mutations in liver cancer. Nat Genet. 2016;48:500–509. doi:10.1038/ng.3547
55. Fujimoto A, Totoki Y, Abe T, et al. Whole-genome sequencing of liver cancers identifies etiological influences on mutation patterns and recurrent mutations in chromatin regulators. Nat Genet. 2012;44:760–764. doi:10.1038/ng.2291
56. Wang X, Li G, Luo Q, Xie J, Gan C. Integrated TCGA analysis implicates lncRNA CTB-193M12.5 as a prognostic factor in lung adenocarcinoma. Cancer Cell Int. 2018;18:27. doi:10.1186/s12935-018-0513-3
57. Li XJ, Li QL, Ju LG, et al. Deficiency of histone methyltransferase SET domain-containing 2 in liver leads to abnormal lipid metabolism and HCC. Hepatology. 2021;73:1797–1815. doi:10.1002/hep.31594
58. Weinberg DN, Papillon-Cavanagh S, Chen H, et al. The histone mark H3K36me2 recruits DNMT3A and shapes the intergenic DNA methylation landscape. Nature. 2019;573:281–286. doi:10.1038/s41586-019-1534-3
59. Ho NPY, Leung CON, Wong TL, et al. The interplay of UBE2T and Mule in regulating Wnt/beta-catenin activation to promote hepatocellular carcinoma progression. Cell Death Dis. 2021;12:148. doi:10.1038/s41419-021-03403-6
60. Fang L, Gao C, Bai RX, Wang HF, Du SY. Overexpressed sFRP3 exerts an inhibitory effect on hepatocellular carcinoma via inactivation of the Wnt/beta-catenin signaling pathway. Cancer Gene Ther. 2021;28:875–891. doi:10.1038/s41417-020-0201-z
 © 2022 The Author(s). This work is published and licensed by Dove Medical Press Limited. The full terms of this license are available at https://www.dovepress.com/terms.php and incorporate the Creative Commons Attribution - Non Commercial (unported, v3.0) License.
By accessing the work you hereby accept the Terms. Non-commercial uses of the work are permitted without any further permission from Dove Medical Press Limited, provided the work is properly attributed. For permission for commercial use of this work, please see paragraphs 4.2 and 5 of our Terms.
© 2022 The Author(s). This work is published and licensed by Dove Medical Press Limited. The full terms of this license are available at https://www.dovepress.com/terms.php and incorporate the Creative Commons Attribution - Non Commercial (unported, v3.0) License.
By accessing the work you hereby accept the Terms. Non-commercial uses of the work are permitted without any further permission from Dove Medical Press Limited, provided the work is properly attributed. For permission for commercial use of this work, please see paragraphs 4.2 and 5 of our Terms.