")
Back to Journals » International Journal of Chronic Obstructive Pulmonary Disease » Volume 13
CT densitometry in emphysema: a systematic review of its clinical utility
Authors Crossley D, Renton M, Khan M , Low EV, Turner AM
Received 1 June 2017
Accepted for publication 25 August 2017
Published 7 February 2018 Volume 2018:13 Pages 547—563
DOI https://doi.org/10.2147/COPD.S143066
Checked for plagiarism Yes
Review by Single anonymous peer review
Peer reviewer comments 3
Editor who approved publication: Dr Richard Russell
Diana Crossley,1 Mary Renton,1 Muhammad Khan,1 Emma V Low,1 Alice M Turner2
1Institute of Inflammation and Ageing, University of Birmingham, Birmingham, UK; 2Institute of Applied Health Sciences, University of Birmingham, Birmingham, UK
Background: The aim of the study was to assess the relationship between computed tomography (CT) densitometry and routine clinical markers in patients with chronic obstructive pulmonary disease (COPD) and alpha-1 anti-trypsin deficiency (AATD).
Methods: Multiple databases were searched using a combination of pertinent terms and those articles relating quantitatively measured CT densitometry to clinical outcomes. Studies that used visual scoring only were excluded, as were those measured in expiration only. A thorough review of abstracts and full manuscripts was conducted by 2 reviewers; data extraction and assessment of bias was conducted by 1 reviewer and the 4 reviewers independently assessed for quality. Pooled correlation coefficients were calculated, and heterogeneity was explored.
Results: A total of 112 studies were identified, 82 being suitable for meta-analysis. The most commonly used density threshold was −950 HU, and a significant association between CT density and all included clinical parameters was demonstrated. There was marked heterogeneity between studies secondary to large variety of disease severity within commonly included cohorts and differences in CT acquisition parameters.
Conclusion: CT density shows a good relationship to clinically relevant parameters; however, study heterogeneity and lack of longitudinal data mean that it is difficult to compare studies or derive a minimal clinically important difference. We recommend that international consensus is reached to standardize CT conduct and analysis in future COPD and AATD studies.
Keywords: computed tomography, CT, densitometry, emphysema, chronic obstructive pulmonary disease, alpha-1 anti-trypsin deficiency
Plain language summary
Computed tomography (CT) produces a digital image that is reconstructed into the recognizable picture format. CT densitometry describes the method that uses using this information to accurately quantify the severity of emphysema, and this has been validated pathologically and clinically. However, CT densitometry is yet to be standardized and its clinical utility remains unclear. This systematic review has highlighted the vast heterogeneity that exists between studies using CT density, and despite the strong relationship to clinically relevant parameters, international consensus is still required to standardize CT conduct.
Introduction
The heterogeneity of chronic obstructive pulmonary disease (COPD) and alpha-1 anti-trypsin deficiency (AATD) is well recognized, as is the need for more descriptive biomarkers beyond lung function.1 Computed tomography (CT) has been used for many years to visually diagnose emphysema, providing the most direct assessment of its presence and distribution.2 Software programs have since been developed, which can objectively measure the severity of emphysema.3 Quantitative CT, and in particular CT densitometry, is the method of quantifying emphysema using such software; its ability to assess emphysema has been validated clinically and pathologically.4–6 However, CT densitometry is yet to be standardized, with numerous factors impacting on the measurement of density and affecting results.7 Changes seen on CT predate those seen on spirometry, with pathological studies demonstrating that up to one-third of the lung tissues is destroyed in emphysema before spirometry becomes abnormal. This suggests that CT densitometry may be a very important technique for detection of early disease, an area which is of increasing clinical interest.8 CT densitometry was the primary outcome measure for registration level randomized clinical trials (RCTs) of augmentation therapy in AATD, where signals have been seen for this measure, and only trends in the same direction for other clinical outcomes.9 More recently large cross-sectional studies in COPD have been established (eg, COPDGene), which have collected data from quantitative measures on CT as well as extensive physiology.10
Understanding the implications of density data is complex for both clinicians and regulatory agencies and no systematic reviews of its utility have been undertaken. The purpose of our study was to assess the validity of CT densitometry as a measure of severity and progression of lung disease in emphysema specifically seeking relationship to lung function, mortality, hospital admissions and quality of life (QOL).
Methods
This review is registered with Prospero (CRD42015024183). All papers concerning patients with clinically or spirometrically defined COPD that compared CT densitometry data with FEV1, gas transfer (diffusing capacity of the lungs for carbon monoxide [DLCO] or transfer factor divided by the alveolar volume [KCO]) and QOL, in the same study population were included. In addition, any study that described longitudinal density change, irrespective of whether there was a direct relationship to one of our pre-specified outcomes, was included. Studies in which COPD was secondary to AATD were included.
Population
The following databases were searched with no date or language restrictions: MEDLINE (Ovid), MEDLINE In Process (Ovid), EMBASE (Ovid), Cochrane Library (Wiley) Cochrane Central Register of Controlled Trials (CENTRAL), CMR, CDSR, HTA, NHS EED and DARE. In addition, Conference Proceedings Citation Index via Web of Science and British Library’s ZETOC was searched for conference proceedings and abstracts, and ClinicalTrials.gov and WHO International Clinical Trials Registry Platform were searched for ongoing trials. Search terms for COPD and AATD were combined with all search terms for CT or CT densitometry, and lung function (see Supplementary materials for full search terms).
Study selection
Titles and abstracts of search yield were screened for relevance by 2 reviewers independently. Disagreements were resolved by discussion, where required involving a third reviewer. Relevant articles were obtained and assessed against the full selection criteria in a similar manner (see Supplementary materials for full inclusion and exclusion criteria). Studies that used visual scoring only were excluded, as were those measured in expiration only.
Data extraction
Data were extracted using the Cochrane model, and included general study information, specifics of CT acquisition (ie, reconstruction algorithm, software and slice thickness), percentage low attenuation area (%LAA), whether the scan was taken in full inspiration, use of bronchodilator during spirometry and a CT phantom for quality assurance.11 This process was performed by 1 reviewer (DC) and checked by the remaining authors.
Risk of bias
Risk of bias was assessed by one reviewer (DC) and independently by AMT, MR, MK, and EL using a mixture of two recognized bias tools (Table S1). The AHRQ was used in order to accurately examine the large amount of cross sectional studies included, and QUADAS 2 where CT density is being considered as a diagnostic tool.12,13 Publication bias was assessed using funnel plots and Begg-Mazumdar/Egger tests, and efforts were made to reduce publication bias by using no date or language limits.
Data synthesis
Baseline characteristics are presented as mean (standard deviation) or median (interquartile range). Studies where density was taken from a single slice, where there was division into arbitrary emphysematous thresholds or that quoted mean lung density only were excluded. Studies that compared CT density with one of our chosen clinical parameters using Pearson’s correlation coefficient were meta-analyzed to estimate the Schmidt-Hunter (SH) weighted mean correlation coefficient. As SH is a random effects model, it is suitable for heterogeneous populations, with weighted means to accurately account for the variance.14 I2 and chi-square analyses were performed to assess study heterogeneity. All analyses were performed using StatsDirect, and where meta-analysis was not possible, a narrative synthesis is provided.
Results
The PRISMA flow diagram (Figure 1) demonstrates that 112 papers were included in the overall narrative, and 82 papers could be combined in a quantitative meta-analysis. A small number of papers reported lobar densities, which were analyzed separately (Table S2). Characteristics of all included papers can be found in Table S3.
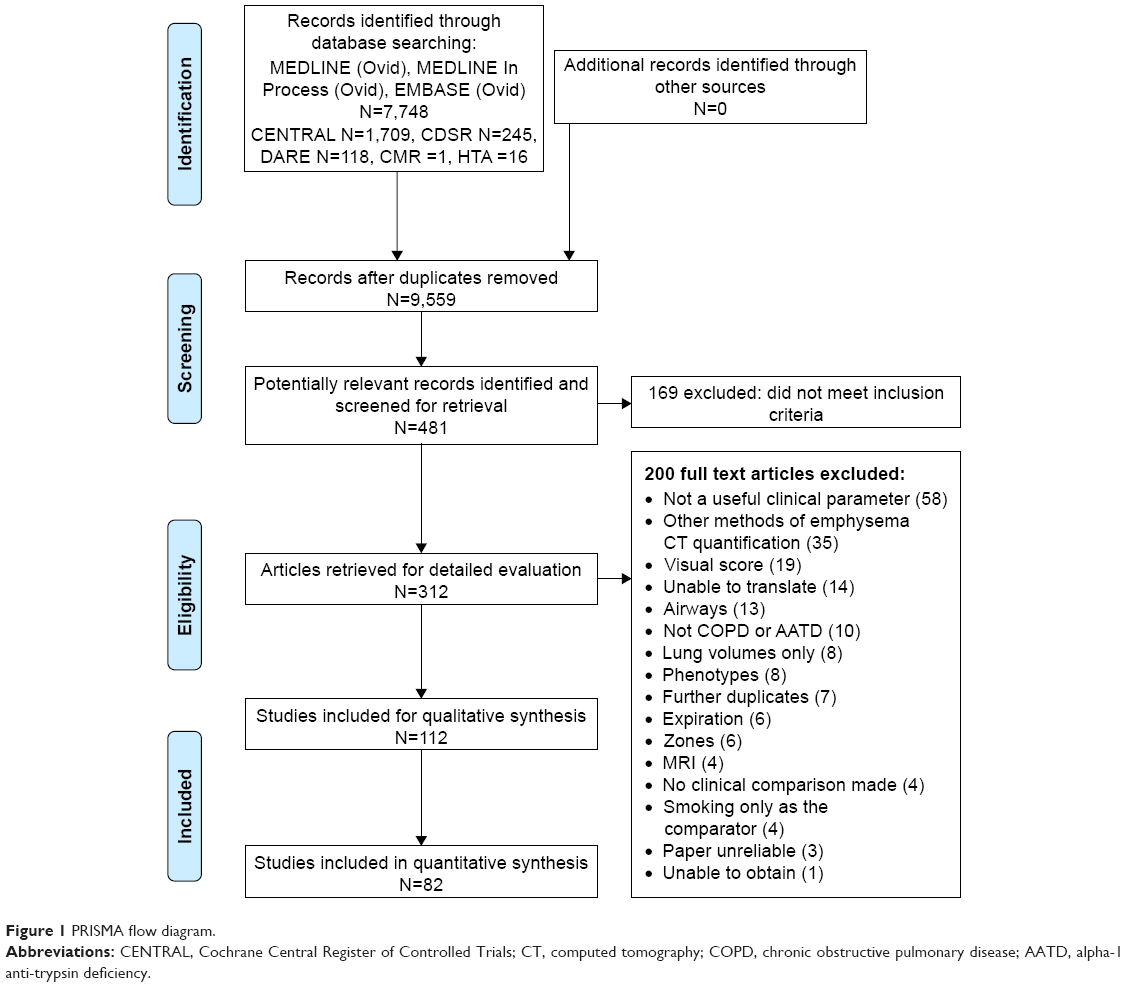 | Figure 1 PRISMA flow diagram. |
Cross-sectional studies of CT density
Pulmonary function tests
Table 1 summarizes the baseline characteristics of studies and patients included in meta-analyses. %LAA at −950 HU was the most commonly used emphysematous threshold, with 55 individual studies reporting the association between −950 and clinical parameters, of which 23 were from larger cohort studies (eg, COPDGene, KOLD).10,14
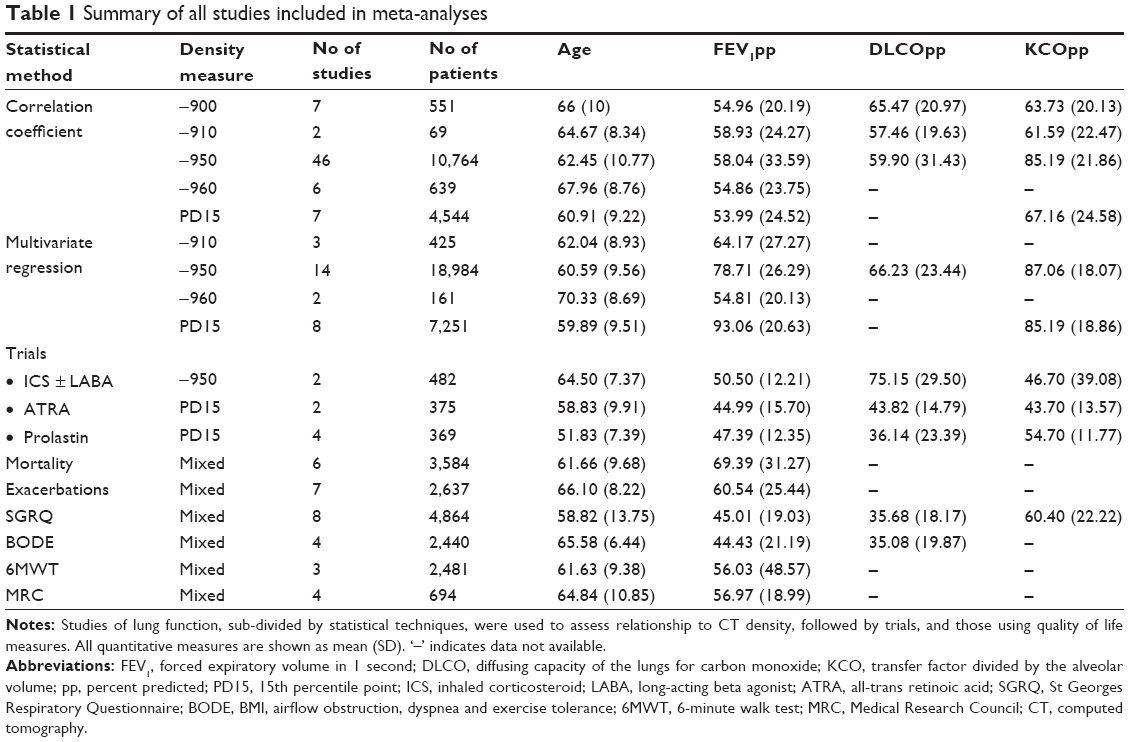 | Table 1 Summary of all studies included in meta-analyses |
Spirometry
FEV1
A total of 36 studies compared forced expiratory volume in 1 second (FEV1) percent predicted to CT density. The forest plot in Figure 2 demonstrates the correlation between FEV1 percent predicted with CT density at −950 HU, and the variation between the included studies. These data are summarized in Table 2, which shows meta-analyses of the other CT parameters against FEV1 (L) or FEV1 percent predicted. The level of heterogeneity remained high in all sub-group analyses except for 900 HU and FEV1 percent predicted, which contained the smallest number of studies and thus could be less reliable.
 | Figure 2 Forest plot of all studies included in the meta-analysis that correlated FEV1 percent predicted with −950 HU. |
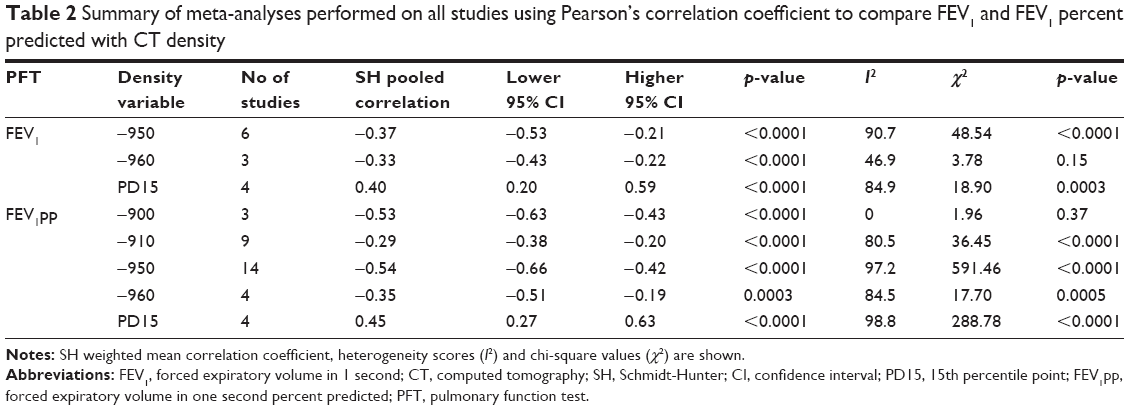 | Table 2 Summary of meta-analyses performed on all studies using Pearson’s correlation coefficient to compare FEV1 and FEV1 percent predicted with CT density |
Further investigation into the cause of heterogeneity revealed major differences in the choice and combination of reconstruction algorithm, slice thickness and software program used by included studies. When meta-analysis was restricted to those studies using the same CT acquisition parameters, the forest plot became more uniform and heterogeneity reduced (Figure 3).
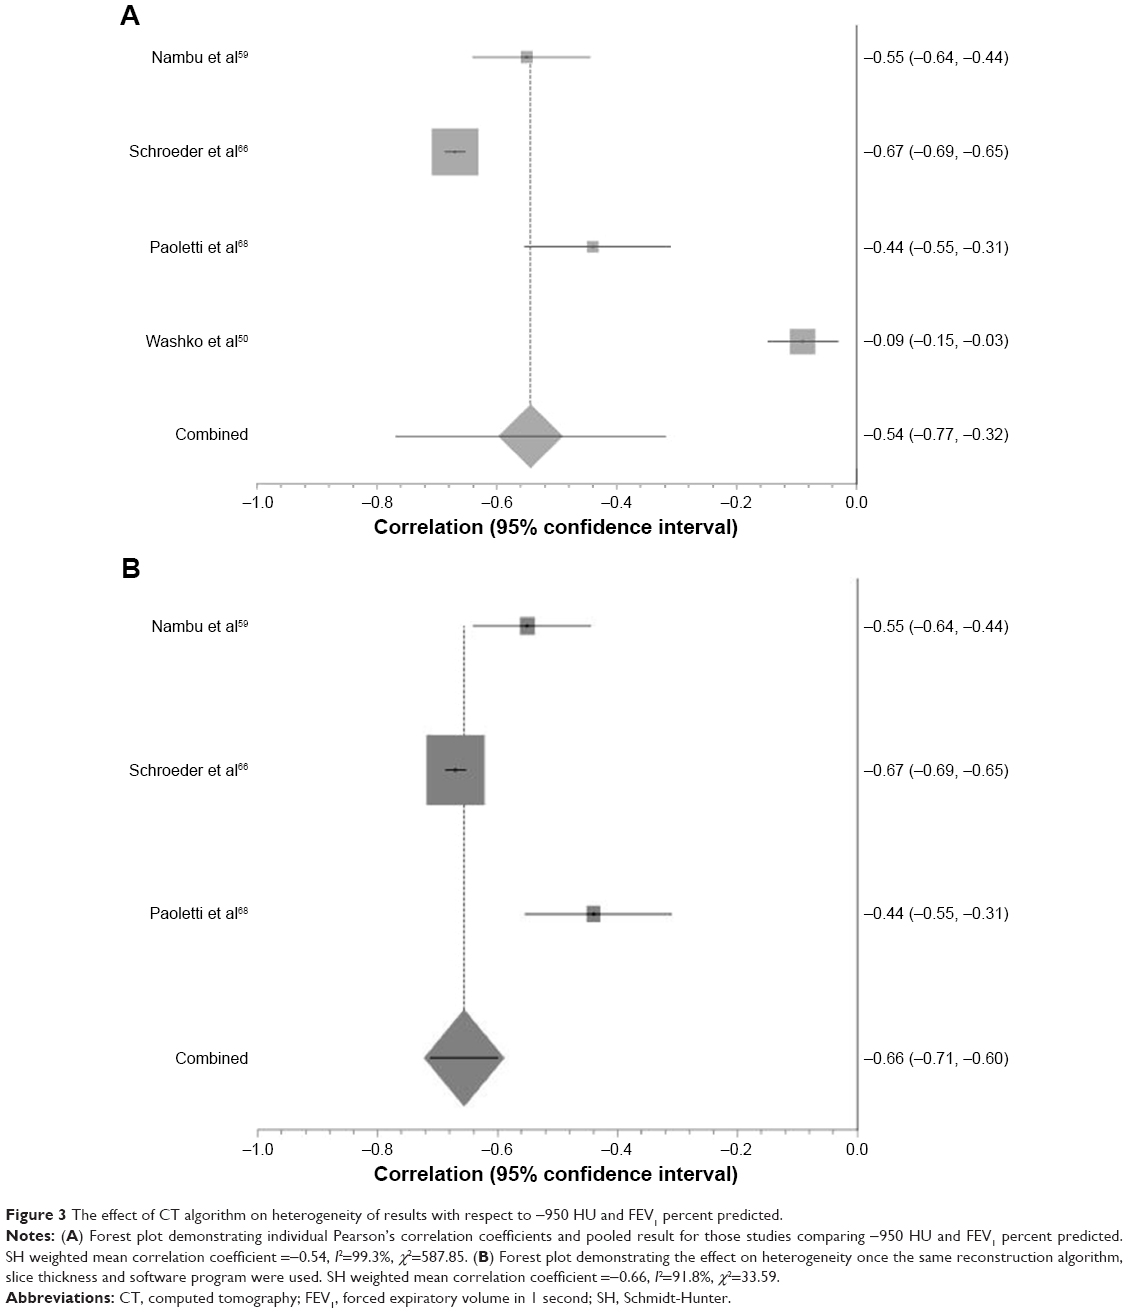 | Figure 3 The effect of CT algorithm on heterogeneity of results with respect to −950 HU and FEV1 percent predicted. |
Seven studies performed multivariate linear regression between FEV1 and CT density (Table 3). However, for each density variable, all studies were adjusted for different variables and therefore an accurate meta-analysis could not be performed.
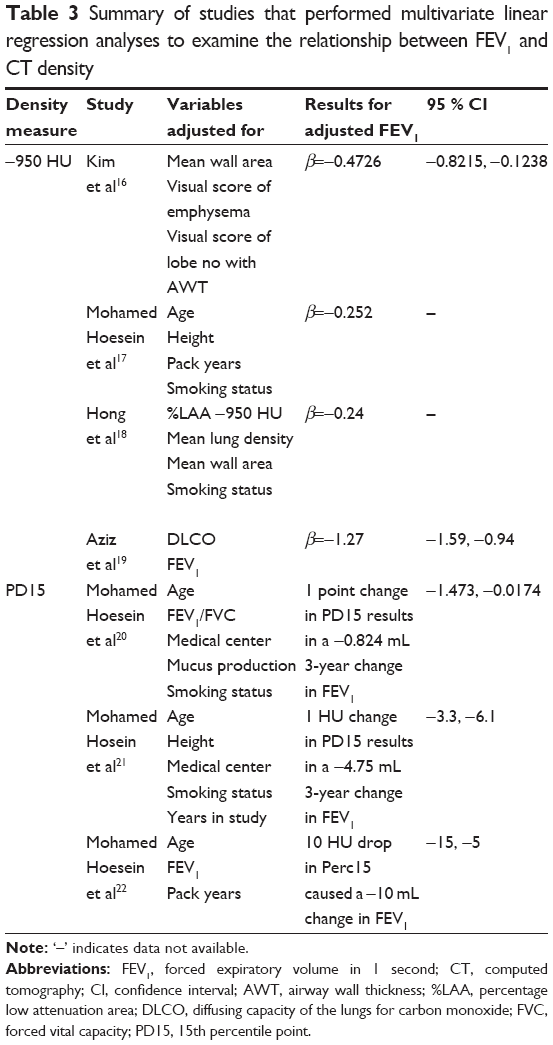 | Table 3 Summary of studies that performed multivariate linear regression analyses to examine the relationship between FEV1 and CT density |
FEV1/forced vital capacity
Akin to FEV1, there was a significant correlation between each density variable and FEV1/forced vital capacity (p<0.0007; Table 4). Again, large visual and statistical heterogeneity was improved by restricting to studies using the same CT parameters (Figure 4).
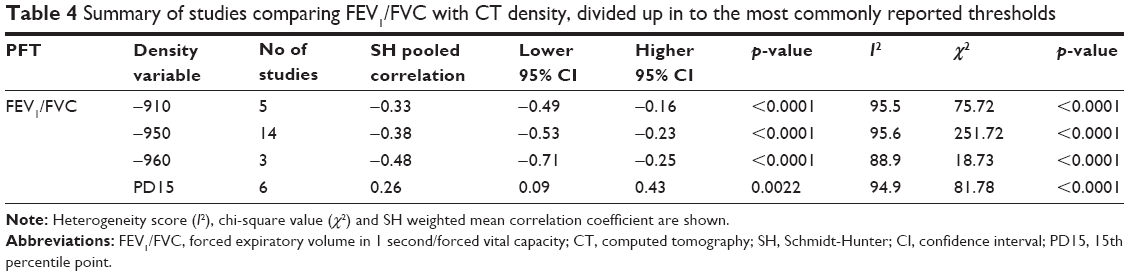 | Table 4 Summary of studies comparing FEV1/FVC with CT density, divided up in to the most commonly reported thresholds |
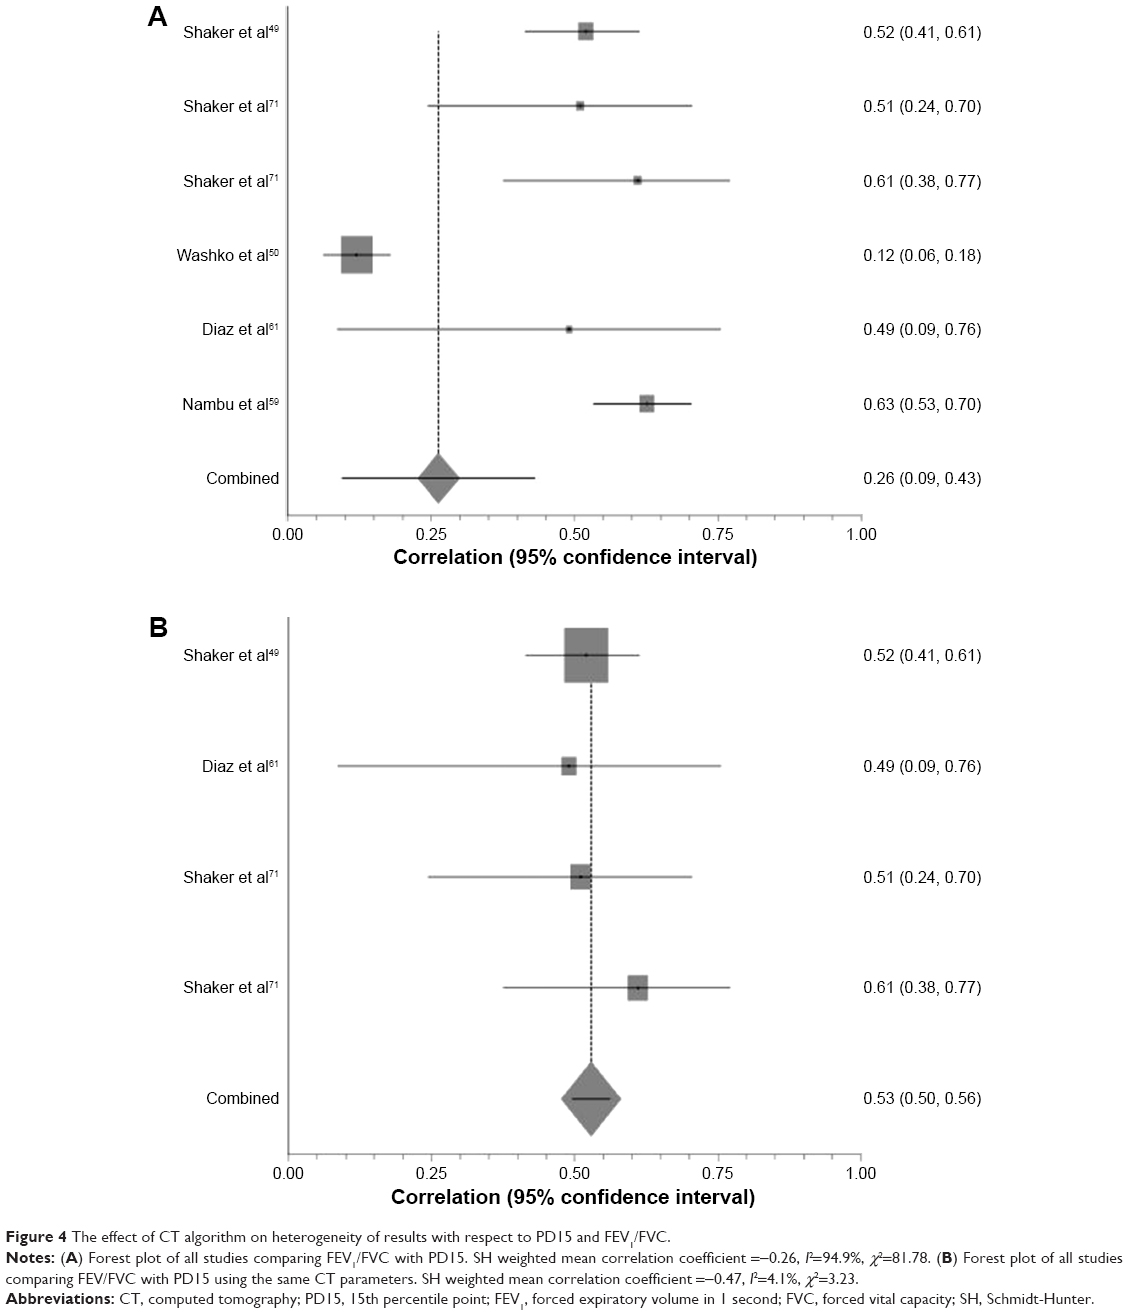 | Figure 4 The effect of CT algorithm on heterogeneity of results with respect to PD15 and FEV1/FVC. |
Gas transfer
A total of 23 studies compared DLCO percent predicted to CT density. The pooled correlation coefficients were universally significant across each of the density values, albeit slightly weaker than for FEV1 percent predicted and CT density (Table 5). The same pattern was seen regarding heterogeneity of results, with I2 dropping from 91.5% to 0 once CT algorithm was taken into account (Figure 5).
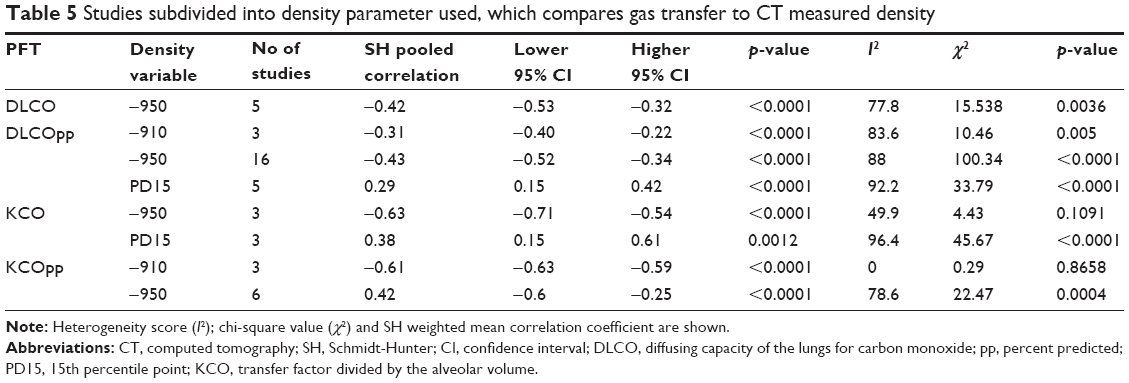 | Table 5 Studies subdivided into density parameter used, which compares gas transfer to CT measured density |
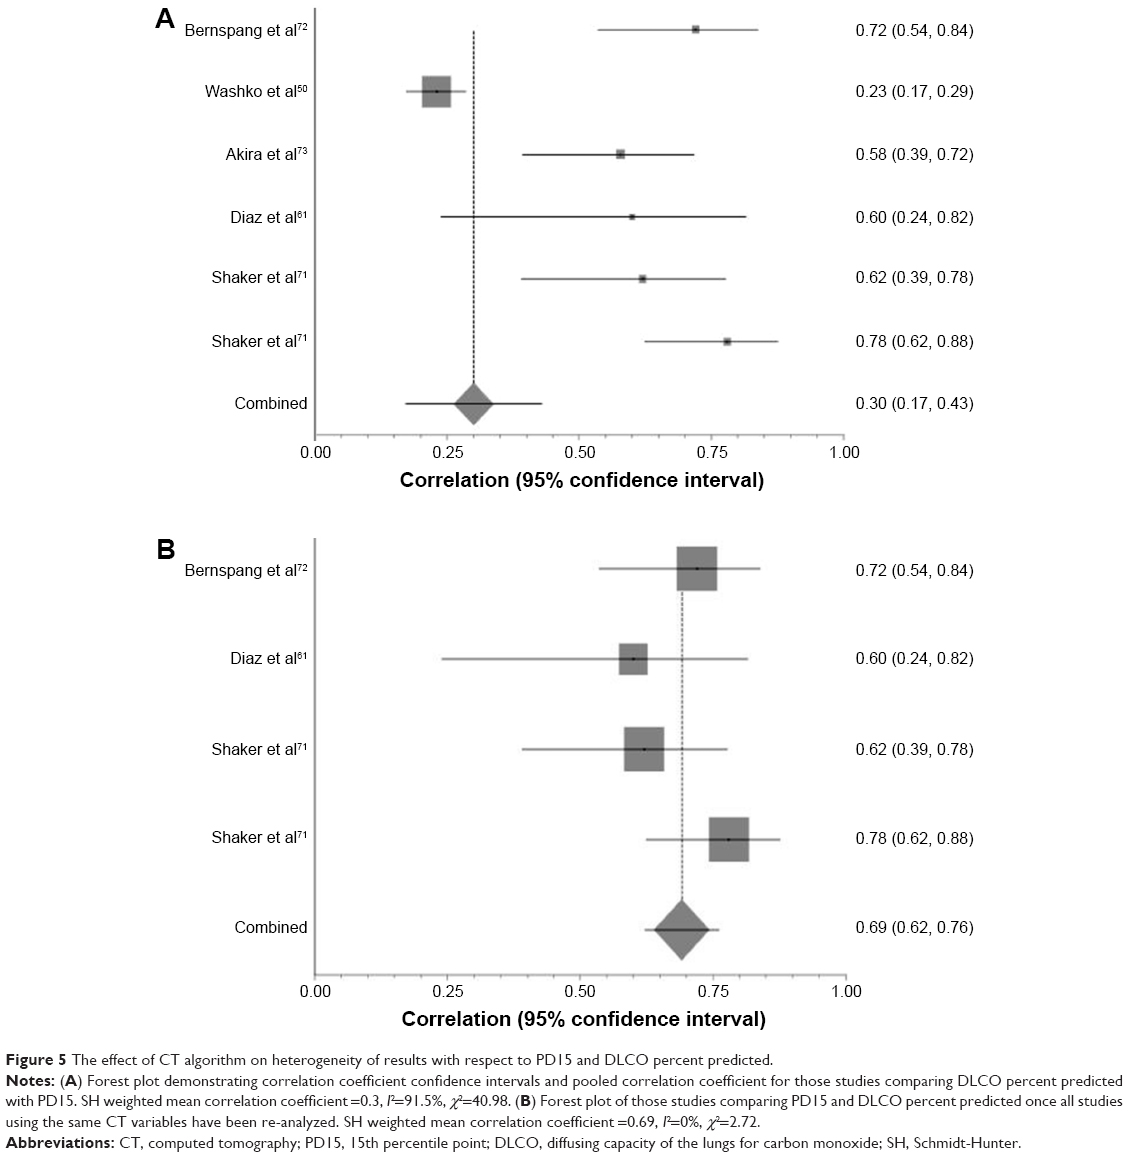 | Figure 5 The effect of CT algorithm on heterogeneity of results with respect to PD15 and DLCO percent predicted. |
Quality of life, symptom and composite scores
St Georges Respiratory Questionnaire (SGRQ) was the most frequently reported measure of QOL compared with CT density. A total of 2 out of 5 studies using correlation coefficients showed no relationship between the two measures, while the other 3 showed a strong association (p<0.003) (Table 6). There was variability in the density threshold and patient groups used (eg, cancer screening populations or those being considered for lung volume reduction surgery), thus precluding meta-analysis. Nevertheless studies that performed multivariate analyses consistently showed a significant association between density and SGRQ.
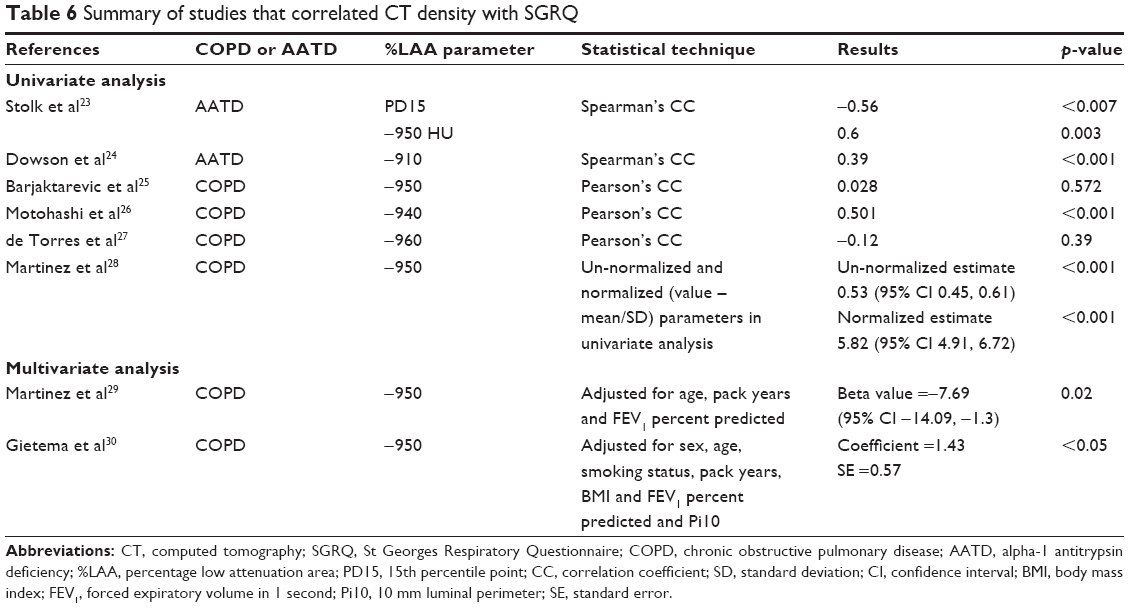 | Table 6 Summary of studies that correlated CT density with SGRQ |
Studies of BMI, airflow obstruction, dyspnea and exercise capacity and Medical Research Council (MRC) versus CT density used different density thresholds and statistical techniques but again showed strong relationships between density and the score in question in multivariate analyses (Table 7).
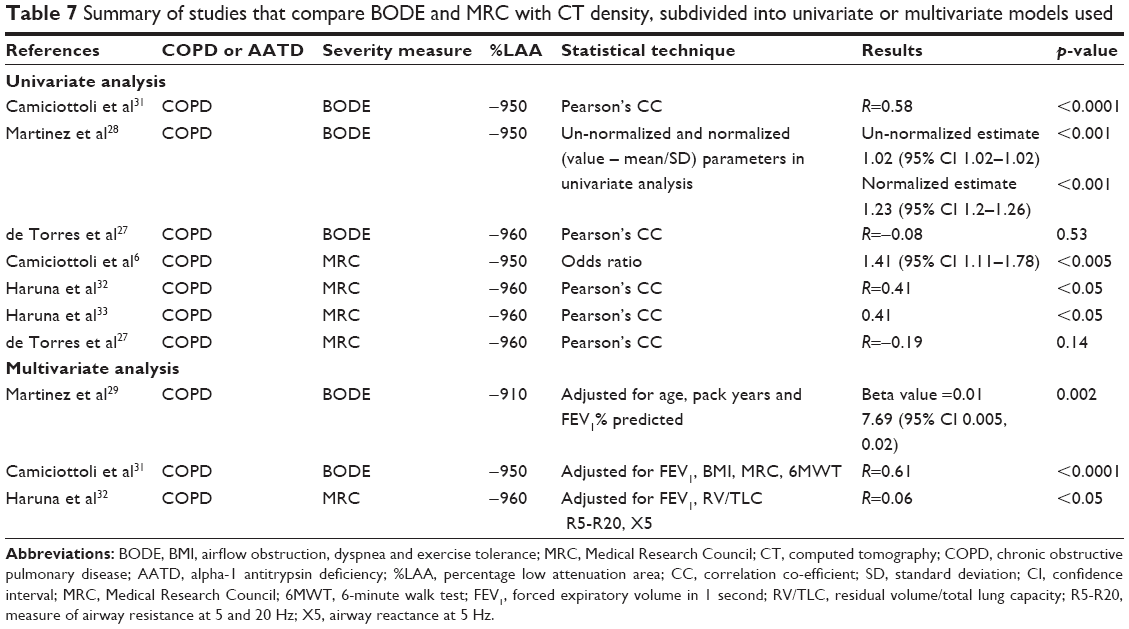 | Table 7 Summary of studies that compare BODE and MRC with CT density, subdivided into univariate or multivariate models used |
Longitudinal studies of CT density
Mortality
A total of 6 papers reported the relationship between CT density and mortality, 3 of which provided a hazard ratio for all-cause mortality (Table 8) generated by multi-variable logistic regression. However, it was inappropriate to combine them statistically due to differing emphysematous thresholds and confounding variables included in their models. Emphysema as defined by CT density remained a significant independent predictor for mortality throughout.
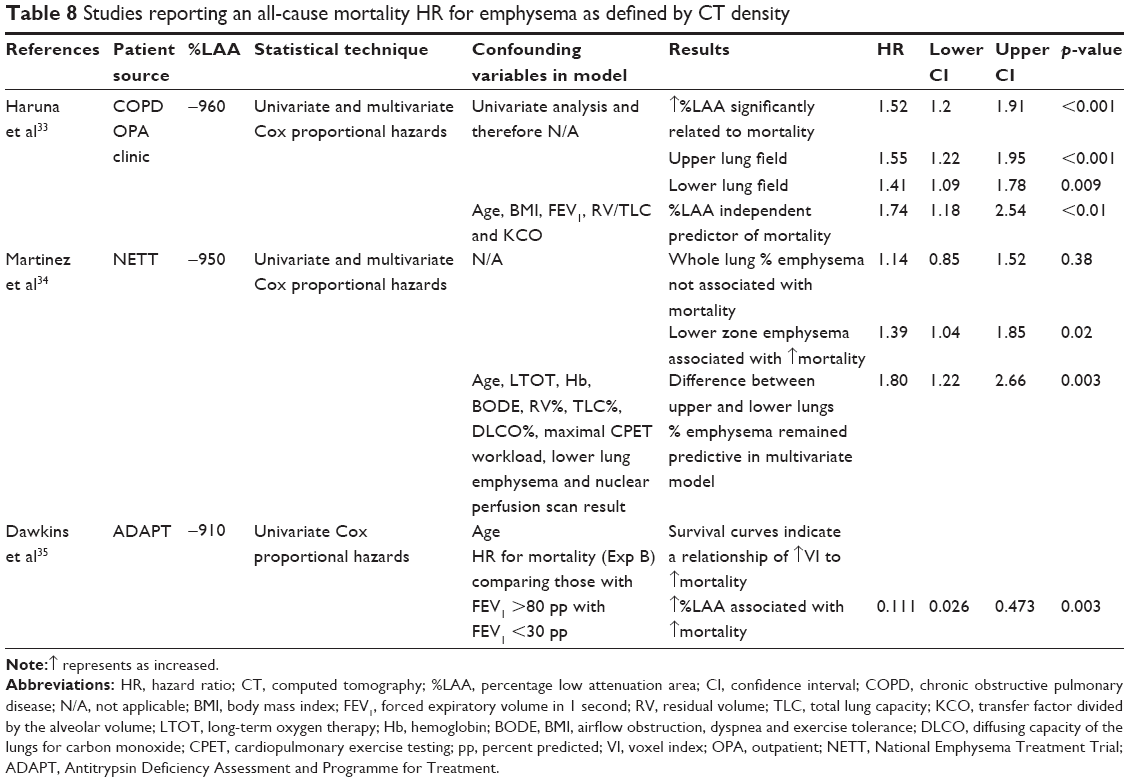 | Table 8 Studies reporting an all-cause mortality HR for emphysema as defined by CT density |
Exacerbations
A total of 4 studies investigated low CT density as a risk factor for COPD exacerbations using multiple regression analyses in order to independently attribute exacerbations to density loss (Table 9). Due to different statistical methods, and the variables adjusted for, a statistical meta-analysis could not be performed. All but 1 study showed a significant relationship between CT density and exacerbations; Yoo et al found that the ability for emphysema index to predict exacerbations did not remain significant when numerous variables such as age, SGRQ and Charlson Index score were included in multiple regression analysis.36 Cheng et al performed a multivariate ordinal logistic regression to demonstrate that %LAA >7.5 was associated with worse performance status and MRC grade if they presented to Accident and Emergency with an infective exacerbation of COPD.37
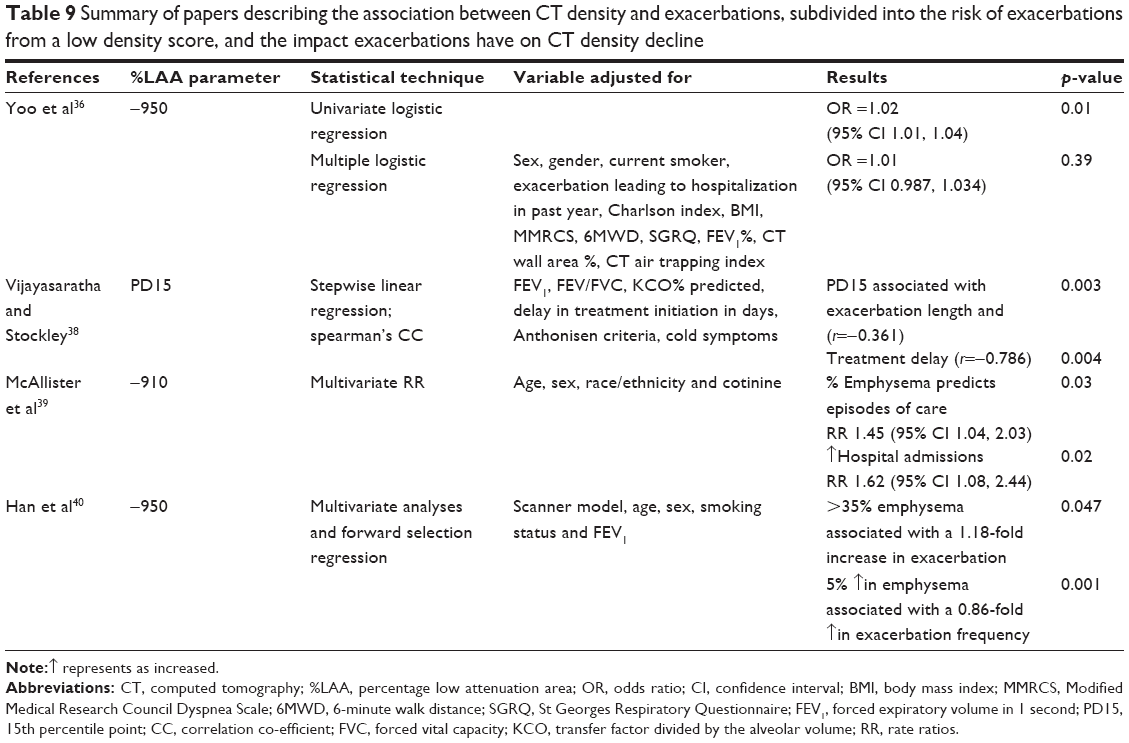 | Table 9 Summary of papers describing the association between CT density and exacerbations, subdivided into the risk of exacerbations from a low density score, and the impact exacerbations have on CT density decline |
Interventional studies reporting CT density
AAT augmentation therapy
A total of 3 RCTs used CT density as an outcome measure for augmentation therapy in AATD patients;9,41,42 change in CT density was the primary outcome in 2 studies41,42 and secondary outcome in the earliest work.9 A fourth paper was not included in the quantitative synthesis as it simply explored statistical approaches in data from the EXACTLE trial.43 In all papers, CT density was log transformed and volume adjusted (see Table S3 for CT acquisition parameters), study duration was 2–3 years and the rate of density decline was measured in g/l−1 per year. A recent meta-analysis of these data has been reported separately, which demonstrates slower density decline in those receiving augmentation therapy than those receiving placebo (p=0.002).44 The 3 papers analyzed also report overall low to moderate correlation coefficients between CT density and FEV1, KCO and exercise tolerance (0.31, 0.47 and −0.21 respectively).
All-trans retinoic acid
All-trans retinoic acid was shown to promote alveolar repair in animal models and subsequently 2 studies examined its effect in AATD as measured by CT density. However, neither showed any significant benefit on density decline nor did either comment on the observed relationship between CT density and other clinical parameters.45,46
Inhaled long-acting beta agonist/inhaled corticosteroid
A total of 2 studies from South Korea and the KOLD study collected longitudinal data on spirometric change over 3 months with inhaled corticosteroid/long-acting beta agonist treatment and demonstrated a significant correlation between FEV1 and baseline CT density using −950 HU as the emphysematous threshold.47,48 Shaker et al performed annual CT densitometry in a RCT conducted in patients with COPD, which demonstrated significantly slower decline in emphysema (using −910 HU; p=0.02) in those randomized to budesonide compared to placebo.49
Standardizing studies for equal CT variables
Since there were clear differences in the meta-analyses regarding the relationship between CT density and outcome when stratified by CT algorithm/statistical methods, we felt it was important to summarize the wide range of methods used in included studies (Figure 6).
 | Figure 6 (A) Bar chart to demonstrate variety of software programs used in all studies. (B) Bar chart to demonstrate the variety of reconstruction algorithms reported. (C) Bar chart to demonstrate variety of slice thicknesses reported in all studies. |
Pulmo was the most frequently used software program (used in EXACTLE and RAPID trials), followed by Pulmonary Workstation (used in COPDGene studies).
Most commonly, the reconstruction algorithm used was not mentioned, followed by “standard reconstruction algorithm”. The reconstruction algorithms are scanner specific, not always clear and therefore would be difficult to reproduce. The most frequently used slice thicknesses were 1 mm (N=40) and sub-millimeter (N=20).
Bias assessment
Risk of bias is summarized in Table 10 (see Table S4 for the full risk of bias assessment). Bias introduced during patient selection was relatively low, with the patient source, selection and inclusion/exclusion criteria well described. The highest level of uncertainty that could have led to bias was within index and reference test (ie, CT and lung function). There was variability in the detail that authors gave with regards to CT acquisition, the use of a phantom and whether or not a bronchodilator was applied before spirometry was performed. Missing data and confounding variables were often not accounted for, but the statistical tests applied were considered appropriate.
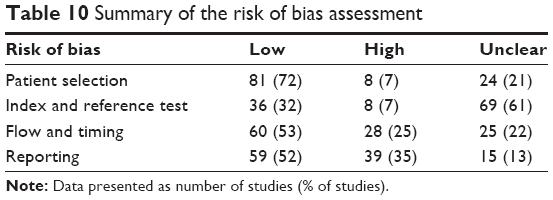 | Table 10 Summary of the risk of bias assessment |
Publication bias
The funnel plots for −959 HU versus FEV1 percent predicted and DLCO percent predicted (analyses containing the most studies) show a significant degree of publication bias (Figure 7). On further inspection of both plots, there is one study with a low standard error and large population (Washko et al) that causes the funnel plots to shift to the right.50 Without this study, it stands to reason that the funnel would be more inclusive of the studies within the plot and could imply less publication bias. The risk of bias by two independent reviewers of this study was concluded as moderate, based on no mention of the time interval between the CT and pulmonary function tests. There was also no explanation of how confounding variables were assessed or controlled for, or how missing data were handled.
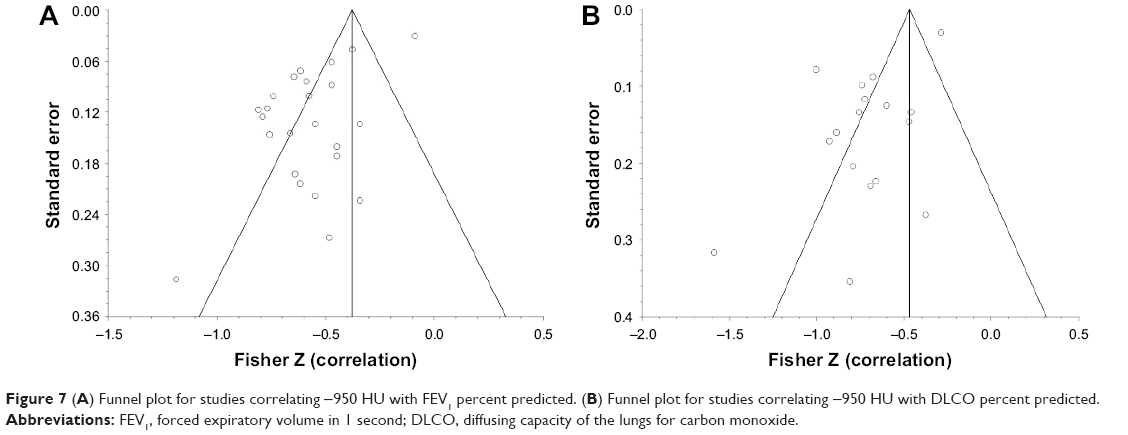 | Figure 7 (A) Funnel plot for studies correlating −950 HU with FEV1 percent predicted. (B) Funnel plot for studies correlating −950 HU with DLCO percent predicted. |
Discussion
The purpose of this review was to summarize all the currently available literature regarding CT density and its association with commonly used clinical parameters to develop a clear understanding of the utility of CT density measures for current and future clinical practice. This is particularly important as CT density has been used as a primary outcome in registration level clinical trials in AATD, but doubt has been cast by some authors as to its relevance as a surrogate outcome.41,51 Our data showed that association between CT density and other clinical parameters deemed suitable as outcomes for airways disease trials (eg, FEV1, SGRQ) were consistently significant, and furthermore there was a clear and consistent relationship to mortality. This suggests that CT density is an appropriate surrogate outcome measure in studies of emphysema, like those conducted in AATD. However, publication and other biases as well as study heterogeneity make it more difficult to draw conclusions regarding the precise strength of each relationship.
Over half of the included studies were from larger cohort studies and subsequent retrospective/cross-sectional analysis. The nature of these cohorts introduces heterogeneity in the types of patients recruited, ie, lung cancer screening studies (NELSON),52 alpha one cohorts,53 COPD (eg, COPDGene, KOLD15,54) and end-stage disease (eg, NETT).55 The consistency of direction of the relationship between density and lung function across diverse patient groups is reassuring and suggests that density could be a valid surrogate outcome across the spectrum of disease severity. However, the wide range of values seen for the CT versus FEV1 correlations meant that defining the exact level of CT density that relates to, for instance, the minimal clinically important difference (MCID) for FEV1 was difficult.
The chosen CT parameter (eg, −950 HU, 15th percentile point [PD15]), software program, reconstruction algorithm and slice thickness varied grossly throughout. This level of heterogeneity was far greater than we had anticipated and made combination of all data via meta-analysis potentially less valid. The broad range of published correlation coefficients seen between −950 HU and FEV1% (Figure 2) (from −0.1 to −0.8) demonstrated this well, and when only studies with the same CT acquisition variables were analyzed, the level of heterogeneity fell dramatically. This implies that future CT density studies should have a standardized approach. Despite PD15 being established as the most reliable and sensitive measure, we have seen many studies that do not use this parameter, and would encourage authors to report this value so that data can be combined and our knowledge can grow.
The most appropriate CT algorithm would be a soft reconstruction algorithm (eg, B30f), slice thickness 2.5–5 mm and a software program that yields reliable and repeatable results. The algorithm and slice thickness are optimal due to minimal technical noise. Sharper algorithms and thinner slices have been demonstrated to overestimate the amount of emphysema.56 Many publications used in-house software that, while producing useful data, may not be comparable to one another.57 For example, Pulmo and Pulmonary Workstation are two of the most commonly used software programs (used in RAPID trial and COPDGene cohort studies, respectively), and if identical and repeatable results can be produced by both programs then cohort studies using them can then be combined and meta-analyzed to increase power. This requires direct comparison of the software on the same scans; a similar approach would be needed for slice thickness, reconstruction and so on. There are limited studies of this nature to date.7
There was a paucity of longitudinal CT density data in the included studies, which precluded conclusions about the sensitivity and specificity of CT density change over time with respect to our chosen outcomes. This means that we are unable to assess the relationship between CT density and clinical parameters over time for which there was a known MCID (eg, FEV of 100 mL), and therefore a proposal of a MCID for CT density was not possible. This would be of particular use for registration level trials, which have used or intend to use this as their primary outcome.
The key strengths of this review are that it was very broad; therefore, all potential papers were captured. Rigorous checking of data extracted from the large number of included studies was done, and the statistical analyses were conducted under supervision of an experienced statistician. Limitations were largely centered on the quality and heterogeneity of the included studies. There are other CT scanner variables that we did not examine in more detail as their impact was considered less relevant, eg, scanner type and radiation dose. There were 14 papers in languages to which we did not have access to a translator such as Japanese and Korean.
Conclusion
This evidence synthesis has demonstrated that CT density relates significantly to all commonly used clinical parameters. However, the large amount of heterogeneity and lack of longitudinal data mean that how sensitive and specific CT density is to change relating to time or interventions is not clear. We recommend that international consensus be reached to standardize CT conduct and analysis in future emphysema studies.
Acknowledgments
The authors would like to thank Peter Nightingale, the statistician responsible for reviewing the meta-analyses, and Sue Bayliss for her assistance with search terms. This study was funded by a non-commercial grant from Grifols Biotherapeutics.
Author contributions
AMT designed the review question; DC was the first reviewer, responsible for all data gathering, extraction and analysis. AMT was the primary independent reviewer, with bias and quality of data extraction reviewed by MR, MK and EVL. All authors contributed toward data analysis, drafting and revising the paper and agree to be accountable for all aspects of the work.
Disclosure
AMT has received honoraria, research grants or educational grants from or acted as an investigator in trials for Boehringer Ingelheim, Novartis, Chiesi, GSK, AstraZeneca and Pfizer. The authors report no other conflicts of interest in this work.
References
Turner AM, Tamasi L, Schleich F, et al. Clinically relevant subgroups in COPD and asthma. Eur Respir Rev. 2015;24(136):283–298. | ||
Hruban RH, Meziane MA, Zerhouni EA, et al. High resolution computed tomography of inflation-fixed lungs. Pathologic-radiologic correlation of centrilobular emphysema. Am Rev Respir Dis. 1987;136(4):935–940. | ||
Parr DG, Stoel BC, Stolk J, Stockley RA. Pattern of emphysema distribution in alpha1-antitrypsin deficiency influences lung function impairment. Am J Respir Crit Care Med. 2004;170(11):1172–1178. | ||
Müller NL, Staples CA, Miller RR, Abboud RT. “Density Mask”. An objective method to quantitate emphysema using computed-tomography. Chest. 1988;94(4):782–787. | ||
Diaz AA, Valim C, Yamashiro T, et al. Airway count and emphysema assessed by chest CT imaging predicts clinical outcome in smokers. Chest. 2010;138(4):880–887. | ||
Camiciottoli G, Bartolucci M, Maluccio NM, et al. Spirometrically gated high-resolution CT findings in COPD: lung attenuation vs lung function and dyspnea severity. Chest. 2006;129(3):558–564. | ||
Gierada DS, Bierhals AJ, Choong CK, et al. Effects of CT section thickness and reconstruction kernel on emphysema quantification relationship to the magnitude of the CT emphysema index. Acad Radiol. 2010;17(2):146–156. | ||
Uppaluri R, Mitsa T, Sonka M, Hoffman EA, McLennan G. Quantification of pulmonary emphysema from lung computed tomography images. Am J Respir Crit Care Med. 1997;156(1):248–254. | ||
Dirksen A, Dijkman JH, Madsen F, et al. A randomized clinical trial of alpha(1)-antitrypsin augmentation therapy. Am J Respir Crit Care Med. 1999;160(5 Pt 1):1468–1472. | ||
Crapo J SE. COPDGene. COPD genetic epidemiology. Available from: www.copdgene.org. 2014. Accessed January 08, 2018. | ||
Higgins JPT, Green S. Cochrane Handbook for Systematic Reviews of Interventions Version 5.1.0. The Cochrane Collaboration; 2011. | ||
Whiting PF, Rutjes AW, Westwood ME, et al; QUADAS-2 Group. QUADAS-2: a revised tool for the quality assessment of diagnostic accuracy studies. Ann Intern Med. 2011;155(8):529–536. | ||
Zeng X, Zhang Y, Kwong JS, et al. The methodological quality assessment tools for preclinical and clinical studies, systematic review and meta-analysis, and clinical practice guideline: a systematic review. J Evid Based Med. 2015;8(1):2–10. | ||
Field AP. Is the meta-analysis of correlation coefficients accurate when population correlations vary? Psychol Methods. 2005;10(4):444–467. | ||
Park TS, Lee JS, Seo JB, et al; KOLD Study Group. Study design and outcomes of Korean Obstructive Lung Disease (KOLD) cohort study. Tuberc Respir Dis (Seoul). 2014;76(4):169–174. | ||
Kim SS, Seo JB, Lee HY, et al. Chronic obstructive pulmonary disease: lobe-based visual assessment of volumetric CT by using standard images-comparison with quantitative CT and pulmonary function test in the COPDGene study. Radiology. 2013;266(2):626–635. | ||
Mohamed Hoesein FA, de Jong PA, Lammers JW, et al. Contribution of CT quantified emphysema, air trapping and airway wall thickness on pulmonary function in male smokers with and without COPD. COPD. 2014;11(5):503–509. | ||
Hong Y, Chae EJ, Seo JB, et al. Contributors of the severity of airflow limitation in COPD patients. Tuberc Respir Dis. 2012;72(1):8–14. | ||
Aziz ZA, Wells AU, Desai SR, et al. Functional impairment in emphysema: contribution of airway abnormalities and distribution of parenchymal disease. AJR Am J Roentgenol. 2005;185(6):1509–1515. | ||
Mohamed Hoesein FA, van Rikxoort E, van Ginneken B, et al. Computed tomography-quantified emphysema distribution is associated with lung function decline. Eur Respir J. 2012;40(4):844–850. | ||
Mohamed Hoesein FA, de Hoop B, Zanen P, et al. CT-quantified emphysema in male heavy smokers: association with lung function decline. Thorax. 2011;66(9):782–787. | ||
Mohamed Hoesein FA, de Jong PA, Lammers JW, et al. Airway wall thickness associated with forced expiratory volume in 1 second decline and development of airflow limitation. Eur Respir J. 2015;45(3):644–651. | ||
Stolk J, Ng WH, Bakker ME, et al. Correlation between annual change in health status and computer tomography derived lung density in subjects with alpha1-antitrypsin deficiency. Thorax. 2003;58(12):1027–1030. | ||
Dowson LJ, Guest PJ, Hill SL, Holder RL, Stockley RA. High-resolution computed tomography scanning in alpha1-antitrypsin deficiency: relationship to lung function and health status. Eur Respir J. 2001;17(6):1097–1104. | ||
Barjaktarevic I, Springmeyer S, Gonzalez X, Sirokman W, Coxson HO, Cooper CB. Diffusing capacity for carbon monoxide correlates best with tissue volume from quantitative CT scanning analysis. Chest. 2015;147(6):1485–1493. | ||
Motohashi N, Kimura K, Ishii T, et al. Emphysema on imaging is associated with quality of life in elderly patients with chronic obstructive pulmonary disease. Geriatr Gerontol Int. 2010;10(1):17–24. | ||
de Torres JP, Bastarrika G, Zagaceta J, et al. Emphysema presence, severity, and distribution has little impact on the clinical presentation of a cohort of patients with mild to moderate COPD. Chest. 2011;139(1):36–42. | ||
Martinez CH, Chen YH, Westgate PM, et al; COPDGene Investigators. Relationship between quantitative CT metrics and health status and BODE in chronic obstructive pulmonary disease. Thorax. 2012;67(5):399–406. | ||
Martinez FJ, Curtis JL, Sciurba F, et al; National Emphysema Treatment Trial Research Group. Sex differences in severe pulmonary emphysema. Am J Respir Crit Care Med. 2007;176(3):243–252. | ||
Gietema HA, Edwards LD, Coxson HO, Bakke PS; ECLIPSE Investigators. Impact of emphysema and airway wall thickness on quality of life in smoking-related COPD. Respir Med. 2013;107(8): 1201–1209. | ||
Camiciottoli G, Bigazzi F, Bartolucci M, et al. BODE-index, modified BODE-index and ADO-score in chronic obstructive pulmonary disease: relationship with COPD phenotypes and CT lung density changes. COPD. 2012;9(3):297–304. | ||
Haruna A, Oga T, Muro S, et al. Relationship between peripheral airway function and patient-reported outcomes in COPD: a cross-sectional study. BMC Pulm Med. 2010;10:10. | ||
Haruna A, Muro S, Nakano Y, et al. CT scan findings of emphysema predict mortality in COPD. Chest. 2010;138(3):635–640. | ||
Martinez FJ, Foster G, Curtis JL, et al; NETT Research Group. Predictors of mortality in patients with emphysema and severe airflow obstruction. Am J Respir Crit Care Med. 2006;173(12):1326–1334. | ||
Dawkins P, Wood A, Nightingale P, Stockley R. Mortality in alpha-1-antitrypsin deficiency in the United Kingdom. Respir Med. 2009;103(10):1540–1547. | ||
Yoo JW, Hong Y, Seo JB, et al. Comparison of clinico-physiologic and CT imaging risk factors for COPD exacerbation. J Korean Med Sci. 2011;26(12):1606–1612. | ||
Cheng T, Wan HY, Cheng QJ, et al. Obvious emphysema on computed tomography during an acute exacerbation of chronic obstructive pulmonary disease predicts a poor prognosis. Intern Med J. 2015;45(5):517–526. | ||
Vijayasaratha K, Stockley RA. Relationship between frequency, length, and treatment outcome of exacerbations to baseline lung function and lung density in alpha-1 antitrypsin-deficient COPD. Int J Chron Obstruct Pulmon Dis. 2012;7:789–796. | ||
McAllister DA, Ahmed FS, Austin JH, et al. Emphysema predicts hospitalisation and incident airflow obstruction among older smokers: a prospective cohort study. PLoS One. 2014;9(4):e93221. | ||
Han MK, Kazerooni EA, Lynch DA, et al; COPDGene Investigators. Chronic obstructive pulmonary disease exacerbations in the COPDGene study: associated radiologic phenotypes. Radiology. 2011;261(1):274–282. | ||
Chapman KR, Burdon JG, Piitulainen E, et al; RAPID Trial Study Group. Intravenous augmentation treatment and lung density in severe α1 antitrypsin deficiency (RAPID): a randomised, double-blind, placebo-controlled trial. Lancet. 2015;386(9991):360–368. | ||
Dirksen A, Piitulainen E, Parr DG, et al. Exploring the role of CT densitometry: a randomised study of augmentation therapy in alpha1-antitrypsin deficiency. Eur Respir J. 2009;33(6):1345–1353. | ||
Parr DG, Dirksen A, Piitulainen E, Deng C, Wencker M, Stockley RA. Exploring the optimum approach to the use of CT densitometry in a randomised placebo-controlled study of augmentation therapy in alpha 1-antitrypsin deficiency. Respir Res. 2009;10:75. | ||
Edgar RG, Patel M, Bayliss S, Crossley D, Sapey E, Turner AM. Treatment of lung disease in alpha-1 antitrypsin deficiency: a systematic review. Int J Chron Obstruct Pulmon Dis. 2017;12:1295–1308. | ||
Roth MD, Connett JE, D’Armiento JM, et al; FORTE Study Investigators. Feasibility of retinoids for the treatment of emphysema study. Chest. 2006;130(5):1334–1345. | ||
Stolk J, Cooper BG, Stoel B, et al. Retinoid treatment of Emphysema in patients on the Alpha-1 International Registry. The REPAIR study: study design, methodology and quality control of study assessments. Ther Adv Respir Dis. 2010;4(6):319–332. | ||
Lee JH, Lee YK, Kim EK, et al. Responses to inhaled long-acting beta-agonist and corticosteroid according to COPD subtype. Respir Med. 2010;104(4):542–549. | ||
Lee JS, Huh JW, Chae EJ, et al. Predictors of pulmonary function response to treatment with salmeterol/fluticasone in patients with chronic obstructive pulmonary disease. J Korean Med Sci. 2011;26(3):379–385. | ||
Shaker SB, Dirksen A, Ulrik CS, et al. The effect of inhaled corticosteroids on the development of emphysema in smokers assessed by annual computed tomography. COPD. 2009;6(2):104–111. | ||
Washko GR, Criner GJ, Mohsenifar Z, et al. Computed tomographic-based quantification of emphysema and correlation to pulmonary function and mechanics. COPD. 2008;5(3):177–186. | ||
Gøtzsche PC, Johansen HK. Intravenous alpha-1 antitrypsin augmentation therapy for treating patients with alpha-1 antitrypsin deficiency and lung disease. Cochrane Database Syst Rev. 2010;(7):CD007851. | ||
Ru Zhao Y, Xie X, de Koning HJ, Mali WP, Vliegenthart R, Oudkerk M. NELSON lung cancer screening study. Cancer Imaging. 2011;11 Spec No A:S79–S84. | ||
Regan EA, Hokanson JE, Murphy JR, et al. Genetic epidemiology of COPD (COPDGene) study design. COPD. 2010;7(1):32–43. | ||
Wise RA, Drummond MB. The role of NETT in emphysema research. Proc Am Thorac Soc. 2008;5(4):385–392. | ||
Kemerink GJ, Kruize HH, Lamers RJ, van Engelshoven JM. Density resolution in quantitative computed tomography of foam and lung. Med Phys. 1996;23(10):1697–1708. | ||
Kemerink GJ, Kruize HH, Lamers RJ, van Engelshoven JM. Density resolution in quantitative computed tomography of foam and lung. Med Phys. 1996;23(10):1697–1708. | ||
Wielputz MO, Bardarova D, Weinheimer O, et al. Variation of densitometry on computed tomography in COPD – influence of different software tools. PLoS One. 2014;9(11):e112898. | ||
Kim EY, Seo JB, Lee HJ, et al. Detailed analysis of the density change on chest CT of COPD using non-rigid registration of inspiration/expiration CT scans. Eur Radiol. 2015;25(2):541–549. | ||
Nambu A, Zach J, Schroeder J, et al. Relationships between diffusing capacity for carbon monoxide (DLCO), and quantitative computed tomography measurements and visual assessment for chronic obstructive pulmonary disease. Eur J Radiol. 2015;84(5):980–985. | ||
Chae EJ, Seo JB, Song JW, et al. Slope of emphysema index: an objective descriptor of regional heterogeneity of emphysema and an independent determinant of pulmonary function. AJR Am J Roentgenol. 2010;194(3):W248–W255. | ||
Diaz S, Casselbrant I, Piitulainen E, et al. Validity of apparent diffusion coefficient hyperpolarized 3He-MRI using MSCT and pulmonary function tests as references. Eur J Radiol. 2008;71(2):257–263. | ||
O’Donnell RA, Peebles C, Ward JA, et al. Relationship between peripheral airway dysfunction, airway obstruction, and neutrophilic inflammation in COPD. Thorax. 2004;59(10):837–842. | ||
Gevenois PA, De Vuyst P, Sy M, et al. Pulmonary emphysema: quantitative CT during expiration. Radiology. 1996;199(3):825–829. | ||
Baldi S, Miniati M, Bellina CR, et al. Relationship between extent of pulmonary emphysema by high-resolution computed tomography and lung elastic recoil in patients with chronic obstructive pulmonary disease. Am J Respir Crit Care Med. 2001;164(4):585–589. | ||
Saitoh T, Koba H, Shijubo N, Tanaka H, Sugaya F. Lobar distribution of emphysema in computed tomographic densitometric analysis. Invest Radiol. 2000;35(4):235–243. | ||
Schroeder JD, McKenzie AS, Zach JA, et al. Relationships between airflow obstruction and quantitative CT measurements of emphysema, air trapping, and airways in subjects with and without chronic obstructive pulmonary disease. AJR Am J Roentgenol. 2013;201(3): W460–W470. | ||
Bastarrika G, Wisnivesky JP, Pueyo JC, Diaz L, Arraiza M, Villanueva A, et al. Low-dose volumetric computed tomography for quantification of emphysema in asymptomatic smokers participating in an early lung cancer detection trial. 2009;24(3):206–211. | ||
Paoletti M, Cestelli L, Bigazzi F, Camiciottoli G, Pistolesi M. Chronic obstructive pulmonary disease: pulmonary function and CT lung attenuation do not show linear correlation. Radiology. 2015;276(2): 571–578. | ||
Orlandi I, Moroni C, Camiciottoli G, et al. Chronic obstructive pulmonary disease: thin-section CT measurement of airway wall thickness and lung attenuation. Radiology. 2005;234(2):604–610. | ||
Nishio M, Matsumoto S, Koyama H, Ohno Y, Sugimura K. Airflow limitation in chronic obstructive pulmonary disease: ratio and difference of percentage of low-attenuation lung regions in paired inspiratory/expiratory computed tomography. Acad Radiol. 2014;21(10):1262–1267. | ||
Shaker SB, Maltbaek N, Brand P, Haeussermann S, Dirksen A. Quantitative computed tomography and aerosol morphometry in COPD and alpha1-antitrypsin deficiency. Eur Respir J. 2005;25(1):23–30. | ||
Bernspang E, Diaz S, Stoel B, Wollmer P, Sveger T, Piitulainen E. CT lung densitometry in young adults with alpha-1-antitrypsin deficiency. Respir Med. 2011;105(1):74–79. | ||
Akira M, Toyokawa K, Inoue Y, Arai T. Quantitative CT in chronic obstructive pulmonary disease: inspiratory and expiratory assessment. AJR Am J Roentgenol. 2009;192(1):267–272. |
 © 2018 The Author(s). This work is published and licensed by Dove Medical Press Limited. The full terms of this license are available at https://www.dovepress.com/terms.php and incorporate the Creative Commons Attribution - Non Commercial (unported, v3.0) License.
By accessing the work you hereby accept the Terms. Non-commercial uses of the work are permitted without any further permission from Dove Medical Press Limited, provided the work is properly attributed. For permission for commercial use of this work, please see paragraphs 4.2 and 5 of our Terms.
© 2018 The Author(s). This work is published and licensed by Dove Medical Press Limited. The full terms of this license are available at https://www.dovepress.com/terms.php and incorporate the Creative Commons Attribution - Non Commercial (unported, v3.0) License.
By accessing the work you hereby accept the Terms. Non-commercial uses of the work are permitted without any further permission from Dove Medical Press Limited, provided the work is properly attributed. For permission for commercial use of this work, please see paragraphs 4.2 and 5 of our Terms.