")
Back to Journals » International Journal of General Medicine » Volume 14
CSMD1 Mutation Related to Immunity Can Be Used as a Marker to Evaluate the Clinical Therapeutic Effect and Prognosis of Patients with Esophageal Cancer
Authors Fan X , Song J, Fan Y, Li J, Chen Y, Zhu H, Zhang Z
Received 13 September 2021
Accepted for publication 18 October 2021
Published 23 November 2021 Volume 2021:14 Pages 8689—8710
DOI https://doi.org/10.2147/IJGM.S338284
Checked for plagiarism Yes
Review by Single anonymous peer review
Peer reviewer comments 2
Editor who approved publication: Dr Scott Fraser
Xin Fan,1 Jianxiong Song,1 Yating Fan,1 Jiaqi Li,2 Yutao Chen,1 Huanhuan Zhu,1 Zhiyuan Zhang1
1Department of Otolaryngology-Head and Neck Surgery, The First Affiliated Hospital of Nanchang University, The First Clinical Medical College of Nanchang University, Nanchang, 330000, People’s Republic of China; 2School of Stomatology, Nanchang University, Nanchang, 330000, People’s Republic of China
Correspondence: Zhiyuan Zhang
Department of Otolaryngology-Head and Neck Surgery, The First Affiliated Hospital of Nanchang University, 17 Yongwaizheng Street, Donghu District, Nanchang, People’s Republic of China
Tel +8613870901646
Email [email protected]
Introduction: As a highly aggressive tumor with a poor prognosis, esophageal cancer (ESCA)’s relationship with gene mutations is unclear. Therefore, we tried to explore the role of gene mutation in ESCA progression and its relationship with immune response, clinical treatment, and prognosis.
Methods: In addition to copy number variation (CNV) situations of common genes obtained from 2 public databases, the relationship between mutations and prognosis/tumor mutational burden (TMB) was also analyzed. Kaplan–Meier survival and Cox regression analysis were used to identify the CSMD1 mutation status as an independent predictor of prognosis. We also enriched related functions and pathways. Next, the relationship between 22 immune cells and CSMD1 mutation status was analyzed. In addition to the differences in the expression levels of immune checkpoint inhibitors (ICIs)-related genes between the high TMB and low TMB groups, the differences in the expression levels of ICIs/m6a/multi-drug resistance-related genes and the sensitivity of three chemotherapeutic drugs between CSMD1 mutant and the wild group were also compared. In addition to differences and prognostic analysis of CSMD1 expression, the correlation analysis between the expression of these genes/immune cells and the expression of CSMD1 was also performed. Finally, a nomogram that could efficiently and conveniently predict the survival probability of ESCA patients was constructed and verified.
Results: We obtained 17 frequently mutated genes distribution. Mutation and loss of CSMD1 are frequent in ESCA. Only CSMD1 mutation can be used as an independent predictor of poor prognosis. Patients in the high TMB group have a lower survival probability. Wild CSMD1 may be involved in immune-related pathways. More helper T cells and fewer resting state dendritic cells were found in the CSMD1 mutant group. The PD-1 expression in the high TMB group showed higher. Paclitaxel sensitivity and ABCC1 expression were higher in the wild CSMD1 group. Most cancers show differential expression of CSMD1. Except for the prognosis of ESCA, the expression of CSMD1 is related to immune cell content and the expression of ICIs/m6a/multi-drug resistance related genes.
Discussion: CSMD1 mutation could be used as an immune-related biomarker to predict prognosis and treatment effect of paclitaxel. Mutation and loss of CSMD1 may promote the progression of ESCA.
Keywords: esophageal cancer, CSMD1, TMB, tumor-infiltrating immune cells, prognosis
Introduction
Esophageal cancer (ESCA) is one of the cancers with the highest morbidity and mortality in the world.1 It is the most aggressive cancer among gastrointestinal malignancies, accounting for 2% of all malignancies. ESCA is divided into two histologic subtypes: esophageal squamous cell carcinoma and esophageal adenocarcinoma.2 These two types of esophageal cancer have different histological and pathological characteristics. Esophageal squamous cell carcinoma is more common in East Asia, East and South Africa, and Southern Europe. In contrast, esophageal adenocarcinoma has a higher incidence in North America and other parts of Europe. Esophageal squamous cell carcinoma accounts for more than 95% of ESCA patients in China. Now esophageal resection is preferred for early-stage ESCA. However, advanced ESCA is often difficult to cure, and this method is highly invasive and easy to cause high morbidity and mortality.3 Therefore, the prognosis of advanced ESCA is poor, with a five-year survival rate of 15–25%. To improve the survival rate after resection of ESCA, adjuvant therapy including radiotherapy and chemotherapy has been introduced clinically.4 But radiotherapy for ESCA may seriously cause pulmonary complications and affect patients’ quality of life.5 In addition, due to the expression of multi-drug resistance genes, the efficacy of tumor chemotherapy is poor.6 Therefore, it is of great significance to accurately predict the clinical outcome and prognosis of patients with ESCA after esophagectomy and adjuvant chemotherapy. Therefore, it is very necessary to establish a nomogram combined model to accurately predict the individual survival rate of patients with adjuvant chemotherapy after esophagectomy.
The interaction of PD-L1/PD-1 can usually inhibit the activation efficiency of T cells and induce cell apoptosis. Thus, PD-1 and PD-L1 inhibitors enhanced the immune response and reduced mortality by 45% compared with chemotherapy.7 In 2020, two PD-1 immune checkpoint inhibitor drugs (pembrolizumab and carrelizumab) were approved in China for the second-line treatment of metastatic ESCA. And related clinical research results showed that compared with European and American populations, pembrolizumab treatment brings more survival benefits to Chinese and Asian patients.8
Among the biomarkers studied in recent years, tumor mutation burden (TMB), a biomarker reflecting somatic mutation, is considered a good biomarker for predicting immune checkpoint inhibitors (ICIs) response.9 In melanoma, non-small cell lung cancer, urothelial carcinoma, and renal cell carcinoma,10 TMB response rate is higher in patients with high TMB than in patients with low TMB,11 which indicates high TMB is positively correlated with the efficacy of immunotherapy. In addition, it is found that TMB is beneficial to the expression of neoantigens and can kill cancer cells by activating T lymphocyte proliferation in further studies.12 The interactions between T cells, dendritic cells, macrophages and tumor cells in the tumor microenvironment and the inhibition of ligand-receptor interactions strictly regulate T cell activation. And the DC-mediated immune response can be achieved by enhancing the cytotoxic T lymphocyte (CTL) response to a variety of antigens.13 Immune infiltrating cells have played an increasingly important role in anti-tumor immunity. Cancer stem cells are considered to be an important factor in resisting multi-modal therapy. Cancer stem cells have many specific characteristics such as drug resistance, self-renewal and tumorigenicity.14,15
Not only the distribution of mutations in ESCA but also the influence of gene mutations on ESCA progression, the clinical treatment and prognosis of patients are still unclear. Therefore, in this study, we will use the somatic mutation data in the The Cancer Genome Atlas (TCGA) dataset and the International Cancer Genome Consortium (ICGC) dataset to summarize the mutations in ESCA patients. We will also identify some common mutant genes in both cohorts and summarize these genes’ copy number variation (CNV) status. The interaction between them has also been further analyzed. Other than the relationship between these genes mutations and TMB, we also analyzed the relationship between TMB and prognosis. The mutant gene that can independently predict the prognosis of ESCA patients was screened out as biomarkers to evaluate their predictive value for immune infiltrating cell content, Cell stemness, immunotherapy response, chemotherapeutic drug sensitivity and the multi-drug resistance of chemotherapeutics. Finally, we combined our and previous results to explore the possible role of CSMD1 mutation and loss in ESCA development.
Materials and Methods
The Data Source
The workflow of the study is shown in Figure 1. Other than the somatic mutation data of Chinese ESCA patients from the ICGC database (daco.icgc.org/), the RNA sequencing, somatic mutations, copy number variations (CNV) and corresponding clinical data of American ESCA patients from the TCGA database (portal.gdc.cancer.gov/) were downloaded On April 15, 2021. Invalid samples with no survival information were excluded. Data is extracted and collated by Perl software for further analysis in R software. Table 1 shows the clinical characteristics of the ESCA samples in TCGA. Since the local ethics committee had already approved the data from the TCGA and ICGC databases, this study did not need to be approved again by the local medical ethics committee.
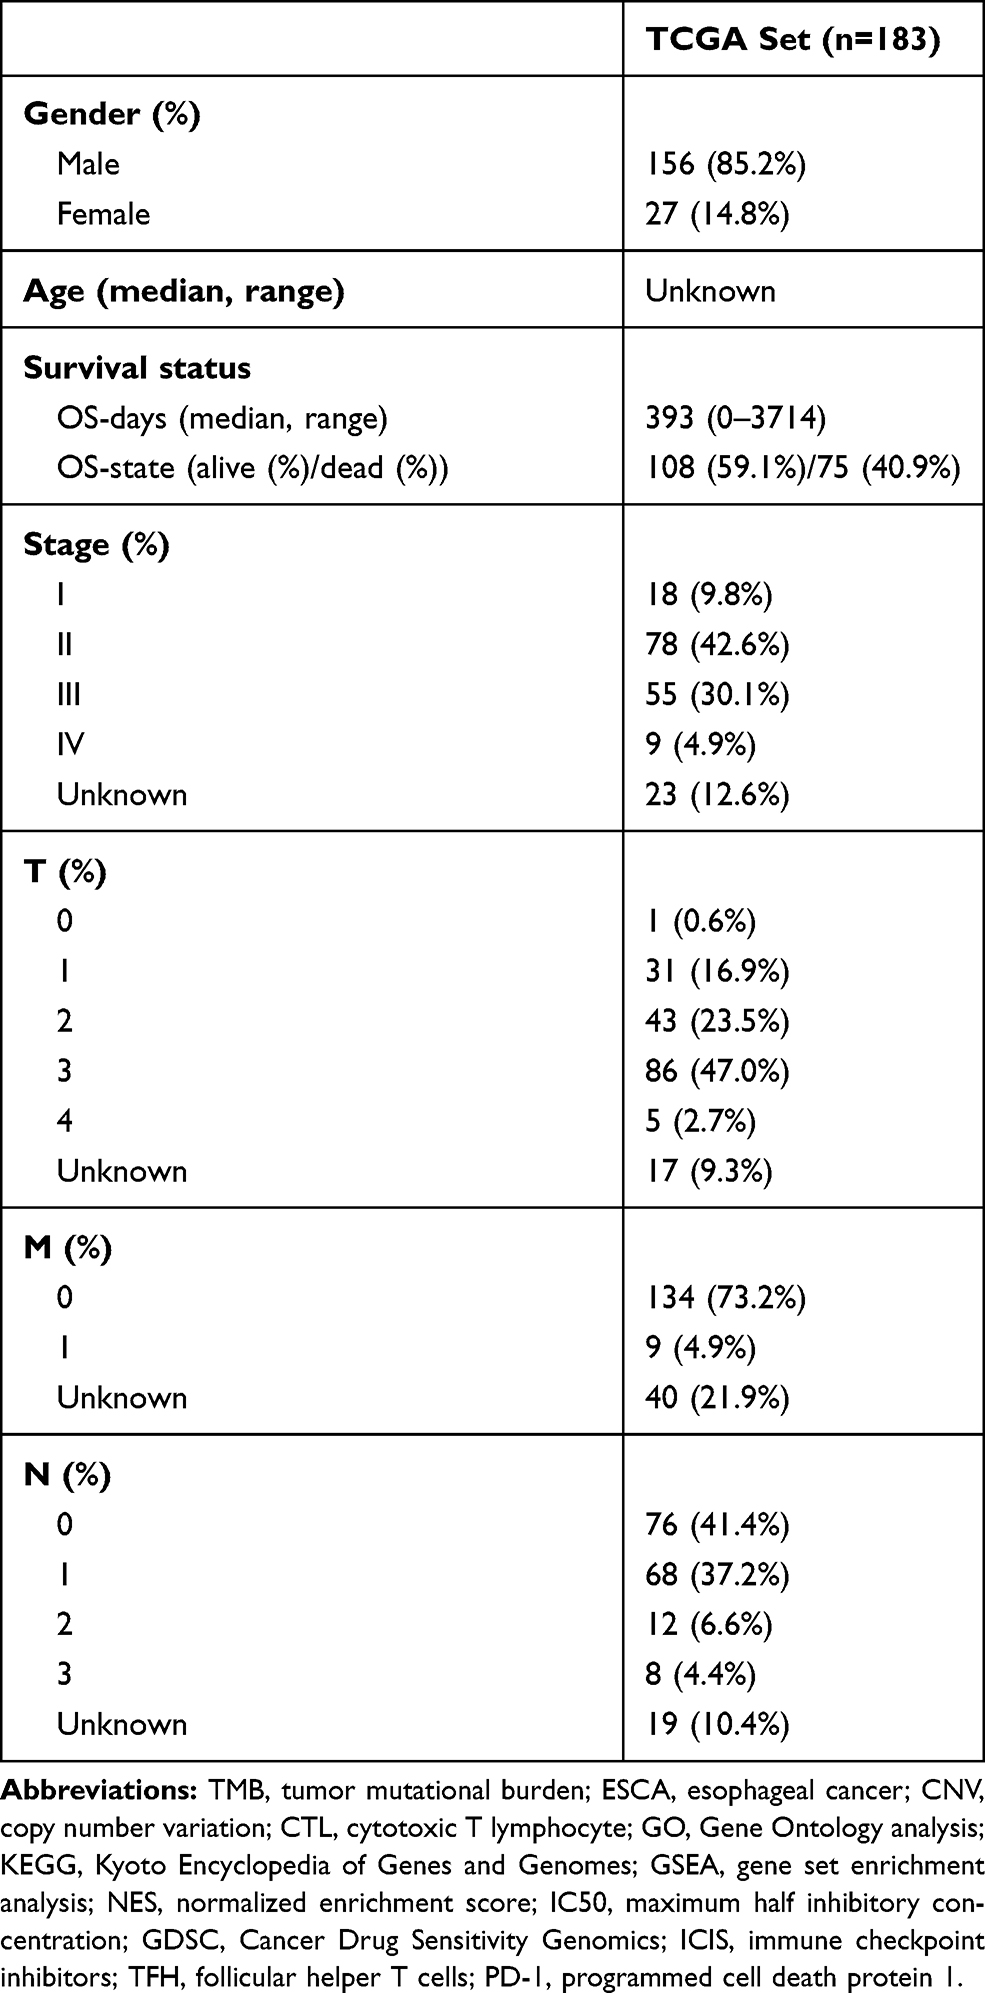 |
Table 1 Clinical Characteristics of the ESCA Samples in TCGA |
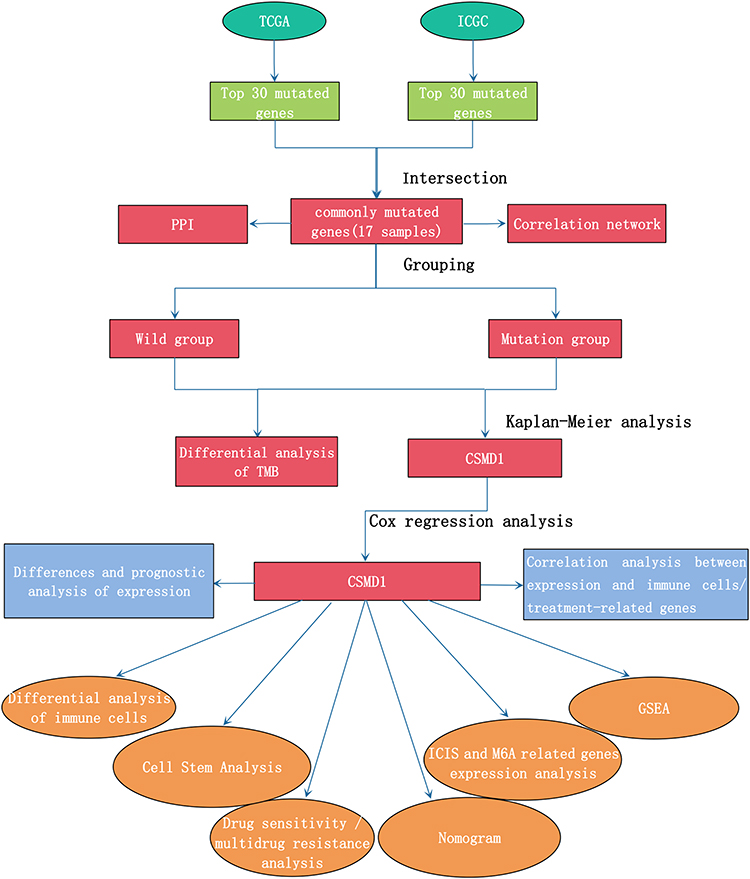 |
Figure 1 Workflow chart of this research. |
Somatic Mutation and CNV Landscape in ESCA
Perl obtained the top 30 genes with the highest mutation frequency in ESCA samples from TGCA and IGGC databases. After excluding synonymous mutation data, 30 gene states of all samples were labeled as wild or mutant. The R package “GenVisR” was used to visualize the mutation of these genes. The top 30 genes in the two databases were intersected to obtain the common genes. The CNV data of 17 common genes in 185 ESCA samples were used in our analysis. After statistics of the CNV frequency of these genes, the corresponding results were visualized. The position of the CNV changes of these 17 genes on the chromosome was also visualized in the circle diagram.
Construction of Regulatory Networks of 17 Common Genes
The STRING database produced a protein-protein interaction network (PPI) consisting of 12 common genes after the minimum required interaction score was set at confidence (0.15), famous for searching known protein interaction relationships online. Besides, R package “reshape2” and “igraph” were used for correlation analysis of 12 genes and visualization of related networks.
Analysis of TMB Differences Between Wild Samples and Mutant Samples
Tumor mutation burden (TMB) is defined as mutation per Megabyte of tumor tissue.16 (Only mutations that cause changes in amino acids, such as genetic coding errors, base substitutions, substitutions, and gene insertion or deletion errors, can be used by Perl to calculate TMB.). According to the mutation status of 17 genes, ESCA patients from the TCGA cohort were divided into wild and mutant groups, respectively. TMB differences between wild and mutated samples based on each common gene were assessed using the R-package “ggpubr”. After dividing all patients into high and low TMB groups according to the optimal cutoff value of TMB, KM analysis was used to compare the survival differences between the two groups to explore the impact of TMB on survival.
Obtain Mutated Genes Associated with Prognosis
Kaplan–Meier has compared survival differences between cases of wild-type and each shared gene mutation. Univariate and multivariate Cox regression analyses of variables from TCGA (sex, T, M, N, mutational status of common genes) were performed to determine whether the mutational status of common genes could be used as an independent prognostic indicator. After Kaplan–Meier and Cox regression analysis, only CSMD1 mutation status showed a statistical difference (P < 0.05).
GO and KEGG Enrichment Analysis
Gene set enrichment analysis (GSEA) software (V4.1.0) was used to perform Gene ontology analysis (GO) and Kyoto encyclopedia of genes and genomes (KEGG) enrichment analysis based on CSMD1 mutation and expression matrix data“c2.cp.kegg.v7.4.symbols.gmt” and “c5.go.v7.4.symbols.gmt” was selected as the gene sets database. Normalized enrichment score (NES) was calculated by setting the permutation value to 1000, and significant enrichment pathways and functions were screened using a P-value <0.05 or an FDR Q value <0.05.17
Difference and Correlation Analysis of Tumor-Infiltrating Immune Cells
The filtering condition was set to p <0.05. The Cibersort deconvolution algorithm was used to obtain matrix data of 22 immune cell ratios for each tumor sample based on RNA sequencing data.18 The R software package “Corrplot” was used to visualize the matrix data and perform correlation analysis on the immune cells and visualize the results. According to the mutation status of CSMD1, ESCA samples from TCGA were divided into wild and mutant groups. The difference analysis of infiltrated immune cells between the two groups was performed with the R package “Limma” and visualized with the R package “Vioplot”.
Cell Stem Analysis
We downloaded the accurately calculated tumor cell stemness index (mDNAsi and mRNAsi) from related research. The stemness index in the research was calculated based on the OCLR algorithm trained on the types of stem cells (ESCs, embryonic stem cells; iPSCs, induced pluripotent stem cells) and their differentiated ectoderm, mesoderm and endoderm progenitor cells.19 OCLR-based transcriptomic and epigenetic signatures were applied to TCGA datasets to calculate the mRNAsi and mDNAsi.19 Each mDNAsi/mRNAsi ranges from low (zero) to high (one).19 We firstly compared the differences of mRNAsi/mRNAsi between ESCA samples and normal adjacent samples, respectively. To explore the correlation between the CSMD1 mutant status and the mRNAsi/mRNAsi, we used the Wilcoxon rank-sum test to compare the differences in the mRNAsi/mRNAsi between the CSMD1 mutant group and the CSMD1 wild group. In addition, the Wilcoxon rank-sum test was used to compare further the difference in mRNAsi/mRNAsi between different subgroups of each clinicopathological feature.
Differential Expression Analysis of ICIS-Related Genes, m6a-Related Genes, Multi-Drug Resistance Genes of Chemotherapy Drugs and Predicted IC50 of Chemotherapeutics
The R package “GGPUBR” was used to compare the differences in the expression levels of ICIS related genes such as PDCD1 (PD-1), CD40, CD96, CTLA4, HAVCR2, LAG3 and TIGIT not only between the CSMD1 mutation and the wild population but also between the high TMB and low TMB groups. In addition, we also compared the differences in the expression of 12 common m6a-related genes and multi-drug resistance genes of chemotherapy drugs between the CSMD1 mutant group and the CSMD1 wild group. R package “pRophetic” was used to predict the maximum half inhibitory concentration (IC50) of the chemotherapy drugs recommended by the NCCN guidelines for ESCA patients for each sample. The cell line expression data in Cancer Drug Sensitivity Genomics (GDSC) database and RNA-sequencing transcriptome data in the TCGA database were used to construct the ridge regression model to predict the IC50 of the drug in this R package.20 We also compared the IC50 differences between the CSMD1 mutation and the wild population of these drugs.
Construction and Verification of the Nomogram
To create a quantitative tool more suitable for clinical prediction of 1,2, and 3-year survival in ESCA patients, a multivariate Cox regression model with CSMD1 mutation status and clinical factors was constructed and was visualized in the R package “rms”. The calibration curves were used to evaluate the accuracy of the survival prediction in the nomogram by comparing the predicted and actual survival. Multi indicator ROC curves were also used to evaluate the accuracy of the nomogram in predicting survival. In addition, we plotted nomogram ROC curves for 1-year, 2-year and 3-year survival probability and compared nomogram ROC curves with CSMD1 mutations and other clinical factors to verify the nomogram’s best prognostic performance.
CSMD1 Expression Difference and Prognostic Analysis
The RNA sequencing data of 18 human cancers were obtained from the UCSC Xena (https://xena.ucsc.edu/) database. These annotated RNA sequencing data were used for the differential analysis of CSMD1 expression between cancer tissues and normal tissues. The results of the difference analysis were displayed in a histogram. In addition, we divided the esophageal cancer samples into high expression and low expression groups according to the optimal cutoff value of CSMD1 expression. The Kaplan–Meier survival curve was used to visualize the difference in survival of esophageal cancer patients between the two groups.
Correlation Analysis Between CSMD1 Expression and Immune Infiltrating Cell Scores or ICIs/m6a/Multi-Drug Resistance Related Genes
We extracted the RNA sequencing data of CSMD1 in ESCA. The correlation analysis was run between CSMD1 expression and immune cell content or ICIs/m6a/multi-drug resistance-related genes. The correlation results are visualized using bubble charts.
Statistical Analysis
R (v4.0.3) and Perl (5.32.1.1) were used for statistical analysis. The t-test or Mann–Whitney test was used to compare differences between continuous variables based on distribution characteristics, and the chi-square test or Fisher’s exact test was used to compare differences between categorical variables. Kaplan–Meier survival analysis was evaluated using the Log rank test. Univariate and multivariate Cox regression analyses were used to determine independent prognostic factors. Multivariate Cox regression was used to construct the nomogram. Receiver operating characteristic (ROC) curves were used to evaluate the predictive power of each factor. For all comparisons, an FDR Q or P value <0.05 was considered statistically significant.
Results
Overview of Somatic Mutations and CNV in Esophageal Carcinoma
Firstly, relevant data of 183 American ESCA samples from TCGA and 331 Chinese ESCA samples from ICGC were downloaded for subsequent analysis. The cumulative mutation frequency of each gene was counted and arranged in descending order, and the top 30 mutated genes with mutation frequency were selected. We found that the common type in American and Chinese patients was missense mutation. The five most frequently mutated genes from the TCGA cohort were TP53 (77.0%), TTN (39.3%), MUC16 (20.8%), CSMD3 (15.8%) and SYNE1 (15.3%) (Figure 2A). The five most frequently mutated genes from the ICGC cohort were TP53 (67.4%), TTN (24.8%), MUC16 (13.9%), CSMD3 (11.8%) and Notch1 (11.8%) (Figure 2B). We crossed the 30 genes with the highest mutation rates in the two cohorts. High mutation cross gene has 17 respectively is TP53, TTN, MUC16, CSMD3, PCLO, LRP1B, KMT2D, PIK3CA, SYNE1, RYR2, DNAH5, USH2A, PKHD1L1, FAT3, CSMD1, SPTA1 and FLG (Figure 2C). After a separate statistics on the mutations of the CSMD1 gene, it was found that the ratio of all non-silent mutations (17) and silent mutations (8) from the TCGA database was 17:8, while the ratio of all non-silent mutations (141) to silent mutations (49) in the ICGC database is 141:49. TP53 was only observed to own CNV loss (Figure 2D). Except for CSMD1, MUC16, KMT2D, and LRP1B, which have a higher frequency of CNV loss (Figure 2D), the remaining 12 genes have a higher frequency of CNV gain (Figure 2D). Figure 2E shows the corresponding positions of these 17 genes on the chromosome and the comprehensive status of CNV.
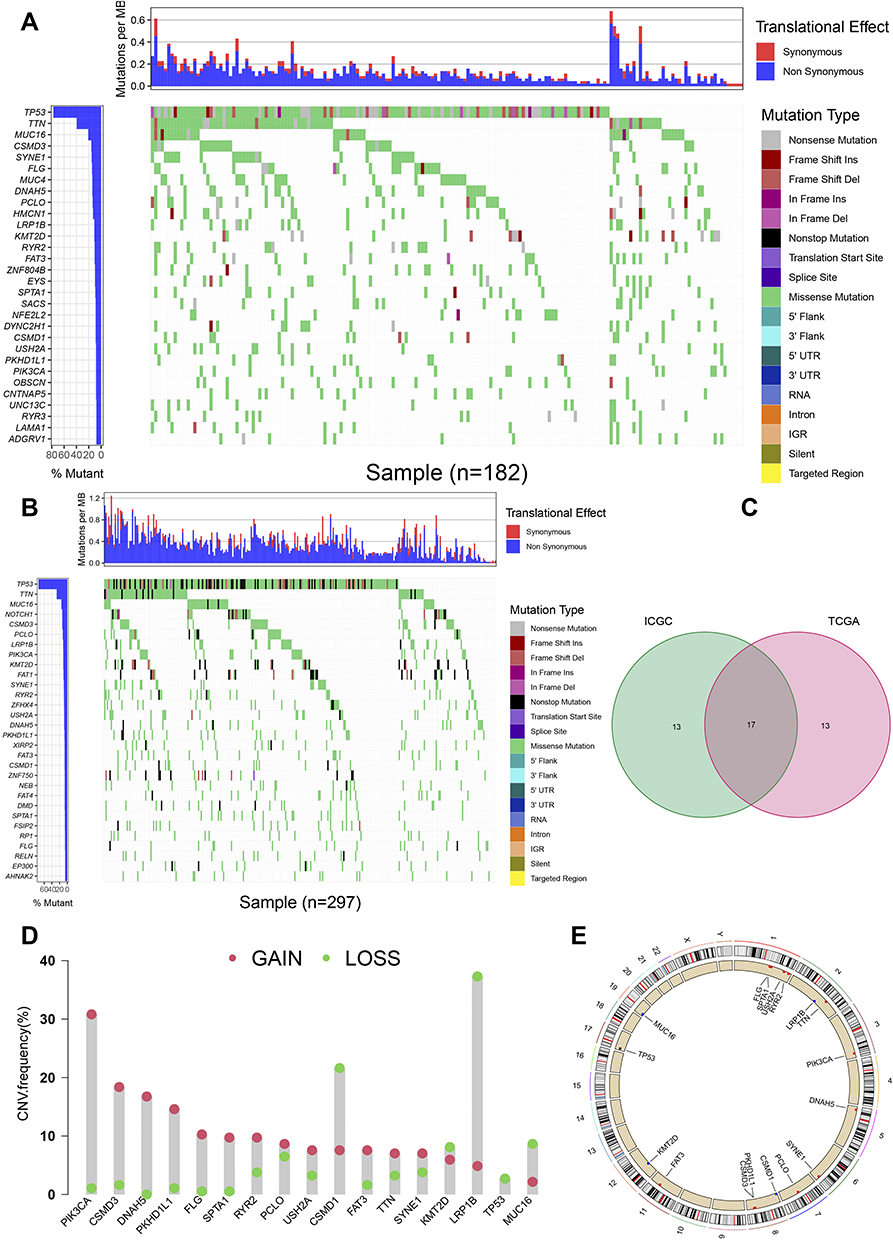 |
Figure 2 Overview of commonly mutated genes in esophageal cancer. (A) Waterfall Plot of commonly mutated genes in esophageal cancer from TCGA database. The figure on the left shows the frequency of mutations. Genes are arranged according to the frequency of mutations. The different types of mutations are shown on the right. (B) Waterfall Plot of frequently mutated genes in esophageal cancer in the ICGC cohort. (C) Venn diagram of frequently mutated genes covered by both TCGA and ICGC cohorts. (D) The frequency of CNV of 17 common genes. The green dot represents the loss of CNV, while the pink dot represents the gain of CNV. (E) The position distribution of CNV changes of these 17 genes on 23 chromosomes. |
Construction of Regulatory Networks of 17 Common Genes
Seven hub genes, including CSMD3, MUC16, SYNE1, PIK3CA, KMT2D, TP53 and TTN, were indicated in the interaction network consist of 17 PR-DE-FRGs (Figure 3A). In PPI, we also found that LRP1B, SYNE1, TP53, PIK3CA, RYR2, FAT3, PKHDL1 and other genes have protein interaction relationships with CSMD1. The correlation network diagram shows the correlation results of 12 PR-DE-FRGs with correlation (Figure 3B).
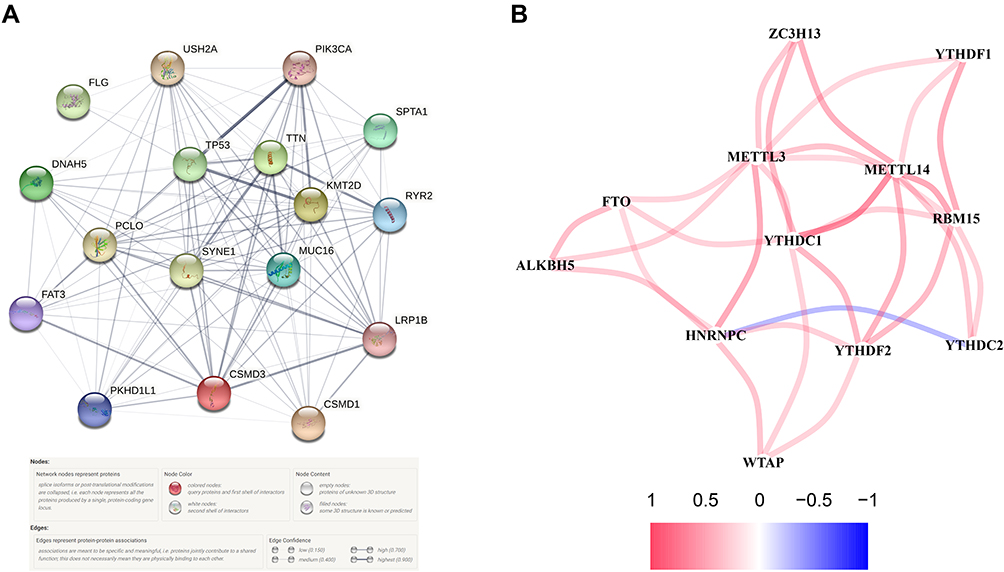 |
Figure 3 Construction of regulatory networks. (A) PPI of 17 PR-DE-FRGs in model. (B) Correlation network of 12 PR-DE-FRGs. The red connection represents a positive correlation, while the blue represents a negative correlation. |
Differences in TMB Between Wild Samples and Mutant Samples
After calculating the TMB for each TCGA sample, the TMB ranged from 0.05 to 41.5/MB, with a median of 2.26/MB. To further investigate whether these 17 common mutated genes were associated with TMB, we divided ESCA patients in the TCGA cohort into wild and mutant groups according to the mutation status of the 17 genes and calculated their TMB. Interestingly, TMB in TTN, MUC16, CSMD3, PCLO, LRP1B, SYNE1, RYR2, USH2A, CSMD1 and SPTA1 mutant groups were all higher than normal (P < 0.05, Figure 4A). And it can be observed that the survival probability of low TMB samples is significantly higher (Figure 4B).
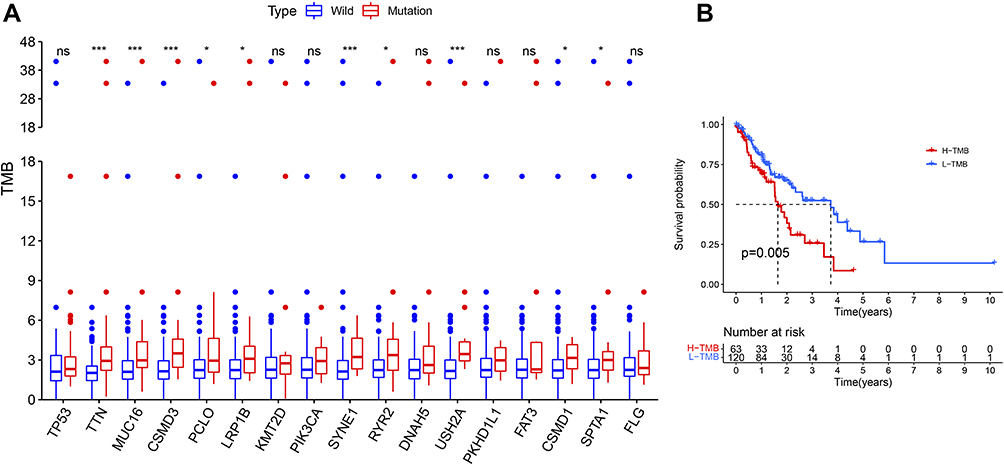 |
Figure 4 The relationship between prognosis and TMB closely related to mutations (A) Most gene mutations were associated with higher TMB. ns: p > 0.05, not statistically significant; *p < 0.05; ***p < 0.001. (B) Higher TMB associated with poor prognosis. |
Obtaining Mutated Genes Associated with Prognosis
Previous studies have shown that high TMB is positively associated with the outcome of immunotherapy. So considering the association between 17 mutated genes and TMB, we speculate that these mutated genes associated with elevated TMB are also associated with the prognosis of patients with ESCA. To this end, patients in the TCGA database were divided into two groups according to their genetic mutations: wild type and mutant type. After Kaplan–Meier analysis of survival data, it was found that only CSMD1 was associated with a negative prognosis (P<0.05) (Figure 5). Based on these results, cox regression analysis was performed to determine further whether CSMD1 mutation was an independent prognostic factor for ESCA. After adjustment for survival-related clinical information and TMB obtained through univariate Cox regression analysis, the CSMD1 mutation remained significantly associated with overall survival, suggesting that the CSMD1 mutation is an independent predictor of prognosis in ESCA patients (Figure 6).
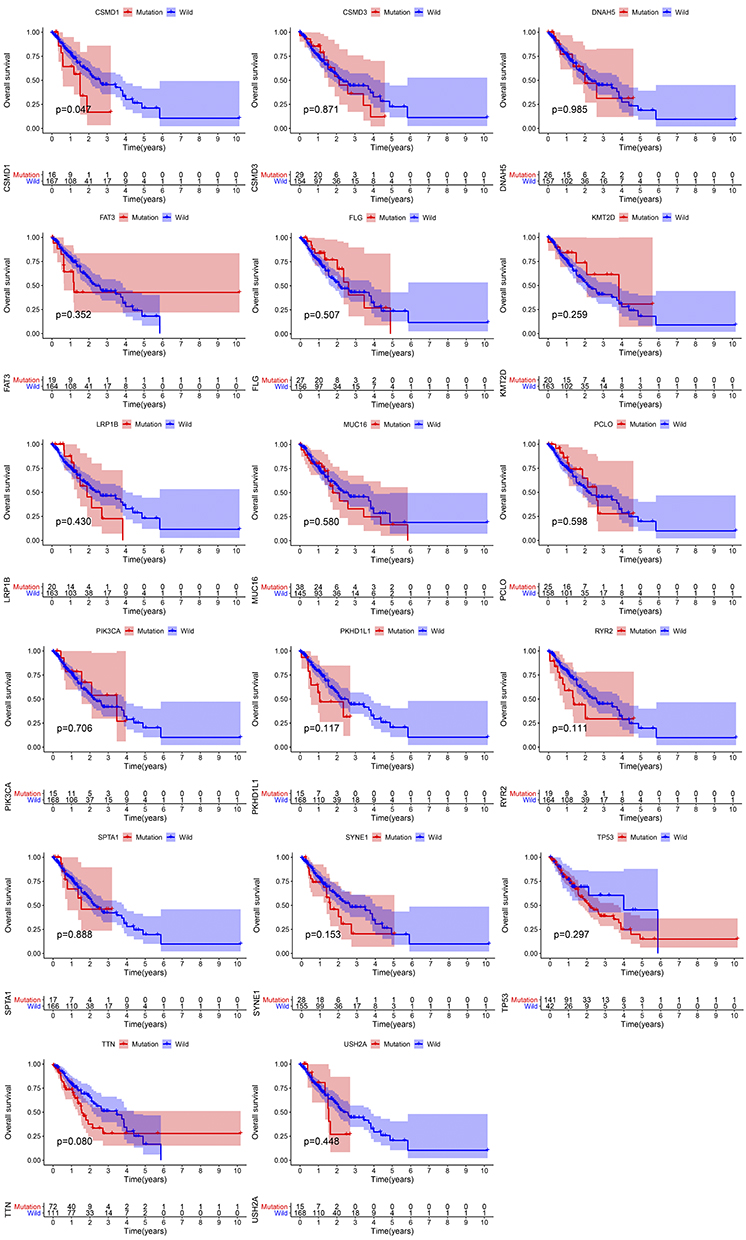 |
Figure 5 CSMD1 gene mutation was associated with clinical prognosis. Kaplan–Meier survival analysis was used to reflect the curve of the relationship between gene mutation and the survival prognosis of patients with esophageal cancer. |
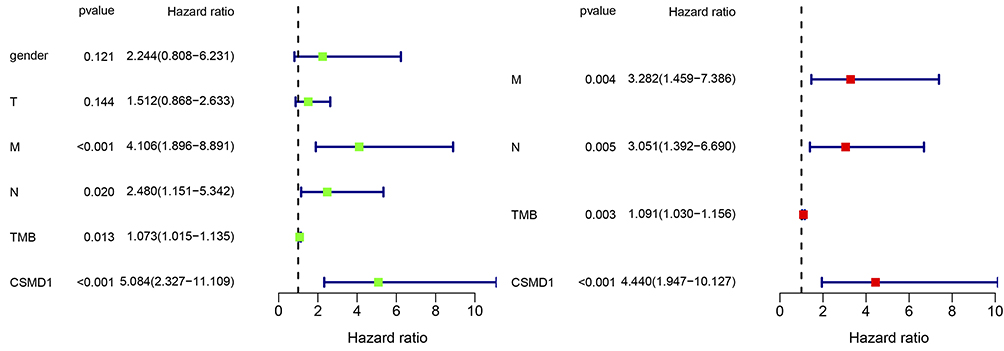 |
Figure 6 After univariate (left) and multivariate (right) cox regression analysis, only CSMD1 mutation could be used as independent predictors of ESCA prognosis.24 |
Enrichment of Pathways and Functions Related to the Mutation Status of CSMD1
To explore the biological processes involved in CSMD1 mutation, patients were divided into mutant and wild groups according to CSMD1 mutation status and GSEA enriched related pathways and functions. Eventually, many pathways, such as basal cell carcinoma, dilated cardiomyopathy, ECM receptor interactions, focal adhesion, hedgehog signaling pathway mapk signal pathway, melanogenesis, melanoma, pancreatic cancer, pathways in cancer, renal cell carcinoma, TGF beta signaling pathways, toll-like receptors signaling pathways and WNT signaling pathways were enriched into CSMD1 wild group (p < 0.05, Figure 7A). The CSMD1 mutant group only enriched into maturity onset diabetes of the young.
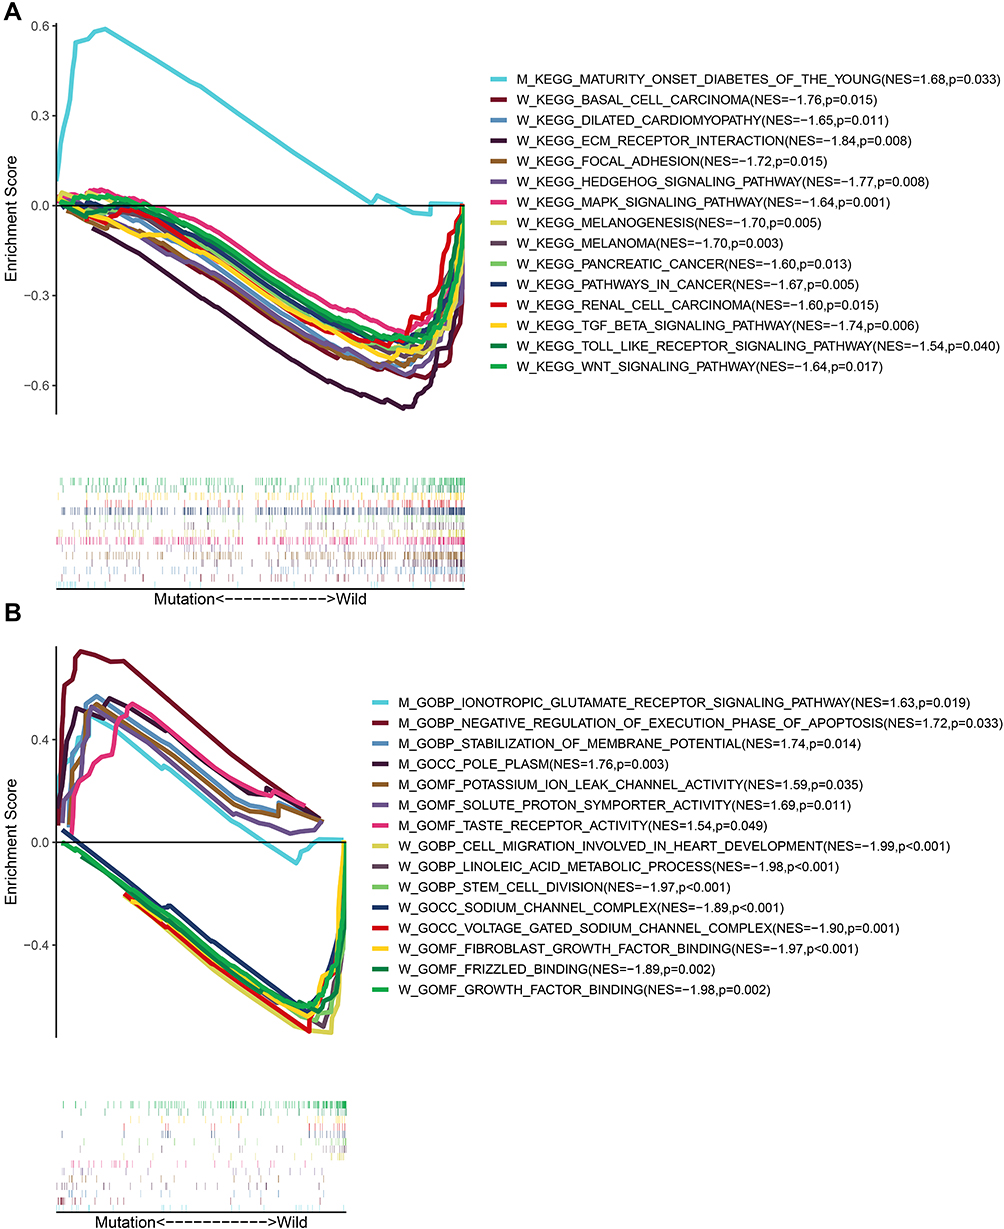 |
Figure 7 Enrichment analysis of GO and KEGG based on CSMD1 mutation status. (A) Pathways significantly enriched in CSMD1 wild group and CSMD1 mutant group, respectively. W and M represents CSMD1 wild group and CSMD1 mutant group, respectively. (B) BPs, MFs and CCs were significantly enriched in the CSMD1 wild group and CSMD1 mutant group, respectively. |
In addition, biological processes, cellular components and molecular functions significantly related to CSMD1 mutation status were also enriched (P < 0.05, Figure 7B). These biological processes include ionotropic glutamate receptor signaling pathway, negative regulation of the execution phase of apoptosis and stabilization of membrane potential in the mutant group, cell migration involved in heart development, linoleic acid metabolic process and stem cell division in the wild group (P < 0.05). In the enrichment analysis of the molecular function domain, the activities related to CSMD1 mutation were potassium ion leakage channel activity, solute proton symporter activity and taste receptor activity. In addition, wild CSMD1 was also involved in fibroblast growth factor binding, frizzled binding and growth factor binding. Finally, we also found in cell composition enrichment analysis that mutant CSMD1 played a role in pole plasm. In contrast, wild CSMD1 played a role in the sodium channel complex and voltage-gated sodium channel complex.
Difference and Correlation Analysis of Tumor-Infiltrating Immune Cells
It can be seen from the histogram that the proportion of these immune infiltrating cells varies from sample to sample, and T cells and macrophages accounted for the highest proportion (Figure 8A). By difference analysis, we found that the CSMD1 mutant group had more follicular helper T cells and fewer resting state dendritic cells (Figure 8B, P < 0.05). Finally, correlation analysis showed that follicular helper T cells had the strongest positive correlation with T cell CD8 and a negative correlation with resting T cell CD4 memory (Figure 8C). It was also observed that eosinophils, juvenile B cells, plasma cells and mast cells were activated most closely associated with dendritic cell resting.
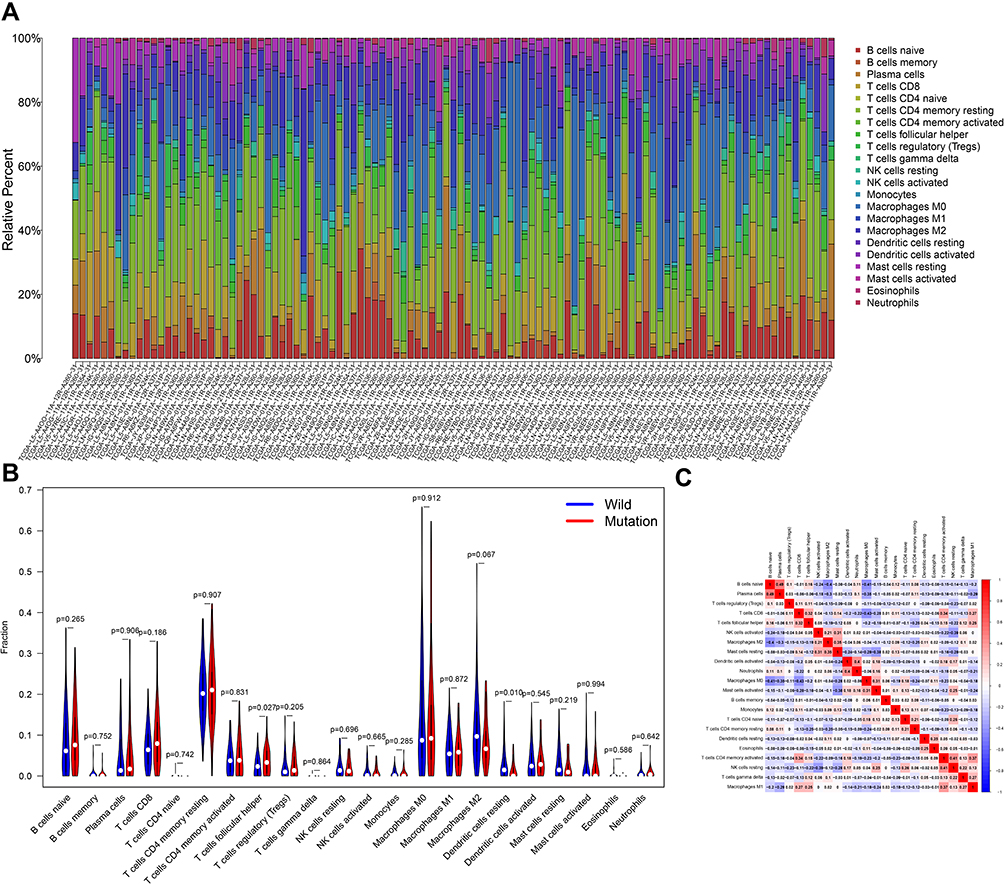 |
Figure 8 CSMD1 mutation is associated with tumor invasion of immune cells. (A) Stacked bar chart shows 22 immune cell distributions in each sample. (B) A violin chart is showing the difference in immune cell infiltration between the CSMD1 mutant group and the CSMD1 wild group. (C) Correlation matrix between immune cells. Red represents positive correlation, while blue represents negative correlation. |
Cell Stem Analysis
Firstly, both mDNAsi and mRNAsi in ESCA samples were observed to be significantly higher (Figure 9A and B). By comparing the differences in mRNAsi and mRNAsi between the CSMD1 mutant group and the CSMD1 wild group, we found that the mRNAsi of the CSMD1 mutant group was significantly higher (p<0.05, Figure 9D). Although there was no significant statistical significance, we also found that mRNAsi was higher among the patients who were Dead, Male, Stage III–IV and M1 (Figure 9E). Meanwhile mDNAsi was also higher in patients with Dead, Male, StageIII-IV, M1 and N2-3 (Figure 9F).
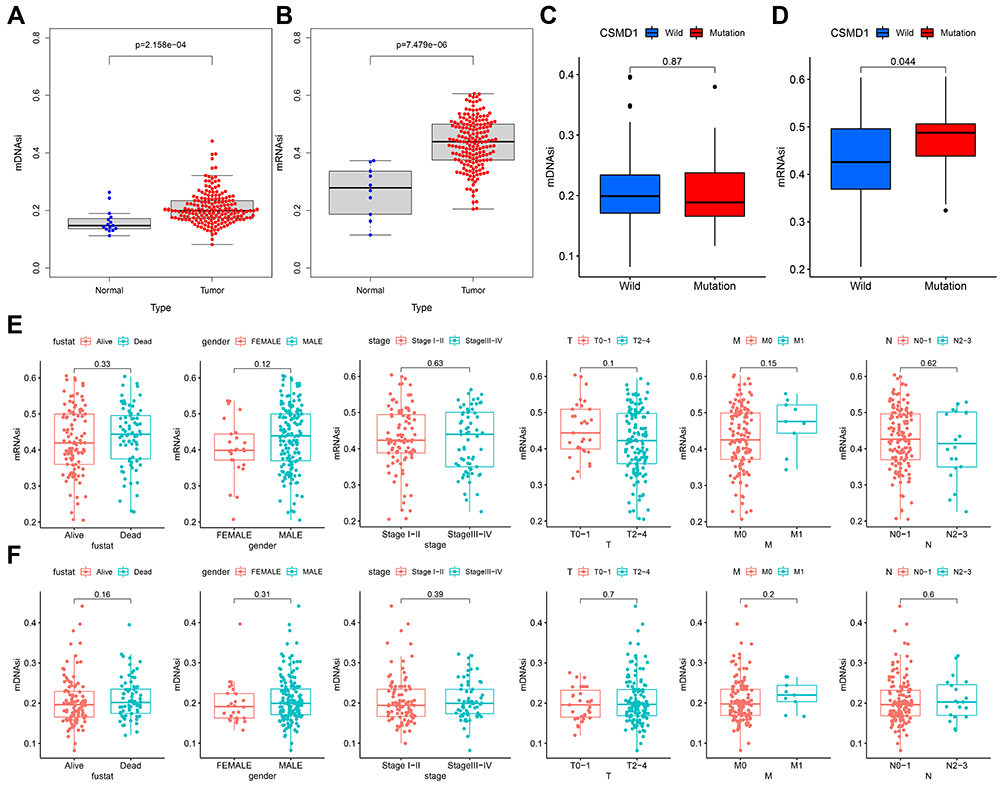 |
Figure 9 mDNAsi/mRNAsi associated with CSMD1 mutant status and clinicopathological characteristics. (A and B) Differences in mDNAsi/mRNAsi between tumor and normal group. (C and D) Differences in mDNAsi/mRNAsi between the CSMD1 mutant group and the wild group. (E/F) Differences in mDNAsi/mRNAsi between different subtypes of each clinicopathological. |
Differential Analysis of ICIS Related Genes, m6a Related Genes and Multi-Drug Resistance Genes of Chemotherapeutics
At present, the detection of ICIS related genes (such as the expression of PD-1) has gradually become a key method to predict the efficacy of immunotherapy. In addition, Opdivo, a PD-1 inhibitor, and other lCIs have been used clinically for the second-line treatment of advanced ESCA and have been shown to have a significant effect in extending survival. As we expected, the expression of PDCD (PD-1) in the high TMB group was found to be significantly higher (p<0.05, Figure 10A). Since the corresponding results were not statistically different, we cannot predict the efficacy of ICIS in ESCA patients based on CSMD1 mutation status (Figure 10B). In addition, we also obtained the different analysis results of 12 m6a-related genes, such as ZC3H13, METTL3, ALKBH5, YTHDC2, HNRNPC, RBM15, METTL14, FTO, YTHDF2, YTHDF1, WTAP and YTHDC1 (Figure 10C). Unfortunately, there was no significant difference. It is worth mentioning that we also found that the expression of the drug resistance gene MRP1 (ABCC1) in the CSMD1 mutant group was lower (Figure 10D).
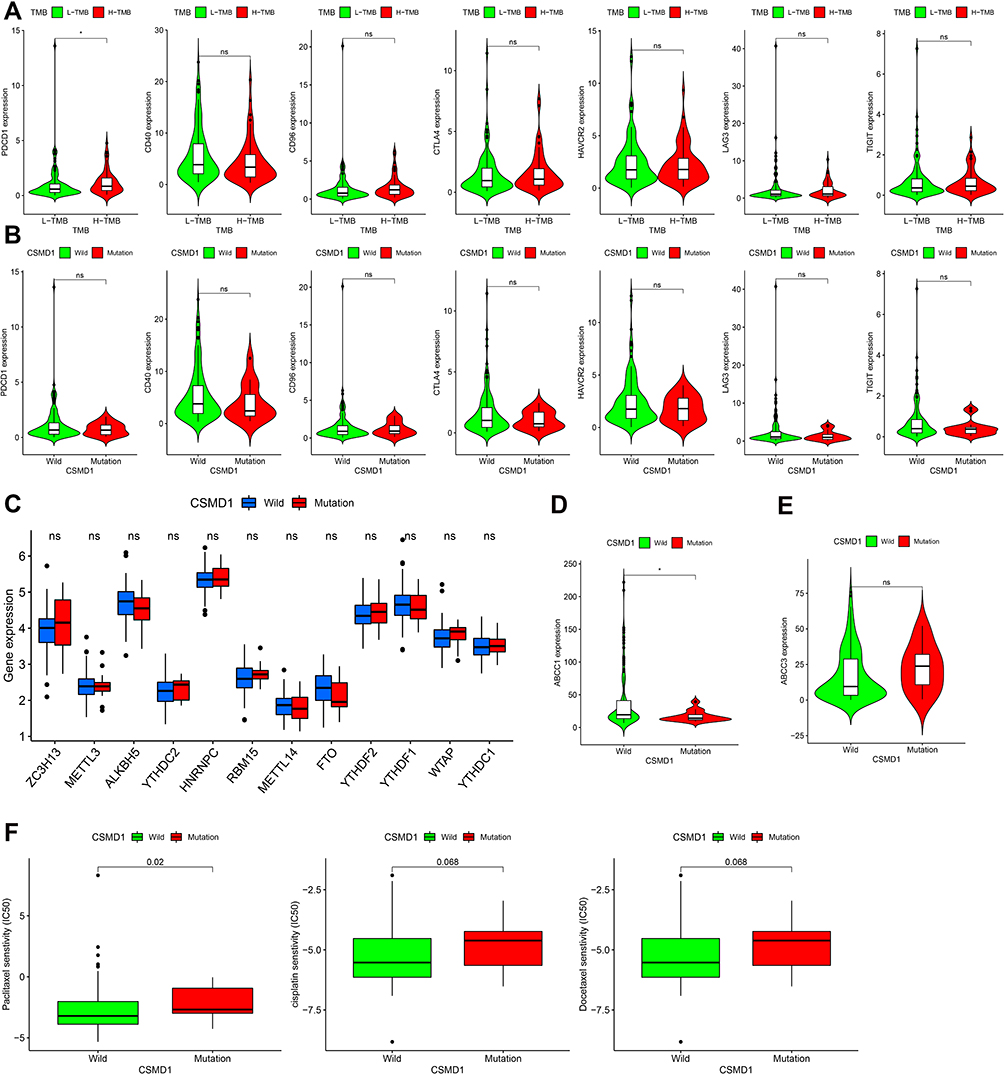 |
Figure 10 Differential analysis of the expression levels of ICIS-related genes, m6a-related genes, multi-drug resistance related genes and 3 commonly used chemotherapy drugs. (A) ICIS-related genes between high TMB group and low TMB group (B) ICIS-related genes between the CSMD1 mutant group and the wild group (C) M6A-related genes between the CSMD1 mutant group and the wild group. (D) MRP1 between the CSMD1 mutant group and the wild group. (E) MRP3 between the CSMD1 mutant group and the wild group. (F) The IC50 of paclitaxel, cisplatin and docetaxel between the CSMD1 mutant group and the wild group. ns: p > 0.05, not statistically significant; *p < 0.05. |
Prediction of Chemotherapeutic Drug Sensitivity
We predicted the IC50 of three chemotherapeutic agents (paclitaxel, cisplatin and docetaxel) for ESCA patients” treatment based on the NCCN guidelines of 2021. It was observed that the IC50 of the three chemotherapeutic drugs in the CSMD1 mutation group was higher (only paclitaxel (P<0.05)), indicating that patients with wild CSMD1 were more sensitive to paclitaxel (Figure 10F).
Construction and Evaluation of the Nomogram
Independent predictors of survival (M, N, TMB and CSMD1 mutations) obtained by Cox regression analysis were used to construct the nomogram (Figure 11A). From the calibration curves, we found that the 1-year, 2-year, 3- year OS predicted by the nomogram was basically consistent with the actual ones (Figure 11B). All ROC curves confirmed that our nomograms not only had good predictive value (AUC values were > 0.7 for all), but also had the best predictive power of 1-year, 2-year and 3-year survival among all predictive variables (Figure 11C).
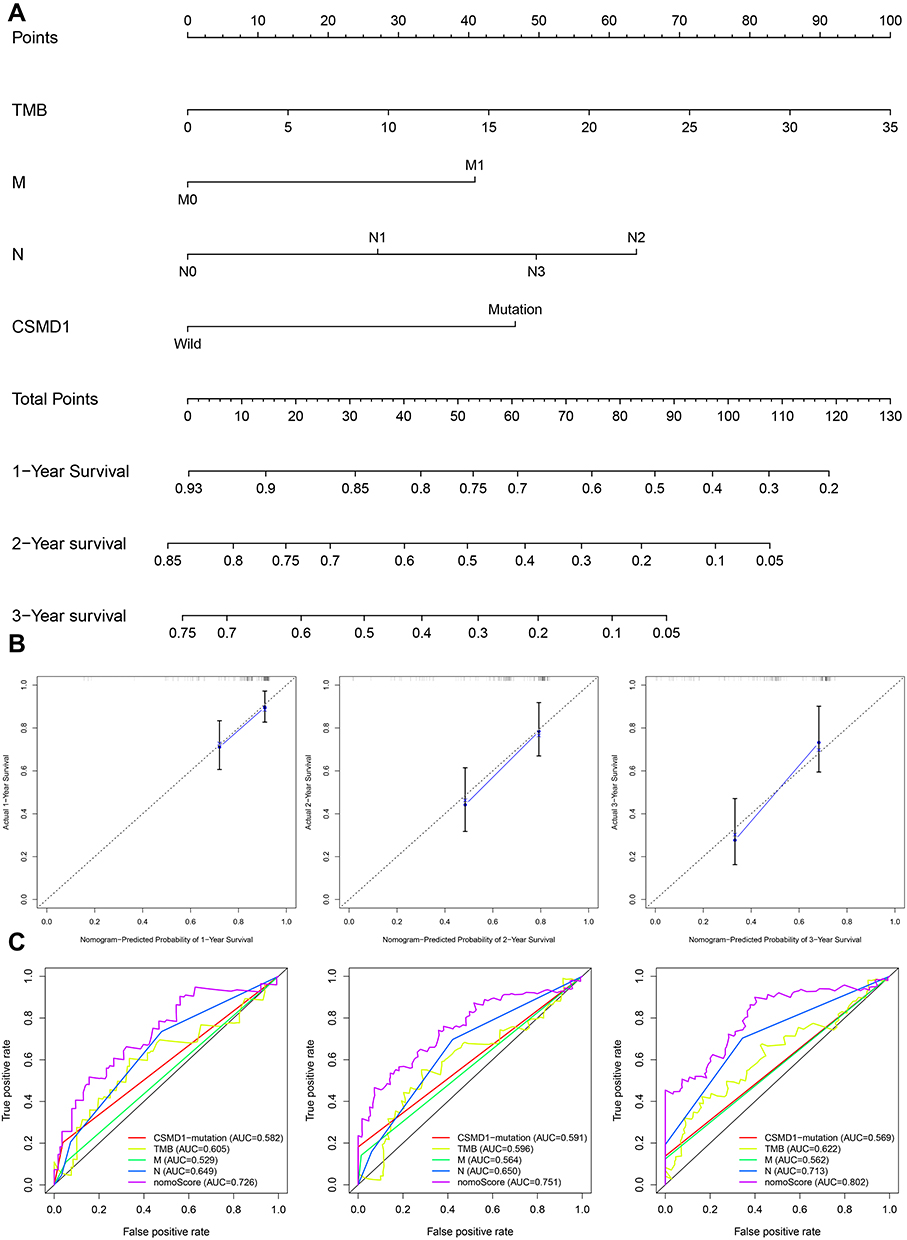 |
Figure 11 Construction and verification of Nomogram. (A) The nomograph composed of M, N, TMB and CSMD1 mutation status is used to predict the survival probability of patients with esophageal cancer at 1, 2 and 3 years survival probability. (B) It is observed in the calibration curve that the OS predicted by the combined model is basically the same as the actual OS. (C) The multi-factor ROC curve reveals that the nomogram has the best predictive performance. The ordinate represents the true positive rate, while the abscissa represents the false positive rate. |
CSMD1 Expression Difference and Prognostic Analysis
The RNA sequencing data of Bladder Urothelial Carcinoma (BLCA), Breast invasive carcinoma (BRCA), Cholangiocarcinoma (CHOL), Colon adenocarcinoma (COAD), ESCA, Glioblastoma multiforme (GBM), Head and Neck squamous cell carcinoma (HNSC), Kidney Chromophobe (KICH)), Kidney renal clear cell carcinoma (KIRC), Kidney renal papillary cell carcinoma (KIRP), Liver hepatocellular carcinoma (LIHC), Lung adenocarcinoma (LUAD), Lung squamous cell carcinoma (LUSC), Prostate adenocarcinoma (PRAD), Rectum adenocarcinoma Esophageal carcinoma (READ), Stomach adenocarcinoma (STAD), Thyroid carcinoma (THCA) and Uterine Corpus Endometrial Carcinoma (UCEC) were used for the difference analysis of CSMD1 expression. Except for CHOL, ESCA, HNSC, LUSC and STAD, the expression of CSMD1 in the remaining 13 cancers was observed significant differences (Figure 12A). Unfortunately, we did not find a significant difference in the expression of CSMD1 in ESCA. In addition to the higher expression of CSMD1 in LIHC and THCA, lower expression levels in BLCA, BRCA, COAD, GBM, KICH, KIRC, KIRP, LUAD, PRAD, READ and UCEC were also found (Figure 12A). In ESCA, no significant difference in survival between the CSMD1 high expression group and the low expression group was observed, which implies that the expression of CSMD1 is not related to the prognosis of ESCA patients (Figure 12B).
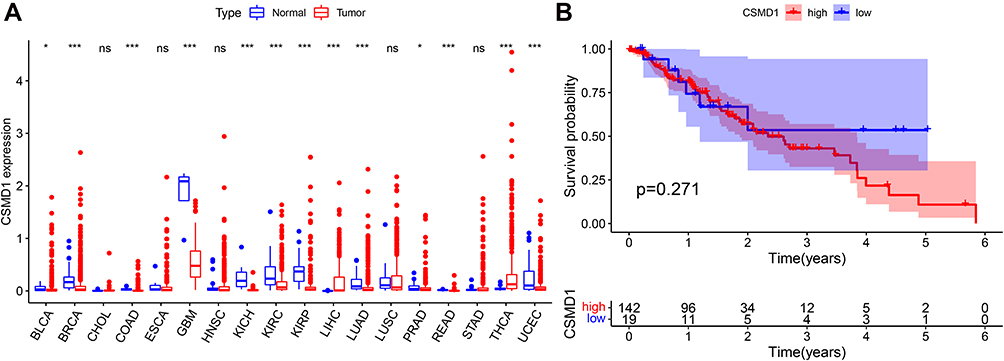 |
Figure 12 CSMD1 expression difference and prognostic analysis. (A) Difference analysis of CSMD1 expression between 18 human cancers and normal samples. (B) Kaplan–Meier survival curve between high and low CSMD1 expression groups in ESCA.ns: p > 0.05, not statistically significant; *p < 0.05; ***p < 0.001. |
CSMD1 Expression Associated with Immune Cell and ICIs/m6a/Multi-Drug Resistance Related Genes
The content of B cells native, Monocytes, Dendritic cells resting, Mast cells resting and Eosinophils was positively correlated with the expression of CSMD1. The expression of CSMD1 was also negatively correlated with Macrophages M2, NK cells activated and Neutrophils content (Figure 13A). Not only that, but the expression of CSMD1 has also been observed to be closely related to multi-drug resistance genes (ABCC1 and ABCC3) (Figure 13B). Similar conclusions were observed in ICIs and m6a related genes (Figure 13B). These results all indicate that CSMD1 may play a role in the immune process of esophageal cancer and the effect of chemotherapy.
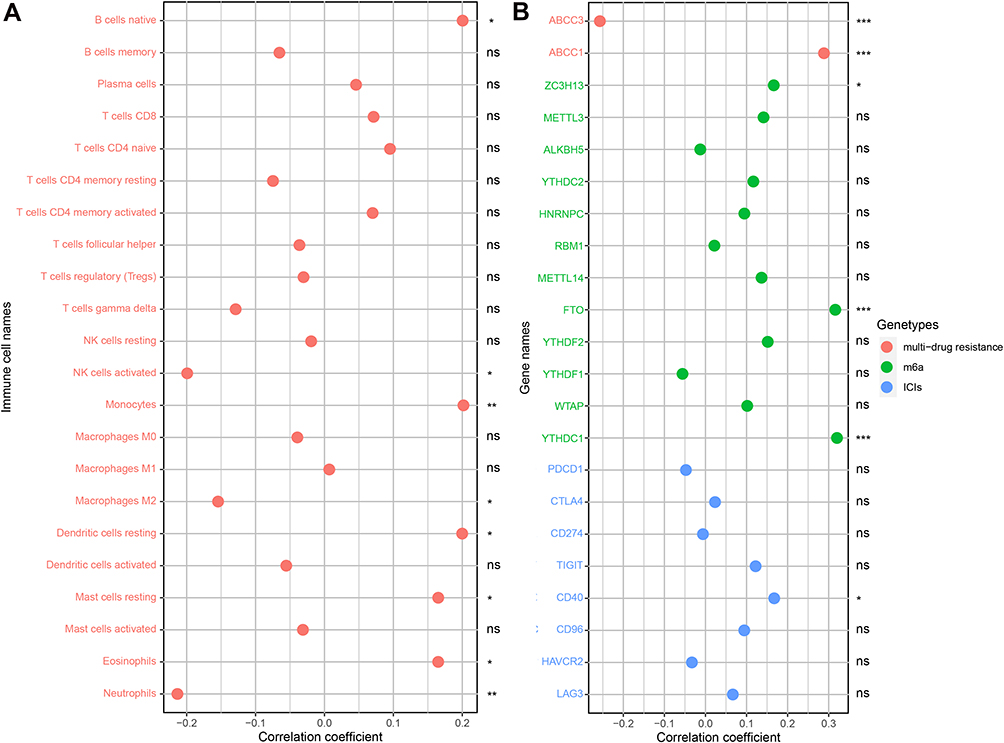 |
Figure 13 CSMD1 expression associated with immune cell and ICIs/m6a/multi-drug resistance related genes. (A) Correlation analysis results between immune cells and CSMD1 expression. (B) Correlation analysis results between CSMD1 expression and ICIs/m6a/multi-drug resistance related genes. ns: p > 0.05, not statistically significant; *p < 0.05; **p < 0.01; ***p < 0.001. |
Discussion
Our study characterized the somatic mutation landscape of 183 US esophageal cancer samples from the TCGA dataset and 331 Chinese esophageal cancer samples from the ICGC dataset, respectively. We then found that CSMD1 frequently mutated in the TCGA and ICGC cohort, and its mutation was associated with higher TMB and worse clinical prognosis. In addition, the CNV loss of CSMD1 was found to be much higher than the CNV gain in ESCA. It was observed that the CSMD1 mutant samples were more infiltrated in the follicular helper T cells and less in the resting state dendritic cells, which is consistent with previous studies.21–23 The CSMD1 mutation status and TMB in ESCA were found to have predictive significance for the clinical treatment of patients. Not only that, we found through analysis that CSMD1 is differentially expressed between most cancers and normal tissues. The expression of CSMD1 has been observed to be related to the content of immune cells and the expression of ICIs/m6a/multidrug resistance related genes. Finally, we have constructed a nomograph that includes CSMD1 mutation factors with good predictive performance to predict the survival probability of ESCA patients simply and efficiently.
The CUB and sushi multiple domains 1 (CSMD1) encodes a type I transmembrane protein, which is considered to be a receptor or co-receptor involved in signal transduction during cell migration.24 As a new candidate tumor suppressor gene, CSMD1 has been proven to inhibit tumor cell migration and proliferation and induce their apoptosis.25,26 Escudero-Esparza et al found that in the development of breast cancer, the expression of CSMD1 in human breast tumor tissue is low, and the shortened overall survival of breast cancer patients is related to the low expression of CSMD1.27 In the study of Tang et al, it was found that in melanoma cells, the low expression of CSMD1 has a weaker effect on the migration and proliferation of melanoma cells, and CSMD1 can act as a tumor suppressor gene in melanoma cells.28 In addition, Zhang et al found that CSMD1 expression is low in colorectal cancer and is related to overall survival. It plays an important role in the prognosis of colorectal cancer and can be used as a predictor of colorectal cancer.29 Our analysis found that CSMD1 is down-regulated in the expression of a variety of cancers, which implies that in these cancers, the low expression of CSMD1 may promotes the occurrence of cancer by weakening the effect of CSMD1 on inhibiting tumor cell migration and proliferation, thereby inducing less tumor cell apoptosis. Unfortunately, there is no research showing that the low expression of CSMD1 will promote the development of ESCA. Although not significant, we found that the expression of CSMD1 in the tumor group was lower than that in normal tissues. By comparing the survival curves of ESCA patients with high and low expression groups of CSMD1, no significant difference was found in the survival rate of the two groups. This indicates that the expression of CSMD1 may not be significantly related to the progression and prognosis of ESCA. But according to our analysis and previous research results, it is shown that the CSMD1 mutation is There is still important significance in the progress of ESCA.
CSMD1 loss30,31 and mutation32,33 often occur in many cancers. In addition to the CSMD1 mutations associated with poor prognosis of colorectal cancer,34 CSMD1 loss is also associated with poor prognosis of breast cancer,35 colorectal cancer,29 head and neck squamous cell carcinoma,36 and prostate cancer.37 CSMD1 may be inactivated by deletion or mutation, thereby promoting tumor progression.34 The high NS/S ratio (15:1) of the CSMD1 mutant allele in colorectal cancer is close to clonal dominance, providing a proliferation advantage for tumor cells.34 The appropriate combination of mutations is likely to bring proliferation advantages to specific cell clones. Mutations that cause or promote tumor progression are often called drivers (non-synonymous), while mutations that do not provide a selective advantage are often referred to as passengers (synonymous).38,39 Somatic mutations with a high overall ratio of nonsynonymous to synonymous (NS/S) mutations can provide statistical evidence for whether the mutated gene is the driving force of tumor progression.40,41 If the NS/S ratio of genes with non-synonymous mutations overexpressed is statistically significantly higher than the expected 2:1, it can be assumed that the tumor is under positive selection pressure to change the amino acid sequence during tumor evolution.42 Our study not only found that CSMD1 mutations and loss are very frequent in ESCA, but also that CSMD1 mutations are associated with poor prognosis of ESCA patients, which are consistent with other corresponding conclusions in other tumors. In addition,We found that the NS/S ratios of all CSMD1 mutations based on the somatic mutation data of TCGA and ICGC database were greater than 2:1, suggesting that the mutation combination with high NS/S ratio mutations may be the part that promotes the progression of ESCA tumor cells the reason. Therefore, we assume that the high NS/S ratio of CSMD1 mutation in ESCA provides tumor cells with a proliferation advantage, and the inactivation of CSMD1 caused by CSMD1 mutation and loss leads to the failure of CSMD1 to inhibit cancer cell migration and proliferation and induce its apoptosis. These all promote the progress of ESCA and ultimately lead to the poor prognosis of ECSA patients.
Studies have shown that the expression of ICIs-related genes such as CTLA4, PDCD1 (PD-1) and CD40 can enhance the immune response of cells. Anti-CTLA-4 antibodies bind to CTLA-4 molecules with high affinity, leading to Treg depletion or functional arrest, thereby activating T cells and enhancing the immune response to tumors.43 CD40 can activate APC to induce antigen-specific T cell immunity.44 The multidrug resistance-associated protein (MRP/ABCC) family comprises 13 members, among which MRP1 to MRP9 are the main transporters indicated to result in multidrug resistance by extruding anticancer drugs out of tumor cells.45 Therefore, the correlation with drug resistance genes including MRP1 (ABCC1) suggests that targeting the tumor drug resistance gene MRP1 seems to have therapeutic potential for patients with high CSMD1 expression (Figure 13B). In addition, we also found that compared with the mutant group, the expression of MRP1 in the CSMD1 wild group was also higher, which undoubtedly supports the previous results (Figure 10D). These results all indicate that CSMD1 can be used as a therapeutic target to overcome drug resistance or assist drug sensitivity. TMB represents the number of mutations in cancer cells and is positively correlated with the efficacy of immunotherapy. Our results also support this conclusion. Firstly, we find that CSMD1 mutation is associated with the high level of TMB in our analysis. Patients with ESCA with high TMB were also found to have higher expression of PD-1, which means that patients with higher TMB may benefit more from PD-1 inhibitor immunotherapy.
In recent years, more and more reports have been published on the efficacy of paclitaxel, cisplatin, and docetaxel in combination with chemotherapy in the treatment of unresectable or metastatic esophageal cancer6. By comparing the difference of IC50 of these three drugs in patients, we found that the IC50 of paclitaxel in the CSMD1 mutant group was higher, indicating that the wild-type CSMD1 gene was more sensitive to paclitaxel. Given the high incidence of severe gastrointestinal toxicity, leukopenia, radiation dermatitis and radiation pneumonitis caused by paclitaxel chemotherapy, the screening for sensitive populations is particularly important.46,47 Our analysis shows that CSMD1 mutation status can be used as a biomarker to screen ESCA patients sensitive to paclitaxel chemotherapy.
In our study, the patients in the CSMD1 mutation group were observed to have a higher proportion of Follicular helper T cells (TFH). Many previous studies have confirmed the important role of TFH in anti-tumor immunity. TFH was confirmed to contribute to anti-tumor immune cells by assisting CD8 effector T cells or directly scavenging tumor cells as cytotoxic T cells in two studies.48,49 B cells were humoral immune cells, which play a role in the humoral immunity of the adaptive immune system. The formation of germinal center, differentiation of B cells and maturation of antibody affinity are all dependent on the auxiliary role of TFH.50 Hollern et al reported that induction of B-cell activation by T follicular helper cells via immune checkpoint therapy promotes an anti-tumor response in a mouse model of breast cancer.51 We also found that CD8 T cells had the strongest positive correlation with FTH. It was reported that TFH enhances the effector function of CD8 T cells in colorectal cancer through the IL-21 dependent pathway.52 Therefore, we also deduce that the CSMD1 mutation in ESCA may induce the increase of FTH to participate in anti-tumor immunity. In addition, Ma et al found that FTH has characteristic high programmed cell death protein 1 (PD-1) expression,53 indicating that the increase of TFH caused by CSMD1 mutation may increase the hope of ICIS treatment. Goh et al have shown that tumors can inhibit dendritic cells by inducing PD-1 expression, which is consistent with the results of our study.54
Nomogram can be the effects of several independent clinical variables together, provide personalized risk assessment for each patient.55 As a statistical prediction model of cancer-specific survival probability, nomograph is significant for predicting disease-free survival rate and overall survival rate after esophageal squamous cell surgery.55 Due to the heterogeneity of cancer cells, different patients or the same patient will have other disease states at different times, and the long-term results will be different, and various countermeasures need to be taken.56 Therefore, the accurate judgment of the patient’s prognosis over time is conducive to precise treatment and maximize the patient’s treatment benefit. Therefore, it is necessary to construct a nomogram with high prediction accuracy to predict the prognosis of patients with ESCA, and our nomogram meets this requirement.
mDNAsi and mRNAsi in ESCA samples are significantly higher. This indicates that ESCA cancer stem cell-like cells have different DNA methylation patterns. These differentially methylated genes may help maintain the stem cell-like characteristics of cancer stem cells and play an important role in regulating the differentiation of cancer stem cells.14 In addition, by comparing the differences of mRNAsi and mDNAsi between the CSMD1 mutant group and CSMD1 wild group, we found that mRNAsi of the CSMD1 mutant group increased significantly. Studies have shown that the expressions of CD47 and CD133 in esophageal cancer tissues are significantly higher than those in normal tissues,57 and anti-CD47 antibody or CD47 blocking therapy can enhance macrophage phagocytosis, reduce tumor load, and increase the survival rate of patients in various transplanted tumor models. We speculate that CSMD1 mutation may increase the potential of self-renewal, invasion and metastasis of cancer stem cells, and CSMD1 mutation may be a potential therapeutic target of cancer stem cells in ESCA patients. CSMD1 mutation can be used as an immune-related biomarker and a potential predictor of cancer stem cells in esophageal cancer, and its specific mechanism deserves further discussion.
In addition, genes associated with CSMD1, Low-density lipoprotein receptor-related protein 1B (LRP1B), which is a member of the LDL receptor family, are considered a putative tumor suppressor. Its mutations may accelerate the proliferation, migration and invasion of prostate cancer cells.58,59 Mutations in this SYNE1 frequently associated with diverse diseases termed laminopathies, which often affect the muscle tissue, have been associated with autosomal recessive spinocerebellar ataxia 8.60 Mutations in TP53 is associated with many kinds of human cancers, including hereditary cancers. PIK3CA is also an oncogene that has been linked to cervical cancer and breast cancer. Although overexpression of PIK3CA was not sufficient to initiate tumorigenesis, but it markedly accelerated HNSCC progression.61 By the PPI and correlation network of these genes, we could find their close affection for each other. Suggesting that they collectively influence the development of esophageal cancer through responsible network relationships.
Multi-drug resistance is the main obstacle to the success of chemotherapy in patients with esophageal cancer. The overexpression of ABCB1, ABCC1, and ABCG2 in tumor tissues is key to anticancer drugs’ limited efficacy.62 In small cell lung cancer, prostate cancer, breast cancer, and childhood neuroblastoma, the overexpression of ABCC1 is associated with MDR.63 By analyzing the resistance genes of the CSMD1 wild group and the mutant group, we found that the expression of MRP1 (ABCC1) gene in the CSMD1 mutant group is lower, which indicates that the CSMD1 gene is of great significance for predicting the sensitivity of chemotherapy drugs.
Although our analysis has found many valuable conclusions, there are still many limitations. Considering the difficulty of experimental verification, in reality, all our results have not been further experimentally verified, and the sample size is not large enough. First, we analyzed the relationship between CSMD1 mutation and infiltration of immune cells. Still, we did not conduct basic experiments to explore the regulatory mechanism of CSMD1 mutation on immune cells at the cellular and molecular level. Then we only made inferences and conjectures on the role of CSMD1 mutation in ESCA progression based on the results of our analysis and previous research conclusions. In the future, these conjectures and conclusions will inevitably require a lot of basic experiments to verify. The analysis of the mutation site of CSMD1 is of great significance for the in-depth study of the role of CSMD1 mutation in the progress of ESCA. However, due to the limitations of available data, we were unable to conduct this analysis. Maybe further experiments can complete this exploration in the future. Although our results have yet to be verified, our analysis’s new perspectives and conclusions may still provide new directions for the effective treatment of esophageal cancer and provide some meaningful clues for related experiments in the future.
Conclusion
In summary, our study shows that CSMD1 is frequently mutated in esophageal cancer, and CSMD1 mutation is associated with higher TMB, suggesting a worse prognosis. Mutation and loss of CSMD1 may promote the progression of ESCA. In addition, CSMD1 mutation may up-regulate TFH to induce an anti-tumor immune response. It can be used as a biomarker to screen patients with ESCA to obtain better clinical benefits of chemotherapy. In addition, TMB in ESCA can also be used as a biomarker to benefit from PD-1 inhibitor immunotherapy. However, the prediction accuracy of CSMD1 mutation status as a marker still needs clinical specimens and experiments to verify in the future.
Ethical Approval
This study is a bioinformatics study that does not involve human subjects based on publicly obtained data from the TCGA and ICGC databases. Therefore, it does not involve additional intervention on the human body and the collection of specimens, and it will not cause unnecessary damage and additional costs to potential research subjects. Therefore, this study does not involve the ethics approval process of the local ethics committee.
Acknowledgments
We would like to thank the researchers and study participants for their contributions.
Author Contributions
All authors made a significant contribution to the work reported, whether that is in the conception, study design, execution, acquisition of data, analysis and interpretation, or in all these areas; took part in drafting, revising or critically reviewing the article; gave final approval of the version to be published; have agreed on the journal to which the article has been submitted; and agree to be accountable for all aspects of the work.
Funding
The study was supported by the Research Fund Project of Jiangxi Provincial Department of Education (180017).
Disclosure
The authors report no conflicts of interest in this work.
References
1. Smyth E, Lagergren J, Fitzgerald R, et al. Oesophageal cancer. Nat Rev Dis Primers. 2017;3(1):17048. doi:10.1038/nrdp.2017.48
2. Zhang W, Wang P, Pang Q. Immune checkpoint inhibitors for esophageal squamous cell carcinoma: a narrative review. Annals of Translational Medicine. 2020;8(18):1193–1193.
3. Watanabe M, Otake R, Kozuki R, et al. Recent progress in multidisciplinary treatment for patients with esophageal cancer. Surgery today. 2020;50(1):12–20.
4. Sohda M, Kuwano H. Current status and future prospects for esophageal cancer treatment. Ann Thorac Cardiovasc Surg. 2017;23(1):1–11. doi:10.5761/atcs.ra.16-00162
5. Dröge L, Karras P, Guhlich M, et al. Preoperative radiochemotherapy in esophageal squamous cell cancer with 5-fluorouracil/cisplatin or carboplatin/paclitaxel: treatment practice over a 20-year period and implications for the individual treatment modalities. Cancers. 2021;13(8):1834. doi:10.3390/cancers13081834
6. Wu S, Fu L. Tyrosine kinase inhibitors enhanced the efficacy of conventional chemotherapeutic agent in multidrug resistant cancer cells. Mol Cancer. 2018;17(1):25. doi:10.1186/s12943-018-0775-3
7. Däster S, Eppenberger-Castori S, Mele V, et al. Low expression of programmed death 1 (PD-1), PD-1 ligand 1 (PD-L1), and low CD8+ T lymphocyte infiltration identify a subgroup of patients with gastric and esophageal adenocarcinoma with severe prognosis. Front Med. 2020;7:144. doi:10.3389/fmed.2020.00144
8. Chen J, Luo S, Qin S, et al. Pembrolizumab vs chemotherapy in patients with advanced/metastatic adenocarcinoma (AC) or squamous cell carcinoma (SCC) of the esophagus as second-line therapy: analysis of the Chinese subgroup in KEYNOTE-181. Ann Oncol. 2019;30:v294.
9. Kim H, Hong J, Lee J, et al. Clinical sequencing to assess tumor mutational burden as a useful biomarker to immunotherapy in various solid tumors. Therapeutic advances in medical oncology. 2021;13:1758835921992992.
10. Chan T, Yarchoan M, Jaffee E, et al. Development of tumor mutation burden as an immunotherapy biomarker: utility for the oncology clinic. Ann Oncol. 2019;30(1):44–56. doi:10.1093/annonc/mdy495
11. Chalmers Z, Connelly C, Fabrizio D, et al. Analysis of 100,000 human cancer genomes reveals the landscape of tumor mutational burden. Genome Med. 2017;9(1):34. doi:10.1186/s13073-017-0424-2
12. Goodman A, Kato S, Bazhenova L, et al. Tumor mutational burden as an independent predictor of response to immunotherapy in diverse cancers. Mol Cancer Ther. 2017;16(11):2598–2608. doi:10.1158/1535-7163.MCT-17-0386
13. Milano F, Rygiel AM, Buttar N. An ex vivo readout for evaluation of dendritic cell-induced autologous cytotoxic T lymphocyte responses against esophageal cancer. Cancer Immunol Immunother. 2007;56(12):1967–1977. doi:10.1007/s00262-007-0341-0
14. Yu X, Teng Y, Jiang X, Yuan H, Jiang W. Genome-wide DNA methylation pattern of cancer stem cells in esophageal cancer. Technol Cancer Res Treat. 2020;19:1533033820983793. doi:10.1177/1533033820983793
15. Das P, Islam F, Smith R, Lam A. Therapeutic strategies against cancer stem cells in esophageal carcinomas. Front Oncol. 2020;10:598957. doi:10.3389/fonc.2020.598957
16. Cai Y, Wang X, Wang N, et al. Correlations between tumor mutation burden and immune infiltrates and their prognostic value in pancreatic cancer by bioinformatic analysis. Life Sci. 2021;277:119505. doi:10.1016/j.lfs.2021.119505
17. Panja S, Hayati S, Epsi N, Parrott J, Mitrofanova A. Integrative (epi) genomic analysis to predict response to androgen-deprivation therapy in prostate cancer. EBioMedicine. 2018;31:110–121. doi:10.1016/j.ebiom.2018.04.007
18. Newman A, Steen C, Liu C, et al. Determining cell type abundance and expression from bulk tissues with digital cytometry. Nat Biotechnol. 2019;37(7):773–782. doi:10.1038/s41587-019-0114-2
19. Malta T, Sokolov A, Gentles A, et al. Machine learning identifies stemness features associated with oncogenic dedifferentiation. Cell. 2018;173(2):338–354.e315.
20. Yang W, Soares J, Greninger P, et al. Genomics of Drug Sensitivity in Cancer (GDSC): a resource for therapeutic biomarker discovery in cancer cells. Nucleic Acids Res. 2013;41(D1):D955–D961. doi:10.1093/nar/gks1111
21. Demaria O, Cornen S, Daëron M, Morel Y, Medzhitov R, Vivier E. Harnessing innate immunity in cancer therapy. Nature. 2019;574(7776):45–56.
22. Woo S, Corrales L, Gajewski T. Innate immune recognition of cancer. Annual review of immunology. 2015;33:445–474.
23. Corrales L, Matson V, Flood B, Spranger S, Gajewski TF. Innate immune signaling and regulation in cancer immunotherapy. Cell Research. 2017;27(1):96.
24. Sun P, Uppaluri R, Schmidt A, et al. Transcript map of the 8p23 putative tumor suppressor region. Genomics. 2001;75(1–3):17–25. doi:10.1006/geno.2001.6587
25. Tang M, Wang Y, Guo S, Han S, Wang D. CSMD1 exhibits antitumor activity in A375 melanoma cells through activation of the Smad pathway. Apoptosis : an international journal on programmed cell death. 2012;17(9):927–937
26. Zhu Q, Gong L, Wang J, et al. miR-10b exerts oncogenic activity in human hepatocellular carcinoma cells by targeting expression of CUB and sushi multiple domains 1 (CSMD1). BMC cancer. 2016;16(1):806.
27. Escudero-Esparza A, Bartoschek M, Gialeli C, et al. Complement inhibitor CSMD1 acts as tumor suppressor in human breast cancer. Oncotarget. 2016;7(47):76920–76933. doi:10.18632/oncotarget.12729
28. Tang MR, Wang YX, Guo S, Han SY, Wang D. CSMD1 exhibits antitumor activity in A375 melanoma cells through activation of the Smad pathway. Apoptosis. 2012;17(9):927–937. doi:10.1007/s10495-012-0727-0
29. Zhang R, Song C. Loss of CSMD1 or 2 may contribute to the poor prognosis of colorectal cancer patients. Tumour Biol. 2014;35(5):4419–4423. doi:10.1007/s13277-013-1581-6
30. Hogan LE, Meyer JA, Yang J, et al. Integrated genomic analysis of relapsed childhood acute lymphoblastic leukemia reveals therapeutic strategies. Blood. 2011;118(19):5218–5226.
31. Toomes C, Jackson A, Maguire K, et al. The presence of multiple regions of homozygous deletion at the CSMD1 locus in oral squamous cell carcinoma question the role of CSMD1 in head and neck carcinogenesis. Genes Chromosomes Cancer. 2003;37(2):132–140.
32. Bignell G, Greenman C, Davies H, et al. Signatures of mutation and selection in the cancer genome. Nature. 2010;463(7283):893–898.
33. Shull AY, Clendenning ML, Ghoshal-Gupta S, et al. Somatic Mutations, Allele Loss, and DNA Methylation of the Cub and Sushi Multiple Domains 1 (CSMD1) Gene Reveals Association with Early Age of Diagnosis in Colorectal Cancer Patients. Plos One. 2013;8(3):e58731.
34. Shull AY, Clendenning ML, Ghoshal-Gupta S, et al. Somatic mutations, allele loss, and DNA methylation of the Cub and Sushi multiple domains 1 (CSMD1) gene reveals association with early age of diagnosis in colorectal cancer patients. PLoS One. 2013;8(3):e58731. doi:10.1371/journal.pone.0058731
35. Kamal M, Holliday D, Morrison E, Speirs V, Toomes C, Bell S. Loss of CSMD1 expression disrupts mammary duct formation while enhancing proliferation, migration and invasion. Oncol Rep. 2017;38(1):283–292. doi:10.3892/or.2017.5656
36. Ma C, Quesnelle KM, Sparano A, Rao S, Brose MS. Characterization CSMD1 in a large set of primary lung, head and neck, breast and skin cancer tissues. Cancer Biol Ther. 2009;8(10):907–916. doi:10.4161/cbt.8.10.8132
37. Kamal M, Shaaban AM, Zhang L, et al. Loss of CSMD1 expression is associated with high tumour grade and poor survival in invasive ductal breast carcinoma. Breast Cancer Res Treat. 2010;121(3):555–563. doi:10.1007/s10549-009-0500-4
38. Patterns of somatic mutation in human cancer genomes. European Journal of Cancer Supplements. 2007;6(9):153-158. Stratton MR, Futreal PA. Cancer: Understanding the target. Nature. 2004;430(6995):30.
39. Vogeistein, Bert, Kinzler, Kenneth, W. Cancer genes and the pathways they control. Nature Medicine. 2004;10(8):789–799.
40. Sjoblom T, Jones S, Wood L, et al. The consensus coding sequences of human breast and colorectal cancers. Science. 2006;314(5797):268–274. doi:10.1126/science.1133427
41. Greenman C, Stephens P, Smith R, et al. Patterns of somatic mutation in human cancer genomes. Eur J Cancer Suppl. 2007;6(9):153–158.
42. Nikolaev SI, Rimoldi D, Iseli C, et al. Exome sequencing identifies recurrent somatic MAP2K1 and MAP2K2 mutations in melanoma. Nat Genet. 2012;44(2):133–139. doi:10.1038/ng.1026
43. Rowshanravan B, Halliday N, Sansom D. CTLA-4: a moving target in immunotherapy. Blood. 2018;131(1):58–67. doi:10.1182/blood-2017-06-741033
44. Beatty G, Li Y, Long K. Cancer immunotherapy: activating innate and adaptive immunity through CD40 agonists. Expert Rev Anticancer Ther. 2017;17(2):175–186. doi:10.1080/14737140.2017.1270208
45. Sodani K, Patel A, Kathawala RJ, Chen ZS. Multidrug resistance associated proteins in multidrug resistance. Chin J Cancer. 2012;31(2):58–72. doi:10.5732/cjc.011.10329
46. Chen Y, Ye J, Zhu Z, et al. Comparing paclitaxel plus fluorouracil versus cisplatin plus fluorouracil in chemoradiotherapy for locally advanced esophageal squamous cell cancer: a randomized, multicenter, Phase III clinical trial. J Clin Oncol. 2019;37(20):1695.
47. Zhang X, Jia J, Lu M, et al. Nimotuzumab plus paclitaxel and cisplatin as a 1 st -line treatment for esophageal cancer: long term follow-up of a Phase II study. J Cancer. 2019;10(6):1409–1416. doi:10.7150/jca.28659
48. Tran E, Turcotte S, Gros A, et al. Cancer immunotherapy based on mutation-specific CD4+ T cells in a patient with epithelial cancer. Science. 2014;344(6184):641. doi:10.1126/science.1251102
49. Kreiter S, Vormehr M, Roemer N, et al. Mutant MHC class II epitopes drive therapeutic immune responses to cancer. Nature. 2015;520(7549):692–696.
50. Nutt S, Hodgkin P, Tarlinton D, Corcoran L. The generation of antibody-secreting plasma cells. Nat Rev Immunol. 2015;15(3):160–171. doi:10.1038/nri3795
51. Hollern DP, Xu N, Thennavan A, et al. B cells and T follicular helper cells mediate response to checkpoint inhibitors in high mutation burden mouse models of breast cancer. Cell. 2019;179(5):1191–1206.e1121. doi:10.1016/j.cell.2019.10.028
52. Shi W, Dong L, Sun Q, et al. Follicular helper T cells promote the effector functions of CD8+ T cells via the provision of IL-21, which is downregulated due to PD-1/PD-L1-mediated suppression in colorectal cancer. Exp Cell Res. 2018;372(1):35–42. doi:10.1016/j.yexcr.2018.09.006
53. Ma QY, Huang DY, Zhang HJ, Chen J, Miller W, Chen XF. Function of follicular helper T cell is impaired and correlates with survival time in non-small cell lung cancer. Int Immunopharmacol. 2016;41:1–7. doi:10.1016/j.intimp.2016.10.014
54. Goh M, Lim ZM, Koh V, Lum J, Chen J. Single-cell analysis of immune-microenvironment and immune-tumor interaction in human gastric cancers. J Clin Oncol. 2019;37(4_suppl):29. doi:10.1200/JCO.2019.37.4_suppl.29
55. Duan J, Deng T, Ying G, et al. Prognostic nomogram for previously untreated patients with esophageal squamous cell carcinoma after esophagectomy followed by adjuvant chemotherapy. Jpn J Clin Oncol. 2016;46(4):336–343. doi:10.1093/jjco/hyv206
56. Simson L, Ellyard JI, Dent LA, et al. Regulation of carcinogenesis by IL-5 and CCL11: a potential role for eosinophils in tumor immune surveillance. J Immunol. 2007;178(7):4222–4229. doi:10.4049/jimmunol.178.7.4222
57. Wang J, Huang S, Zhang L, et al. Combined prognostic value of the cancer stem cell markers CD47 and CD133 in esophageal squamous cell carcinoma. Cancer Med. 2019;8(3):1315–1325. doi:10.1002/cam4.1894
58. Zheng H, Bai L. Hypoxia induced microRNA-301b-3p overexpression promotes proliferation, migration and invasion of prostate cancer cells by targeting LRP1B. Exp Mol Pathol. 2019;111:104301
59. Beer AG, Zenzmaier C, Schreinlechner M, et al. Expression of a recombinant full-length LRP1B receptor in human non-small cell lung cancer cells confirms the postulated growth-suppressing function of this large LDL receptor family member. Oncotarget. 2016;7(42):68721–68733
60. Yang M, Yuan Z. A novel role of PRR14 in the regulation of skeletal myogenesis. Cell Death Dis. 2015;6(4):e1734. doi:10.1038/cddis.2015.103
61. Chen X, Cao Y, Sedhom W, et al. Distinct roles of PIK3CA in the enrichment and maintenance of cancer stem cells in head and neck squamous cell carcinoma. Mol Oncol. 2020;14(1):139–158. doi:10.1002/1878-0261.12584
62. Hu J, Zhang X, Wang F, et al. Effect of ceritinib (LDK378) on enhancement of chemotherapeutic agents in ABCB1 and ABCG2 overexpressing cells in vitro and in vivo. Oncotarget. 2015;6(42):44643–44659. doi:10.18632/oncotarget.5989
63. Munoz M, Henderson M, Haber M, Norris M. Role of the MRP1/ABCC1 multidrug transporter protein in cancer. IUBMB Life. 2007;59(12):752–757. doi:10.1080/15216540701736285
 © 2021 The Author(s). This work is published and licensed by Dove Medical Press Limited. The full terms of this license are available at https://www.dovepress.com/terms.php and incorporate the Creative Commons Attribution - Non Commercial (unported, v3.0) License.
By accessing the work you hereby accept the Terms. Non-commercial uses of the work are permitted without any further permission from Dove Medical Press Limited, provided the work is properly attributed. For permission for commercial use of this work, please see paragraphs 4.2 and 5 of our Terms.
© 2021 The Author(s). This work is published and licensed by Dove Medical Press Limited. The full terms of this license are available at https://www.dovepress.com/terms.php and incorporate the Creative Commons Attribution - Non Commercial (unported, v3.0) License.
By accessing the work you hereby accept the Terms. Non-commercial uses of the work are permitted without any further permission from Dove Medical Press Limited, provided the work is properly attributed. For permission for commercial use of this work, please see paragraphs 4.2 and 5 of our Terms.