")
Back to Journals » ClinicoEconomics and Outcomes Research » Volume 14
Costs by Site of Service for Commercially-Insured Patients with Metastatic Pancreatic Cancer Receiving Guideline-Recommended Chemotherapy: Comparing Community Oncology and Hospital Outpatient Settings
Authors Tomicki S , Dieguez G, DeStephano D, Chang M , Cockrum P
Received 14 June 2022
Accepted for publication 23 September 2022
Published 10 October 2022 Volume 2022:14 Pages 653—663
DOI https://doi.org/10.2147/CEOR.S373316
Checked for plagiarism Yes
Review by Single anonymous peer review
Peer reviewer comments 2
Editor who approved publication: Prof. Dr. Dean Smith
Samantha Tomicki,1 Gabriela Dieguez,1 David DeStephano,1 Melody Chang,2 Paul Cockrum3
1Milliman, Inc, New York, NY, USA; 2American Oncology Network, Fort Meyers, FL, USA; 3Ipsen Biopharmaceuticals, Inc, Cambridge, MA, USA
Correspondence: Gabriela Dieguez, Milliman, Inc, 463 7th Avenue, 19th Floor, New York, NY, 10018 USA, USA, Tel +1 917 903 3670, Email [email protected]
Purpose: Compare total cost of care (TCOC) for commercially-insured patients with metastatic pancreatic cancer receiving FDA-approved/NCCN Category 1 preferred regimens in community oncology or hospital outpatient settings.
Patients and Methods: We used the 2016– 2019 MarketScan® and Milliman Consolidated Health Cost Guidelines Sources Database (CHSD) administrative claims data to compare utilization of healthcare services and expenditures for commercially-insured patients receiving chemotherapy in community oncology or hospital outpatient settings. We identified patients with metastatic pancreatic cancer using ICD-10 diagnosis codes in 2016– 2019 MarketScan® and Milliman Consolidated Health Cost Guidelines Sources Database files. Patients were assigned to cohorts based on where they received the plurality of chemotherapy services: community oncology or hospital outpatient settings. Total cost of care (TCOC) and healthcare resource utilization metrics were calculated per line of therapy (LOT) for patients receiving similar chemotherapy regimens in each cohort, and differences between cohorts were evaluated using t-testing and chi-squared statistical methods.
Results: Although cohorts had similar demographics, chemotherapy regimen use, and length of therapy, the mean TCOC among all patients receiving chemotherapy in hospital outpatient settings was 41% higher compared to community oncology settings. Median TCOC was 35% higher in hospital outpatient settings than in community oncology settings. Mean admissions and readmissions per beneficiary were 7% and 16% higher, respectively, for thse treated in hospital outpatient versus community oncology settings. We observed no differences in the use of emergency department or hospice care between the cohorts.
Conclusion: Our study indicates that patients receiving chemotherapy at community oncology centers are associated with better or equivalent outcomes and lower costs than patients receiving the same regimen in a hospital outpatient setting.
Keywords: chemotherapy, reimbursement, 340B, claims analysis
Introduction
The National Cancer Institute estimates that 60,430 adults in the United States will be diagnosed with pancreatic cancer in 2021.1 While pancreatic cancer accounts for only 3% of cancer diagnoses in the US, it is associated with 7% of cancer deaths,1 and by 2030, it is projected to be the second leading cause of cancer-related death in the United States.2 For more than half of patients with pancreatic cancer, the cancer has metastasized by the time of diagnosis.3 Patients with metastatic pancreatic cancer who receive chemotherapy have a reduced risk of death and higher quality of life compared to patients who receive only supportive care.4 FDA-approved National Comprehensive Cancer Care Network® (NCCN) Category 1 recommended chemotherapy regimens include (first-line) gemcitabine/nab-paclitaxel, FOLFIRINOX, gemcitabine monotherapy, or (second-line) fluorouracil (5-FU) plus leucovorin and liposomal irinotecan for locally advanced cancer.5 Evidence suggests that combination regimens, such as gemcitabine plus taxanes or FOLFIRINOX, have a survival benefit over gemcitabine monotherapy.6,7
Outpatient chemotherapy can be provided in hospital or community oncology facilities. A study published in JAMA examining the cost of care for breast cancer indicated that community oncology settings provided a lower total cost of care (TCOC) compared to hospital outpatient settings,8 and another study showed that community oncology settings also result in lower rates of hospital and emergency department admissions.9 Additional analyses have indicated that the same relationship holds true for the treatment of other cancers, with community oncology settings providing a lower TCOC.10 Among commercial payers, reimbursement rates may vary between patients treated in community oncology and hospital outpatient settings, and even between patients treated at different hospitals, due to highly complex contracting provisions.11,12 There is currently little published literature examining differences in healthcare resource utilization and TCOC for patients with metastatic pancreatic cancer by site of care.
The purpose of this observational study was to describe the differences in TCOC and healthcare resource utilization among commercially insured patients with metastatic pancreatic cancer receiving similar chemotherapy regimens in community oncology and hospital outpatient settings. The study focused on patients receiving FDA-approved NCCN Category 1 recommended chemotherapy regimens.
Materials and Methods
Identification of Study Population
Patients without end-stage renal disease with at least two pancreatic cancer diagnosis codes (ICD-9-CM 157.xx or ICD-10 C25.xx, excluding C25.4) on separate days at least 30 days apart, and at least one diagnosis of a metastasis (ICD-9-CM 196.xx, 197.xx, 198.xx, 199.0, 199.1 or ICD-10 C77.xx, C78.xx, C79.xx, C80.0, C80.1) anytime on or after the first pancreatic cancer diagnosis. The date of the earliest diagnosis of secondary malignancy was considered as the patient’s index date. Patients in this study received one of the metastatic pancreatic cancer therapies of interest (for full list, see Supplemental Data). Patients were grouped based on whether they received the following FDA-approved NCCN Category 1 recommended regimens: first-line (1L) FOLFIRINOX, 1L gemcitabine and nab-paclitaxel, 1L gemcitabine monotherapy, or second-line (2L) 5-FU plus leucovorin and liposomal irinotecan. Due to data and sample size limitations, 2L liposomal irinotecan was identified without the requirement of concomitant 5-FU plus leucovorin (referred to as “liposomal irinotecan-based therapy” in this paper). See the “Data Limitations” section for more information.
NCCN Clinical Practice Guidelines in Oncology (NCCN Guidelines®)
NCCN is a network of 31 cancer centers in the United States that provide patient services as well as clinical research and educational resources.13 The NCCN Guidelines® detail suggested evidence-based comprehensive treatment options to ensure the best possible outcomes for patients; they are recognized as a standard of care for 97% of cancers, including pancreatic cancer.14
Detailed Inclusion/Exclusion Criteria
Patients in the study had 3 months of continuous pre-index enrollment and 1 month of continuous post-index enrollment in a commercial plan. Patients under 18 or over 65 years of age, patients with missing age or gender, and patients with evidence of certain non-pancreatic primary or secondary malignancy (ICD-9-CM 140.xx-209.xx or ICD-10-CM C00.xx-C96.xx, C7A, C7B) during the 3-month pre-index period were excluded.
Place of Service (POS) Assignment
Patients were grouped into two cohorts (community oncology and hospital outpatient) based on the site of service of the plurality of their chemotherapy claims (the site that had the most claims). Site of service was identified using POS codes (hospital outpatient: POS 19, 22; community oncology clinic: POS 11) and billing category for chemotherapy. Chemotherapy services rendered in a hospital outpatient setting are defined as those received by a patient in a hospital without being admitted as inpatient and having an overnight stay. Community oncology centers are defined as private, physician-owned businesses not owned by a hospital or an academic or medical teaching institution. POS 19 had no claims in our data and was therefore not included in the final data output for this study.
Line of Therapy (LOT)
An episode of systemic therapy was defined based on the first claim for a chemotherapy of interest. Radiation, surgery, and megestrol were excluded from counting as a LOT. The first LOT was defined as the first episode of an eligible therapy given after or in the 14 days preceding the beneficiary’s index date. LOTs included other eligible drugs given within 28 days of the beginning of an episode for eligible therapy and a regimen was defined as the combination of eligible therapies given during that LOT.
We permitted several changes within a LOT without advancing the LOT, including substituting fluorouracil (5-FU) for capecitabine or vice-versa, substituting leucovorin for levoleucovorin or vice-versa, and adding leucovorin or levoleucovorin to a regimen. Adding nab-paclitaxel to a gemcitabine regimen or vice versa within 90 days of the start of the LOT also did not advance the LOT, and both drugs were included in the regimen name.
The end of the most recent LOT was defined as the earlier of the day before a new chemotherapy regimen began or 28 days after the most recent administration, visit date, or order for oral therapy (after the first date of chemotherapy). The end of other LOTs was defined as the day before the start date of the next LOT. If a beneficiary did not receive or stopped receiving chemotherapy, we followed the beneficiary for 90 days after the index date (for beneficiaries not receiving any chemotherapy) or the end of the previous LOT (for beneficiaries stopping chemotherapy).
Cost of Care
TCOC was calculated as the sum of inpatient, outpatient, and pharmacy costs incurred by payers during a LOT and represent amounts paid to providers excluding patient cost sharing.
Charlson Comorbidity Index
The Charlson Comorbidity is a weighted index used to predict the risk of death within one year of hospitalization for patients with specific comorbid conditions. Seventeen conditions were included in the index, including cancer, which were identified by ICD-10 diagnoses codes on any position of any medical claim.15,16
Statistical Analysis
This is a descriptive analysis comparing costs and resource utilization of chemotherapy in hospital outpatient and community oncology centers for patients with pancreatic cancer. Crude mean and median TCOC as well as healthcare resource utilization rates for community oncology and hospital outpatient were evaluated. Standard deviations and interquartile ranges (IQRs) were used to assess variability in measured outcomes. Student’s t-tests and chi-squared tests were used to evaluate differences in mean costs and utilization measures for continuous and categorical variables, respectively. For median TCOC, a Wilcoxon rank-sum test was used. When appropriate, the outcome variable was logged prior to testing.
A Bonferroni adjustment was used for the 10 independent tests in the analysis, so a corrected P value <0.005 (P = 0.05 divided by ten tests) was required for statistical significance. The Bonferroni adjustment is considered conservative in determining significance, especially when outcomes are correlated,17 so significance in this study may be understated.
We did not attempt to control for potential confounding variables that may impact differences in TCOC between community oncology and hospital outpatient settings, as that exploration was beyond the scope of this descriptive analysis.
Data Sources
We used 2016–2019 administrative claims data from IBM MarketScan® and the Milliman Consolidated Health Cost Guidelines Sources Database (CHSD) for this analysis. These databases contain historical claims experience for nearly 50 million commercially insured lives from around 100 large payers nationally, representing relatively rich health benefits. These datasets were licensed by Milliman; the authors are employees of Milliman and are authorized to use this data for research purposes. Quality metrics relevant to the study period were derived from the documentation provided by the Center for Medicare and Medicaid Services (CMS) Oncology Care Model (OCM) (Table S2). Per Code of Federal Regulations Title 45, Subtitle A, Subchapter A, Part 46, Subpart A, §46.104(d)(4)(iii),18 the secondary analysis of non-identifiable existing data does not require IRB review if it does not fall within the regulatory definition of research involving human subjects. The data used in this study has been stripped of all identifying information in a way that the identity of the human subjects cannot readily be ascertained directly or through identifiers linked to the subjects. Since the data is no longer identifiable, its use does not constitute human subjects research.
Results
We identified 6849 patients with metastatic pancreatic cancer in the commercial study population, with a mean age of 56 years at diagnosis. Patients receiving chemotherapy in a hospital setting accounted for about 60% of all patients in our study: 2704 patients received the plurality of their chemotherapy treatments in community oncology centers, compared to 4145 patients treated primarily in the hospital outpatient setting. Both populations had similar mean ages at initial (56.4 vs 56.0) and metastatic (56.5 vs 56.1) diagnosis, Charlson Comorbidity Index (CCI) score (2.9 vs 3.0), percent male (56.7% vs 58.4%), and share of beneficiaries receiving chemotherapy within 6 months of index (24.1% vs 23.6%) (Table 1). Both cohorts had the same mean length of LOT (154 days), and there were no statistically significant differences in mean length of LOT by site of service for any of the regimens studied (Table 2). The mix of chemotherapy regimens used by both cohorts was also found to be comparable (P=0.99).
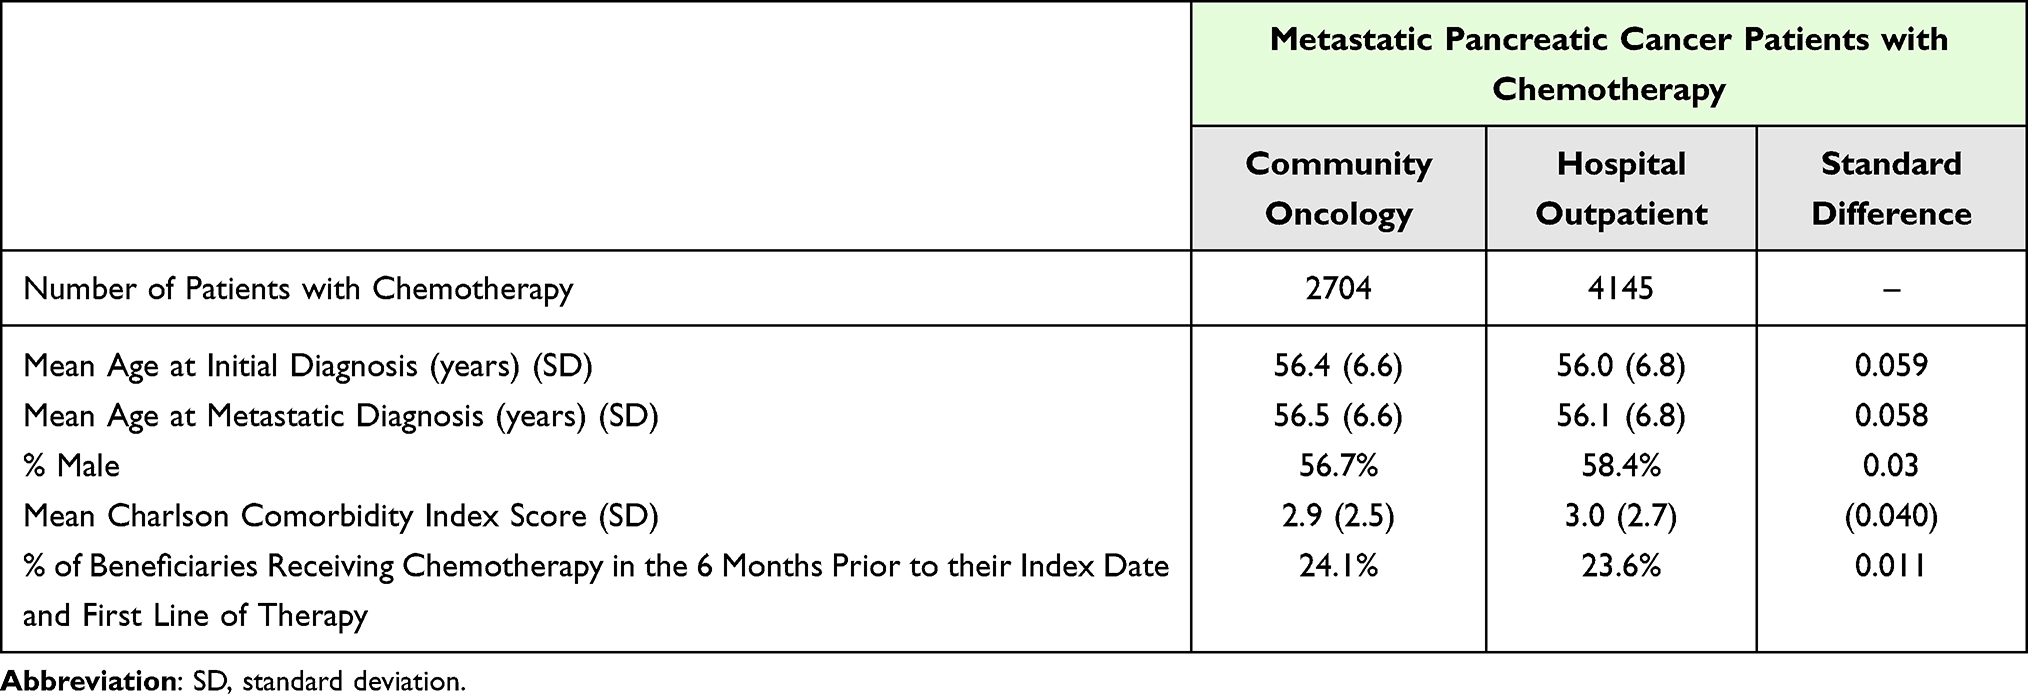 |
Table 1 Demographic Information of Beneficiaries by Site of Service |
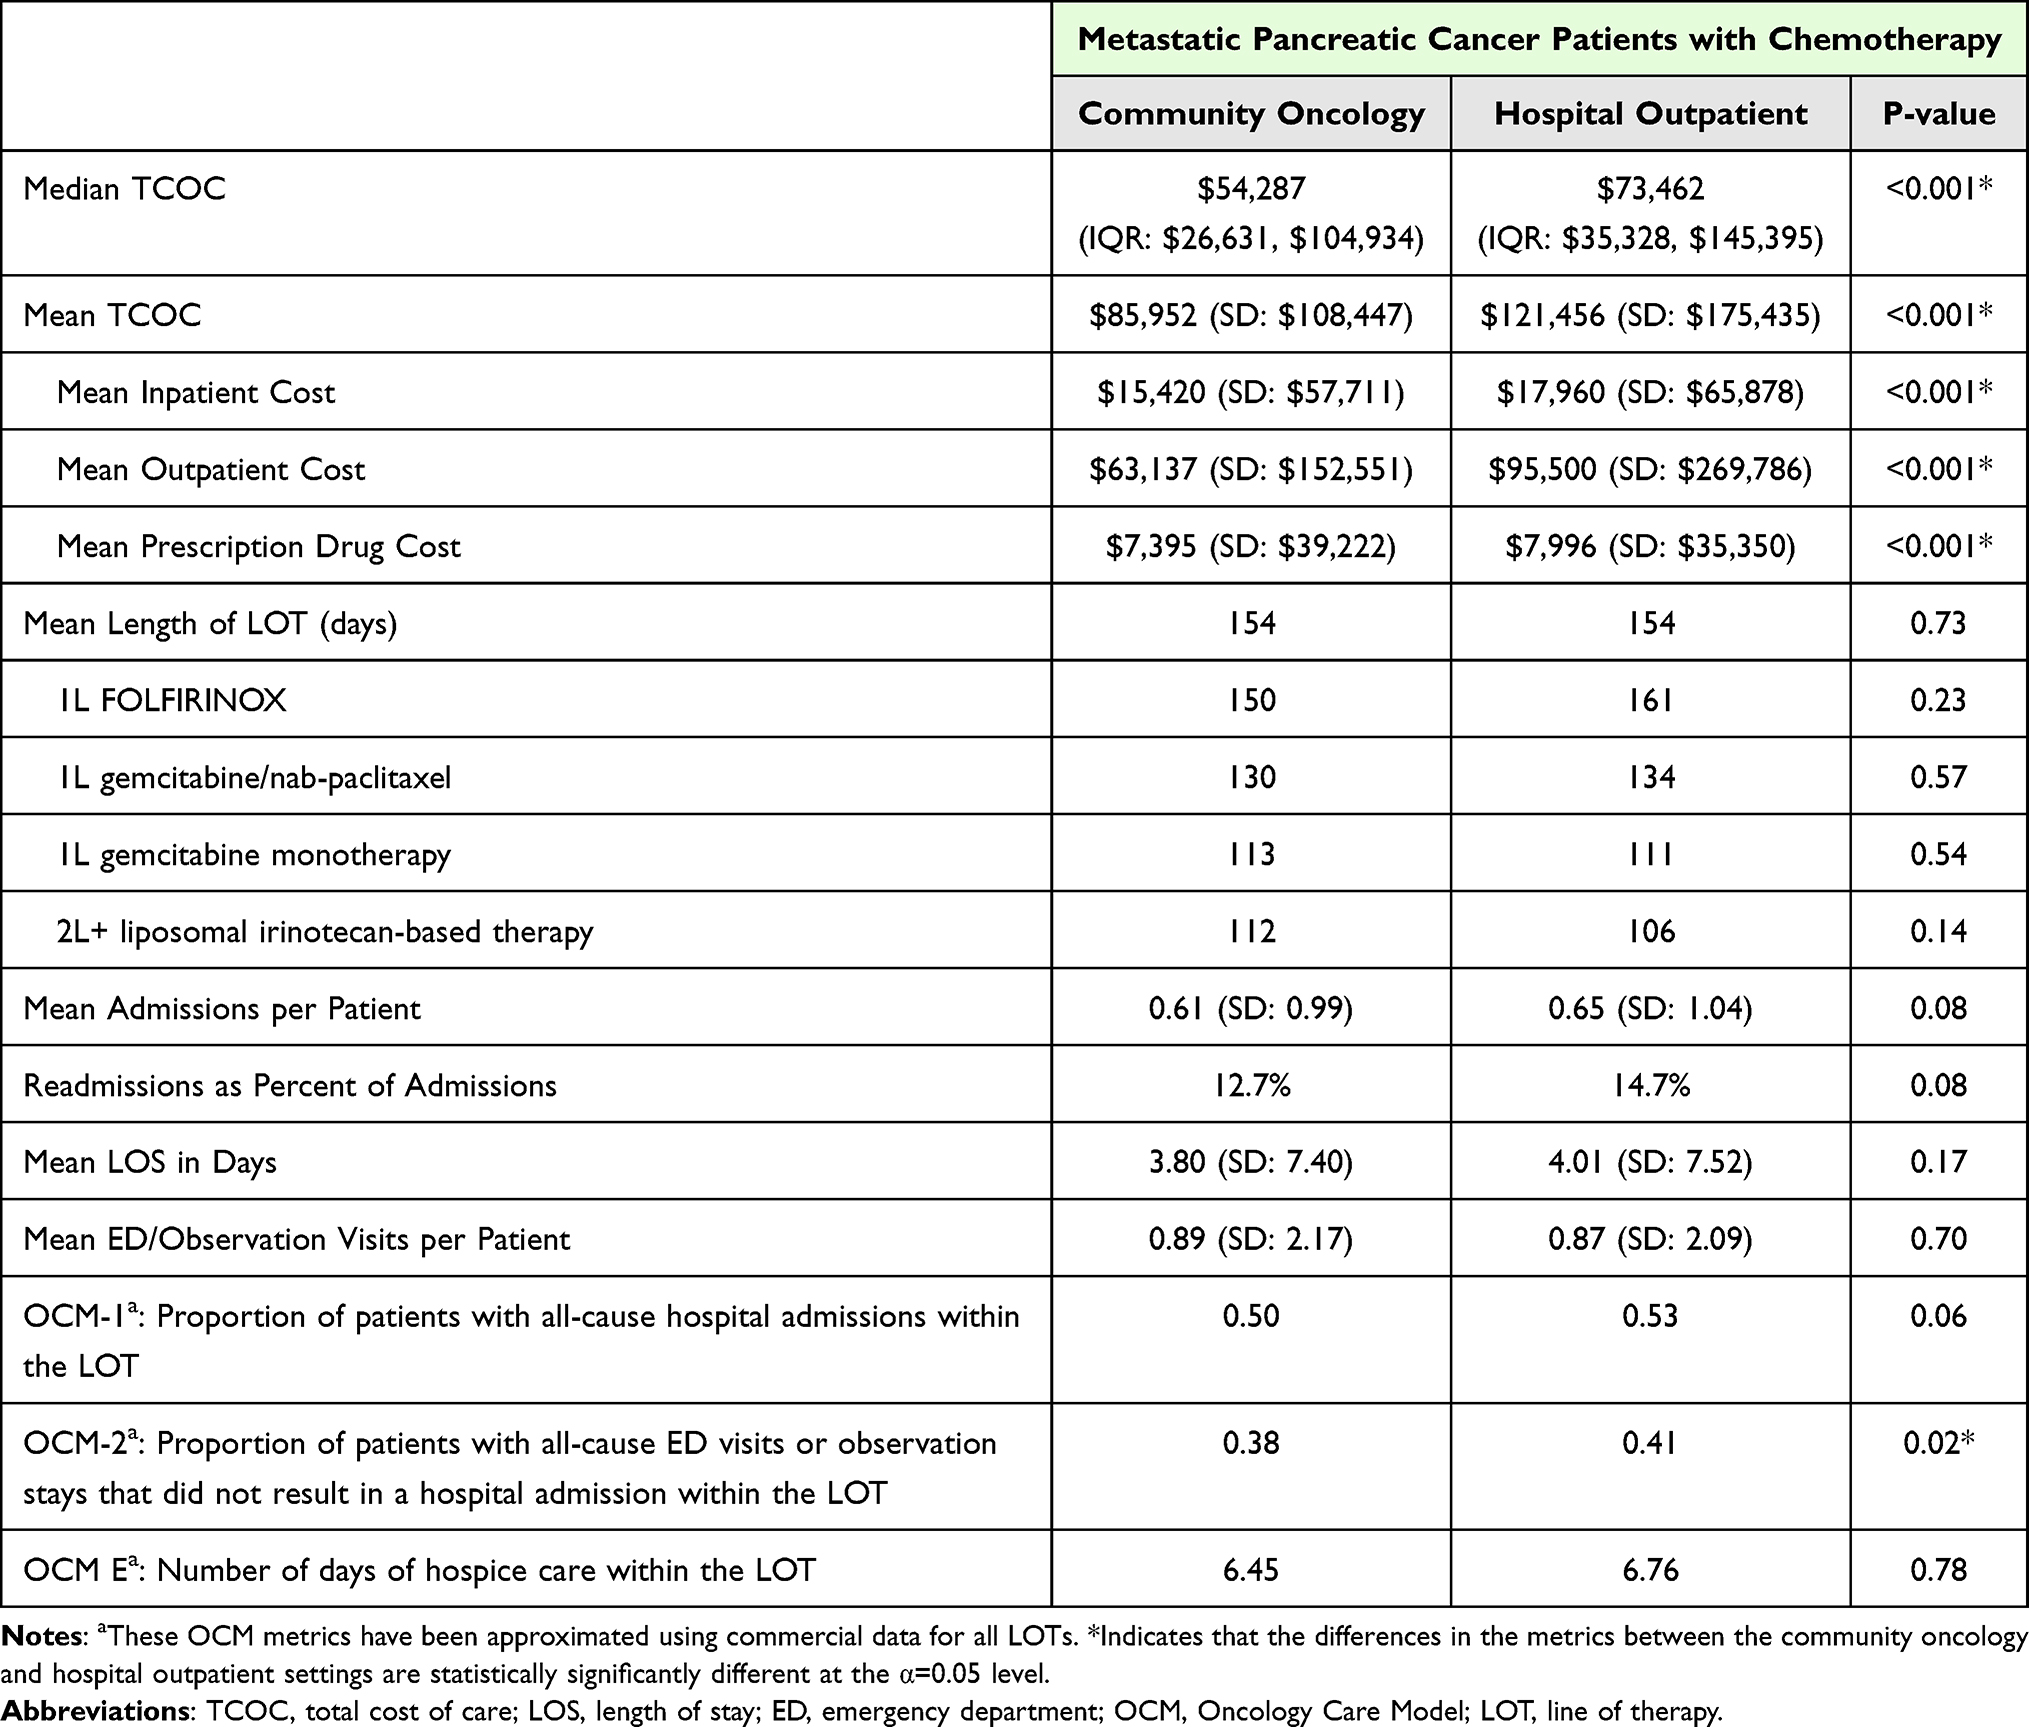 |
Table 2 Cost and Utilization by Site of Service |
Descriptive statistics for TCOC and utilization metrics for community oncology and hospital outpatient were evaluated (Table 2). Across all chemotherapy regimens using any line of therapy, the median TCOC was 35% higher (P<0.001), and the mean TCOC 41% higher (P<0.001), in hospital outpatient settings than in community oncology settings. Mean inpatient, outpatient, and prescription drug costs were also higher in the hospital outpatient setting (P<0.001 for all measures). The observed range of costs and standard deviations were greater across all cost metrics in the hospital outpatient setting as well (Figure 1). Mean readmission rate and mean proportion of patients with all-cause emergency department (ED) visits or observation stays that did not result in a hospital admission within the LOT (OCM-2) were lower in the community oncology setting (both P<0.05).
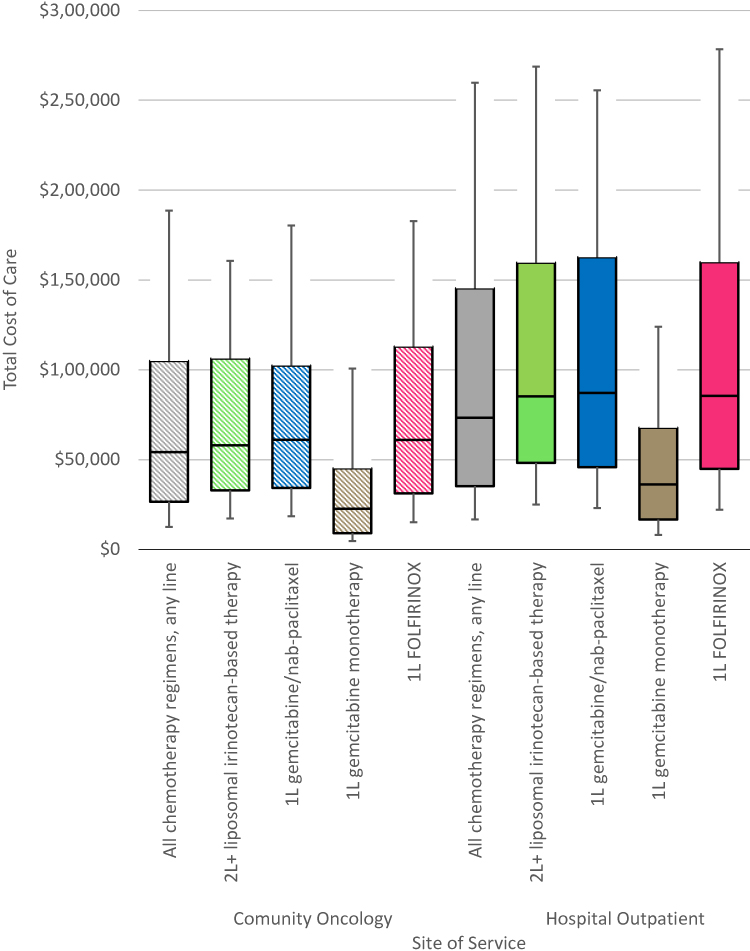 |
Figure 1 Distribution of total cost of care by site of service and chemotherapy regimen, 10th, 25th, 50th, 75th, and 90th percentiles shown. |
Across all chemotherapy regimens using any line of therapy, patients receiving chemotherapy in a community oncology setting had lower median TCOC ($54,287) compared to those receiving chemotherapy in a hospital outpatient setting ($73,462) (Table 2). A similar relationship was observed when analyzing patients receiving the same regimen in different settings for each of the four regimens in this study: 1L FOLFIRINOX, 1L gemcitabine/nab-paclitaxel, 1L gemcitabine monotherapy, and 2L+ liposomal irinotecan-based therapy (Table 3).
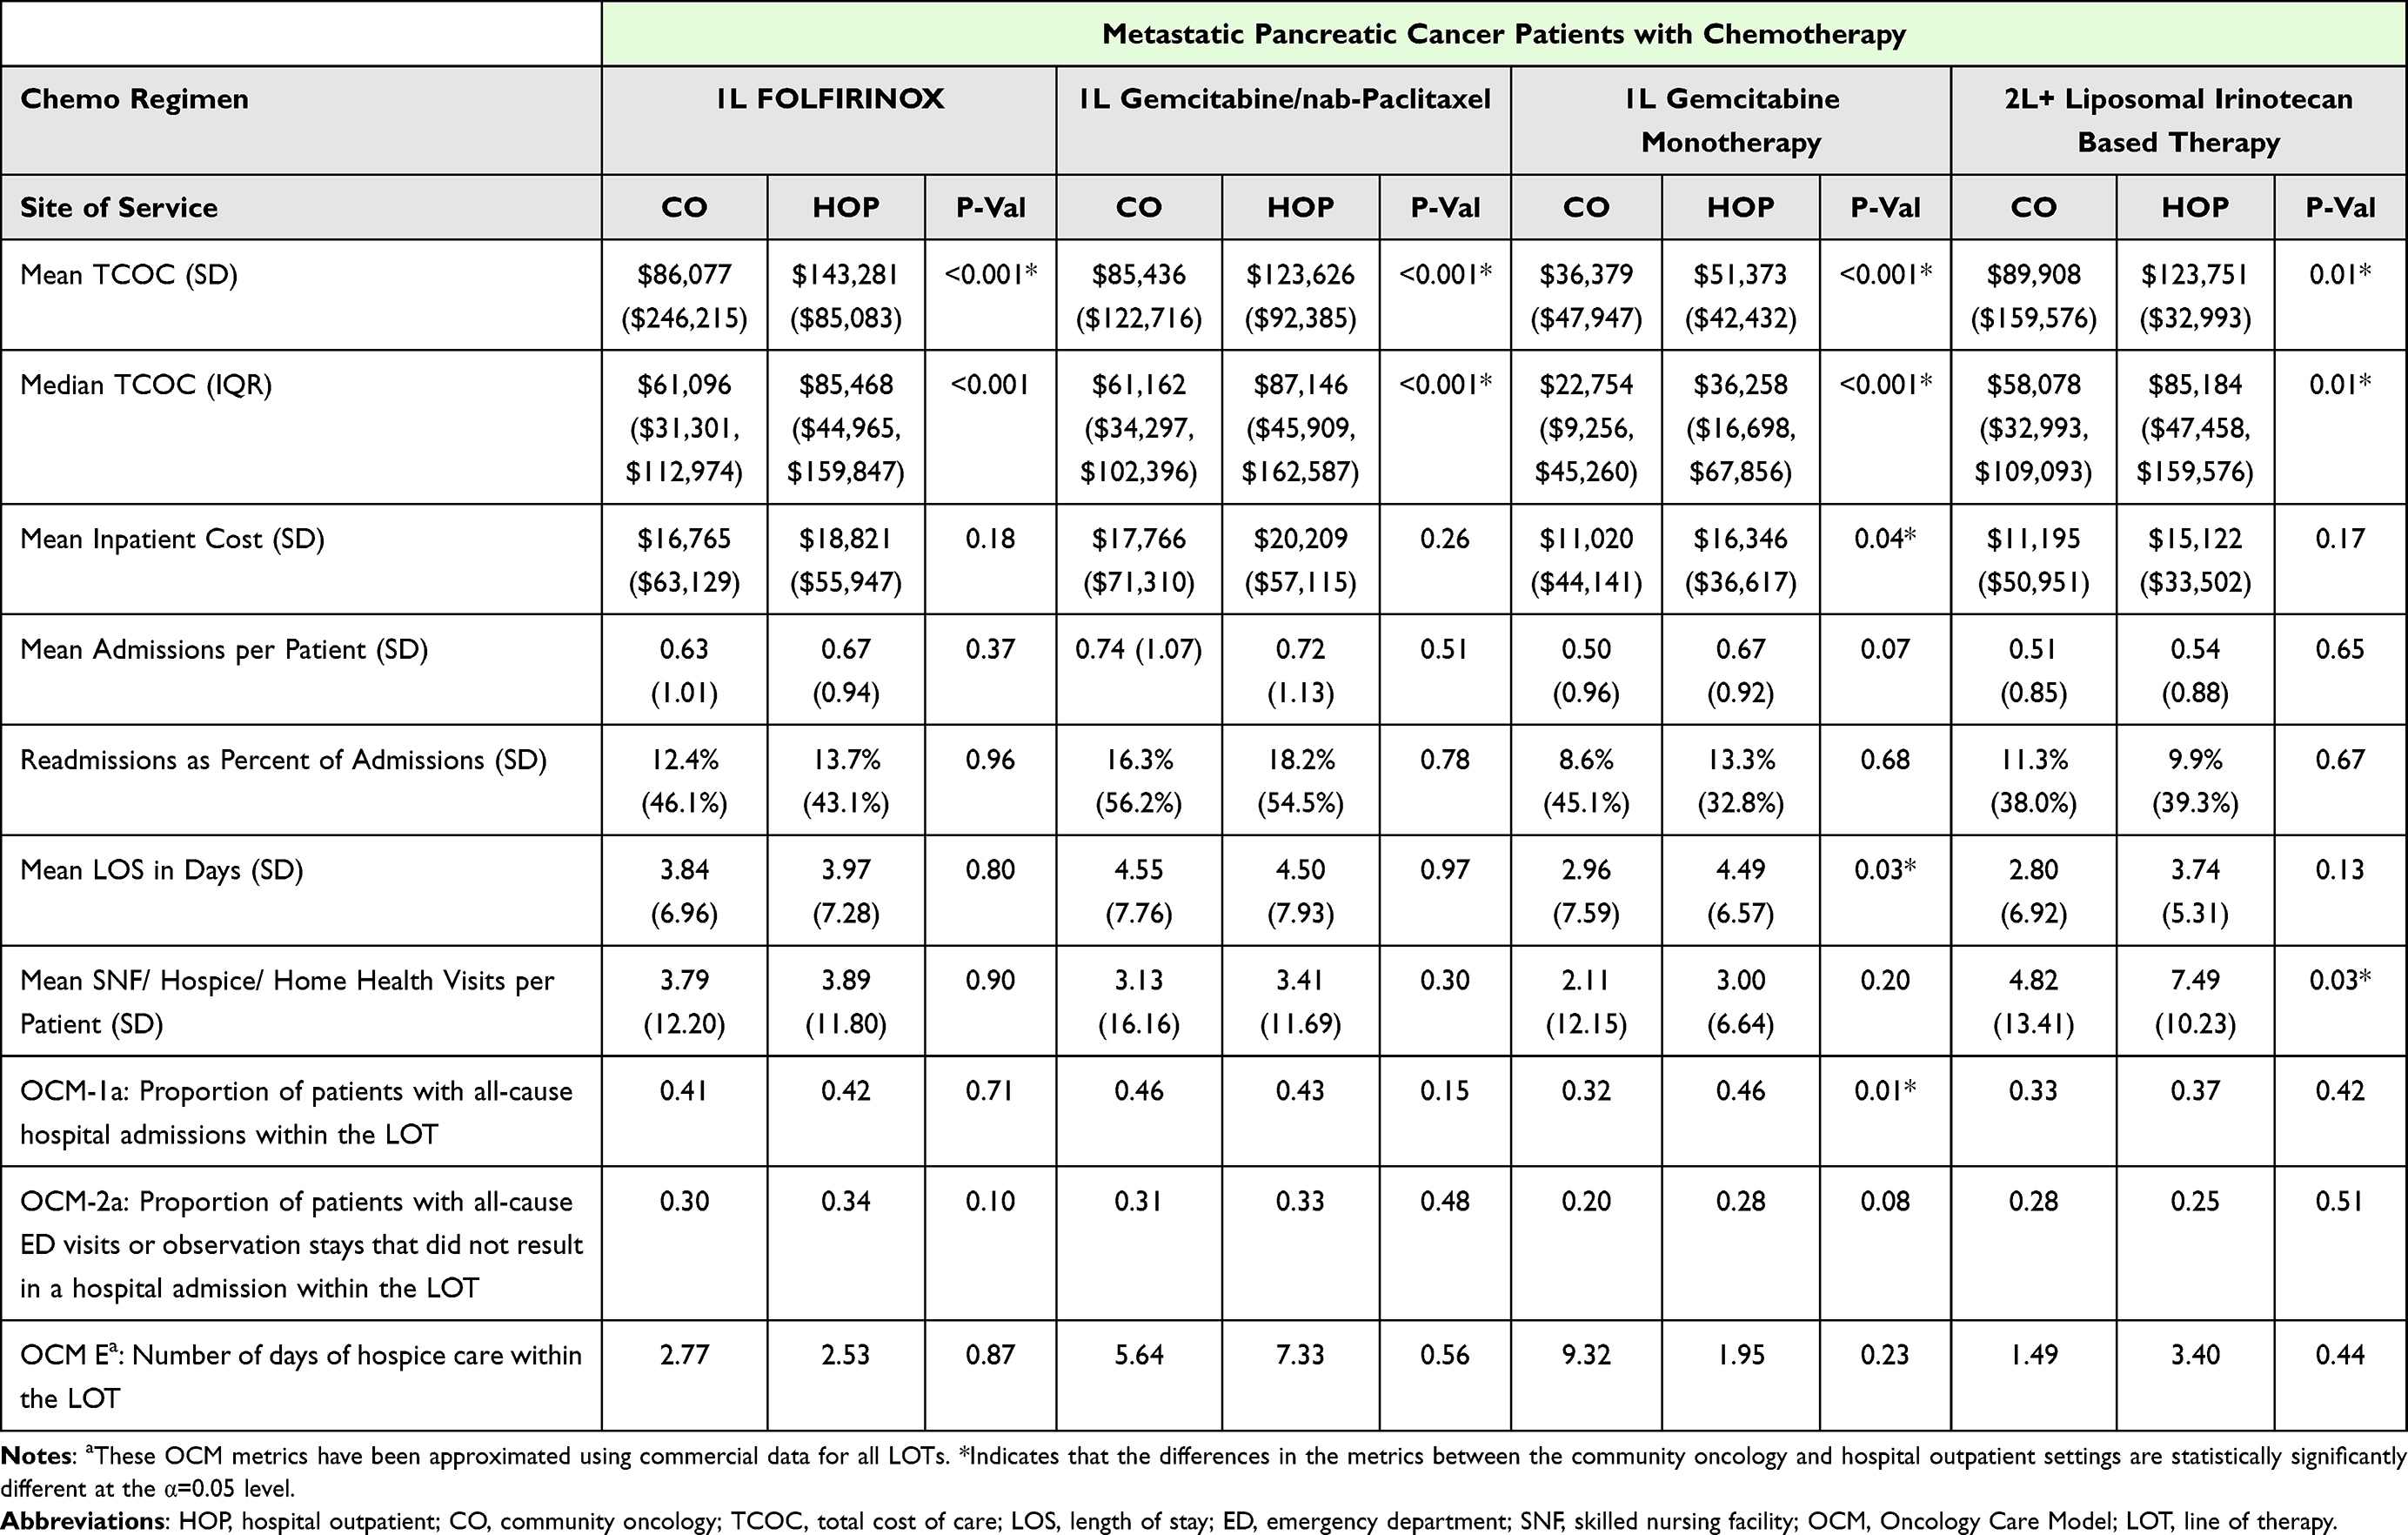 |
Table 3 Cost and Utilization by Site of Service and Chemotherapy Regimen |
Across all chemotherapy regimens using any line of therapy, mean TCOC was $35,504 higher (P<0.001) for patients receiving chemotherapy in a hospital outpatient setting compared to a community oncology setting. Cost differences for outpatient drugs accounted for 72% of that difference (Table 2). Patients receiving 2L+ liposomal irinotecan-based therapy had the smallest difference in mean TCOC between hospital outpatient and community oncology settings (27%), while patients receiving FOLFIRINOX had the largest (40%) (Table 3).
Patients receiving 1L FOLFIRINOX, 1L gemcitabine monotherapy, and 2L+ liposomal irinotecan-based therapy in the community oncology setting experienced lower admissions per beneficiary, whereas those receiving 1L gemcitabine/nab-paclitaxel experienced higher admissions per beneficiary, than patients treated at a hospital outpatient setting (Table 3). Across all chemotherapy regimens using any line of therapy, mean admissions per beneficiary were lower for patients receiving chemotherapy in a community oncology setting (0.61 admissions) than in a hospital outpatient setting (0.65 admissions), although the difference was not significant (P=0.08) (Figure 2).
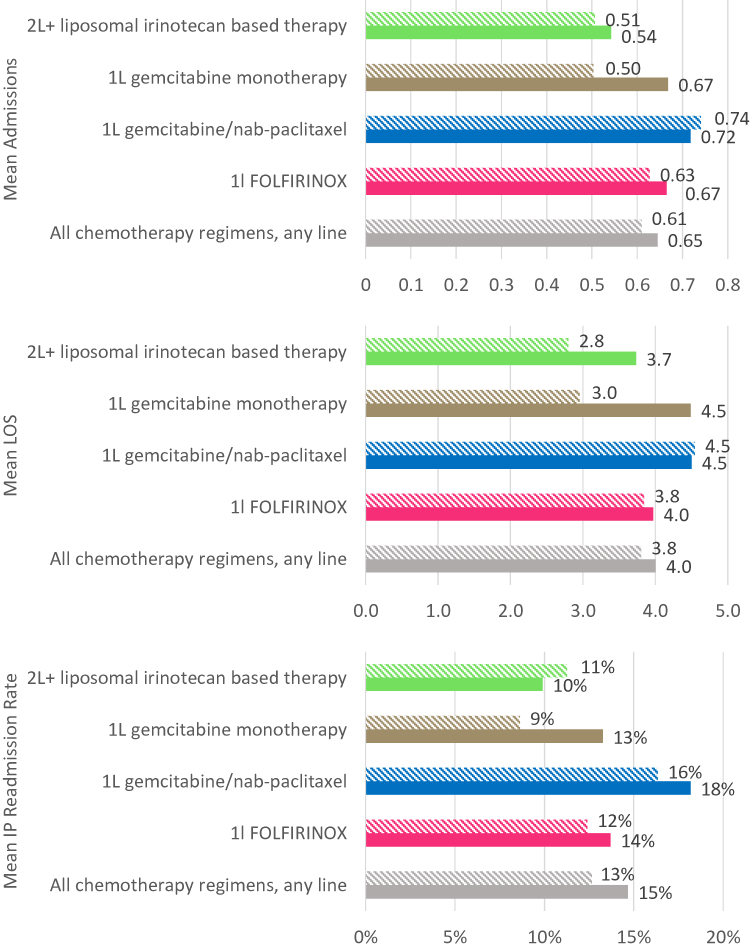 |
Figure 2 Utilization metrics per beneficiary. |


Mean lengths of stay for inpatient admissions were comparable (P=0.17) for patients receiving chemotherapy in a community oncology setting (3.8 days) compared to a hospital outpatient setting (4.01 days) across all chemotherapy regimens and lines of therapy. Across all chemotherapy regimens and lines of therapy, mean inpatient readmission rates were lower (P=0.03) for patients receiving chemotherapy in a community oncology setting (13%) compared to a hospital outpatient setting (15%) (Figure 2).
For an index of terms in Tables 1–3, please also see Table S1.
Discussion
Previous investigations have shown that, from 2004 to 2014, the trend in chemotherapy site of service shifted from the community oncology setting to the hospital outpatient setting: the number of chemotherapy infusions delivered in hospital outpatient departments increased from 15.8% (2004) to 45.9% (2014) for Medicare beneficiaries and 5.8% (2004) to 45.9% (2014) for commercial beneficiaries.19 Our current study supports these findings, with 60% of commercially insured patients aged 18–64 receiving chemotherapy for metastatic pancreatic cancer being treated in the hospital outpatient setting between 2016 and 2019.
Our analysis found no meaningful demographic differences between patients receiving chemotherapy in a community oncology setting compared to a hospital outpatient setting. One reason for this finding may be that the choice of site of service for chemotherapy may be determined by an oncologist’s affiliation with a hospital or community oncology center. Further studies are needed to understand the drivers of site of care and their role in recent shifts from community oncology to hospital outpatient settings.
Existing literature suggests that cancer care is more expensive in the hospital outpatient setting than the community oncology setting.10,20 Our results are consistent with these findings. In our study, mean TCOC was $121,456 (SD = $175,435) for patients receiving chemotherapy in a hospital outpatient setting compared to $85,952 (SD = $108,447) for those receiving chemotherapy in a community oncology setting, a difference of 41%. Median and interquartile hospital outpatient TCOC were also higher than in the community oncology setting. These results could not be explained by differences in length of LOT by site of care.
Studies have also evaluated the differences between provider reimbursement rates in the community and the hospital outpatient setting. These studies have consistently found a higher rate of reimbursement for outpatient services administered in the hospital setting, even among Medicare beneficiaries.11,12,21,22 Unlike in Medicare, reimbursement rates in the commercial population are the result of negotiations between providers and payers. While not in the public domain, these rates have been reported to exceed Medicare levels in both settings, although at least one study indicates the excess is more pronounced for hospital outpatient services than for other categories of service.23
In addition to higher reimbursement rates, many hospitals benefit from lower drug acquisition costs through the 340B program.24 The 340B drug pricing program enables institutions that service specialty populations to acquire drugs at lower prices, which is designed to allow these institutions to provide higher quality of care, particularly to underserved populations. However, there is limited research available to demonstrate that this program reduces costs or improves quality compared to non-340B hospitals,25 and studies have shown that hospital’s financial gains from the 340B program have not been associated with expanded care or improved outcomes among low-income patients.26 The 340B program is not as widely available to community oncology practices. The combination of higher reimbursement and lower acquisition costs can allow hospitals to realize higher margins for the administration of chemotherapy.
Despite demonstrating lower costs, community oncology settings had lower utilization of inpatient services, as measured by mean admissions per patient, length of stay (LOS), and readmission rates across all chemotherapy regimens using any line of therapy. A similar pattern was observed when comparing estimated OCM quality metrics, including proportion of patients with all-cause admissions and proportion of patients with all-cause ED visits not resulting in a hospital admission stay. However, we observed similar use of hospice care, as measured in days of hospice care within the LOT (OCM promotes higher use of hospice care). Future studies could compare additional outcome metrics that we were not able to generate due to data limitations, including those utilizing mortality data.
The findings of our study suggest that increased costs for chemotherapy among patients with metastatic pancreatic cancer in hospital outpatient settings do not correspond with improved outcomes when compared to community oncology settings.
Data Limitations
The analysis of different populations or time periods may yield different results. This observational analysis was based on administrative claims data. The study has several limitations, because of the inherent restrictions of claims data. Both the MarketScan® and CHSD databases are comprised primarily of medical claims from employees and their dependents covered by self-insured large employer-sponsored private health plans with relatively rich benefits compared to Medicare or Medicaid coverage. Patients in our study were not randomly assigned to each regimen. In addition, we were unable to adjust for individual dosing periods for regimens and did not include therapies administered before the metastatic pancreatic cancer diagnosis date. Additional data limitations include being unable to track a patient’s date of death in the commercial claims files and being unable to control for clinical covariates due to the use of claims data, which is recorded for the purpose of reimbursement and not with a treatment intent and thus is imperfect in nature when used as a proxy to make clinical assumptions. Reimbursement levels are the result of negotiations between commercial payers and providers, can vary significantly from payer to payer, and are not in the public domain; therefore, we are unable to adjust for such differences between sites of service. Finally, due to data and sample size limitations, we did not study whether liposomal irinotecan patients received concomitant 5FU plus leucovorin or prior gemcitabine-based therapy.
Methodological Limitations
LOTs are defined on an episodic basis with specific start and end dates based on the observation of changes in therapy as evidenced by the claims data. Mean length, in days, of each LOT was demonstrated to be comparable between both sites of service across all chemotherapy regimens (Table 2). As a result, we did not use time-dependent measures such as per patient per month (PPPM) or per diem costs for this analysis. Additionally, this analysis does not account for factors outside of administrative claims data, such as non-clinical covariates, that may affect TCOC. Examples of non-clinical covariates include race, income level, and geography among others. T-tests and chi-squared tests simply measure the difference in means and proportions between two defined groups regardless of potential covariates. While techniques such as multivariate mixed effects regression models may be leveraged to measure the impact of covariates not included in the definition of the populations being studied, such an analysis is beyond the scope of this paper. Given that patients and providers decide whether care is received in a hospital outpatient setting or a community oncology center, this analysis is inherently subject to impact by selection bias. While we evaluated the two groups using age, gender, Charlson Comorbidity Index (CCI), percent of members receiving chemotherapy within 6 months, distribution of regimens used, and mean length of line of therapy, it is reasonable to expect that other variables that we did not include in our analysis are also covariates of the outcome variable.
Conclusion
The mean TCOC among patients with metastatic pancreatic cancer who received chemotherapy in a hospital outpatient setting is higher than for patients receiving similar therapies administered in a community oncology setting. The higher cost of treatment in a hospital outpatient setting does not appear to be correlated with improved outcomes or lower healthcare resource utilization among metastatic pancreatic cancer patients. Mean admissions, length of stay, readmissions, emergency department visits, and hospice days among patients receiving chemotherapy in a community oncology setting are lower than or comparable to those for patients receiving chemotherapy in a hospital outpatient setting. Further studies are needed to determine exogenous factors that contribute to the discrepancy in TCOC, such as choice of treatment, geography, and socioeconomic characteristics of patients treated in each site of service.
Site of care is an important consideration for some payers when evaluating medical management policies.27 Many commercial payers have implemented prior authorization to influence site of care.28,29 Benefit design also plays a role in incentivizing patients to seek care in more cost-efficient settings.30,31 The CMS Innovation Center has launched several programs with the aim of lowering costs, improving the quality and equity of patient care, and aligning payment with promoting patient-centered practices.32,33 Our study of patients with metastatic pancreatic cancer receiving NCCN Category 1 chemotherapy correlates chemotherapy administered in a hospital outpatient setting with higher payer cost, higher admissions and patient readmissions, and similar rates of emergency department and hospice utilization compared to community outpatient settings.
Funding
This study was sponsored by Ipsen Biopharmaceuticals, Inc. Medical writing support was sponsored by Ipsen in accordance with Good Publication Practice Guidelines.
Disclosure
Samantha Tomicki, Gabriela Dieguez and David DeStephano are affiliated with Milliman, Inc. Samantha Tomicki, Gabriela Dieguez and David DeStephano report personal fees from Ipsen Biopharmaceuticals, during the conduct of the study. Mr Paul Cockrum is an employee of Ipsen Biopharmaceuticals. The authors report no other conflicts of interest in this work.
References
1. American Cancer Society. Key statistics for pancreatic cancer. Available from: https://www.cancer.org/cancer/pancreatic-cancer/about/key-statistics.html.
2. Lambert A, Gavoille C, Conroy T. Current status on the place of FOLFIRINOX in metastatic pancreatic cancer and future directions. Therap Adv Gastroenterol. 2017;10(8):631–645. doi:10.1177/1756283X17713879
3. Siegel RL, Miller KD, Jemal A. Cancer statistics, 2018. CA Cancer J Clin. 2018;68(1):7–30. doi:10.3322/caac.21442
4. Khanal N, Upadhyay S, Dahal S, Bhatt VR, Silberstein PT. Systemic therapy in stage IV pancreatic cancer: a population-based analysis using the National Cancer Data Base. Ther Adv Med Oncol. 2015;7(4):198–205. doi:10.1177/1758834015579313
5. National Comprehensive Cancer Network. NCCN guidelines for patients: pancreatic cancer. Plymouth Meeting: NCCN Foundation; 2019.
6. Aditi K, Chia Jie T, Manit S, et al. Survival benefits and safety of chemotherapy regimens for pancreatic cancer: an umbrella review of meta-analyses of randomized controlled trials. Ann Pancreatic Disorders Treatment. 2022;4(1):001–020. doi:10.17352/apdt.000008
7. Kharat A, Brendle M, Chhibber A, Chaiyakunapruk N, Biskupiak J. Comparative safety and efficacy of therapeutic options in resectable and advanced/metastatic pancreatic cancer: a systematic review and indirect comparison. Oncol Res Treat. 2021;44(9):476–484. doi:10.1159/000517409
8. Winn AN, Keating NL, Trogdon JG, Basch EM, Dusetzina SB. Spending by commercial insurers on chemotherapy based on site of care, 2004–2014. JAMA Oncol. 2018;4(4):580–581. doi:10.1001/jamaoncol.2017.5544
9. Gordan LN, Blazer M, Xcenda B. Site of care cost analysis 2017; 2017. Available from: https://www.communityoncology.org/wp-content/uploads/2018/08/Site-of-Care-Cost-Analysis-White-Paper_9.25.17.pdf.
10. Hayes J, Hoverman RJ, Brow ME, et al. Cost differential by site of service for cancer patients receiving chemotherapy. Am J Manag Care. 2015;21(3):e189–96.
11. Higgins A, Veselovskiy G, Schinkel J. National estimates of price variation by site of care. Am J Manag Care. 2016;22(3):e116–21.
12. Congressional Budget Office. The prices that commercial health insurers and medicare pay for hospitals’ and physicians’ services; 2018. Available from: www.cbo.gov/publication/57422.
13. NCCN. About NCCN. Available from: https://www.nccn.org/about/default.aspx.
14. NCCN. NCCN guidelines® & clinical resources. Available from: https://www.nccn.org/professionals/.
15. Glasheen WP, Cordier T, Gumpina R, Haugh G, Davis J, Renda A. Charlson comorbidity index: ICD-9 update and ICD-10 translation. Am Heal Drug Benefits. 2019;12(4):188–197.
16. Charlson ME, Carrozzino D, Guidi J, Patierno C. Charlson comorbidity index: a critical review of clinimetric properties. Psychother Psychosom. 2022;91(1):8–35. doi:10.1159/000521288
17. Wilson DJ. The harmonic mean p-value for combining dependent tests. Proc Natl Acad Sci U S A. 2019;116(4):1195–1200. doi:10.1073/pnas.1814092116
18. Code of federal regulations 45 CFR 46.104(a). Available from: https://www.ecfr.gov/current/title-45/subtitle-A/subchapter-A/part-46/subpart-A/section-46.104.
19. Fitch K, Pelizzari PM, Pyenson B. Cost drivers of cancer care: a retrospective analysis of medicare and commercially insured population claim data; 2016:40. Available from: http://www.milliman.com/uploadedFiles/insight/2016/trends-in-cancer-care.pdf.
20. Robinson JC, Whaley CM, Brown TT. Price differences to insurers for infused cancer drugs in hospital outpatient departments and physician offices. Health Aff. 2021;40(9):1395–1401. doi:10.1377/hlthaff.2021.00211
21. Avalere Health. Medicare payment differentials across outpatient settings of care; 2016:1–43. Available from: http://www.physiciansadvocacyinstitute.org/Portals/0/assets/docs/Payment-Differentials-Across-Settings.pdf.
22. Wynn BO, Hilborne LEEH, Hussey P, Sloss EM. Medicare payment differentials across ambulatory settings; 2008.
23. Lopez E. How much more than medicare do private insurers pay? A review of the literature. Available from: https://www.kff.org/medicare/issue-brief/how-much-more-than-medicare-do-private-insurers-pay-a-review-of-the-literature/.
24. American Hospital Association. Fact sheet: the 340B drug pricing program; 2021. Available from: https://www.aha.org/system/files/media/file/2019/03/fact-sheet-340b-drug-pricinig-program-0119.pdf.
25. Winegarden W. Addressing the problems of abuse in the 340B drug pricing program; 2017. Available from: www.pacificresearch.org.
26. Desai S, McWilliams JM. Consequences of the 340B drug pricing program. N Engl J Med. 2018;378(6):539–548. doi:10.1056/NEJMsa1706475
27. Natalie Trebes CK& LC. Payers are shifting where patients receive infusions. Here’s what that means for 4 key industry players. Available from: https://www.advisory.com/blog/2020/10/infusion-site-of-care.
28. Cigna. Medication administration site of care; 2022:1–2. Available from: https://static.cigna.com/assets/chcp/pdf/coveragePolicies/pharmacy/ph_1605_coveragepositioncriteria_site_of_care.pdf.
29. Aetna. Drug infusion/injection site of care policy. Available from: https://www.aetna.com/health-care-professionals/utilization-management/drug-infusion-site-of-care-policy.html.
30. AJMC. Preferred site of care and coverage for infusions. Available from: https://www.ajmc.com/view/preferred-site-of-care-and-coverage-for-infusions.
31. Desai SM, Hatfield LA, Hicks AL, Chernew ME, Ateev Mehrotra ADS. What are the potential savings from steering patients to lower-priced providers? A Static Analysis. Am J Manag Care. 2019;25:e204–e210.
32. Centers for Medicare & Medicaid Services. About the CMS innovation center. Available from: https://innovation.cms.gov/about.
33. Centers for Medicare & Medicaid Services. Strategic direction. Available from: https://innovation.cms.gov/strategic-direction.
 © 2022 The Author(s). This work is published and licensed by Dove Medical Press Limited. The full terms of this license are available at https://www.dovepress.com/terms.php and incorporate the Creative Commons Attribution - Non Commercial (unported, v3.0) License.
By accessing the work you hereby accept the Terms. Non-commercial uses of the work are permitted without any further permission from Dove Medical Press Limited, provided the work is properly attributed. For permission for commercial use of this work, please see paragraphs 4.2 and 5 of our Terms.
© 2022 The Author(s). This work is published and licensed by Dove Medical Press Limited. The full terms of this license are available at https://www.dovepress.com/terms.php and incorporate the Creative Commons Attribution - Non Commercial (unported, v3.0) License.
By accessing the work you hereby accept the Terms. Non-commercial uses of the work are permitted without any further permission from Dove Medical Press Limited, provided the work is properly attributed. For permission for commercial use of this work, please see paragraphs 4.2 and 5 of our Terms.