")
Back to Journals » ClinicoEconomics and Outcomes Research » Volume 10
Cost-utility of surgical sutureless bioprostheses vs TAVI in aortic valve replacement for patients at intermediate and high surgical risk
Authors Povero M, Miceli A, Pradelli L , Ferrarini M, Pinciroli M, Glauber M
Received 29 August 2018
Accepted for publication 25 September 2018
Published 8 November 2018 Volume 2018:10 Pages 733—745
DOI https://doi.org/10.2147/CEOR.S185743
Checked for plagiarism Yes
Review by Single anonymous peer review
Peer reviewer comments 2
Editor who approved publication: Dr Samer Hamidi
Massimiliano Povero,1 Antonio Miceli,2,3 Lorenzo Pradelli,1 Matteo Ferrarini,2 Matteo Pinciroli,4 Mattia Glauber2
1AdRes Health Economics and Outcomes Research, Turin, Italy; 2Minimally Invasive Cardiothoracic Department, Istituto Clinico Sant’Ambrogio, Gruppo Ospedaliero San Donato, Milan, Italy; 3Bristol Heart Institute, University of Bristol, Bristol, UK; 4LivaNova, Milan, Italy
Background: Meta-analyses of studies comparing transcatheter aortic valve implants (TAVIs) and sutureless aortic valve replacement (SU-AVR) show differing effectiveness and safety profiles. The approaches also differ in their surgical cost (including operating room and device).
Objective: The objective of this study was to assess the incremental cost-utility of SU-AVR vs TAVIs for the treatment of intermediate- to high-risk patients in the US, Germany, France, Italy, UK, and Australia.
Methods: A patient-level simulation compares in-hospital pathways of patients undergoing SU-AVR or TAVIs; later, patient history is modeled at the cohort level. Hospital outcomes for TAVIs reproduce data from recent series; in SU-AVR patients, outcomes are obtained by applying relative efficacy estimates in a recent meta-analysis on 1,462 patients. After discharge, survival depends on the development of paravalvular leak and the need for dialysis. A comprehensive third-party payer perspective encompassing both in-hospital and long-term costs was adopted.
Results: Due to lower in-hospital (4.1% vs 7.0%) and overall mortality, patients treated with SU-AVR are expected to live an average of 1.25 years more compared with those undergoing TAVIs, with a mean gain of 1.14 quality-adjusted life-years. Both in-hospital and long-term costs were lower for SU-AVR than for TAVIs with total savings ranging from $4,158 (France) to $20,930 (US).
Conclusion: SU-AVR results dominant when compared to TAVIs in intermediate- to high-risk patients. Both in-hospital and long-term costs are lower for SU-AVR than for TAVI patients, with concomitant significant gains in life expectancy, both raw and adjusted for the quality of life.
Keywords: sutureless valve, aortic valve replacement, TAVI, DES model, cost-utility
Introduction
The possibility to surgically replace a damaged aortic valve represents a significant advantage for the majority of the patient population affected by severe aortic stenosis, which today is estimated at between 3% and 4% of patients aged >75 years.1
Surgical aortic valve replacement (SAVR) has excellent outcomes and is associated with low operative morbidity and mortality in patients with low surgical risk.2
Transcatheter techniques and technologies have expanded the population eligible for valve replacement to patients deemed inoperable or at an extremely high surgical risk. In the last few years, transcatheter aortic valve implants (TAVIs) have gained popularity and have been used to treat patients at lower surgical risk.3
Technologies for SAVR also continue to evolve; for example, sutureless aortic bioprostheses (sutureless aortic valve replacement [SU-AVR]) have been developed, which reduce operative time and risk, while facilitating minimally invasive surgical approaches.4
TAVIs and SAVR have been compared in several clinical trials, which have been pooled in meta-analyses,5,6 indicating substantial equivalence in terms of mortality and a different profile in the adverse effects. When used to inform economic analyses, these results led to estimates of significantly higher costs with TAVIs, coupled with a slight increase (0.2–0.4 quality-adjusted life-years [QALYs]) in quality-adjusted life expectancy, yielding incremental cost-effectiveness ratios (ICERs) around 50,000 $/QALY, which can be considered acceptable.7,8
The allocative efficiency of conventional AVR has also been compared with SU-AVR in developed countries, and both a modeling study9 and three single-center real-life experiences10–12 found that sutureless bioprostheses consistently outperformed traditional valves, as a consequence of faster recovery, made possible by reduced ischemic insults due to shorter cross-clamping time and increased recourse to a minimally invasive approach.
In contrast, a focused literature review revealed that the comparative economics of TAVIs and SU-AVR have not yet been assessed in a formal cost-effectiveness study, albeit having been explored in a single-center propensity-matched study.13
The aim of the present work was to thoroughly assess the incremental cost-utility of using SU-AVR instead of TAVIs for the treatment of an intermediate- and high-risk patient population in need of aortic valve substitution.
Methods
The cost-utility analysis was conducted by conceptualizing, developing, and feeding a simulation model integrating baseline outcomes of the target population, relative effectiveness estimates, and local unit cost data pertinent to the analyzed settings.
Model structure
A two-step model was built in Microsoft Excel 2013 to assess the cost-utility of SU-AVR using the Perceval® bioprosthesis vs TAVIs in intermediate- to high-risk patients.
The in-hospital pathway of each patient undergoing SU-AVR or TAVIs was simulated using a patient-level discrete event simulation (DES) structure, while a cohort Markov model with monthly cycles was chosen to describe the lifetime evolution for patients discharged alive from the hospital (Figure 1).
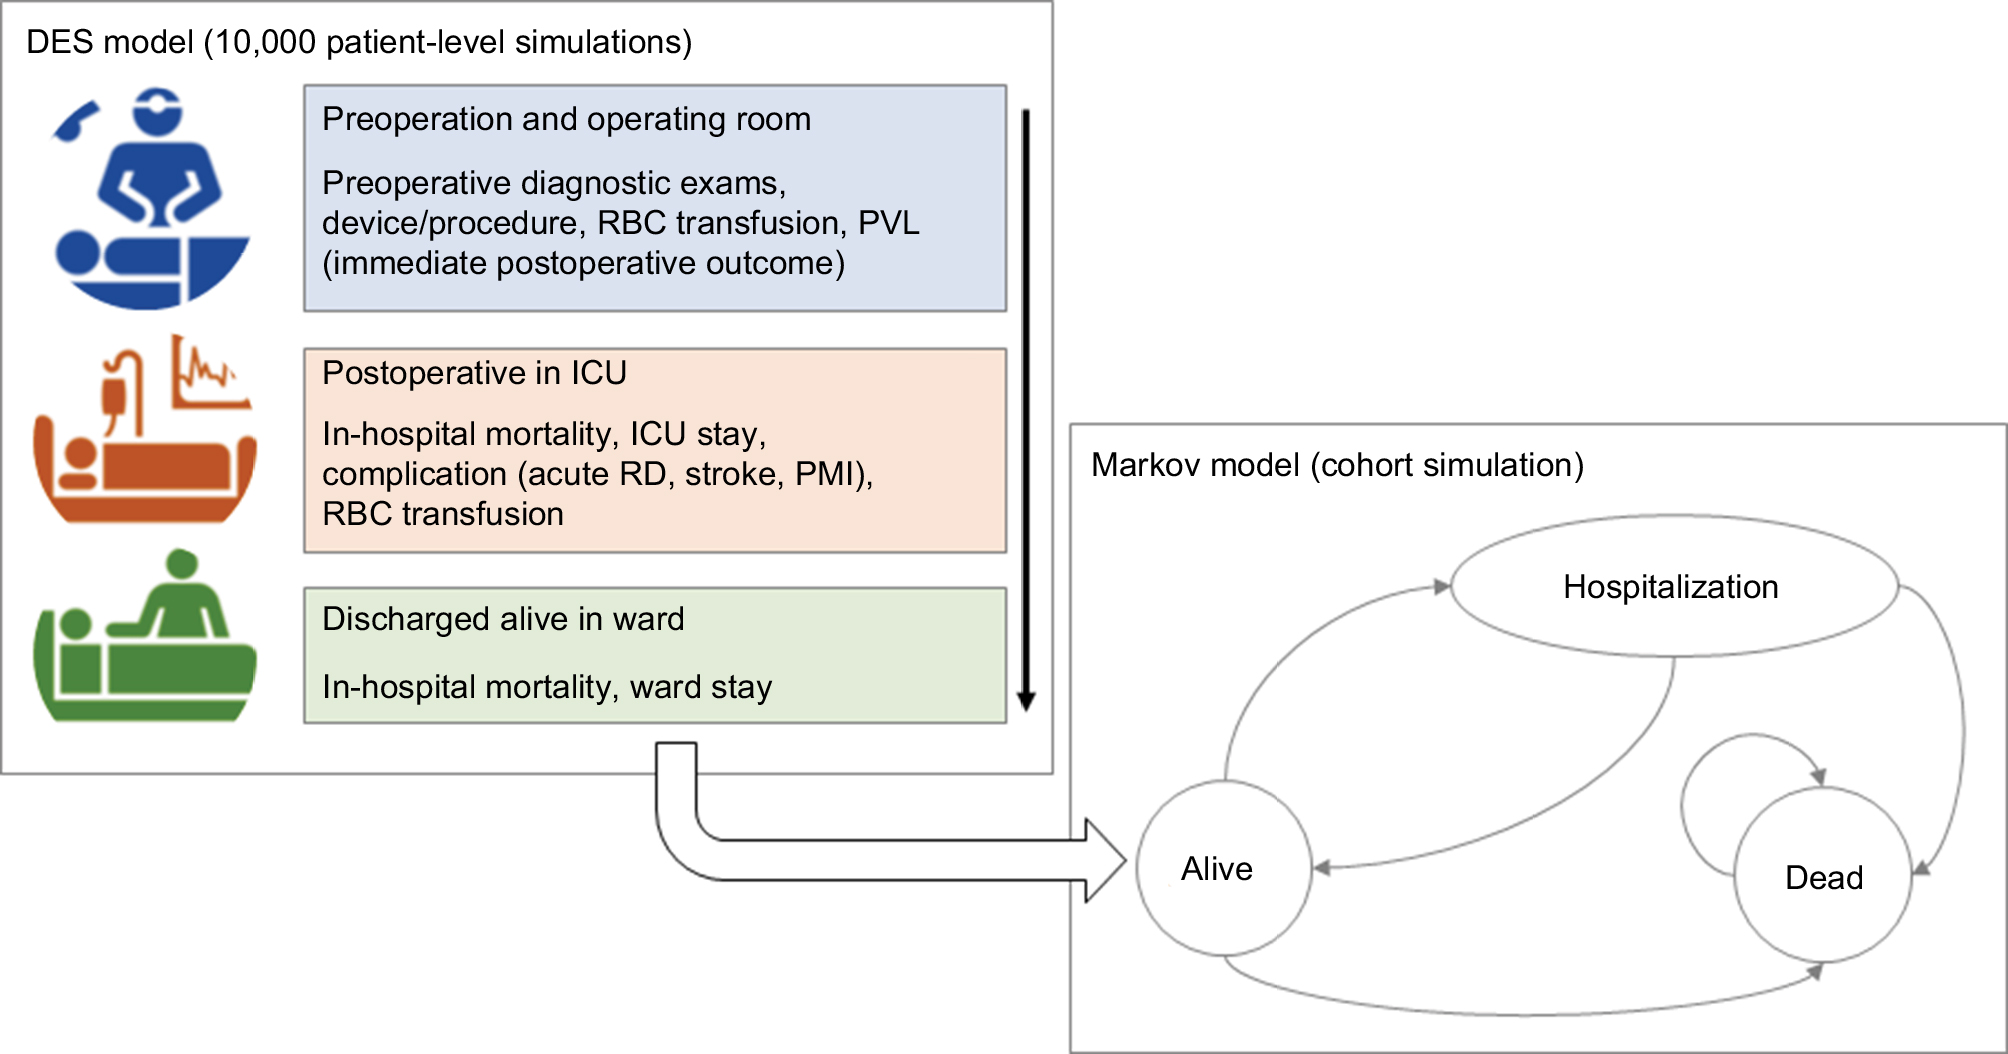 | Figure 1 DES model for the in-hospital phase (top-left box) and lifetime Markov model (bottom-right box) for SU-AVR vs TAVIs comparison. Abbreviations: DES, discrete event simulation; ICU, intensive care unit; PMI, pacemaker implantation; PVL, paravalvular leak; RBC, red blood cell; RD, renal dysfunction; SU-AVR, sutureless aortic valve replacement; TAVIs, transcatheter aortic valve implants. |
The DES technique seems preferable to the Markov methodology in representing clinical conditions that are neither chronic nor characterized by recurrent events occurring at fixed time intervals, as in hospitalized patients. Each iteration of the simulation represents a unique patient who is sent simultaneously through both arms of the model (SU-AVR and TAVIs). The parameters of each iteration are drawn from distributions representing the interindividual variability in outcomes of the simulated population. The simulation steps are qualitatively common for both treatment arms, which differ in the probability of the events considered and for the time-to-event distributions.
The cohort simulated in the Markov model uses the output of the in-hospital phase as starting point. In each cycle, patients can be alive, can be at a risk of experiencing rehospitalization, or may die; for patients who developed chronic kidney insufficiency during the first phase of the model, lifetime dialysis was simulated.
The hospital perspectives of six different countries (the US, Germany, UK, France, Italy, and Australia) were adopted when calculating costs associated with each state and evaluating the differential economic impact of SU-AVR vs TAVIs; all costs were updated till 2017 using country-specific inflation indices.14,15 Half-cycle correction and a 3.5% annual discount rate were applied to both costs and outcomes after hospital discharge.16
Clinical inputs
In-hospital
Clinical outcomes and resources consumption have been modeled directly for TAVIs, while in the SU-AVR arm they are obtained by applying relative treatment effects.
Event probabilities for TAVIs were estimated by pooling together the most recently published evidence from observational studies (Table S1); length of stays (LOSs), both in ICU and in hospital, were derived from the SOURCE 3 Registry,17 as no observational studies reporting these data were retrieved; median and interquartile range (IQR) were converted into mean and SD according to the formulas proposed by Wan et al.18 For each patient, events were simulated using Bernoulli distributions, while LOSs were sampled from a gamma distribution fitted on the reported mean and SD. No data were found on the incidence of permanent renal dysfunction; to take into account the impact of lifetime dialysis in the model, it was assumed that 10% of acute kidney injuries develop into chronic renal dysfunction (the impact of such assumption was investigated in sensitivity analyses).
From our focused literature review, no randomized clinical trials comparing TAVIs with SU-AVR are available; however, a series of propensity score matched comparative analyses have been published. These have been pooled in at least four meta-analyses, with comparable results on the common outcomes.19–22 Among these, the recently published work by Meco et al21 investigated the comparison on a more complete set of outcomes, besides being one of the most updated we identified, and was therefore selected as our source for the relative treatment effects.
This meta-analysis compared efficacy and safety outcomes in 731 SU-AVR patients (95% implanted with Perceval and 5% with 3f Enable) and 731 matched TAVI patients. Tables S2 and S3 summarize the characteristics of the enrolled population and analyses on postoperative outcomes. We reperformed the same analysis to obtain relative risk as effect estimate, more suitable for the simulation model than the originally reported ORs; only statistically significant comparisons were considered in the model. The comparison of hospital LOSs was also included, even if not analyzed in Meco et al,21 as three of the six selected papers reported this outcome, which is highly relevant for economic evaluation purposes. Table S4 shows the data.
The number of red blood cell (RBC) units transfused during the hospitalization of patients undergoing TAVIs was estimated from Ussia et al,23 assuming a gamma distribution (data reported: 22.1% of patients requiring two to three units, 6.1% of patients requiring more than three units); it resulted in 0.86±1.22 RBC units transfused. For patients undergoing SU-AVR, the number of RBC units was estimated starting with blood loss during surgery and ICU stay reported in Pradelli et al,9 assuming one unit transfused every 500 mL of blood loss; it results in 1.22±0.22 RBC units transfused.
Long-term
Evidence from Kodali et al24 showed that mild-to-severe paravalvular leak (PVL) is an independent predictor of overall survival (OS) after TAVIs or SAVR (HR =2.11, P<0.001). Following the same approach for the health technology assessment of TAVIs in the UK,25 we performed a Weibull regression on data extracted from the Kaplan–Meier OS without PVL from Kodali et al24 and then applied the HR of 2.11 to obtain the OS curve for patients developing PVL during hospitalization (Figure 2). This approach was applied for patients treated with both TAVIs and SU-AVR. A further mortality HR equal to 2.005 was applied for patients developing permanent renal dysfunction.26
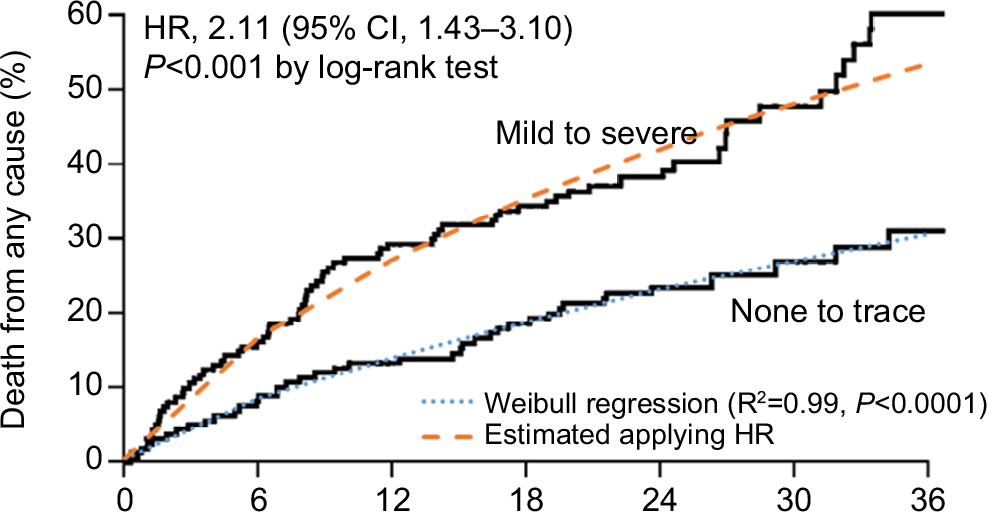 | Figure 2 Kaplan–Meier overall survival with and without PVL compared with fitted curves obtained from Weibull regression (dashed lines). Note: From The New England Journal of Medicine, Susheel K Kodali, Mathew R Williams, Craig R Smith, et al, Two-year outcomes after transcatheter or surgical aortic-valve replacement, vol 366, pages 1686–1695. Copyright © (2018) Massachusetts Medical Society. Reprinted with permission from Massachusetts Medical Society.24 Abbreviation: PVL, paravalvular leak. |
Evidence from Ussia et al23 and Barbanti et al27 was used to fit a Weibull model for hospitalization-free survival (HFS) after TAVIs; for SU-AVR patients, an HR elaborated from Santarpino et al28 was applied: HFS =86.5% with SU-AVR vs 54.1% with TAVIs after a mean follow-up of 18.9±10.1 months, resulting in an HR of 0.24 (Figure 3). Reasons for rehospitalizations differed between compared arms; stroke was responsible for 17.1% of episodes for SU-AVR vs 9.5% with TAVIs, pacemaker implantation (PMI) accounted for 54.1% of readmissions in SU-AVR patients vs 19.5% after TAVIs, while heart failure, vascular complications, and PVL leading to valve explant represented 28.8% of cases in the SU-AVR group vs 71% with TAVIs; data were taken from Fischlein et al29 for SU-AVR and Barbanti et al27 for TAVIs.
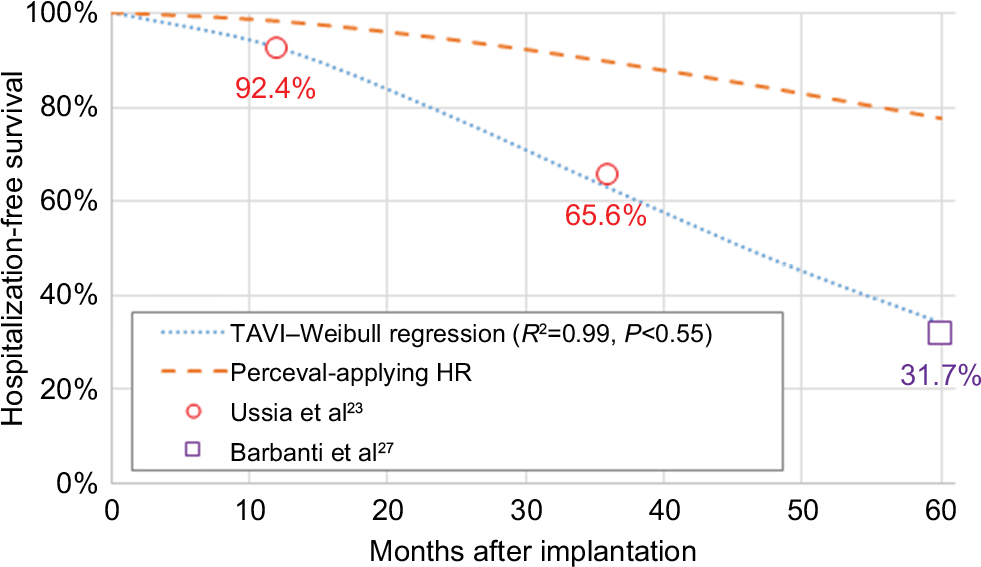 | Figure 3 Hospitalization-free survival after hospital discharge for SU-AVR and TAVI patients. Abbreviations: SU-AVR, sutureless aortic valve replacement; TAVI, transcatheter aortic valve implant. |
Utilities
Treatment efficacy was measured using QALYs calculated by multiplying the duration in a particular health state by the utility weight for that health state. The quality weight associated with a patient who is alive after discharge was calculated based on the estimated utility by New York Heart Association (NYHA) class30 (Table S5) applied to the proportion in each NYHA class, estimated by pooling the most recent clinical evidence for Perceval and TAVIs.31–35 The baseline (after discharge) NYHA distribution is same for both treatments to avoid introducing bias, as at hospital admission candidates for TAVIs had a slightly more favorable NYHA status than those for SU-AVR. Subsequently, changes in NYHA class distribution were different in the two arms, according to the treatment-specific evidence; after 4 years, no further change in NYHA was assumed as no data were available in the literature (Figure 4).
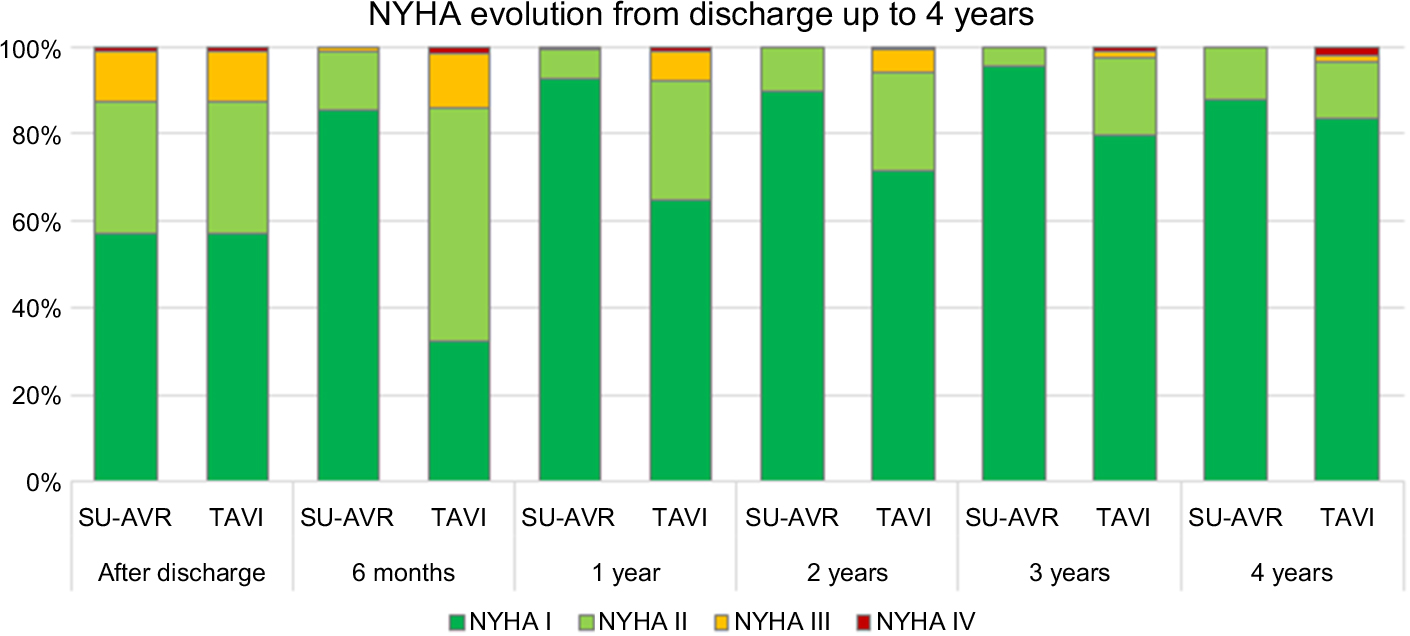 | Figure 4 NYHA distribution after discharge and time evolution up to 4 years. Abbreviations: NYHA, New York Heart Association; SU-AVR, sutureless aortic valve replacement; TAVI, transcatheter aortic valve implant. |
In cases of rehospitalization, specific disutility30 was applied according to the number of hospitalizations, assuming that 80% of patients undergo one hospitalization, 15% two hospitalizations, and 5% three hospitalizations (this assumption was investigated in the sensitivity analysis). Furthermore, in case of lifetime dialysis, a decrement of 0.22 in utility was applied36 (Table S5).
Costs
Costs considered in the analysis are direct health care costs, encompassing both in-hospital and long-term costs (Table 1), in order to adopt a comprehensive third-party payer cost perspective. The in-hospital costs related to hospitalization for an AVR include operating room (both personnel and materials, excluding cost for the devices),7,9,13,37–39 preoperative/intraoperative/postoperative diagnostic exams,13,40–44 device costs,7,45,46 reoperation for reexploration or second valve implantation,47–49 hospital stay with or without mechanical ventilation,50–56 blood transfusion,37,50,51,57,58 need for renal replacement therapy,50,51,57,59 and adverse events, such as stroke49,54,60–62 or PMI.37,38,48,49,54,63 According to the lifetime horizon of the simulation, patients who developed chronic renal dysfunction receive dialysis until death.64–69 In addition, rehospitalizations due to stroke,66,70,71 PMI,38,63,72–75 or other cardiac reasons64,66,76,77 were considered.
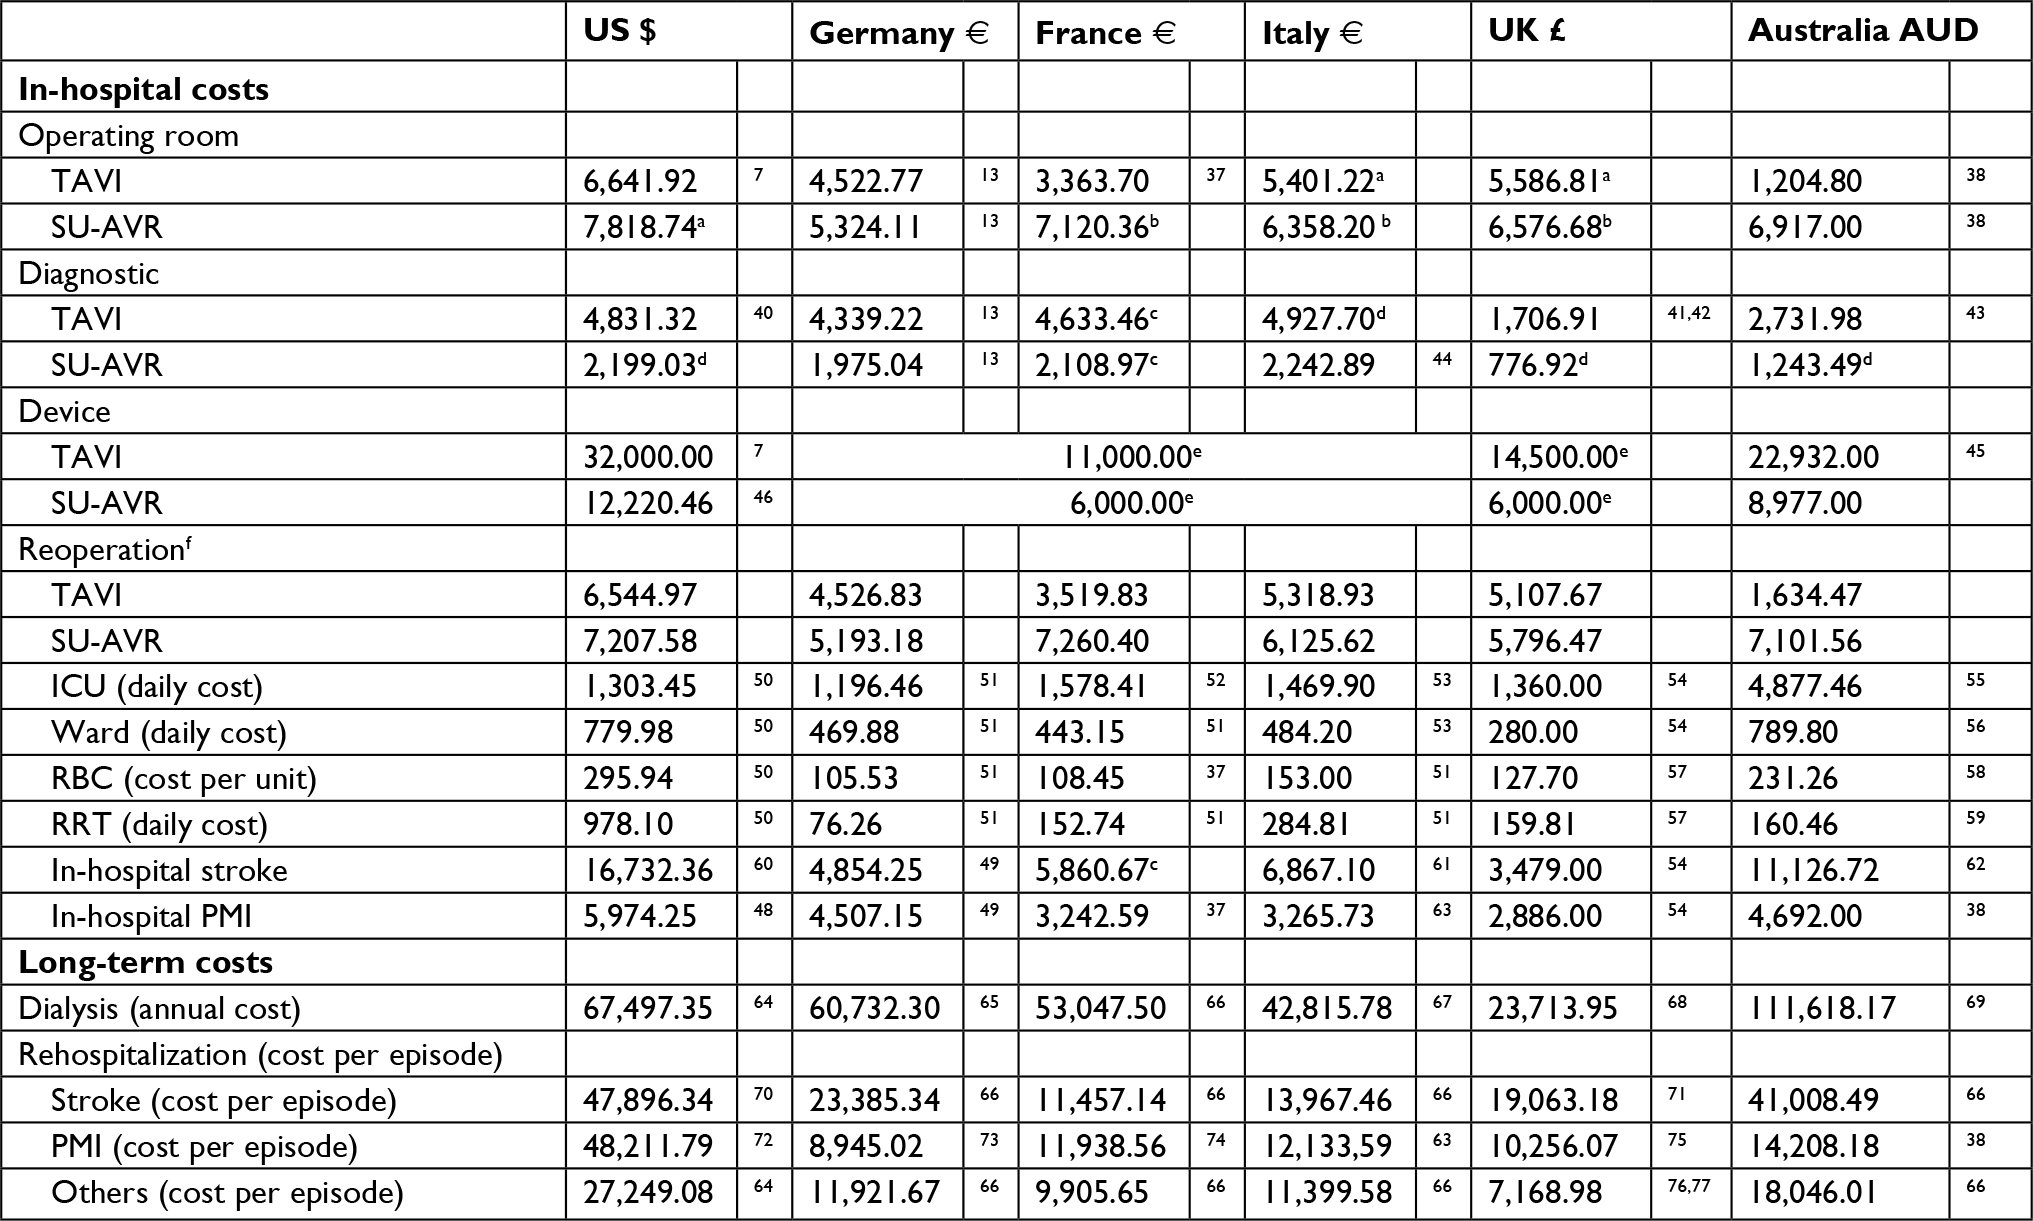 | Table 1 List of unit/annual/per episode costs used in the model for each country considered in the analysis Notes: aEstimated by applying the ratio between TAVIs and Perceval operating room costs reported in Santarpino et al13 as it is the only analysis that reported both costs in the same structure. bCalculated as the mean of full-sternotomy (FS), minimally invasive (MiS), and concomitant (CONC) procedures estimated in Pradelli et al9 weighted for the frequencies of FS (41%), MiS (26%), and CONC (33%) reported in Shrestha et al.39 cEstimated as the mean between Germany and Italy. dEstimated by applying the ratio between TAVIs and Perceval diagnostic costs reported in Santarpino et al13 as it is the only analysis that reported both costs in the same structure. eMarket values. fCalculated as the cost of operating room plus the cost of device for the 2.0% of patients who need a second valve implant.47–49 The superscript numbers represent reference citations. Abbreviations: ICU, intensive care unit; PMI, pacemaker implantation; RBC, red blood cell; RRT, renal replacement therapy; SU-AVR, sutureless aortic valve replacement; TAVIs, transcatheter aortic valve implants. |
As almost all the patients analyzed in the meta-analysis of Meco et al21 underwent SU-AVR with Perceval (95%), only this valve was considered in the cost-effectiveness evaluation.
Sensitivity analysis
Different sensitivity analyses were performed to take into account uncertainties about input parameters (probabilistic sensitivity analysis [PSA]) and to investigate the impact of single variation on results (deterministic sensitivity analysis [DSA]).
In the PSA, the simulation was repeated 1,000 times sampling all the key parameters from appropriate distributions fitted on mean and SE, where available. The joint distribution of cost and QALY (ie, the 1,000 resulting simulations) was shown in the incremental cost-effectiveness plane; furthermore, the 95% confidence ellipse was provided. In the DSA, parameters were varied one by one within their 95% CIs or by ±20% of baseline values (if CIs were not available). A tornado diagram was used to represent the effect of variation of input parameters on the outcomes. Tables S6–S9 list all the parameters used in the sensitivity analyses.
Results
In-hospital mortality for SU-AVR is lower than for TAVIs (4.1% vs 7.0%) with an analogous improvement in the lifetime survival (5.51 vs 4.26 life-years); patients discharged alive after AVR with SU-AVR live 1.25 years more than those undergoing TAVIs (Table 2). In addition, quality-adjusted life expectancy is higher with SU-AVR, with a mean gain of 1.14 QALYs.
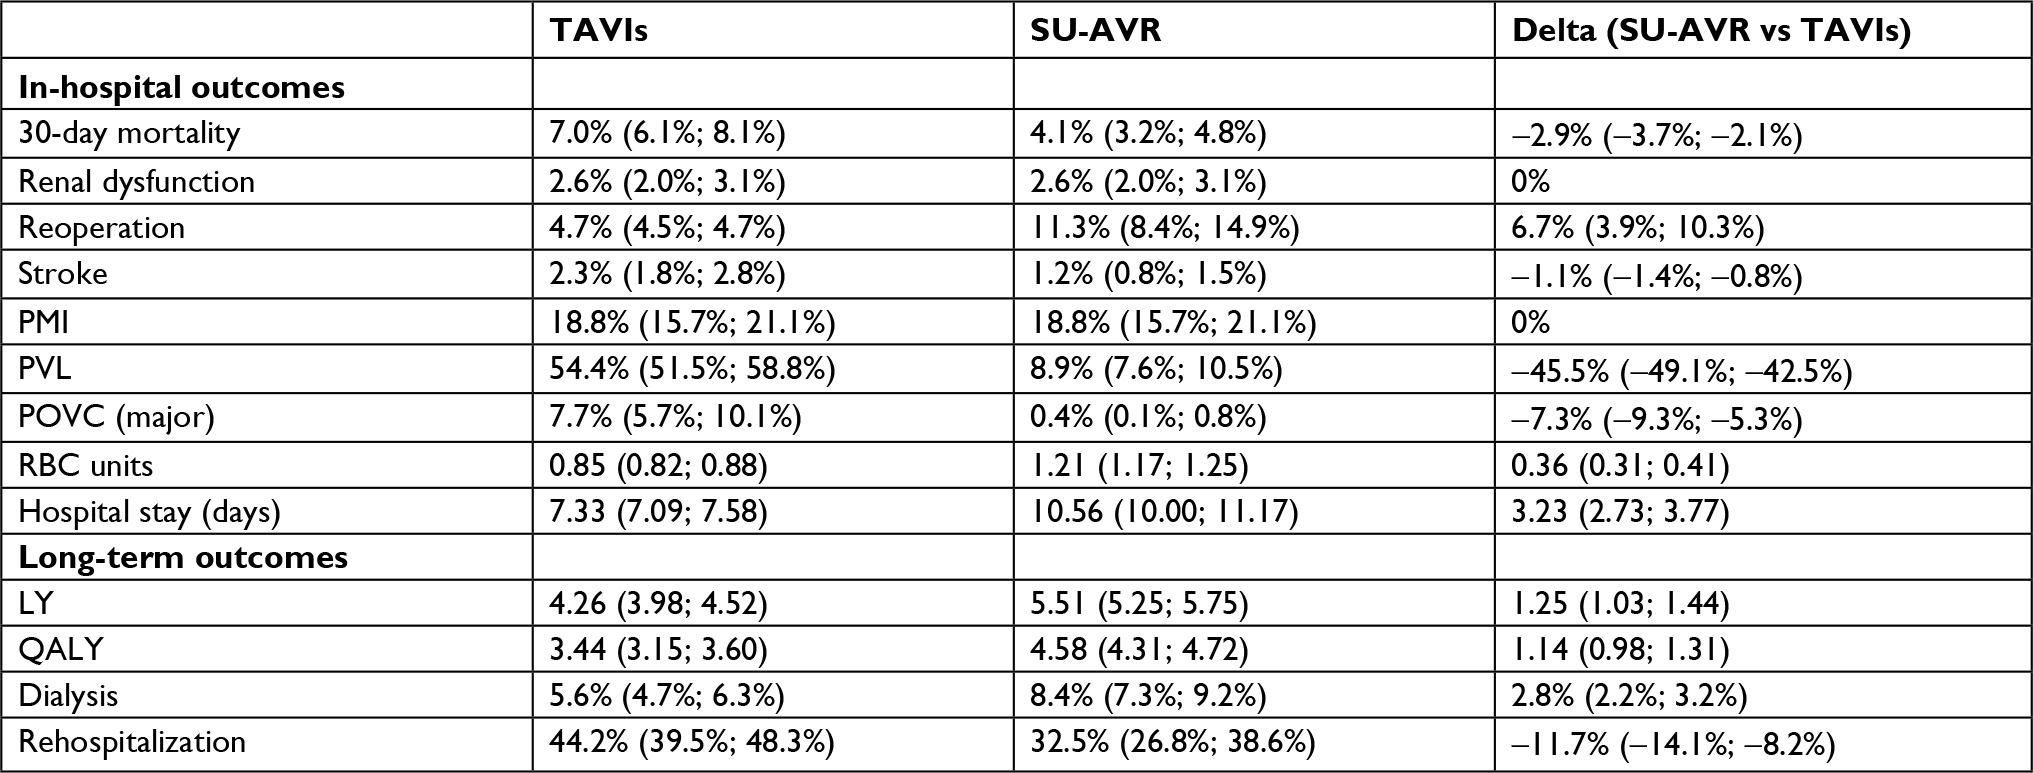 | Table 2 Effectiveness results: values expressed as mean and interquartile range Note: Interquartile ranges are provided in parentheses. Abbreviations: LY, life-year; PMI, pacemaker implantation; POVC, postoperative vascular complication; PVL, paravalvular leak; QALY, quality-adjusted life-year; RBC, red blood cell; SU-AVR, sutureless aortic valve replacement; TAVIs, transcatheter aortic valve implants. |
Patients undergoing SU-AVR experience more reoperations (11.3% vs 4.7%) and stay three days more in hospital (10.56 vs 7.33) than those undergoing TAVIs; in contrast, SU-AVR is associated with lower rates of stroke (1.2% vs 2.3%), major postoperative vascular complications (0.4% vs 7.7%), and PVL (8.9% vs 54.4%). Long-term results also show a lower rate of rehospitalization (32.5% vs 44.2%). Table 2 lists all results.
Total costs both for SU-AVR and for TAVIs vary in the six analyzed countries (Table 3) due to different economic inputs, but a similar trend can be identified in the incremental analysis: Hospital costs for SU-AVR are slightly higher than those for TAVIs, excluding device costs; comparing all costs in dollars, the incremental cost ranges from $205 in Italy to $5,276 in Australia (Figure 5). This increase is completely offset when device costs are considered, resulting in total hospital savings of about $2,500–$18,000 in favor of SU-AVR. Despite the higher survival with SU-AVR, long-term costs are generally lower than those for TAVIs. Considering total cost (in-hospital and long-term), SU-AVR is dominant with respect to TAVIs as it is more effective (+1.14 QALY) and less costly (savings of $4,000–$21,000).
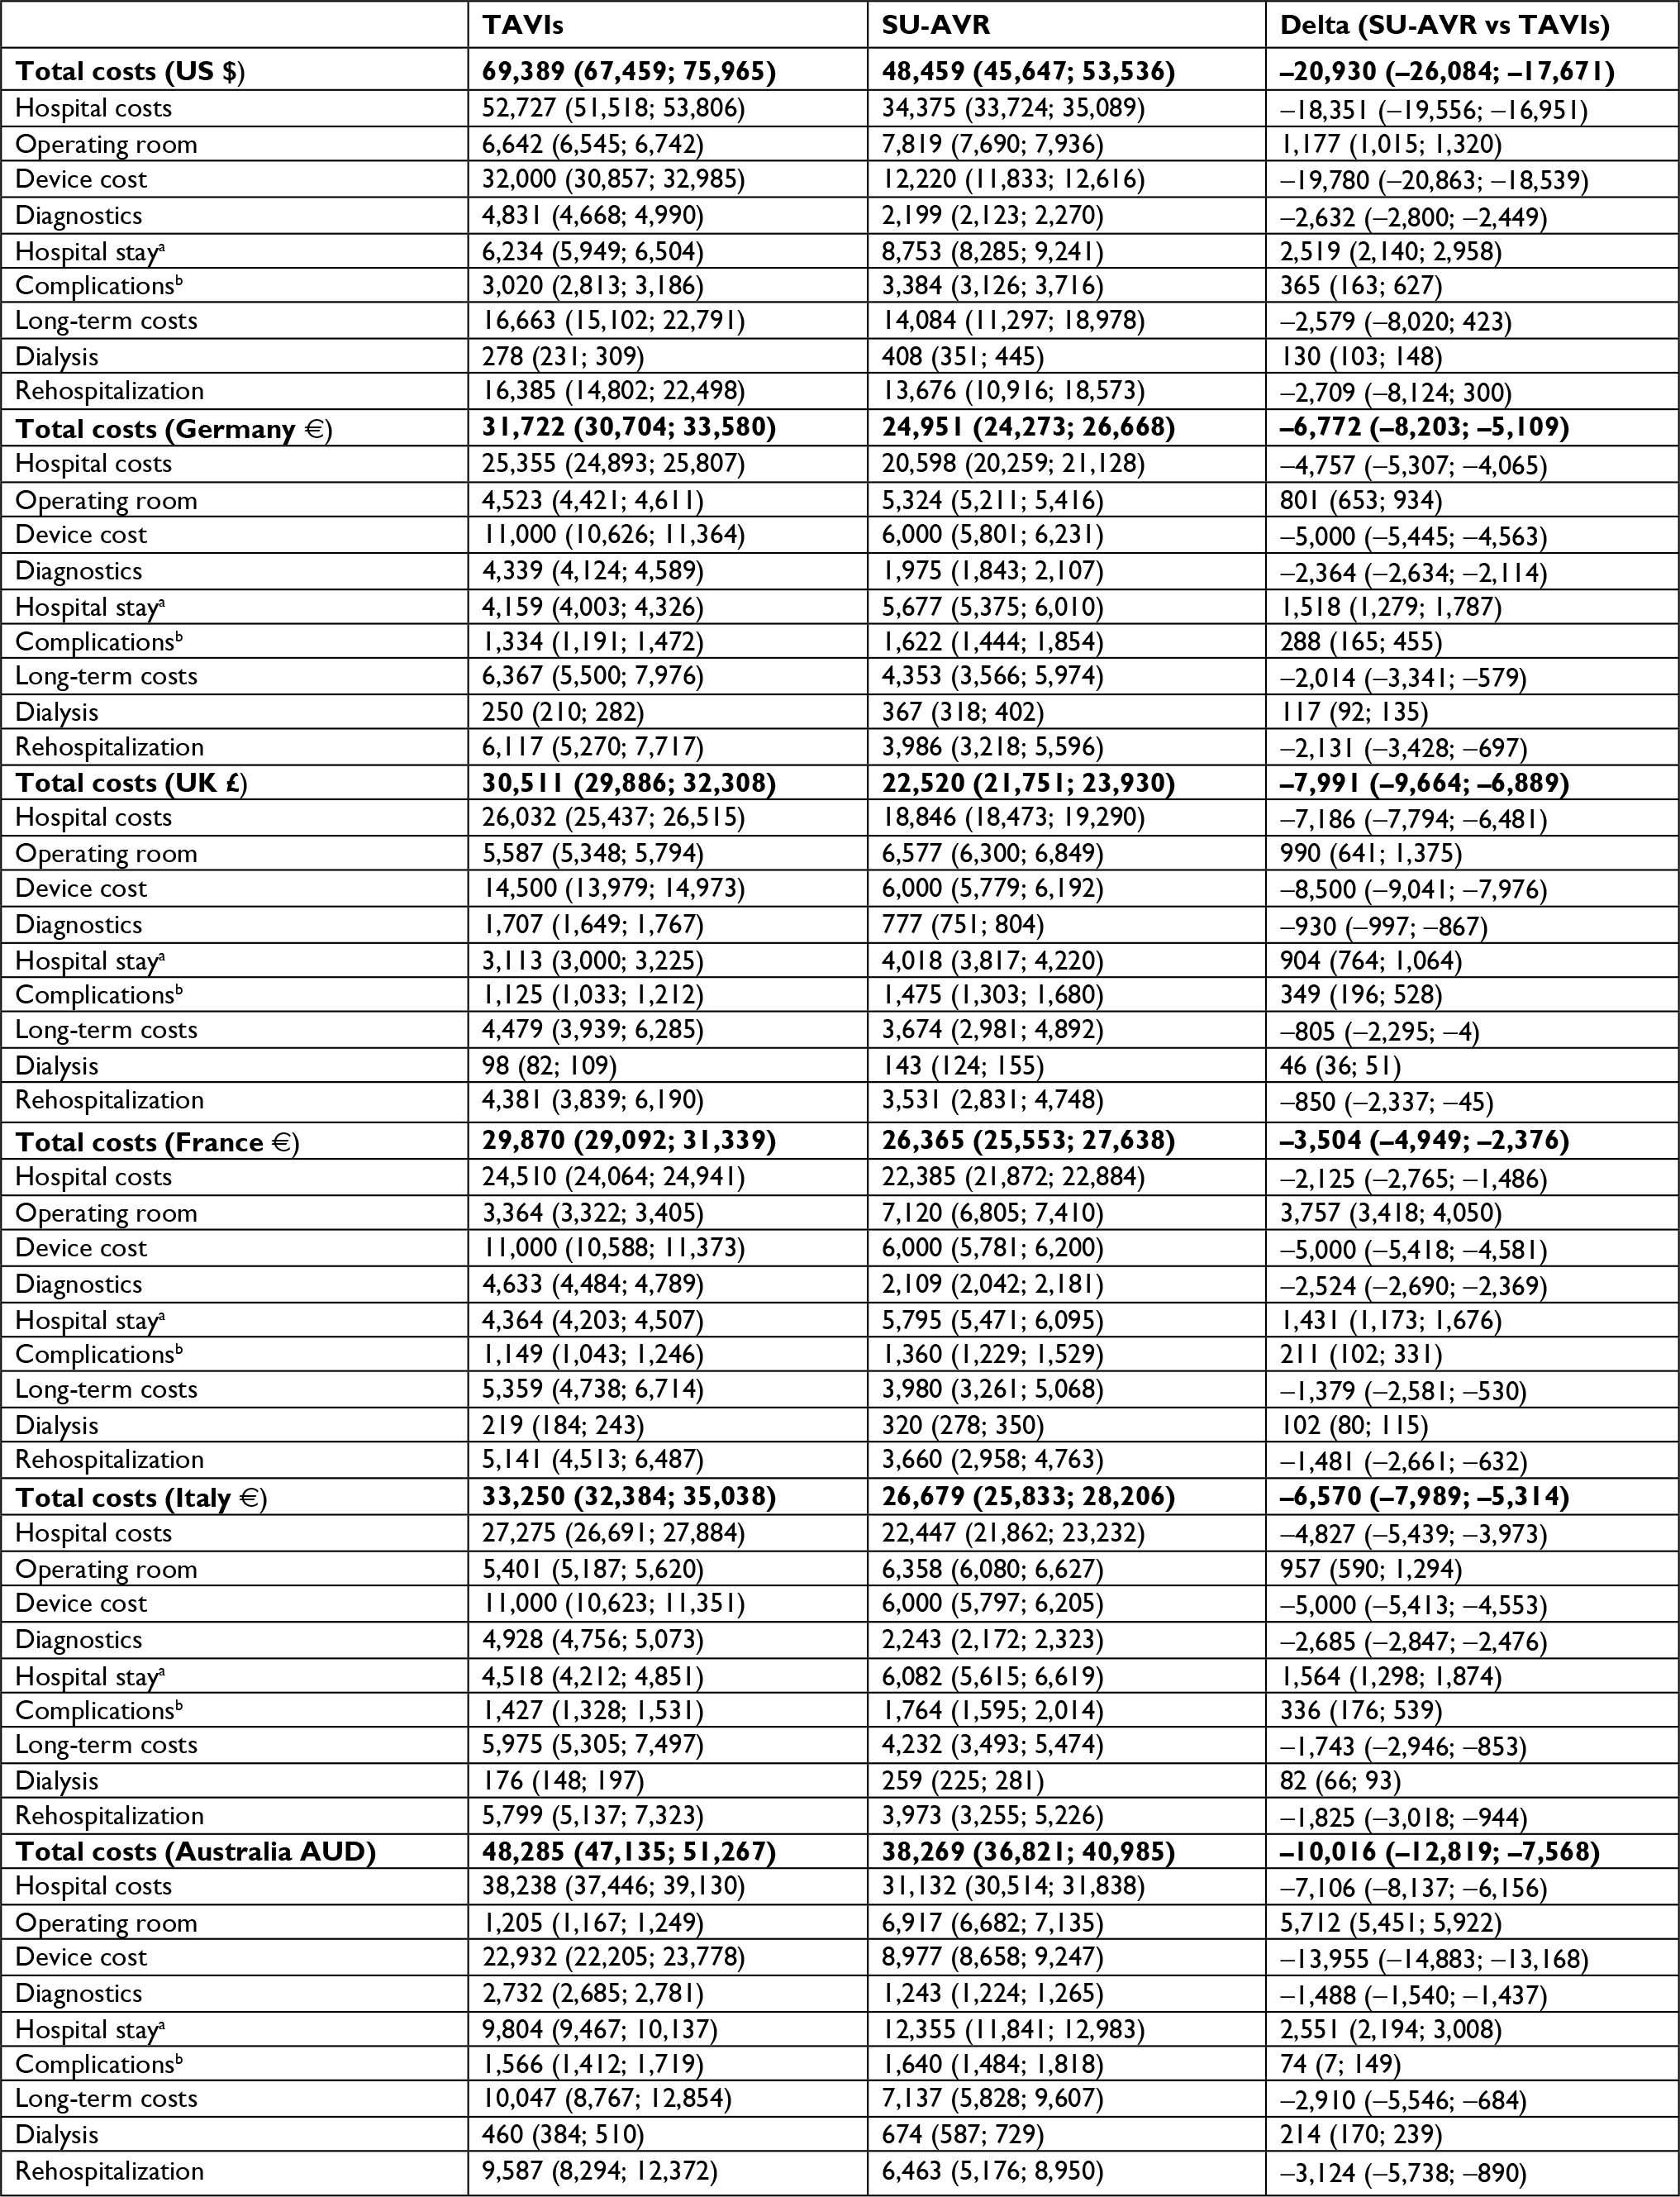 | Table 3 Economic results: values expressed as mean and interquartile range Notes: Interquartile ranges are provided in parentheses. aIncluding intensive care unit stay. bReoperation, renal replacement therapy, transfusion of red blood cell units, stroke, pacemaker implantation. Abbreviations: TAVIs, transcatheter aortic valve implants; SU-AVR, sutureless aortic valve replacement. |
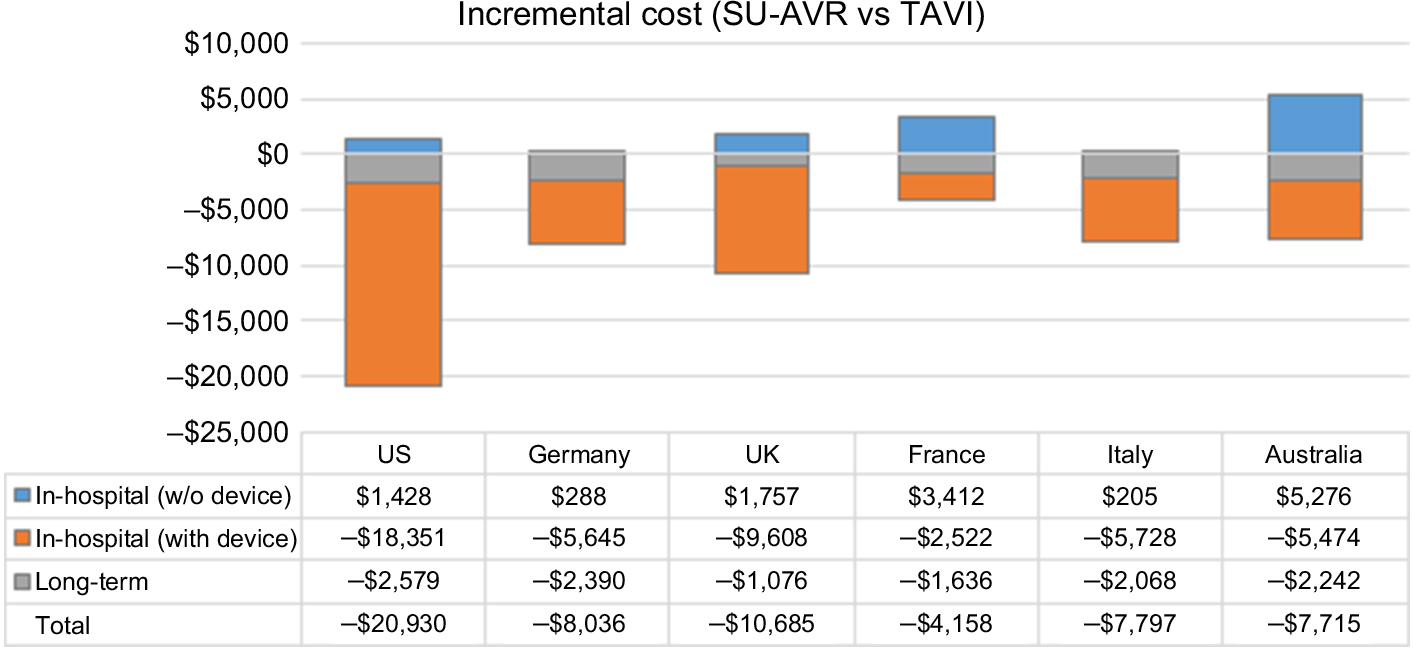 | Figure 5 Comparison between incremental cost items for the six analyzed countries. Notes: All values are expressed in 2017 US$ (negative increments favor SU-AVR, while positive increments favor TAVIs). €1= €1.1870, £1=$1.3372, AU$1=$0.7704. Abbreviations: SU-AVR, sutureless aortic valve replacement; TAVIs, transcatheter aortic valve implants; w/o, without. |
Results from PSA confirm the main analysis, with 95% confidence ellipse lying completely (almost for France) in the dominance region of the cost-effectiveness plane (Figure 6).
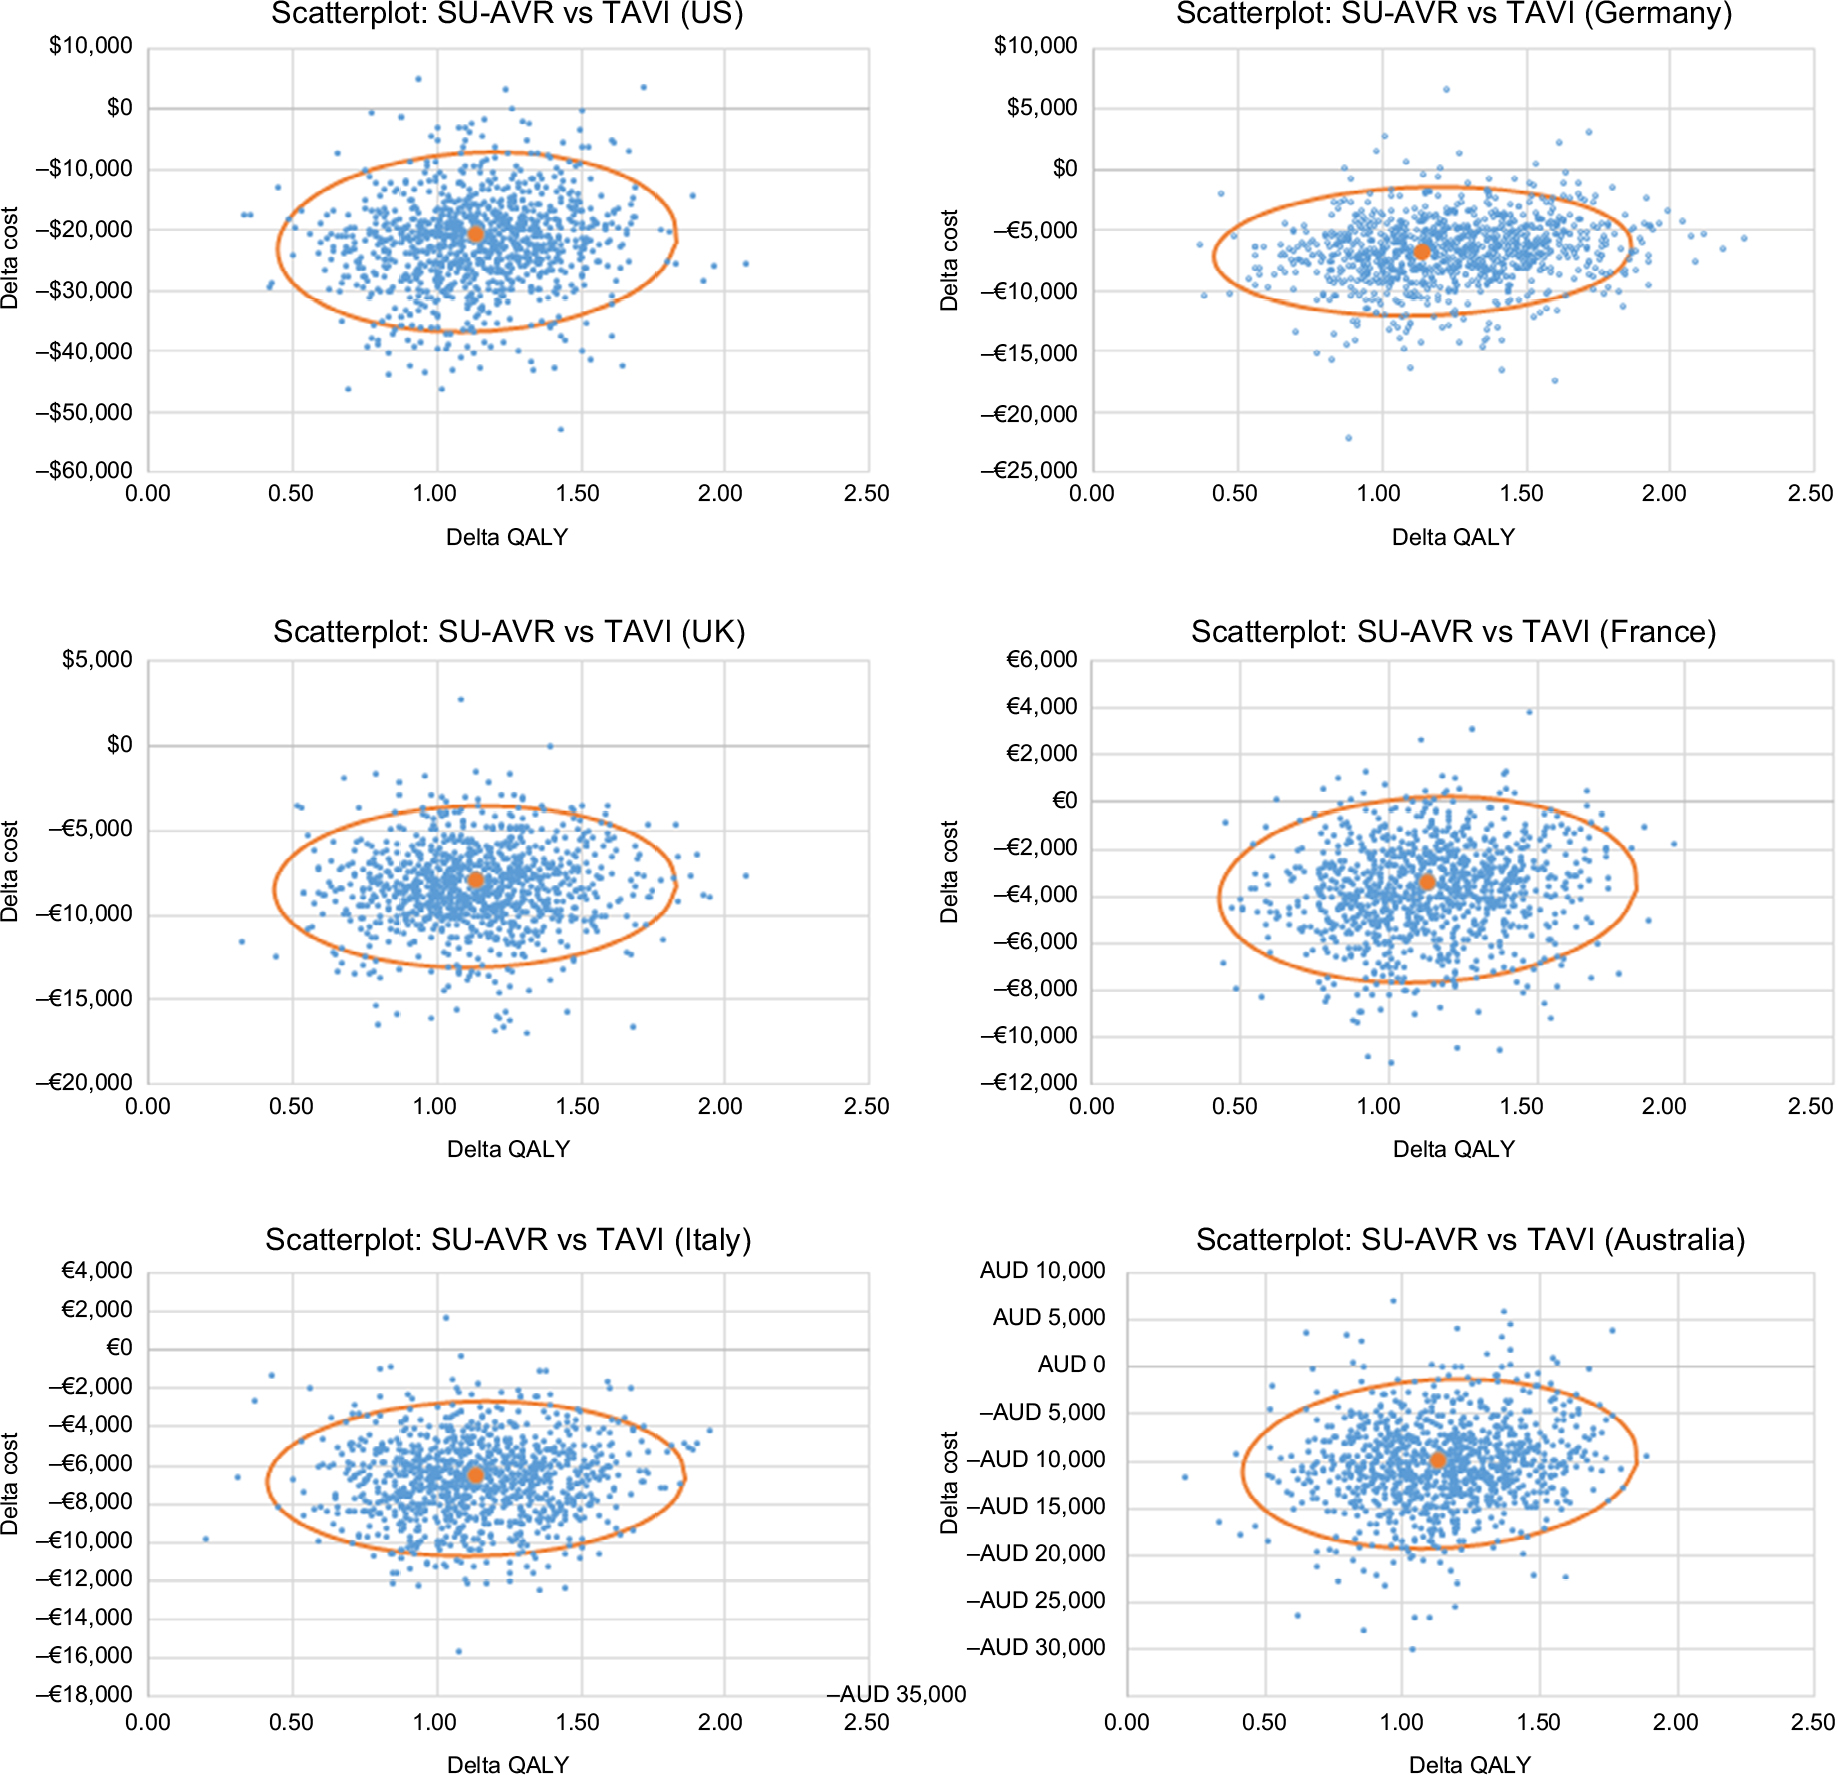 | Figure 6 Joint distribution of cost and QALY differences for the six countries considered in the analysis (the result of 1,000 samples); continuous line represents the 95% confidence ellipse. Abbreviations: QALYs, quality-adjusted life-years; SU-AVA, sutureless aortic valve replacement TAVI, transcatheter aortic valve implant. |
Effectiveness is mostly influenced by the HR of OS and by the time horizon (Figure 7); SU-AVR also remains more effective than TAVIs for the lowest hypothesized effect of PVL on long-term survival (+0.70 QALY) and for a short time horizon simulation (+0.43 QALY at 5 years). The economic impact is mainly affected by device and operating room costs (Figure 8). Even when reducing the economic gap between device or operating room costs, SU-AVR still saves costs compared with TAVIs.
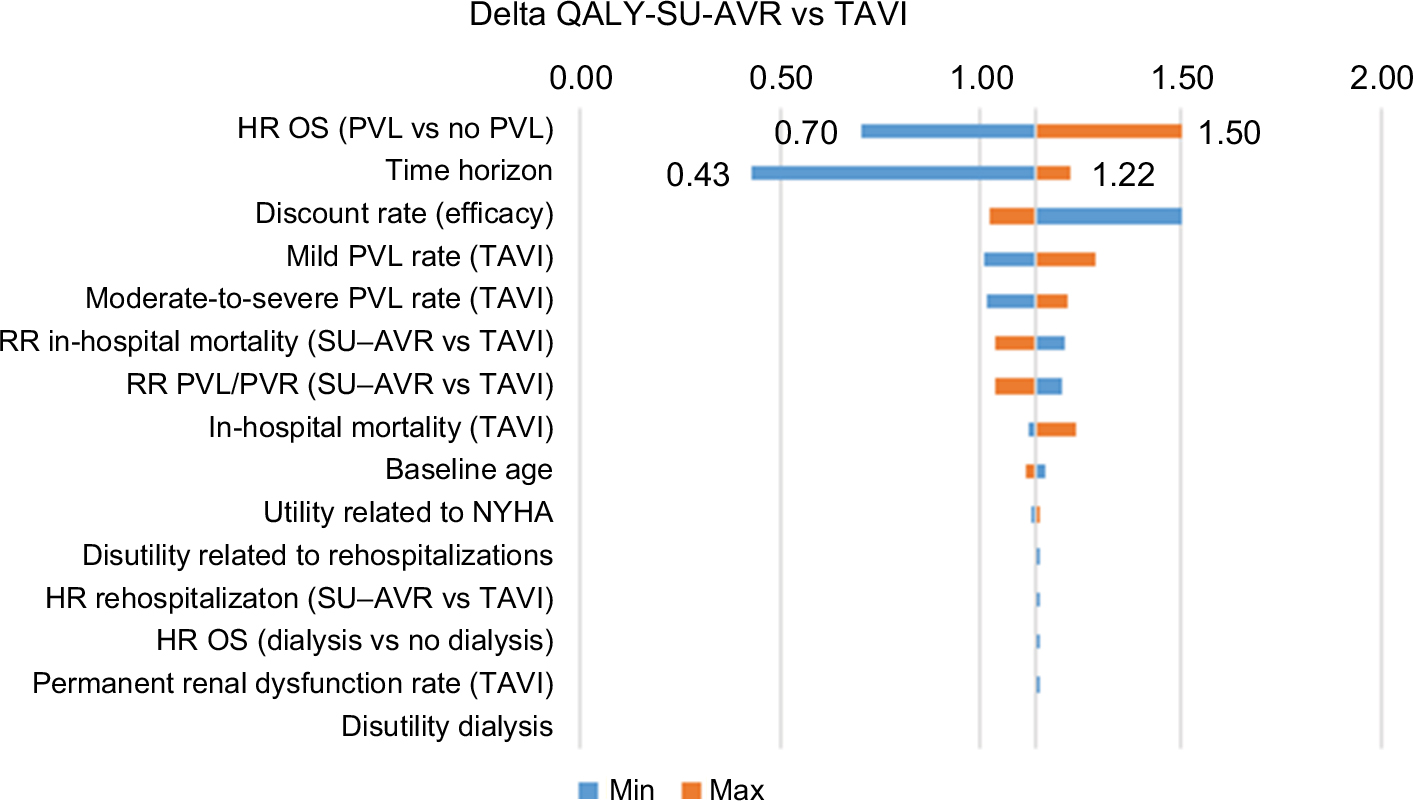 | Figure 7 Tornado diagram of QALY gain (SU-AVR vs TAVIs): Blue bars (min) represent QALY gain for the minimum value of each parameter, and orange bars (max) represent QALY gain for the maximum value of each parameter. Abbreviations: NYHA, New York Heart Association; OS, overall survival; PVL, paravalvular leak; QALY, quality-adjusted life-year; RR, relative risk; SU-AVR, sutureless aortic valve replacement; TAVIs, transcatheter aortic valve implants. |
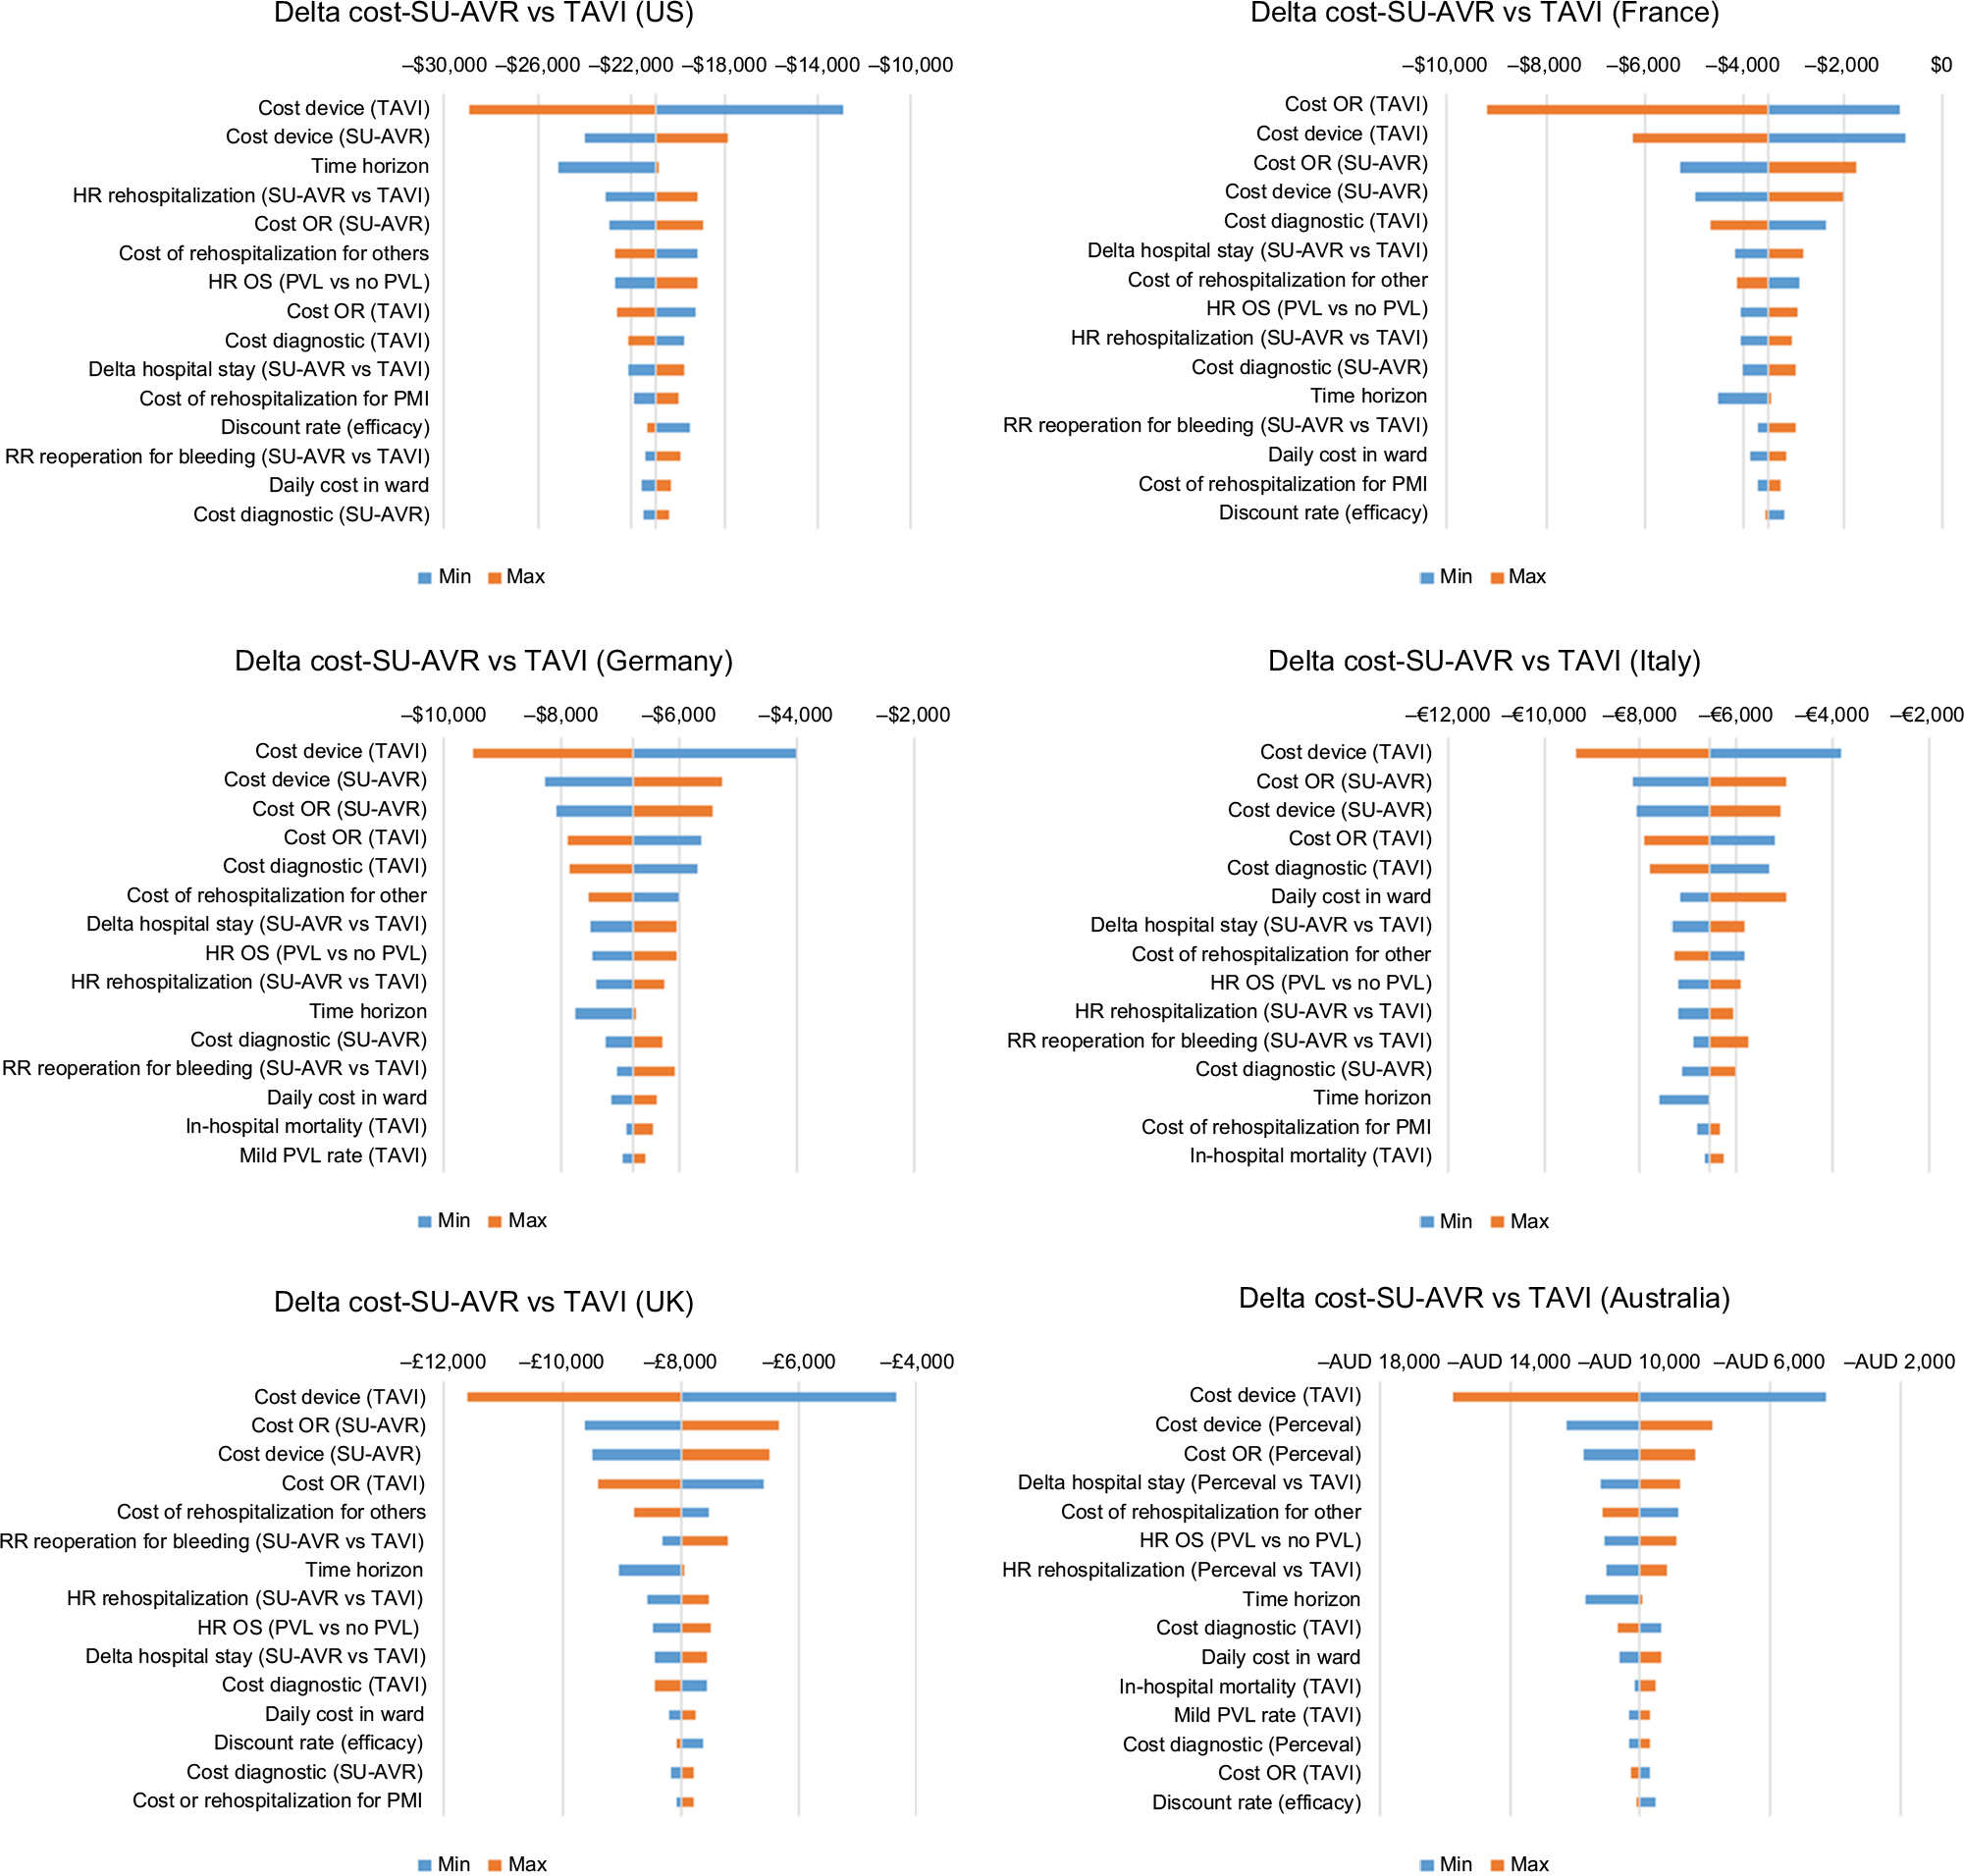 | Figure 8 Tornado diagram of cost differences (SU-AVR vs TAVIs) for the six countries considered in the analysis: Blue bars (min) represent cost differences for the minimum value of each parameter and orange bars (max) represent delta cost for the maximum value of each parameter. Abbreviations: OR, operating room; OS, overall survival; PVL, paravalvular leak; PMI, pacemaker implantation; RR, relative risk; SU-AVR, sutureless aortic valve replacement; TAVIs, transcatheter aortic valve implants. |
Discussion
In this cost-utility analysis, we compared SU-AVR vs TAVIs in intermediate- and high-risk patients. We used a two-step modeling process consisting of a patient-level DES to simulate the in-hospital phase and a cohort Markov model to estimate the long-term consequences after hospital discharge. Clinical outcomes (both in hospital and after discharge) were determined from observational studies of TAVIs, while the outcomes for SU-AVR arm were derived by applying relative effects from a published meta-analysis21 or from Kaplan–Meier analysis.24 A surgical approach with a sutureless valve was more effective than TAVIs, with a significant reduction in 30-day mortality (−2.9%, IQR: [−3.7] – [−2.1]) and significant gains in survival (+1.25 years, IQR: 1.03–1.44) and quality of life (+1.14 QALY, IQR: 0.98–1.31). Furthermore, the total cost, including the cost of devices, rehospitalizations, and lifetime dialysis, was lower with SU-AVR than with TAVIs, with savings ranging from $4,000 to almost $21,000; these variations were due to differences in the cost structures in the six countries.
In general, our results are consistent with the other estimates in the literature, in terms of both cost-utility and the components of cost and effectiveness: TAVIs appear to be more costly than SAVR, with a slight gain in QALYs, yielding an acceptable but uncertain ICERs; SU-AVR is estimated less costly and more effective than SAVR; it is therefore not unexpected that SU-AVR economically outperforms TAVIs.
Total hospital cost (device cost included) estimated for the US is similar to the total cost observed in a sample of 4,083 TAVIs occurring between January and December 2012;78 the median cost for hospitalization resulted in a cost of $50,200 (IQR: 39,800–64,300) compared with our mean estimate of $52,727 (IQR: 51,518–53,806). The in-hospital cost and the cost consequences of TAVIs were evaluated for high-risk patients in the UK in a cost-effectiveness analysis vs SAVR;25 short-term costs estimated for TAVIs (procedure, hospital stay, and adverse events) amounted to £25,079, which is comparable to our estimate (£26,032, IQR: 25,437–26,515); total costs were slightly lower (£27,833 vs £30,511, IQR: 29,886–32,308), since only follow-up appointments were considered and the National Health Service tariff for cardiac valve disorder (lower than our estimates) was used for the cost of rehospitalizations. Despite the longer time horizon considered in the model (25 years), the total quality of life estimate was lower than ours (2.853 vs 3.44 QALY) as a high-risk population was simulated; 6 months after discharge, <80% were in NYHA Class I or II, while in our simulation almost 90% were in these classes. During the last Transcatheter Cardiovascular Therapeutics meeting held in Denver in 2017, the results from the PARTNER 2A and Sapien-3 intermediate risk trials were presented.79 In-hospital costs ranged between $54,256 and $61,433 vs $52,727 in our analysis, while follow-up costs were significantly higher than ours: $26,861 and $46,284 vs $16,663, probably because almost 70% of patients were rehospitalized in the first year, while according to the hospitalization-free survival curve used in our model <10% experienced hospital readmission for cardiac reasons. In the recently published cost-utility analysis from the Canadian health care perspective by Tam et al,8 based on the PARTNER 2 trial, total costs for TAVIs also compare reasonably well with our estimates, both in magnitude and in composition ($47,000, of which $40,000 is for the index hospitalization).
A previous cost analysis estimated the cost of SU-AVR according to different surgical approaches (minimally invasive, full sternotomy, and concomitant) in Germany, UK, France, and Italy.9 The total hospital costs without considering the cost of the sutureless valve were very similar to our results: €14,130–€17,300 for Germany (€14,598 in our analysis), £14,610–£17,950 for UK (£12,846 in our analysis), €15,640–€18,810 for France (€16,385 in our analysis), and €13,810–€16,740 for Italy (€16,447 in our analysis). The difference in the UK is most likely due to the low daily ICU and ward costs used in this analysis.
The only cost analysis comparing SU-AVR with TAVIs found in literature was the paper of Santarpino et al;13 in this propensity score match analysis, 102 patients undergoing SU-AVR were matched and compared with 102 patients undergoing TAVIs in Germany, and the hospital costs both including and excluding the device costs were quite similar to those obtained in our analysis: €22,451 and €16,148 including and excluding the device costs, respectively, for SU-AVR (€20,394 and €14,598 in our analysis) and €32,877 and €14,164 including and excluding the device costs, respectively, for TAVIs (€25,355 and €14,335 in our analysis). The difference in in-hospital cost including device cost is due to a higher device cost used in the analysis (almost €19,000 vs €11,000 in our model).
Limitations
The main limitation of the present study is the use of common clinical parameters for all simulated countries, as hospital policies could be different in the US, Europe, and Australia (eg, different ICU or hospital LOSs). However, observational studies used as references recruited patients from the US, Italy, France, Germany, UK, Canada, Israel, Finland, Switzerland, and Spain; hence, regional variability should be taken into account.
Conclusion
SU-AVR results are dominant compared with TAVIs in intermediate- to high-risk patients in all countries considered in the present analysis (US, Germany, UK, France, Italy, and Australia). Both in-hospital and long-term costs are lower for patients underwent SAVR with sutureless valve than for those underwent TAVIs with significant gains in survival and quality of life.
Disclosure
Dr Lorenzo Pradelli is the coowner and an employee of AdRes and has received project funding from LivaNova. Massimiliano Povero is an employee of AdRes and has received project funding from LivaNova. Dr Antonio Miceli, Dr Matteo Ferrarini, and Dr Mattia Glauber are consultants for LivaNova. Matteo Pinciroli is an employee and holds stock options of LivaNova. This study was financially supported by LivaNova. The authors report no other conflicts of interest in this work.
References
Osnabrugge RL, Mylotte D, Head SJ, et al. Aortic stenosis in the elderly: disease prevalence and number of candidates for transcatheter aortic valve replacement: a meta-analysis and modeling study. J Am Coll Cardiol. 2013;62(11):1002–1012. | ||
Johnston LE, Downs EA, Hawkins RB, et al. Outcomes for Low-Risk Surgical Aortic Valve Replacement: A Benchmark for Aortic Valve Technology. Ann Thorac Surg. 2017;104(4):1282–1288. | ||
Brennan JM, Thomas L, Cohen DJ, et al. Transcatheter Versus Surgical Aortic Valve Replacement: Propensity-Matched Comparison. J Am Coll Cardiol. 2017;70(4):439–450. | ||
Di Eusanio M, Phan K. Sutureless aortic valve replacement. Ann Cardiothorac Surg. 2015;4(2):123–130. | ||
Carnero-Alcázar M, Maroto LC, Cobiella-Carnicer J, et al. Transcatheter versus surgical aortic valve replacement in moderate and high-risk patients: a meta-analysis. Eur J Cardiothorac Surg. 2017;51(4):644–652. | ||
Garg A, Rao SV, Visveswaran G, et al. Transcatheter Aortic Valve Replacement Versus Surgical Valve Replacement in Low-Intermediate Surgical Risk Patients: A Systematic Review and Meta-Analysis. J Invasive Cardiol. 2017;29(6):209–216. | ||
Reynolds MR, Lei Y, Wang K, et al. Cost-Effectiveness of Transcatheter Aortic Valve Replacement With a Self-Expanding Prosthesis Versus Surgical Aortic Valve Replacement. J Am Coll Cardiol. 2016;67(1):29–38. | ||
Tam DY, Hughes A, Fremes SE, et al. A cost-utility analysis of transcatheter versus surgical aortic valve replacement for the treatment of aortic stenosis in the population with intermediate surgical risk. J Thorac Cardiovasc Surg. 2018;155(5):1978–1988. | ||
Pradelli L, Zaniolo O. Perceval Sutureless valves in isolated and concomitant AVR procedures: an economic model shows overall decrease of costs for isolated or combined operations. Farmeconomia. Health economics and therapeutic pathways. 2012;13(4):159–174. | ||
Laborde F, Folliguet T, Ghorayeb G, Zannis K. Sutureless Valves Reduce Hospital Costs Compared to Traditional Valves. J Heart Valve Dis. 2017;26(1):1–8. | ||
Minami T, Sainte S, De Praetere H, et al. Hospital cost savings and other advantages of sutureless vs stented aortic valves for intermediate-risk elderly patients. Surg Today. 2017;47(10):1268–1273. | ||
Pollari F, Santarpino G, Dell’Aquila AM, et al. Better short-term outcome by using sutureless valves: a propensity-matched score analysis. Ann Thorac Surg. 2014;98(2):611–617. | ||
Santarpino G, Pfeiffer S, Jessl J, et al. Clinical Outcome and Cost Analysis of Sutureless Versus Transcatheter Aortic Valve Implantation With Propensity Score Matching Analysis. Am J Cardiol. 2015;116(11):1737–1743. | ||
HICPs – Harmonized Indices of Consumer Prices – Health sector [webpage on the Internet]. Available from: http://ec.europa.eu/eurostat/tgm/table.do?tab=table&init=1&language=en&pcode=tec00027&plugin=1. Accessed December 12, 2017. | ||
Consumer Price Index (CPI) Australia – Australian Bureau of Statistics. Available from: http://www.abs.gov.au/AUSSTATS/[email protected]/DetailsPage/6401.0Sep%202017?OpenDocument. Accessed December 2017. | ||
National Institute for Health and Care Excellence (NICE). Guide to the methods of technology appraisal 2013 (PMG9). Available from: https://www.nice.org.uk/process/pmg9. | ||
Wendler O, Schymik G, Treede H, et al. SOURCE 3 Registry: Design and 30-Day Results of the European Postapproval Registry of the Latest Generation of the SAPIEN 3 Transcatheter Heart Valve. Circulation. 2017;135(12):1123–1132. | ||
Wan X, Wang W, Liu J, Tong T. Estimating the sample mean and standard deviation from the sample size, median, range and/or interquartile range. BMC Med Res Methodol. 2014;14:135. | ||
Takagi H, Ando T, Umemoto T; ALICE (All-Literature Investigation of Cardiovascular Evidence) Group. Direct and adjusted indirect comparisons of perioperative mortality after sutureless or rapid-deployment aortic valve replacement versus transcatheter aortic valve implantation. Int J Cardiol. 2017;228:327–334. | ||
Takagi H, Umemoto T; ALICE (All-Literature Investigation of Cardiovascular Evidence) Group. Sutureless aortic valve replacement may improve early mortality compared with transcatheter aortic valve implantation: A meta-analysis of comparative studies. J Cardiol. 2016;67(6):504–512. | ||
Meco M, Miceli M, Montisci A, et al. Sutureless aortic valve replacement versus transcatheter aortic valve implantation: a meta-analysis of comparative matched studies using propensity score matching. Interactive Cardio Vasc Thorac Surg. 2017:1–8. | ||
Wang N, Tsai YC, Niles N, et al. Transcatheter aortic valve implantation (TAVI) versus sutureless aortic valve replacement (SUAVR) for aortic stenosis: a systematic review and meta-analysis of matched studies. J Thorac Dis. 2016;8(11):3283–3293. | ||
Ussia GP, Barbanti M, Petronio AS, et al. Transcatheter aortic valve implantation: 3-year outcomes of self-expanding CoreValve prosthesis. Eur Heart J. 2012;33(8):969–976. | ||
Kodali SK, Williams MR, Smith CR, et al. Two-year outcomes after transcatheter or surgical aortic-valve replacement. N Engl J Med Overseas Ed. 2012;366(18):1686–1695. | ||
Orlando R, Pennant M, Rooney S. Cost-effectiveness of transcatheter aortic valve implantation (TAVI) or aortic stenosis in patients who are high risk or contraindicated for surgery: a model-based economic evaluation. Health Technol Assess. 2013;17(33):1–86. | ||
Eandi M, Pradelli L, Iannazzo S, Chiroli S, Pontoriero G. Economic evaluation of cinacalcet in the treatment of secondary hyperparathyroidism in Italy. Pharmacoeconomics. 2010;28(11):1041–1054. | ||
Barbanti M, Petronio AS, Ettori F, et al. 5-Year Outcomes After Transcatheter Aortic Valve Implantation With CoreValve Prosthesis. JACC Cardiovasc Interv. 2015;8(8):1084–1091. | ||
Santarpino G, Pfeiffer S, Jessl J, et al. Sutureless replacement versus transcatheter valve implantation in aortic valve stenosis: a propensity-matched analysis of 2 strategies in high-risk patients. J Thorac Cardiovasc Surg. 2014;147(2):561–567. | ||
Fischlein T, Meuris B, Hakim-Meibodi K, et al. The sutureless aortic valve at 1 year: A large multicenter cohort study. J Thorac Cardiovasc Surg. 2016;151(6):1617–1626. | ||
Göhler A, Geisler BP, Manne JM, et al. Utility estimates for decision-analytic modeling in chronic heart failure – health states based on New York Heart Association classes and number of rehospitalizations. Value Health. 2009;12(1):185–187. | ||
Codner P, Orvin K, Assali A, et al. Long-Term Outcomes for Patients With Severe Symptomatic Aortic Stenosis Treated With Transcatheter Aortic Valve Implantation. Am J Cardiol. 2015;116(9):1391–1398. | ||
Leon MB, Smith CR, Mack M, et al. Transcatheter aortic-valve implantation for aortic stenosis in patients who cannot undergo surgery. N Engl J Med. 2010;363(17):1597–1607. | ||
Meuris B, Flameng WJ, Laborde F, Folliguet TA, Haverich A, Shrestha M. Five-year results of the pilot trial of a sutureless valve. J Thorac Cardiovasc Surg. 2015;150(1):84–88. | ||
Reardon MJ, Adams DH, Kleiman NS, et al. 2-Year Outcomes in Patients Undergoing Surgical or Self-Expanding Transcatheter Aortic Valve Replacement. J Am Coll Cardiol. 2015;66(2):113–121. | ||
Santarpino G, Pfeiffer S, Concistrè G, Fischlein T. Perceval sutureless aortic valve prosthesis: easy, fast, and safe. Innovations. 2011;6(6):378–381. | ||
Neri L, Mcewan P, Sennfält K, Baboolal K. Characterizing the relationship between health utility and renal function after kidney transplantation in UK and US: a cross-sectional study. Health Qual Life Outcomes. 2012;10:139. | ||
Chevreul K, Brunn M, Cadier B, et al. Cost of transcatheter aortic valve implantation and factors associated with higher hospital stay cost in patients of the FRANCE (FRench Aortic National CoreValve and Edwards) registry. Arch Cardiovasc Dis. 2013;106(4):209–219. | ||
New and emerging cardiac technologies in Australian and New Zealand public health services over the next decade [webpage on the Internet]. DLA Piper Australia; 2013. Available from: http://thehub.superu.govt.nz/sites/default/files/43019_DLA_Cardiac_Report_0.pdf. Accessed December 12th, 2017. | ||
Shrestha M, Fischlein T, Meuris B, et al. European multicentre experience with the sutureless Perceval valve: clinical and haemodynamic outcomes up to 5 years in over 700 patients. Eur J Cardiothorac Surg. 2016;49(1):234–241. | ||
Ailawadi G, Lapar DJ, Speir AM, et al. Contemporary Costs Associated With Transcatheter Aortic Valve Replacement: A Propensity-Matched Cost Analysis. Ann Thorac Surg. 2016;101(1):154–161. | ||
Lindsay AC, Sriharan M, Lazoura O, et al. Clinical and economic consequences of non-cardiac incidental findings detected on cardiovascular computed tomography performed prior to transcatheter aortic valve implantation (TAVI). Int J Cardiovasc Imaging. 2015;31(7):1435–1446. | ||
Rossi A, De Cecco CN, Kennon SRO, et al. CT angiography to evaluate coronary artery disease and revascularization requirement before trans-catheter aortic valve replacement. J Cardiovasc Comput Tomogr. 2017;11(5):338–346. | ||
Mwipatayi BP, Picardo A, Masilonyane-Jones TV, et al. Incidence and prognosis of vascular complications after transcatheter aortic valve implantation. J Vasc Surg. 2013;58(4):1028–1036. | ||
Paone S, Migliore A, Abraha I et al [webpage on the Internet]. Sutureless aortic valve replacement for aortic valve stenosis. Rome; 2015. Available from: http://www.salute.gov.it/imgs/C_17_pagineAree_1202_listaFile_itemName_9_file.pdf. Accessed December 12th, 2017. | ||
Australian Prostheses List (PLAC) [webpage on the Internet]. Available from: http://www.health.gov.au/internet/main/publishing.nsf/content/health-about-PLAC. Accessed December 12th, 2017. | ||
New Technology Add-On Payment (NTAP) for Perceval [webpage on the Internet]. Available from: https://www.cms.gov/Medicare/Medicare-Fee-for-Service-Payment/AcuteInpatientPPS/FY2018-IPPS-Final-Rule-Home-Page-Items/FY2018-IPPS-Final-Rule-Regulations.html. Accessed December 12th, 2017. | ||
Auffret V, Lefevre T, Van Belle E, et al. Temporal Trends in Transcatheter Aortic Valve Replacement in France: FRANCE 2 to FRANCE TAVI. J Am Coll Cardiol. 2017;70(1):42–55. | ||
Babaliaros V, Devireddy C, Lerakis S, et al. Comparison of transfemoral transcatheter aortic valve replacement performed in the catheterization laboratory (minimalist approach) versus hybrid operating room (standard approach): outcomes and cost analysis. JACC Cardiovasc Interv. 2014;7(8):898–904. | ||
Gutmann A, Kaier K, Sorg S, et al. Analysis of the additional costs of clinical complications in patients undergoing transcatheter aortic valve replacement in the German Health Care System. Int J Cardiol. 2015;179:231–237. | ||
Povero M, Pradelli L. Comparison between traditional and goal directed perfusion in cardiopulmonary by-pass. A differential cost analysis in US. Farmeconomia. Health Economics and Therapeutic Pathways. 2015;16(3):77–86. | ||
Povero M, Pradelli L. Comparison between traditional and goal directed perfusion in cardiopulmonary by-pass. Adaptation of a differential cost analysis. Health Economics and Therapeutic Pathways. 2015;16(Supp1 1):3–16. | ||
Kardaś-Słoma L, Lucet JC, Perozziello A, et al. Universal or targeted approach to prevent the transmission of extended-spectrum beta-lactamase-producing Enterobacteriaceae in intensive care units: a cost-effectiveness analysis. BMJ Open. 2017;7(11):e017402. | ||
Berti E, Fortuna D, Bartoli S, et al. I costi di ricovero e follow-up delle procedure di sostituzione valvolare aortica per via percutanea e cardiochirurgica a confronto: analisi secondo le prospettive del Sistema Sanitario Regionale e dell’Ospedale. G Ital Cardiol. 2016;17(Suppl 1): S22–S30. | ||
Fairbairn TA, Meads DM, Hulme C, et al. The cost-effectiveness of transcatheter aortic valve implantation versus surgical aortic valve replacement in patients with severe aortic stenosis at high operative risk. Heart. 2013;99(13):914–920. | ||
Thompson K, Taylor C, Forde K, Hammond N. The evolution of Australian intensive care and its related costs: A narrative review. Aust Crit Care. 2018;31(5):325–330. | ||
Murphy JC, Hansen PS, Bhindi R, Figtree GA, Nelson GI, Ward MR. Cost benefit for assessment of intermediate coronary stenosis with fractional flow reserve in public and private sectors in Australia. Heart Lung Circ. 2014;23(9):807–810. | ||
Walsh TS, Stanworth S, Boyd J, et al. The Age of BLood Evaluation (ABLE) randomised controlled trial: description of the UK-funded arm of the international trial, the UK cost-utility analysis and secondary analyses exploring factors associated with health-related quality of life and health-care costs during the 12-month follow-up. Health Technol Assess. 2017;21(62):1–118. | ||
Ray MJ, Brown KF, Burrows CA, O’Brien MF. Economic evaluation of high-dose and low-dose Aprotinin therapy during cardiopulmonary bypass. Ann Thorac Surg. 1999;68(3):940–945. | ||
The Economic Impact of End-Stage Kidney Disease in Australia – Projections to 2020 [webpage on the Internet]. Kidney Health Australia (KHA); 2010. Available from: http://kidney.org.au/cms_uploads/docs/kha-economic-impact-of-eskd-in-australia-projections-2020.pdf. Accessed December 12th, 2017. | ||
Gada H, Kapadia SR, Tuzcu EM, Svensson LG, Marwick TH, Murat Tuzcu E. Markov model for selection of aortic valve replacement versus transcatheter aortic valve implantation (without replacement) in high-risk patients. Am J Cardiol. 2012;109(9):1326–1333. | ||
Fattore G, Torbica A, Susi A, et al. The social and economic burden of stroke survivors in Italy: a prospective, incidence-based, multi-centre cost of illness study. BMC Neurol. 2012;12:137. | ||
Dewey HM, Thrift AG, Mihalopoulos C, et al. Cost of Stroke in Australia From a Societal Perspective. Stroke. 2001;32:2409–2416. | ||
Deniz HB, Caro JJ, Ward A, Moller J, Malik F. Economic and health consequences of managing bradycardia with dual-chamber compared to single-chamber ventricular pacemakers in Italy. J Cardiovasc Med. 2008;9(1):43–50. | ||
Palmer AJ, Roze S, Valentine WJ, et al. The CORE Diabetes Model: Projecting long-term clinical outcomes, costs and cost-effectiveness of interventions in diabetes mellitus (types 1 and 2) to support clinical and reimbursement decision-making. Curr Med Res Opin. 2004;20 Suppl 1:S5–S26. | ||
Icks A, Haastert B, Gandjour A, et al. Costs of dialysis--a regional population-based analysis. Nephrol Dial Transplant. 2010;25(5):1647–1652. | ||
Ray JA, Valentine WJ, Secnik K, et al. Review of the cost of diabetes complications in Australia, Canada, France, Germany, Italy and Spain. Curr Med Res Opin. 2005;21(10):1617–1629. | ||
Roggeri A, Roggeri DP, Zocchetti C, et al. Healthcare costs of the progression of chronic kidney disease and different dialysis techniques estimated through administrative database analysis. J Nephrol. 2017;30(2):263–269. | ||
Li B, Cairns JA, Fotheringham J, et al. Understanding cost of care for patients on renal replacement therapy: looking beyond fixed tariffs. Nephrol Dial Transplant. 2015;30(10):1726–1734. | ||
Howard K, Salkeld G, White S, et al. The cost-effectiveness of increasing kidney transplantation and home-based dialysis. Nephrology. 2009;14(1):123–132. | ||
Mercaldi CJ, Siu K, Sander SD, et al. Long-Term Costs of Ischemic Stroke and Major Bleeding Events among Medicare Patients with Nonvalvular Atrial Fibrillation. Cardiol Res Pract. 2012;2012:645469. | ||
Penaloza-Ramos MC, Jowett S, Barton P, et al. Cost-effectiveness analysis of different systolic blood pressure targets for people with a history of stroke or transient ischaemic attack: Economic analysis of the PAST-BP study. Eur J Prev Cardiol. 2016;23(15):1590–1598. | ||
Rinfret S, Cohen DJ, Lamas GA, et al. Cost-effectiveness of dual-chamber pacing compared with ventricular pacing for sinus node dysfunction. Circulation. 2005;111(2):165–172. | ||
Wiegand UK, Potratz J, Bode F, et al. Cost-effectiveness of dual-chamber pacemaker therapy: does single lead VDD pacing reduce treatment costs of atrioventricular block? Eur Heart J. 2001;22(2):174–180. | ||
Fagnani F, Litzler PY, Eltchaninof H, et al. Cost-effectiveness of transcatheter aortic valve implantation in high-risk patients with symptomatic aortic valve stenosis in France. Value Health. 2009;12(7):A328. | ||
Edwards SJ, Karner C, Trevor N. Dual-chamber pacemakers for treating symptomatic bradycardia due to sick sinus syndrome without atrioventricular block: a systematic review and economic evaluation. Health Technology Assessment (HTA). 2015;19(65):1–210. | ||
Taylor CJ, Monahan M, Roalfe AK, Barton P, Iles R, Hobbs FDR. The REFER (REFer for EchocaRdiogram) study: a prospective validation and health economic analysis of a clinical decision rule, NT-proBNP or their combination in the diagnosis of heart failure in primary care. EME. 2017;4(3):1–56. | ||
Bravo Vergel Y, Palmer S, Asseburg C, et al. Is primary angioplasty cost effective in the UK? Results of a comprehensive decision analysis. Heart. 2007;93(10):1238–1243. | ||
McCarthy FH, Savino DC, Brown CR, et al. Cost and contribution margin of transcatheter versus surgical aortic valve replacement. J Thorac Cardiovasc Surg. 2017;154(6):1872–1880. | ||
Cohen JD [webpage on the Internet]. Cost-effectiveness of transcatheter vs. surgical aortic valve replacement in intermediate risk patients. TCT 2017. Denver, CO; October 31, 2017. Available from: https://www.acc.org/~/media/Clinical/PDF-Files/Approved-PDFs/2017/10/24/TCT17_Presentation_Slides/Tue_Oct31/PARTNER-2A-SAPIEN-3-Cost-Effectiveness-TCT-2017.pdf. Accessed December 12th, 2017. |
 © 2018 The Author(s). This work is published and licensed by Dove Medical Press Limited. The full terms of this license are available at https://www.dovepress.com/terms.php and incorporate the Creative Commons Attribution - Non Commercial (unported, v3.0) License.
By accessing the work you hereby accept the Terms. Non-commercial uses of the work are permitted without any further permission from Dove Medical Press Limited, provided the work is properly attributed. For permission for commercial use of this work, please see paragraphs 4.2 and 5 of our Terms.
© 2018 The Author(s). This work is published and licensed by Dove Medical Press Limited. The full terms of this license are available at https://www.dovepress.com/terms.php and incorporate the Creative Commons Attribution - Non Commercial (unported, v3.0) License.
By accessing the work you hereby accept the Terms. Non-commercial uses of the work are permitted without any further permission from Dove Medical Press Limited, provided the work is properly attributed. For permission for commercial use of this work, please see paragraphs 4.2 and 5 of our Terms.