")
Back to Journals » Patient Preference and Adherence » Volume 8
Cost utility analysis of immunosuppressive regimens in adult renal transplant recipients in England and Wales
Authors Muduma G, Shaw J, Hart W, Odeyemi A, Odeyemi I
Received 16 June 2014
Accepted for publication 12 August 2014
Published 4 November 2014 Volume 2014:8 Pages 1537—1546
DOI https://doi.org/10.2147/PPA.S69461
Checked for plagiarism Yes
Review by Single anonymous peer review
Peer reviewer comments 4
Editor who approved publication: Dr Johnny Chen
Gorden Muduma,1 Jane Shaw,2 Warren M Hart,3 Abayomi Odeyemi,3 Isaac Odeyemi2
1Astellas Pharma Europe Limited, Chertsey, UK; 2Astellas Pharma Limited, Chertsey, UK; 3EcoStat Consulting UK Limited, London, UK
Background: End-stage renal disease is the irreversible final stage of chronic kidney disease and is fatal when not managed by either transplantation or dialysis. Transplantation is generally preferred over dialysis. However, to prevent graft rejection or loss, lifelong immunosuppression is required. Tacrolimus is currently the cornerstone of post-transplantation immunosuppression. The study aim was to carry out an economic evaluation of immunosuppression, including more recent agents such as a once-daily prolonged-release formulation of tacrolimus (Advagraf™) and belatacept, relative to a twice-daily immediate-release formulation of tacrolimus (Prograf™).
Methods: A model was constructed comprising six states: onset of biopsy-confirmed acute rejection, functioning graft with or without a biopsy-confirmed acute rejection, non-functioning graft (dialysis), re-transplantation, and death. Data on clinical effectiveness were derived from a systematic literature review and the model captured the effects of patient adherence to immunosuppressant therapy on graft survival using relative risk of graft survival and published data on adherence in patients using Advagraf and Prograf. In the base case, the time horizon was 25 years and one-way and probabilistic sensitivity analyses were conducted.
Results: The analysis demonstrated that Prograf was cost-effective when compared with cyclosporin and belatacept and was more effective than sirolimus, but would not be considered cost-effective against sirolimus. The modeled improvement in the adherence profile of patients using Advagraf relative to Prograf resulted in both improved clinical outcomes and reduced costs.
Conclusion: Prograf was more clinically effective than cyclosporin, belatacept, and sirolimus, supporting its current positioning as the mainstay of immunosuppressive therapy in renal transplant recipients. Based on improved patient adherence with Advagraf, the model projected that Advagraf would be both more effective and less costly than Prograf. Replacing Prograf with Advagraf as the standard of care for post-transplant immunosuppression could likely result in both cost savings and improved clinical outcomes.
Keywords: tacrolimus, costs, cost-effectiveness, Great Britain
Background
End-stage renal disease is the irreversible final stage of chronic kidney disease, in which the kidneys are no longer able to function properly. The condition results in a substantial reduction in patient quality of life and is fatal when not managed by either transplantation or dialysis.1–3 Of the two treatment options, transplantation is generally preferred over dialysis, as it typically results in improved patient quality of life, increased independence, and lower longer-term costs; however, without lifelong immunosuppression, transplant recipients are at risk of graft rejection or loss, arising from immune processes directed at the transplanted organ.
The calcineurin inhibitor (CNI) class of immunosuppressive drugs, including tacrolimus and cyclosporin, have long been the mainstay of post-transplant immunosuppression. Since the CNIs were first approved for prevention and treatment of graft rejection, a number of new immunosuppressive agents have been developed with the goal of reducing the attendant toxicity that has been associated with the CNI class. Among these newer agents licensed in the UK for kidney transplant immunosuppression are the mammalian target of rapamycin inhibitor class, which includes sirolimus, and the selective co-stimulation blocker belatacept. Micro-emulsified formulations of cyclosporin and once daily prolonged release tacrolimus have also been introduced, with the newer cyclosporin micro-emulsion (ME) formulation having already replaced the older formulation in current clinical practice. The ultimate goal of post-transplant immunosuppression is to effectively suppress the immune system, while minimizing post-transplant adverse events and toxicity. Current best practice strives to achieve this goal using newer immunosuppressive agents, often comprising a combination of drugs that strike the right balance between effectiveness and toxicity.
Published in 2004, national guidelines for immunosuppression in adult renal transplant patients in England and Wales reported that tacrolimus should be considered as an alternative to cyclosporin when a CNI is indicated as part of initial or maintenance immunosuppression in renal transplantation for adults.4 As with any national clinical guidelines, treatment recommendations were made on the basis of the best-available clinical and economic evidence on each of the available treatment options at the time. However, given the preponderance of new immunosuppressive drug classes and reformulations of older immunosuppressants that have been approved since 2004, there is a clear need to re-evaluate the economic drivers of the post-transplant immunosuppressive treatment landscape, including the more recent therapeutic options as appropriate comparators.
The aim of the present analysis was therefore to compare the efficacy, safety, and costs of the standard of care with Prograf (Astellas Pharma UK Ltd., Chertsey, UK) to current alternative treatments (Advagraf [Astellas Pharma UK Ltd.], cyclosporin ME, sirolimus, and belatacept), as primary immunosuppressive therapies in adult (>18 years old) patients undergoing renal transplantation from the perspective of the UK National Health Service (NHS). Cyclosporin ME was chosen as one of the comparators of choice rather than the original formulation of cyclosporin to reflect current clinical practice.
Methods
An economic model was developed to compare Prograf with currently available alternatives for immunosuppression after kidney transplantation in adults. These alternatives included Advagraf, belatacept, cyclosporin, and sirolimus (the latter as part of both CNI minimization and CNI avoidance strategies). A Markov model was constructed to represent the patient flow following successful kidney transplantation. A graphical representation of the model is presented in Figure 1. Consistent with Markovian principles, patients could be in only one of the finite health states at any given time point in the simulation. The model used a 1-year cycle length and was designed to support time horizons of between 5 and 25 years.
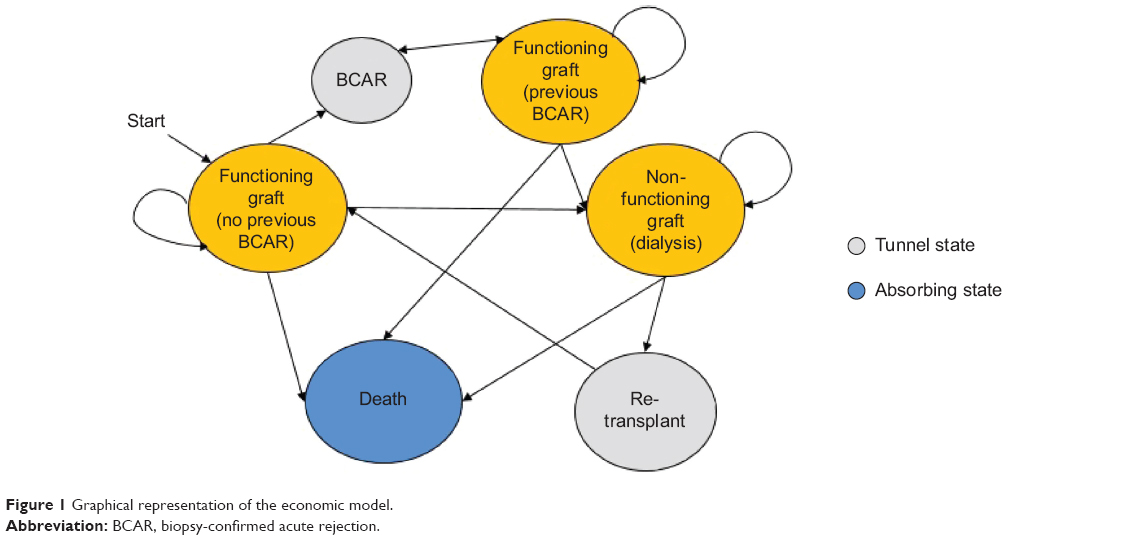 | Figure 1 Graphical representation of the economic model. |
In the first 12 months following a successful transplantation, patients could transition from the initial health state (functioning graft with no biopsy-confirmed acute rejection [BCAR]) to any one of the following health states: functioning graft with no previous BCAR, functioning graft with previous BCAR, non-functioning graft, or death. The model assumed that a BCAR would only occur in the first year after transplant (data on biopsy-proven acute rejections are generally reported up to 1 year since the majority of clinical trials are for a duration of no more than 12 months). Patients with a history of BCAR were exposed to a risk of graft loss relative to those with no BCAR history from the literature5 based on different hazard rates at 0–90, 91–180, and 180–365 days from transplantation.
Patients in the non-functioning graft state incurred costs of dialysis (Table S1) and could receive a re-transplant, based on re-transplantation rates derived from a UK study by McEwan et al.6 UK kidney transplant survival statistics7 were used to model graft and patient survival for up to 5 years, after which exponential extrapolation using the method of least squares was used. For patients on dialysis, UK survival data8 were used for the first 10 years and the exponential distribution was used for longer-term modeling. A review of the literature in line with National Institute for Health and Care Excellence (NICE) methods9 (from January 2002 to June 2013) was carried out to obtain acute rejection rates for all relevant comparators with indirect treatment comparison methods used where necessary.10 The incidence of adverse events was obtained from previous systematic reviews and economic evaluations.11–13 Health related quality of life data were obtained from the literature.14 Key data used in the model are summarized in the Supplementary material.
Based on NICE guidelines,9 future costs and outcomes were discounted at 3.5% per annum.
In the base case it was assumed that all patients would receive induction therapy (basiliximab) with a dose of 20 mg within 2 hours before transplantation and 20 mg 4 days after surgery. In analyses in which this assumption was relaxed, additional immunosuppression was assumed to be administered during the first few days post-transplant.
Immunosuppression doses of Prograf and Advagraf were based on a study by Silva et al15 (0.12, 0.10, 0.08 mg/kg and 0.14, 0.11, 0.09 mg/kg for Prograf and Advagraf, respectively at months 1, 6, and 12). For belatacept, cyclosporin, and sirolimus, mean daily dosing was based on the latest version of the British National Formulary,16 as were the daily doses of the concomitant medications mycophenolate mofetil (MMF) and corticosteroids.16
For BCAR, two resource strategies were considered. In the straightforward case, it was assumed that treatment would consist of intravenous methylprednisolone for 4 days. For steroid-resistant BCAR, administration of rabbit anti-human thymocyte immunoglobulin by intravenous infusion over at least 6 hours, 1–1.5 mg/kg daily for 7–14 days16 was assumed in addition to 4 days of hospitalization. The distribution of each type of strategy was determined by an advisory board of clinical and economic experts convened to review the model and the underlying assumptions. In the base case it was assumed (based on expert opinion) that 20% of BCAR would be resistant to steroid treatment.
For Advagraf it was assumed that improved adherence compared with Prograf would translate into reduced graft failure rates for those additional adherent patients. In a study by Kuypers et al17 88.2% of patients on Advagraf who remained engaged with the regimen took the prescribed number of daily doses, compared with 78.8% on Prograf. Based on the methodology used in a recently published budget impact model comparing Advagraf with Prograf,18 the odds of graft failure in non-adherent subjects were 7.1-fold greater than in adherent patients (95% confidence interval 4.4%–11.7%). For the purposes of the modeling analysis, this was converted to a relative risk (RR) of 3.47.19
A summary RR was calculated for comparing all patients taking Prograf and Advagraf using the above RR and the distribution of adherent and non-adherent patients as described by Kuypers et al.17 The inverse of the resulting RR (1/1.18) was applied to the graft survival curves in Table S2 in order to estimate the impact of adherence on graft survival.
Dialysis treatment for graft failures consisted of hospital, satellite or home hemodialysis, or continuous ambulatory or automated peritoneal dialysis.20 It was assumed that 82% of dialysis patients would be treated with hemodialysis21 based on a general population of patients undergoing dialysis. However, for patients returning to dialysis following a failed renal transplant, this percentage may well be higher in practice. Costs were weighted by the distribution of usage between the dialysis modality21 and inflated to 2013 values using the UK consumer price index (CPI).22
Health related quality of life utility values for functioning renal transplant, hemodialysis, and peritoneal dialysis were also derived from the literature (Table S3).14 NICE’s methods state that the EQ-5D is the preferred measure of health related quality of life in adults.23
In addition to the mortality associated with dialysis and having a functioning graft, mortality estimates were also included for the adult UK population by year, derived from data from the Office of National Statistics.24 The model employed an algorithm in which, for a given patient of a given age, the greatest probability of mortality was selected from the three possible mortality causes captured by the model: increased mortality with a functioning graft or dialysis, or the natural mortality of the general population.
The main outcome of the analysis was the ratio of the difference in costs between Prograf and any of the relevant comparators, and the difference in quality adjusted life-years (QALYs) between the same alternatives – the incremental cost-effectiveness ratio (ICER):
ICER = (Cp − Cc)/(Ep − Ec) |
where Cp and Cc represent the total annual costs in the Prograf and comparator arms, respectively and Ep and Ec represent the cumulative annual quality-adjusted life expectancy estimates in the Prograf and comparator arms, respectively.
In order to test the robustness of the model to changes in the values of key variables, one-way sensitivity analyses (changing the value of variables one by one) were conducted by varying the values of key variables individually. These variables included the time horizon, discount rates, the inclusion of adverse events, utilities, and costs. Additionally, probabilistic sensitivity analysis was also performed by assigning probability distributions to variables and running simulations by altering the values of key variables simultaneously. Cost-effectiveness plots (incremental costs against incremental benefits) and cost-effectiveness acceptability curves (CEAC) that show the probability that an intervention is cost-effective compared with the alternative, for a range of values were constructed for relevant alternatives to Prograf.
Results
The cost-effectiveness results for the base case are presented in Table 1.
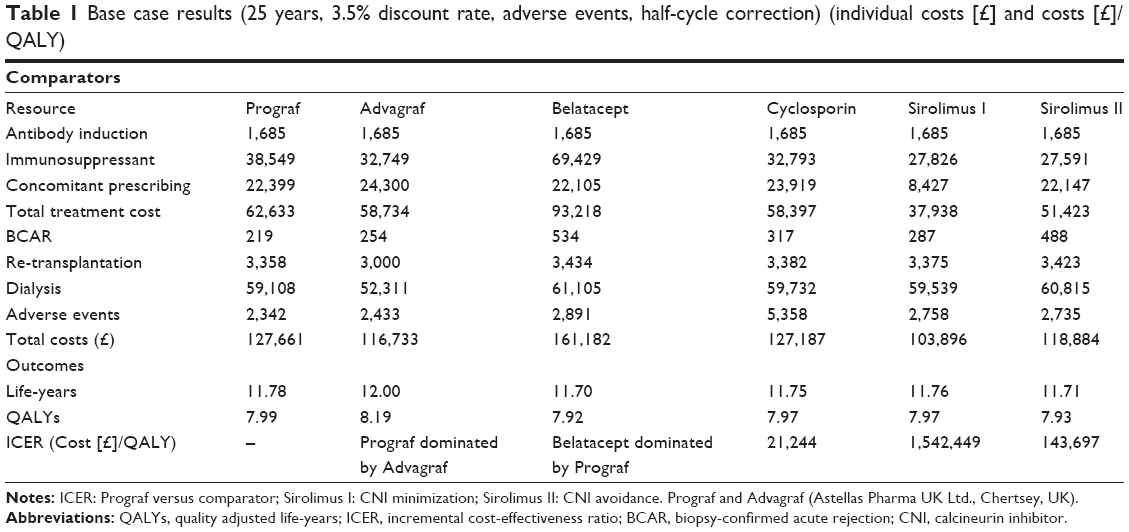 | Table 1 Base case results (25 years, 3.5% discount rate, adverse events, half-cycle correction) (individual costs [£] and costs [£]/QALY) |
The results suggested that Prograf (with twice-daily MMF and corticosteroids) was cost-effective when compared with both cyclosporin and belatacept (Prograf was less expensive and more effective than [ie, dominated] belatacept), but was not cost-effective when compared to sirolimus. Due to the derived clinical superiority of Advagraf arising from the increased adherence,17 Advagraf dominated Prograf since total costs associated with Advagraf were less and Advagraf was the more effective option.
The cost of re-transplantation used in the model is £25,469 (Table S1) followed by a total annual immunosuppressive costs of less than £6,000 (with Prograf). This compares with dialysis costs of £37,712, hence re-transplantation would be cost saving within 1 year. However, this would be subject to organ availability. Results of the probabilistic sensitivity analysis are summarized in Figure 2.
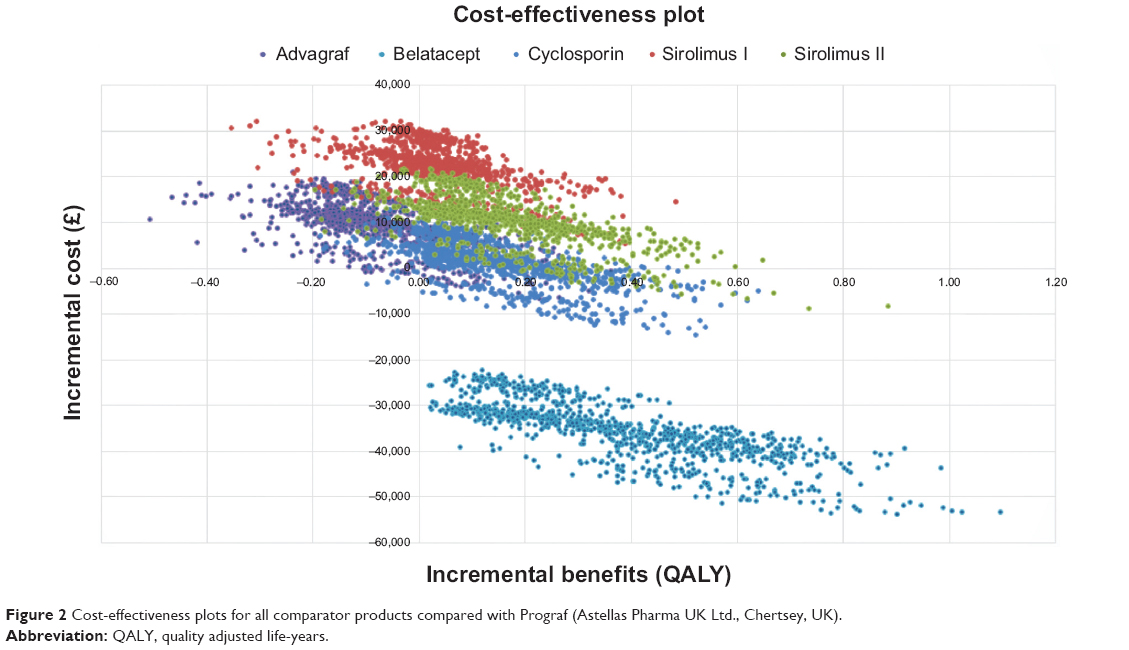 | Figure 2 Cost-effectiveness plots for all comparator products compared with Prograf (Astellas Pharma UK Ltd., Chertsey, UK). |
The figure clearly illustrates that Prograf was more effective and more expensive when compared with cyclosporin and sirolimus, dominated belatacept (ie, Prograf was more effective and less expensive), and was dominated by Advagraf (ie, Prograf was less effective and more expensive than Advagraf).
Figure 3 illustrates the CEAC for cyclosporin showing that Prograf would be cost-effective at a willingness-to-pay threshold of £30,000/QALY in 59.5% of cases. Results of the one-way sensitivity analysis are summarized in Table 2.
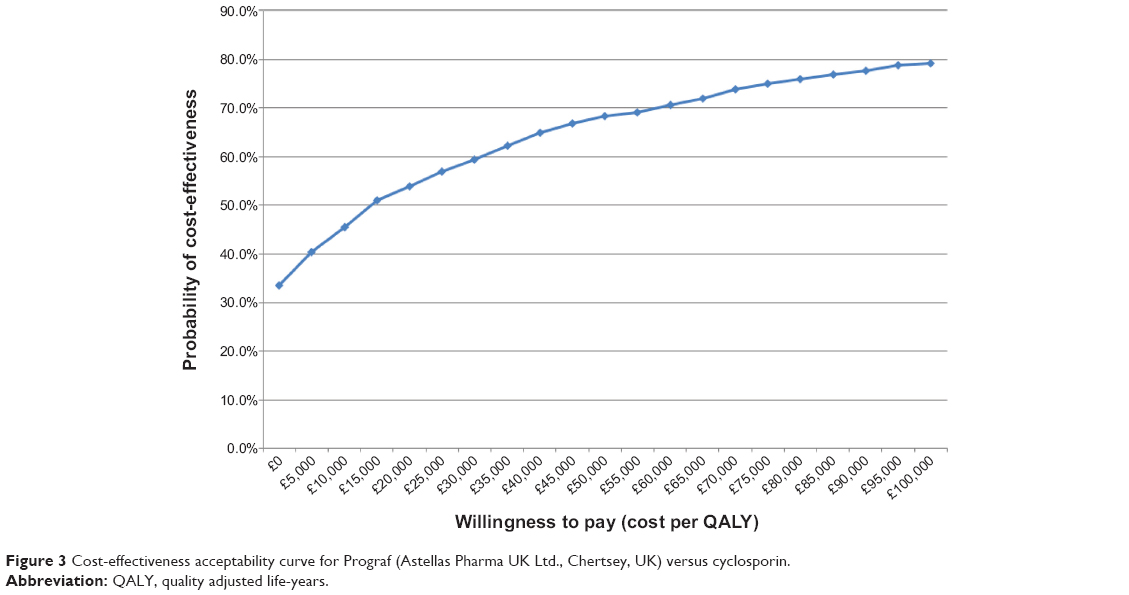 | Figure 3 Cost-effectiveness acceptability curve for Prograf (Astellas Pharma UK Ltd., Chertsey, UK) versus cyclosporin. |
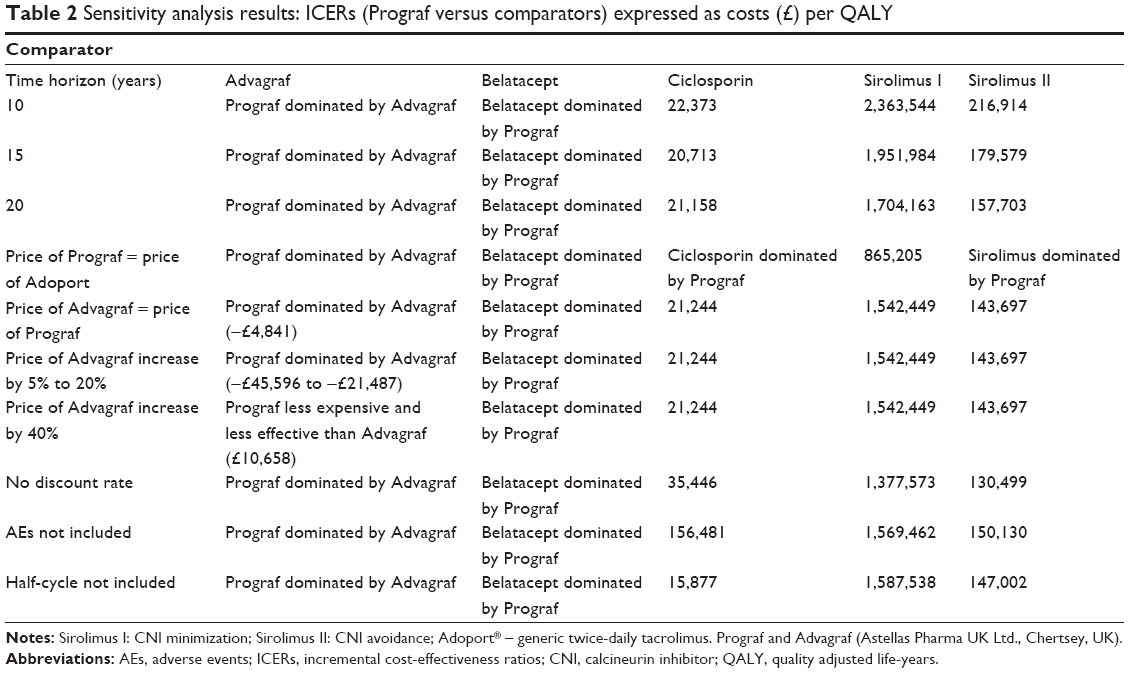 | Table 2 Sensitivity analysis results: ICERs (Prograf versus comparators) expressed as costs (£) per QALY |
Given that Prograf was dominated by Advagraf, a tornado diagram (a graph summarizing the results of one-way sensitivity analyses on key variables) would show negative ICERs, which are not interpretable. However, one-way analyses were conducted and plotted on a tornado diagram to ascertain the parameters with the greatest impact on the results (Figure 4).
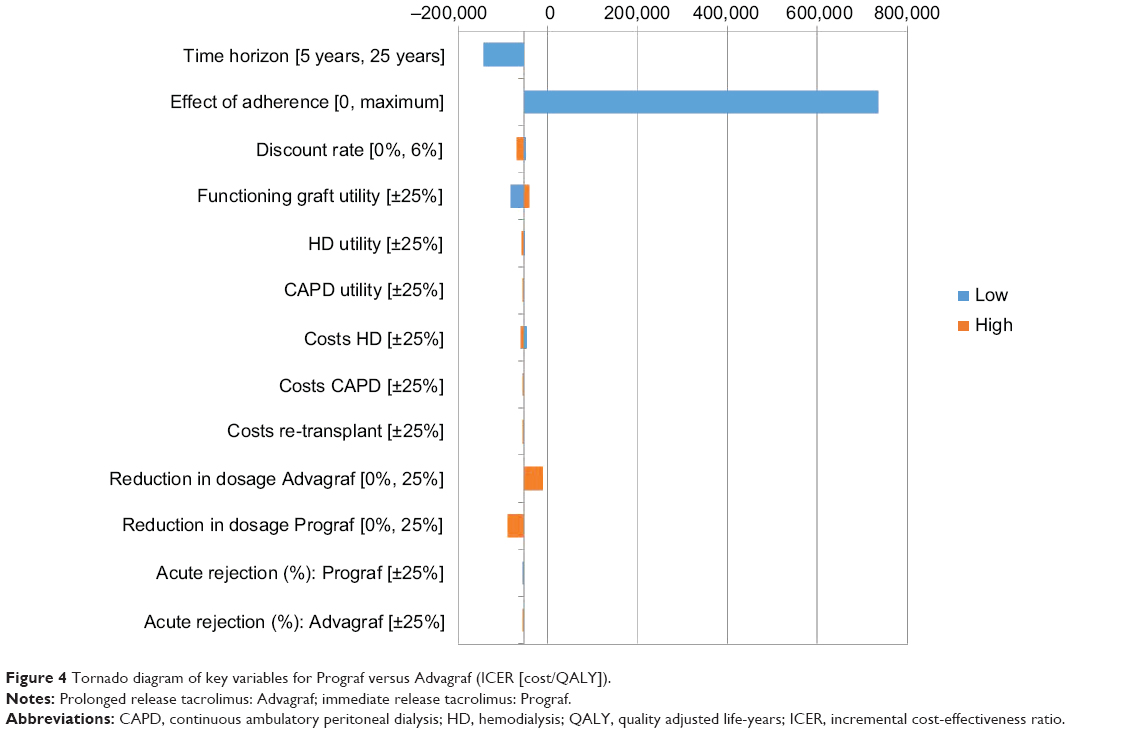 | Figure 4 Tornado diagram of key variables for Prograf versus Advagraf (ICER [cost/QALY]). |
ICERs were significantly affected by the time horizon and the effect of adherence. Variables having less influence on the results included the discount rate and costs and utilities associated with hemodialysis and continuous ambulatory peritoneal dialysis. Overall, the results were relatively insensitive to minor changes to the values of key variables used in the analysis, suggesting the model is robust.
Discussion
This study presents results of an economic evaluation comparing the standard of care for immunosuppression for kidney transplant recipients (Prograf) from the perspective of the UK NHS.
Although more expensive, Prograf is considered to be cost-effective when compared with cyclosporin since the ICER is within the generally-accepted threshold value of £20,000–30,000/QALY. For belatacept, Prograf was seen to be more effective and less costly. The cost and significantly higher acute rejection rate compared with CNIs in the first 3 months associated with belatacept (as detailed in a recent report of the All Wales Medicines Strategy Group)25 could act as a barrier to the wider use of belatacept in England and Wales.
When compared with sirolimus, although more effective, Prograf was not found to be cost-effective in this analysis. This is due to the significant differences in cost of the two alternatives. This result is consistent with a number of other economic models13,26,27 published since the last NICE recommendations were published in 2004.4 However, these studies should be interpreted with caution. Notably, the Symphony study28 showed that, at 1 year post-transplant, a regimen based on daclizumab induction, 2 g/day MMF, low-dose tacrolimus and steroids resulted in better renal function and lower acute rejection and graft loss rates compared with the same regimen with low-dose sirolimus. In a 3-year follow-up study,29 the largest ever prospective study in de novo kidney transplantation, daclizumab induction, MMF, steroids, and low-dose tacrolimus proved highly efficacious, without the negative effects on renal function commonly reported for standard CNI regimens. These 1- and 3-year findings of the Symphony study have resulted in minimal use of sirolimus for immunosuppression of kidney transplant recipients in England and Wales. Hence, sirolimus does not appear to be a relevant comparator in the context of England and Wales.
The modeling found that Advagraf is the most cost-effective option compared with Prograf due to its cost and clinical effectiveness. Although the emerging data on adherence and the implication for improved graft survival are encouraging, further study is warranted to assess the relationship between adherence and outcomes (and hence cost-effectiveness).
Limitations of the present study include the need to make assumptions such as acute rejection in the first year only, 20% resistant rejection, the RR of graft failure from non-adherence, the need to extrapolate beyond the length of clinical trials, and the combination of data from a large number of different sources. In this type of study, extrapolation beyond the relatively short duration of randomized controlled trials is common practice.30 The use of exponential modeling for graft and patient survival was endorsed by the clinical experts on the advisory board. Given the nature of the study area (at the intersection of economics and medical practice) and the time horizons over which cost-effectiveness is typically evaluated, it is unlikely that data could be identified prospectively from one source for all the distinct variables. While recognizing that data from different sources may be of differing quality and accuracy, the alternative would be to not address the issue of comparing immunosuppressive regimens from an economic perspective. Additionally, results from the sensitivity analysis suggest that the results are robust.
Conclusion
In conclusion, Prograf appears to maintain its status as the standard of care for the immunosuppression of kidney transplant recipients against relevant comparators.
Notwithstanding the underlying assumptions, national recommendations might consider Advagraf as a viable alternative to Prograf as the standard of care due to the improvement in graft survival attributable to the improvement in adherence observed in patients taking the once-daily formulation.
Acknowledgment
This research was sponsored by Astellas Pharma Ltd., and Astellas Pharma Europe Ltd., Chertsey, UK.
Disclosure
Gorden Muduma and Isaac Odeyemi are full-time employees of Astellas Pharma Europe Ltd., and Jane Shaw is a full-time employee of Astellas Pharma Ltd., Warren M Hart and Abayomi Odeyemi are full-time employees of EcoStat Consulting UK Ltd., which received consultancy fees from Astellas Pharma Ltd., and Astellas Pharma Europe Ltd., to perform the modeling analysis and prepare the manuscript.
References
Levey AS, Eckardt KU, Tsukamoto Y, et al. Definition and classification of chronic kidney disease: A position statement from Kidney Disease: Improving Global Outcomes (KDIGO). Kidney Int. 2005;67(6):2089–2100. | ||
Eknoyan G. Chronic kidney disease definition and classification: no need for a rush to judgment. Kidney Int. 2009;75(10):1015–1018. | ||
Abdel-Kader K, Unruh ML, Weisbod SD. Symptom burden, depression, and quality of life in chronic and end-stage kidney disease. Clin J Am Soc Nephrol. 2009;4(6):1057–1064. | ||
National Institute for Clinical Excellence [homepage on the Internet]. Immunosuppressive therapy for renal transplantation in adults. Technical Appraisal 85, September 2004. Available from: www.nice.org.uk/TA85. Accessed March 3, 2014. | ||
Opelz G, Döhler B; Collaborative Transplant Study Report. Influence of time of rejection on long-term graft survival in renal transplantation. Transplantation. 2008;85(5):661–666. | ||
McEwan P, Dixon S, Baboolal K, Conway P, Currie CJ. Evaluation of the cost effectiveness of sirolimus versus tacrolimus for immunosuppression following renal transplantation in the UK. Pharmacoeconomics. 2006;24(1):67–79. | ||
Organ Donation and Transplantation. Activity Report 2012/13. Available from: http://www.organdonation.nhs.uk/statistics/transplant_activity_report/archive_activity_reports/pdf/ukt/activity_report_2012_13.pdf. Accessed March 1, 2014. | ||
UK Renal Registry [homepage on the Internet]. UK Renal Registry 15th Annual Report: Chapter 5 Survival and Cause of Death of Adult Patients on Renal Replacement Therapy in 2011: national and centre-specific analyses. Available from: http://www.renalreg.com/Reports/2012.html. Accessed March 3, 2014. | ||
National Institute for Health and Care Excellence [homepage on the Internet]. The guidelines manual 2012; November 2012. Available from: http://www.nice.org.uk/guidance/pmg6. Accessed March 3, 2014. | ||
Wells GA, Sultan SA, Chen L, Khan M, Coyle D. Indirect evidence: indirect treatment comparisons in meta-analysis. Ottawa: Canadian Agency for Drugs and Technologies in Health; 2009. Available from: http://www.cadth.ca/en/products/health-technology-assessment/publication/884. Accessed September 16, 2014. | ||
Webster AC, Woodroffe RC, Taylor RS, Chapman JR, Craig JC. Tacrolimus versus ciclosporin as primary immunosuppression for kidney transplant recipients: meta-analysis and meta-regression of randomised trial data. BMJ. 2005;331(7520):810–820. | ||
Webster AC, Lee VW, Chapman JR, Craig JC. Target of rapamycin inhibitors (sirolimus and everolimus) for primary immunosuppression of kidney transplant recipients: a systematic review and meta-analysis of randomized trials. Transplantation. 2006;81(9):1234–1248. | ||
Jürgensen JS, Arns W, Hass B. Cost-effectiveness of immunosuppressive regimens in renal transplant recipients in Germany: a model approach. Eur J Health Econ. 2010;11(1):15–25. | ||
Lee AJ, Morgan CL, Conway P, Currie CJ. Characterisation and comparison of health-related quality of life for patients with renal failure. Curr Med Res Opin. 2005;21(11):1777–1783. | ||
Silva HT, Yang HC, Abouljoud M, et al. One-year results with extended-release tacrolimus/MMF, tacrolimus/MMF and cyclosporine/MMF in de novo kidney transplant recipients. Am J Transplant. 2007;7(3): 595–608. | ||
British National Formulary [homepage on the Internet]. BNF 66. BMJ Group, 2013. Available from: http://www.bnf.org. Accessed February 3, 2014. | ||
Kuypers DR, Peeters PC, Sennesael JJ, et al. Improved adherence to tacrolimus once-daily formulation in renal recipients: a randomized controlled trial using electronic monitoring. Transplantation. 2013;95(2): 333–340. | ||
Muduma G, Odeyemi I, Smith-Palmer J, Pollock RF. Budget impact of switching from an immediate-release to a prolonged-release formulation of tacrolimus in renal transplant recipients in the UK based on differences in adherence. Patient Prefer Adherence. 2014;8:391–399. | ||
Zhang J, Yu KF. What’s the relative risk? A method of correcting the odds ratio in cohort studies of common outcomes. JAMA. 1998;280(19):1690–1691. | ||
Kramer B, Charpentier B, Backman L, et al. Tacrolimus once daily (ADVAGRAF) versus twice daily (PROGRAF) in de novo renal transplantation: a randomized phase III study. Am J Transplant. 2010;10(12):2632–2643. | ||
National Institute for Health and Clinical Excellence [homepage on the Internet]. Peritoneal dialysis in the treatment of stage 5 chronic kidney disease. NICE clinical guideline 125; July 2011. Available from: http://www.nice.org.uk/guidance/cg125. Accessed March 3, 2014. | ||
Rate Inflation [homepage on the Internet]. Consumer price index. Available from: http://www.rateinflation.com. Accessed March 3, 2014. | ||
National Institute for Health and Care Excellence [homepage on the Internet]. Guide to the methods of technology appraisal; April 2013. Available from: http://www.nice.org.uk/guidance/pmg9. Accessed March 3, 2014. | ||
Office of national statistics [homepage on the Internet]. National Life tables, 2010–2012 available from: http://www.ons.gov.uk/ons/publications/re-reference-tables.html?edition=tcm%3A77-325699. Accessed March 3, 2014. | ||
All Wales Medicines Strategy Group [homepage on the Internet]. AWMSG secretariat assessment report – Advice No. 1712 Belatacept (Nulojix®▾) 250 mg powder for concentrate for solution for infusion; May 2012. Available from: http://www.awmsg.org/awmsgonline/app/appraisalinfo/430. Accessed August 14, 2014. | ||
Gamboa O, Montero C, Mesa L, et al. Cost-effectiveness analysis of the early conversion of tacrolimus to mammalian target of rapamycin inhibitors in patients with renal transplantation. Transplant Proc. 2011; 43(9):3367–3376. | ||
Rely K, Galindo-Suarez R, Alexandre P, et al. Cost utility of sirolimus versus tacrolimus for the primary prevention of graft rejection in renal transplant recipients in Mexico. Value in Health Regional Issues. 2012;1: 211–217. | ||
Ekberg H, Tedesco-Silva H, Demirbas A, et al. Reduced exposure to calcineurin inhibitors in renal transplantation. N Engl J Med. 2007; 357(25):2562–2575. | ||
Ekberg H, Bernasconi C, Tedesco-Silva H, et al. Calcineurin inhibitor minimization in the Symphony study: observational results 3 years after transplantation. Am J Transplant. 2009;9(8):1876–1885. | ||
Davies C, Briggs A, Lorgelly P, Garellick G, Malchau H. The “hazards” of extrapolating survival curves. Med Decis Making. 2013;33(3): 369–380. |
Supplementary materials
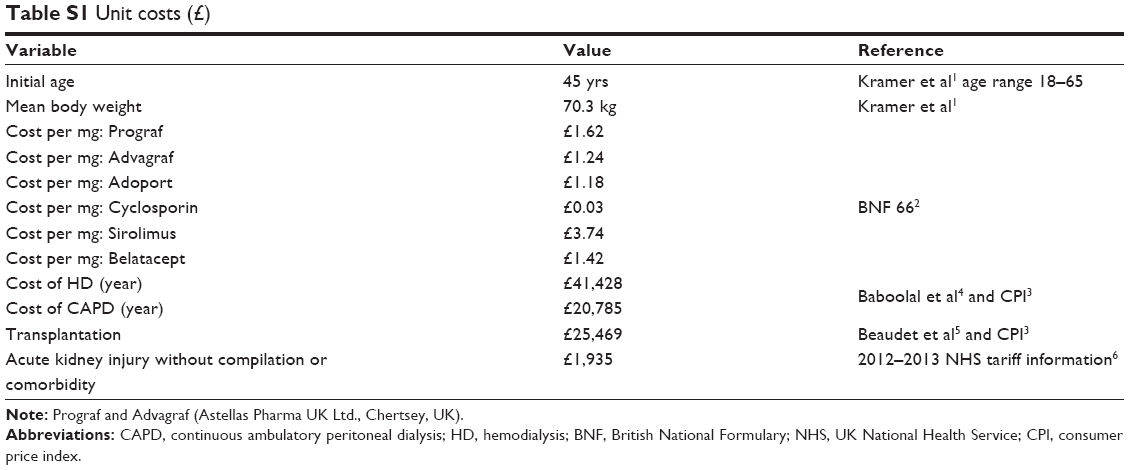 | Table S1 Unit costs (£) |
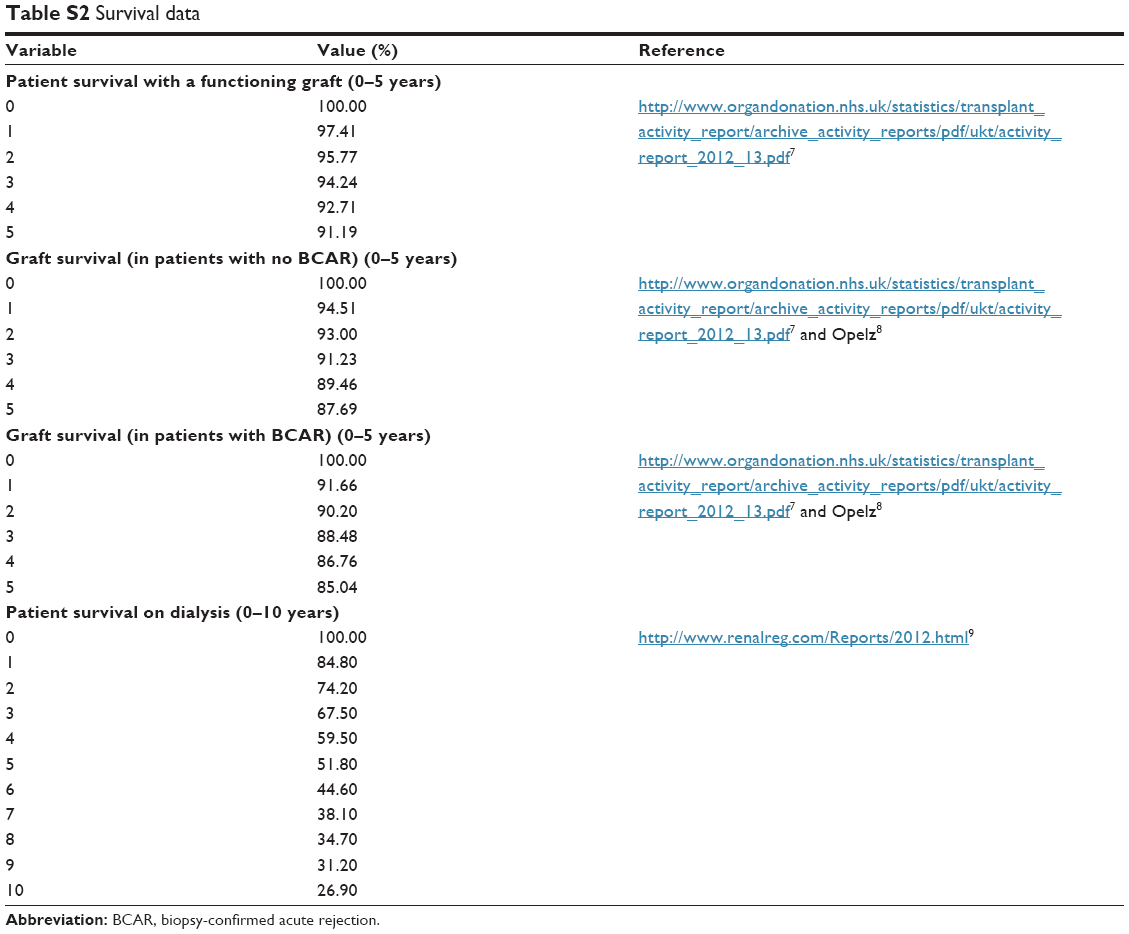 | Table S2 Survival data |
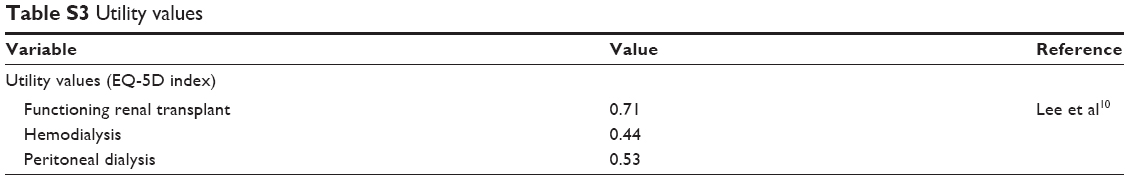 | Table S3 Utility values |
References
Kramer B, Charpentier B, Backman L, et al. Tacrolimus once daily (ADVAGRAF) versus twice daily (PROGRAF) in de novo renal transplantation: a randomized phase III study. Am J Transplant. 2010;10(12):2632–2643. | ||
British National Formulary [homepage on the Internet]. BNF 66. BMJ Group, 2013. Available from: http://www.bnf.org. Accessed February 3, 2014. | ||
Rate Inflation [homepage on the Internet]. Consumer price index. Available from: http://www.rateinflation.com. Accessed March 3, 2014. | ||
Baboolal K, McEwan P, Sondhi S, Spiewanowski P, Wechowski J, Wilson K. The cost of renal dialysis in a UK setting – a multicentre study. Nephrol Dial Transplant. 2008;23(6):1982–1989. | ||
Beaudet A, Palmer JL, Timlin L, et al. Cost-utility of exenatide once weekly compared with insulin glargine in patients with type 2 diabetes in the UK. J Med Econ. 2011;14(3):357–366. | ||
gov.uk [homepage on the Internet]. Payment by results in the NHS: tarriff for 2012–13. Available from: https://www.gov.uk/government/publications/confirmation-of-payment-by-results-pbr-arrangements-for-2012–13. Accessed March 3, 2014. | ||
Organ Donation and Transplantation. Activity Report 2012/13. Available from: http://www.organdonation.nhs.uk/statistics/transplant_activity_report/archive_activity_reports/pdf/ukt/activity_report_2012_13.pdf. Accessed March 1, 2014. | ||
Opelz G, Döhler B; Collaborative Transplant Study Report. Influence of time of rejection on long-term graft survival in renal transplantation. Transplantation. 2008;85(5):661–666. | ||
UK Renal Registry [homepage on the Internet]. UK Renal Registry 15th Annual Report: Chapter 5 Survival and Cause of Death of Adult Patients on Renal Replacement Therapy in 2011: national and centre-specific analyses. Available from: http://www.renalreg.com/Reports/2012.html. Accessed March 3, 2014. | ||
Lee AJ, Morgan CL, Conway P, Currie CJ. Characterisation and comparison of health-related quality of life for patients with renal failure. Curr Med Res Opin. 2005;21(11):1777–1783. |
 © 2014 The Author(s). This work is published and licensed by Dove Medical Press Limited. The full terms of this license are available at https://www.dovepress.com/terms.php and incorporate the Creative Commons Attribution - Non Commercial (unported, v3.0) License.
By accessing the work you hereby accept the Terms. Non-commercial uses of the work are permitted without any further permission from Dove Medical Press Limited, provided the work is properly attributed. For permission for commercial use of this work, please see paragraphs 4.2 and 5 of our Terms.
© 2014 The Author(s). This work is published and licensed by Dove Medical Press Limited. The full terms of this license are available at https://www.dovepress.com/terms.php and incorporate the Creative Commons Attribution - Non Commercial (unported, v3.0) License.
By accessing the work you hereby accept the Terms. Non-commercial uses of the work are permitted without any further permission from Dove Medical Press Limited, provided the work is properly attributed. For permission for commercial use of this work, please see paragraphs 4.2 and 5 of our Terms.