")
Back to Journals » ClinicoEconomics and Outcomes Research » Volume 10
Cost-effectiveness and budget impact of liraglutide in type 2 diabetes patients with elevated cardiovascular risk: a US-managed care perspective
Authors Shah D, Risebrough NA, Perdrizet J, Iyer NN , Gamble C, Dang-Tan T
Received 13 July 2018
Accepted for publication 27 August 2018
Published 14 November 2018 Volume 2018:10 Pages 791—803
DOI https://doi.org/10.2147/CEOR.S180067
Checked for plagiarism Yes
Review by Single anonymous peer review
Peer reviewer comments 3
Editor who approved publication: Dr Samer Hamidi
Dhvani Shah,1 Nancy A Risebrough,2 Johnna Perdrizet,1 Neeraj N Iyer,3 Cory Gamble,4 Tam Dang-Tan3
1ICON, Commercialisation and Outcomes, Health Economics, New York, NY, USA; 2ICON, Commercialisation and Outcomes, Health Economics, Toronto, ON, Canada; 3HEOR & Data Analytics, Novo Nordisk Inc, Plainsboro, NJ, USA; 4Medical and Scientific Affairs, Novo Nordisk, Plainsboro, NJ, USA
Background: The Liraglutide Effect and Action in Diabetes: Evaluation of Cardiovascular Outcomes Results (LEADER) clinical trial demonstrated that liraglutide added to standard-of-care (SoC) therapy for type 2 diabetes (T2D) with established cardiovascular disease (CVD) or elevated cardiovascular (CV) risk was associated with lower rates of death from CVD, nonfatal myocardial infarction (MI), or nonfatal stroke than SoC alone.
Objective: The objective of this study was to assess the cost-effectiveness (CE) and budget impact of liraglutide vs SoC in T2D patients with established CVD or elevated CV risk, over a lifetime horizon from a US managed care perspective.
Methods: A cohort state-transition model (costs and benefits discounted at 3% per year) was used to predict diabetes-related complications and death (CV and all-cause). Events, treatment effects, and discontinuation rates were from LEADER trial; utility and cost data (US$, 2017) were from literature. Sensitivity analysis explored the impact of uncertainty on results. Additionally, a budget impact analysis was conducted to evaluate the financial impact of liraglutide use in this population, with displacement from dulaglutide, assuming a health care plan with 1 million members.
Results: Liraglutide patients experienced 6.3% fewer events, had event-related cost-savings of $15,182, gained additional life-years of 0.67 and quality-adjusted life-years (QALYs) of 0.57, and had additional total costs ($60,928) vs SoC. Liraglutide was cost-effective with an incremental CE ratio of $106,749/QALY which was below the willingness-to-pay threshold of $150,000/QALY accepted by the Institute of Clinical and Economic Research. Liraglutide was cost-effective across all sensitivity analyses, except when the hazard ratio for all-cause mortality varied. The budget impact was neutral, with a per-plan-per-year and per-member-per-month cost-savings of $266,334 and $0.02, respectively.
Conclusion: From a US-managed care perspective, for T2D patients with established CVD or elevated CV risk, liraglutide is a cost-effective and a budget neutral treatment option for health care plans.
Keywords: liraglutide, cardiovascular disease, type 2 diabetes, cost-effectiveness, budget impact
Introduction
Type 2 diabetes (T2D) affects ~30.3 million people in the US, and ~1.5 million new cases are diagnosed each year.1 Direct health care costs of diabetes in the US amounted to $237 billion in 2017 with an additional $90 billion attributable to indirect costs, amounting to a 26% increase since 2012.2,3 Cardiovascular disease (CVD) is the leading cause of death in people with T2D.4 People with T2D are two to four times more likely to suffer from CVD than non-diabetic individuals and are at increased risk of coronary ischemia, myocardial infarction (MI), and stroke.4 Cardiovascular (CV) events in this population have a significant negative impact on quality of life that lasts beyond the immediate post-event period.5 Intensive glycemic control in T2D is associated with a reduced risk of microvascular complications, but the benefits for macrovascular health are less certain.6–9 A number of trials have found that improvements in glycemic control (as measured by the HbA1c biomarker) and reduction in microvascular events have not produced a corresponding benefit in reducing macrovascular or CV events.10–15
Liraglutide, approved by the US Food and Drug Administration (FDA) in 2010, was the first once-daily human glucagon-like peptide 1 receptor agonist (GLP-1 RA) for the treatment of T2D to become available in the US. It is administered once-daily by subcutaneous injection and is indicated (with limitations as described in the Prescribing Information) as an adjunct to diet and exercise, to improve glycemic control in adults with T2D, and to reduce the risk of major adverse CV events (MACE) in adults with T2D and established CVD.16 The CV effects of liraglutide were evaluated in the Liraglutide Effect and Action in Diabetes: Evaluation of Cardiovascular Outcomes Results (LEADER) clinical trial, a multicenter, international, placebo-controlled, double-blind, randomized trial that collected long-term data on CV outcomes of 9,340 adult patients with T2D who were at elevated risk of CV events (age ≥50 years with one or more coexisting CV conditions, or chronic kidney disease, or age ≥60 years with at least one CV risk factor).6,17 Patients were randomized to either liraglutide or placebo in addition to standard-of-care (SoC) treatment for T2D and CV risk reduction.17 Compared with the SoC group (placebo), patients in the liraglutide group had significantly lower rates of the composite primary outcome, which consisted of death from CV causes, nonfatal MI, or nonfatal stroke (HR =0.87; 95% CI, 0.78–0.97; P<0.001 for non-inferiority; P=0.01 for superiority).6 Patients in the liraglutide group were also significantly less likely to die from CV death (HR =0.78; 95% CI, 0.66–0.93; P=0.007) or from any cause (HR =0.85; 95% CI, 0.74–0.97; P=0.02). Addition of liraglutide was also associated with nonsignificant reductions in the rates of other MACE vs SoC, including nonfatal MI, nonfatal stroke, and hospitalization for heart failure, and with small improvements in HbA1c, systolic blood pressure, and weight.6
While the CV event reductions and improved CV outcomes observed in LEADER demonstrate the clinical effectiveness of liraglutide,6 the potential cost offsets and health benefits over a longer period in terms of cost-effectiveness (CE) have not been determined. Moreover, the budget impact of liraglutide to a US health care plan in the context of CV benefits (in addition to HbA1c reduction, based on data from the LEADER trial) in T2D patients with established CVD or elevated CV risk, to our knowledge, has not been estimated. We used a CE model to evaluate the costs and health benefits associated with liraglutide in T2D patients with established CVD or elevated CV risk, from a US-managed care perspective, taking into account CV events, including reduced risk of MACE. We also estimated the budget impact of liraglutide use in the same patient population, from a US-managed care perspective, for a hypothetical health care plan of 1 million members.
Methods
Study design
The incremental cost per quality-adjusted life-year (QALY) gained (ICER), was calculated using a cohort state-transition model to compare addition of liraglutide to SoC vs SoC alone, from a US-managed care payer perspective. The patient population was the same as the LEADER trial population, as set out in the trial protocol.18 Treatment targets in LEADER were HbA1c <7.0% (individualized depending on patient), blood pressure 130/80 mmHg, and LDL <100 mg/dL (<70 mg/dL in patients with CV event history). The SoC included antidiabetic therapies (metformin, thiazolidinediones, sulfonylureas, and alpha glucosidase inhibitors; whereas dipeptidyl peptidase-4 and other incretin-based therapies were not allowed) and antihypertensive, lipid-lowering and antiplatelet therapies as needed (including angiotensin-converting enzyme inhibitors or angiotensin-receptor blockers, statins, and other agents at investigator’s discretion) for CV risk reduction. The analyses were conducted for a lifetime time horizon (30 years) and an annual 3% discount rate was applied to costs and benefits beyond the first year.19
Patient population
The analysis used a hypothetical cohort of T2D patients with established CVD or elevated CV risk, using the LEADER population baseline characteristics.6 The target population were patients with HbA1c ≥7.0% who were 1) either naive to oral antidiabetic agents or treated with oral antidiabetic agents and/or selected insulins (human neutral protamine Hagedorn, long-acting analog, or premixed); and 2) at high CV risk (age ≥50 years with one or more coexisting CV condition or chronic kidney disease, or age ≥60 years with at least one additional CV risk factor). LEADER enrolled 9,340 patients in 32 countries. The mean age at baseline was 64.3±7.2 years, 64.3% were men, and mean body mass index was 32.5±6.3 kg/m2. Mean duration of T2D was 12.7±8.0 years, and mean HbA1c was 8.7±1.5. Chronic kidney disease of stage 3 or 4 was present in 24.7% of the patients. The majority (72.4%) of patients had established CVD.6,17
Model overview and assumptions
A cohort state-transition model with monthly cycles was developed in Excel to assess the CE of liraglutide in a population similar to LEADER over a lifetime (30 years) horizon. The model (Figure 1) simulated multiple health states (alive without events, alive with nonfatal events, and death) related to macrovascular events (MI, stroke, hospitalized for heart failure, ischemic heart disease), microvascular events (retinopathy, nephropathy), and severe hypoglycemia. Patients in the model could transition to death due to fatal CV events after nonfatal events, and from other causes. Detailed definitions of the LEADER endpoints have been previously published.6
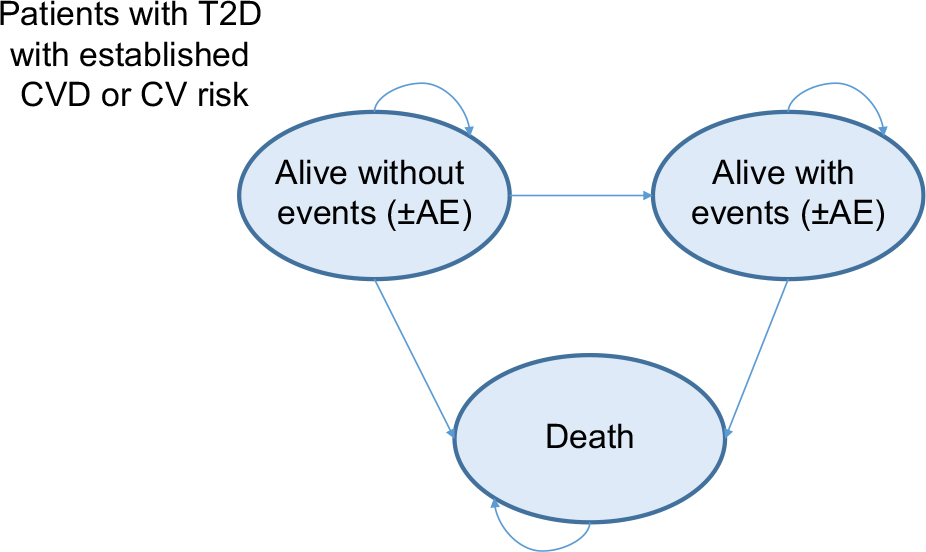 | Figure 1 Model schematic. Notes: Patients enter the model in an “alive without events” health state and can transition to one of the other health states. AEs (hypoglycemia) can be experienced in alive health states. The transition from the nonfatal event state to death is conditional on the event experienced. Abbreviations: AE, adverse event; CV, cardiovascular; T2D, type 2 diabetes. |
Clinical events
The event rates for survival and diabetic complications as well as hazard ratios for treatment effects of liraglutide were taken from the LEADER trial (Table 1).6
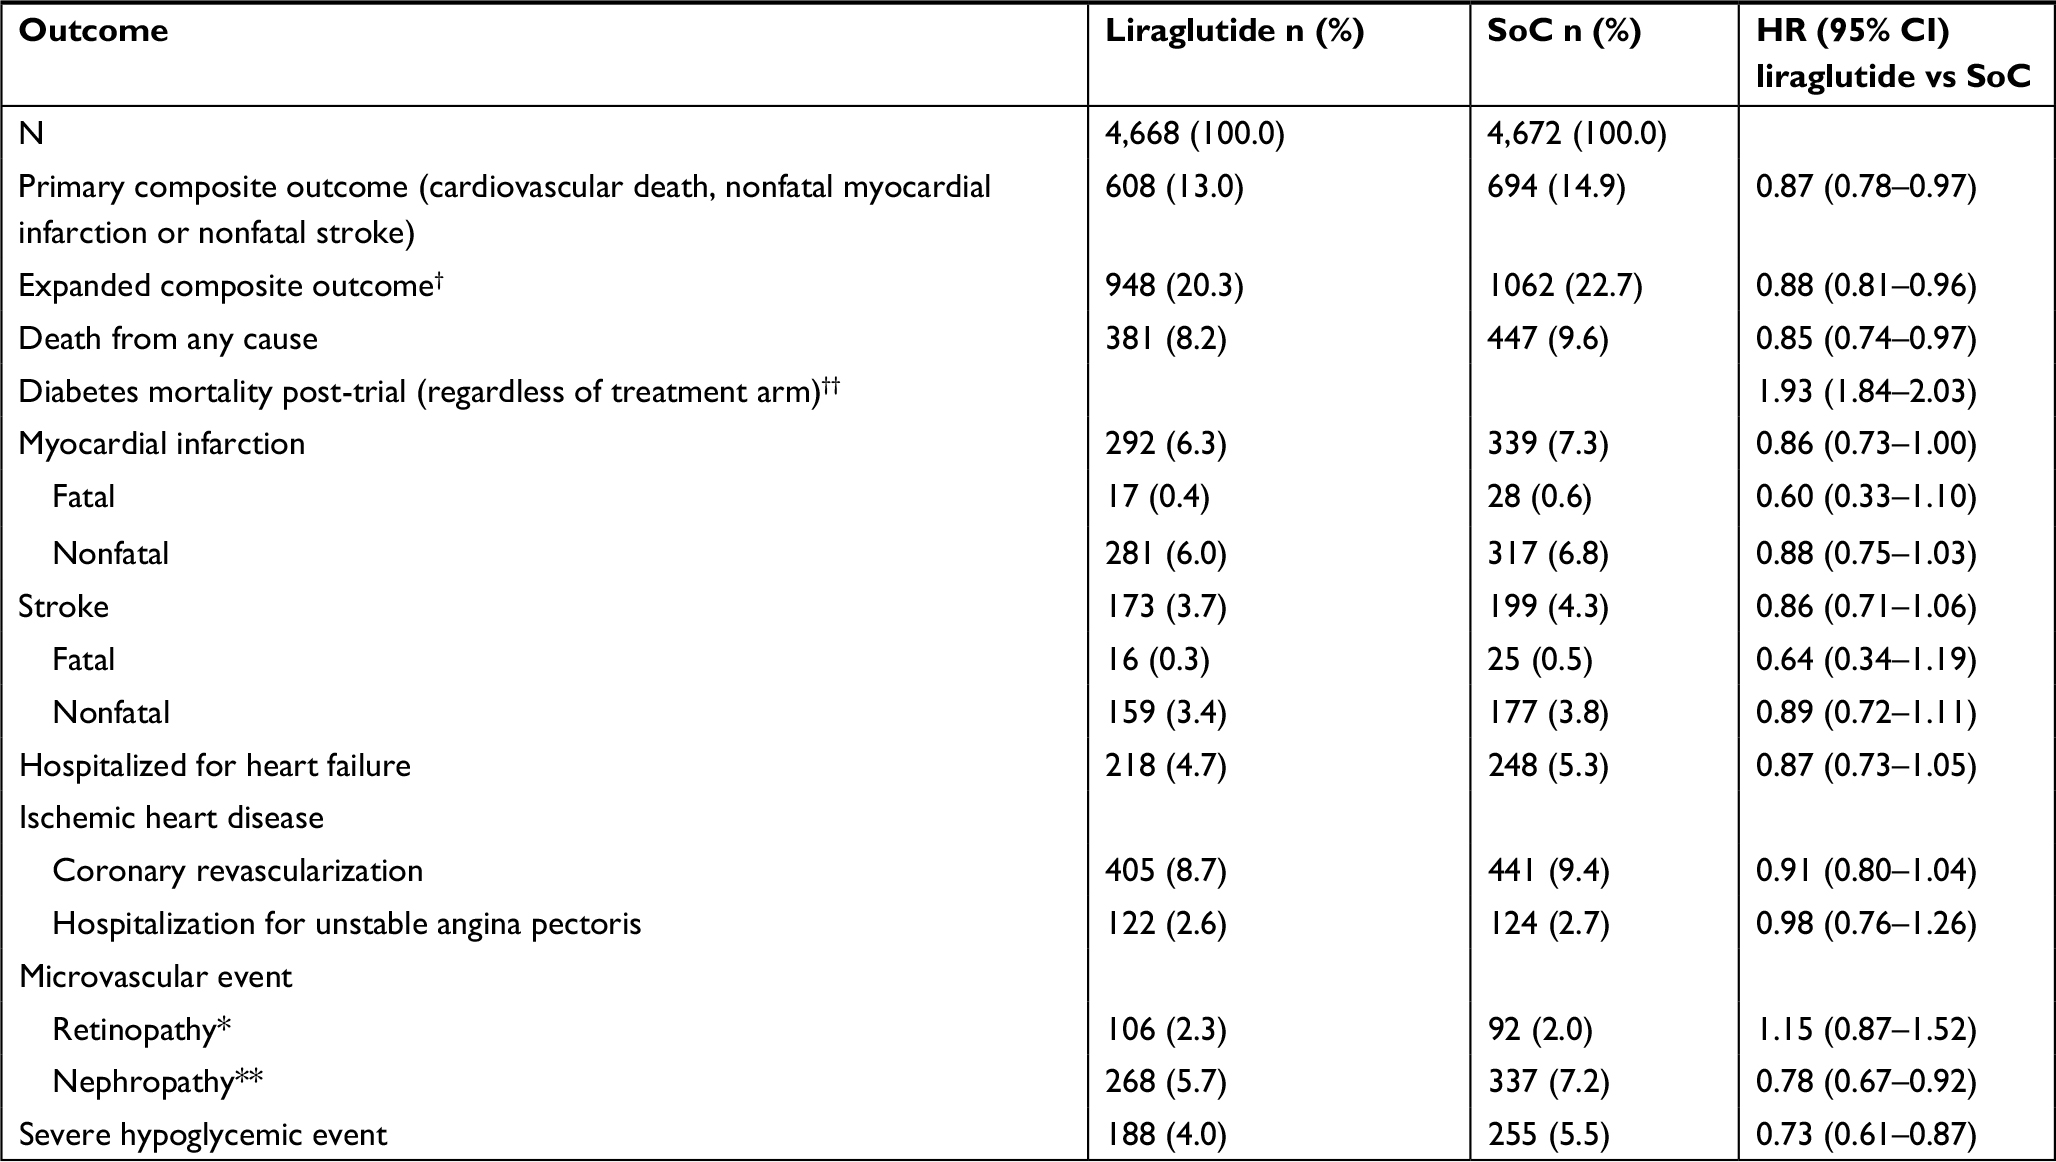 | Table 1 Event rates and hazard ratios Notes: Novo Nordisk. Data on File. LEADER Clinical Study Report, except post-trial diabetes mortality which was taken from Stokes 2017.24 aDeath from cardiovascular causes, nonfatal myocardial infarction, nonfatal stroke, coronary revascularization, or hospitalization for unstable angina pectoris or heart failure. bDiabetes mortality post-trial was taken from the literature and was not a HR for liraglutide vs SOC; but rather was a HR used to adjust all-cause mortality from Life Tables (US) for the higher risk of death from T2D. Diabetes mortality defined on the basis whether diabetes was assigned as the underlying cause of death on the death certificate; HR is vs age-matched non-diabetic individuals. cRetinopathy defined as the need for retinal photocoagulation or treatment with intravitreal agents, vitreous hemorrhage, or the onset of diabetes-related blindness. dNephropathy defined as the new onset of macroalbuminuria or a doubling of the serum creatinine level and an eGFR of ≤45 mL per minute per 1.73 m2, the need for continuous renal-replacement therapy, or death from renal disease. Abbreviations: SoC, standard of care; T2D, type 2 diabetes. |
The monthly event rate with SoC was interpolated from the cumulative event rate reported in the LEADER trial at the end of the trial observation period of 54 months (the analyses were truncated at 54 months since <10% of patients had an observation time beyond 54 months). Thus, the monthly mortality rate up to 54 months was based on mortality in the LEADER trial (Table 1). Mortality after a nonfatal event was sourced from published literature (Table 2).20–22 It was assumed that the probability of death after a nonfatal event was conditional on the specific CV event and independent of treatment. Beyond the trial duration, age-adjusted mortality data were obtained from US Life Tables (2013).23 Post-trial mortality was adjusted for the consequences of diabetes from two nationally representative samples of US adults surveyed in the National Health and Nutrition Examination Survey and in the National Health Interview Survey and published in the literature.24
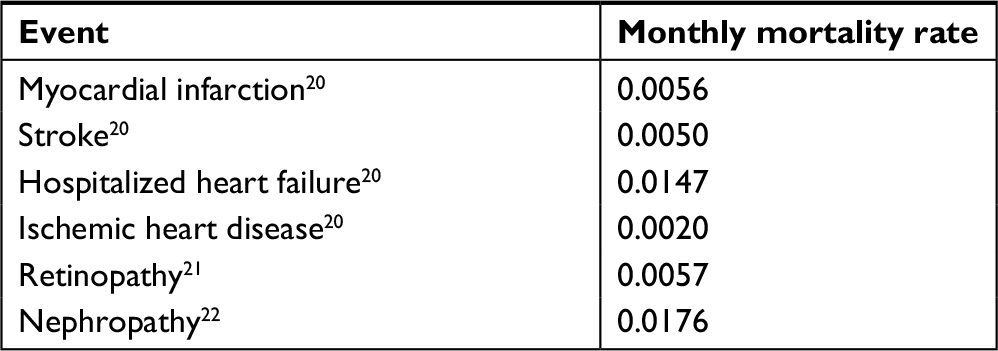 | Table 2 Monthly mortality rates following a nonfatal event |
Resource utilization and cost
Patients in the liraglutide + SoC arm were treated with appropriate antidiabetic and CV risk reduction agents (see study design) plus liraglutide, while those in the SoC alone arm were managed in the same way with the addition of placebo.17 The costs of antidiabetic agents were calculated from baseline use (baseline antidiabetic use for the SoC arm in LEADER was applied to both arms) and use introduced during the trial.18 Antidiabetic agent costs for the two treatment arms were calculated using unit costs (wholesale acquisition cost, obtained from Medi-Span Price Rx)25 and exposure time and can be found in Table S1. It was assumed that patients self-injected liraglutide with a prefilled syringe, with no additional costs from a managed care perspective for administration. In a scenario analysis, costs were added for needles and test strips.
Data on the cost of diabetes management for patients with and without complications were obtained from publically available US literature sources.26–28 Where necessary, costs were inflated to 2017 using the consumer price index from the US Bureau of Labor Statistics.29 Table 3 lists the cost inputs used in the base case of the model for the initial event and for subsequent years. Costs related to nonfatal diabetes complications “at time of event” included acute care and post-acute care costs (eg, inpatient care, outpatient visits, and medication costs accrued in the year of the initial hospital stay), including rehabilitation costs in the 12 months following the acute event. Subsequent year costs reflect resource use beyond the first year for the ongoing management of the complication. It was assumed that all fatal events incurred acute care costs associated with the event prior to death. For patients with prior CV events coming into the trial, it was assumed that “subsequent year” costs related to the prior CV event would be similar across both treatment arms, and only costs for new event complications were included in the analysis.
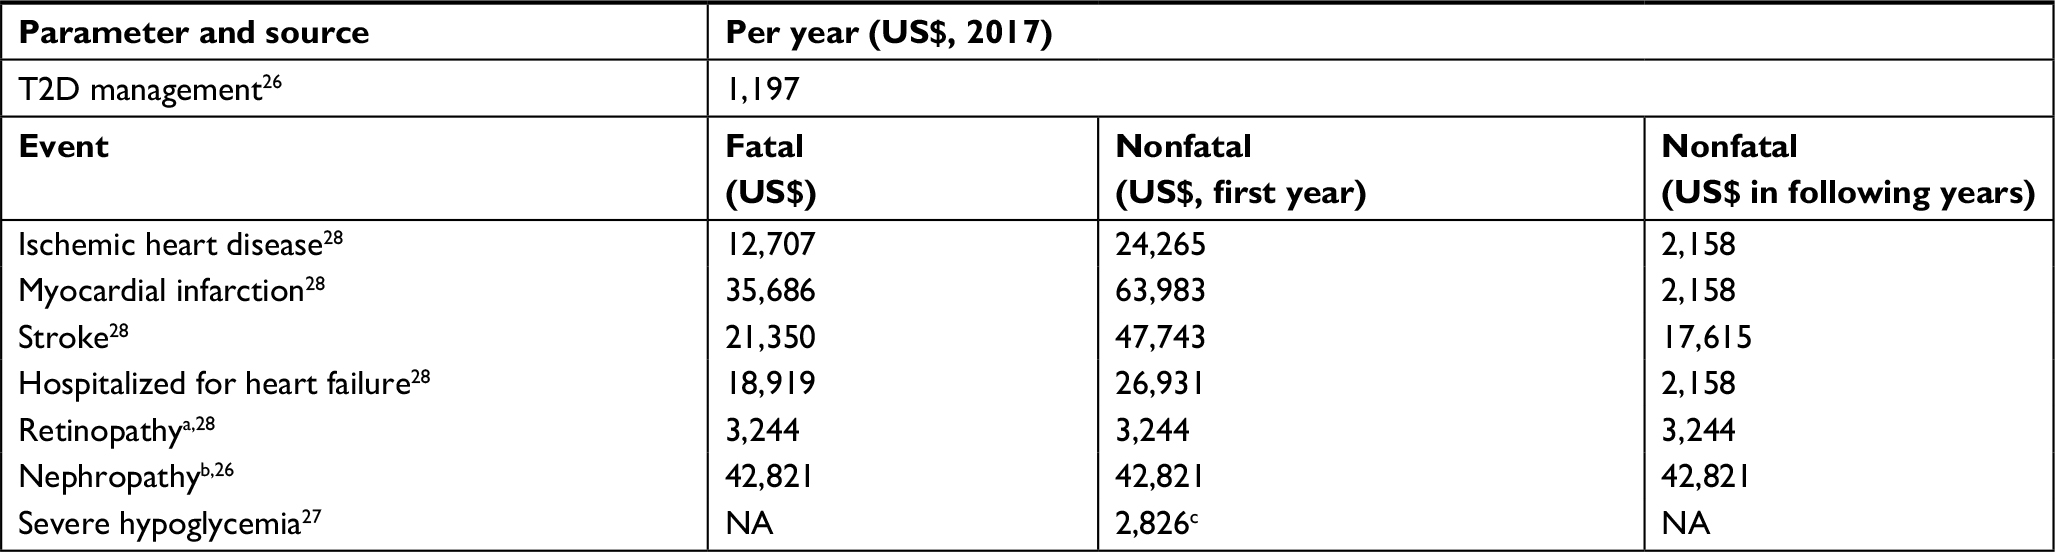 | Table 3 Estimates of diabetes-related costs Notes: aCosts associated with blindness were assumed for retinopathy. bBased on a weighted average annual cost of new onset of persistent macroalbuminuria, persistent doubling of serum creatinine and need for continuous renal-replacement therapy, using distribution observed in LEADER trial. cPer acute event. Abbreviations: NA, not applicable; T2D, type 2 diabetes. |
Utility
Utility decrements associated with CV events were not available from the LEADER trial and were therefore sourced from the literature. All utility values used a community-based EQ-5D catalog from the US or EQ-5D scores from a study of patients with T2D in Canada.30–33 The mean utility for patients with T2D who were free of complications was 0.753, taken from published literature for US patients with ICD-9 code 250 Diabetes Mellitus.33 Table 4 shows the disutility values for diabetes complications applied to the proportion with an event in each cycle of the model.
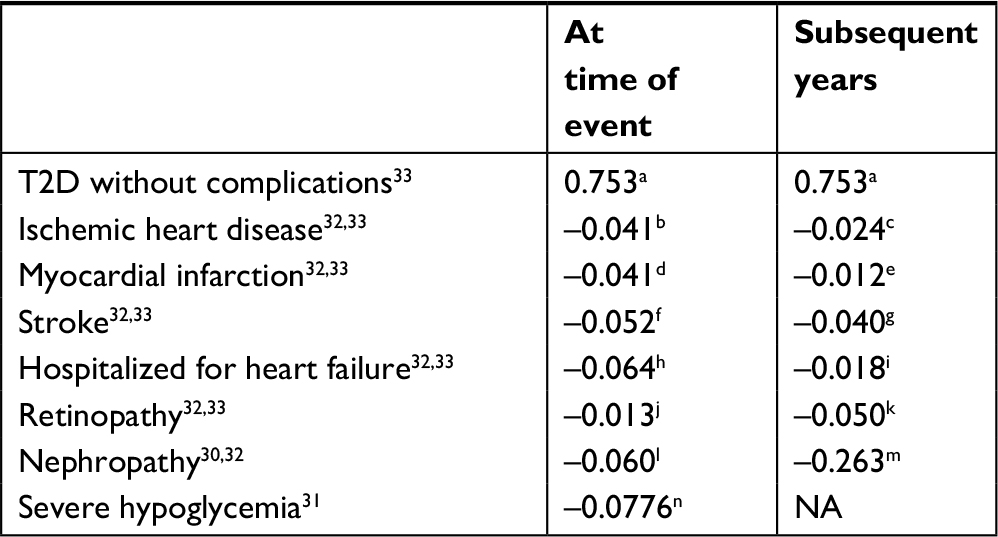 | Table 4 Disutility values associated with diabetes-related complications Notes: aBased on ICD-9 250 diabetes mellitus. bBased on ICD-9 401 angina pectoris. cBased on angina pectoris. dBased on ICD-9 410 acute myocardial infarction. eBased on myocardial infarction. fBased on ICD-9 436 cerebral vascular attack. gBased on stroke. hBased on ICD-9 428 heart failure. iBased on coronary heart disease. jBased on clinical classification category 097 defined as retinal detachments, defects, vascular occlusion, and retinopathy. kBased on ICD-9 369 blindness and low vision. lBased on ICD 9 code 586 renal failure not otherwise specified. mBased on end-stage renal disease with eGFR <15 mL/min/1.73 m2. nBased on an average between severe nocturnal and daytime events in T2D patients. Abbreviations: NA, not applicable; T2D, type 2 diabetes. |
Model assumptions
The monthly discontinuation rate (1.64%) was interpolated from the median exposure to liraglutide (3.5 years) reported in LEADER.6 After 54 months (the post-trial period), there was no evidence (either from LEADER or from publications of real-world data) to inform the modeling of treatment patterns with liraglutide. For the base case, we assumed that patients who were on liraglutide at 54 months remained on liraglutide, the treatment effect extended post-trial and patients continued to receive liraglutide plus background therapy, until the end of the timeframe. We also modeled a scenario (the “discontinuation” scenario) where it was conservatively assumed that all patients who had not already discontinued liraglutide at 54 months did so at that time and received background therapy equivalent to the SoC arm in the post-trial period. Thus, in this scenario, there was assumed to be no liraglutide treatment effect or cost after 54 months. Lastly, no costs associated with weight changes were included in the analyses.
Budget impact
The budget impact of liraglutide to a hypothetical US health care plan of 1 million members was calculated over a 5-year time horizon. The budget impact model (BIM) assumed that patients treated with GLP-1 RAs received background/SoC therapy, which was the same as the background/SoC received in the liraglutide arm of the LEADER trial. As there is no data for other GLP-1 RAs showing reduction in CV events with established CVD or elevated CV risk, patients on other GLP-1 RAs were assumed to have a treatment effect on CV events comparable to the SoC arm in LEADER.
US epidemiologic estimates to calculate the BIM target population included: diabetes prevalence in US (9%), proportion of diabetes patients with T2D (95%), and proportion of diabetes patients with high CV risk (35%).34,35 An open cohort was assumed, which allowed market expansion of GLP-1 RAs in years 1–5 (GLP-1 RA market share: year 1 =3.82%, year 2 =4.35%, year 3 =5.13%, year 4 =5.95%, year 5 =6.55%).36 Market share data were obtained for the overall T2D population36 and were assumed to be the same as in those with T2D with established CVD or elevated CV risk. Current market share projections of the GLP-1 RAs from years 2017 through 2021 were used for the “Before LEADER” setting (ie, setting prior to availability of CV benefit data for liraglutide from the LEADER trial) and then adjusted for expected change in liraglutide utilization for the “Taking into effect LEADER” setting (ie, setting with availability of CV benefit data, in addition to HbA1c reduction for liraglutide from LEADER trial) (Table S2).36 The additional uptake rate for liraglutide through years 1–5 for the “Taking into effect LEADER” setting was 0%, 0.50%, 6.01%, 15.38%, and 21.86%, respectively.36 Additional uptake rate for liraglutide was assumed to be taken from dulaglutide and was equally weighted between the doses 0.75 and 1.5 mg. Annual costs associated with each setting were estimated based on the daily cost of each treatment and the projected market share of each individual treatment.
Analyses
For the CE analyses, the incremental cost per life year (LY) gained and per QALY gained was determined for liraglutide + SoC vs SoC alone. One-way deterministic sensitivity analyses were conducted on the 95% upper and lower CI for all hazard ratios associated with diabetic complications and mortality, as well as ±20% of liraglutide daily cost. Scenario analyses were performed to assess the overall impact of the discount rate (0% and 5%), time horizon (5 and 10 years), adding in test strip and needle costs. Probabilistic sensitivity analysis (PSA) was run for 3,000 iterations in order to examine the uncertainty by varying all model parameters simultaneously. For distribution choice, beta and log normal distributions were used for HRs and utilities. Results were presented in an incremental cost and effectiveness scatter plot and a net benefit acceptability curve.
For the BIM, the incremental costs between the “Before LEADER” setting and “Taking into effect LEADER” setting was determined to estimate the budget impact of liraglutide in T2D patients with established CVD or elevated CV risk, taking into provision the CV benefits of liraglutide based on the LEADER trial results.
Results
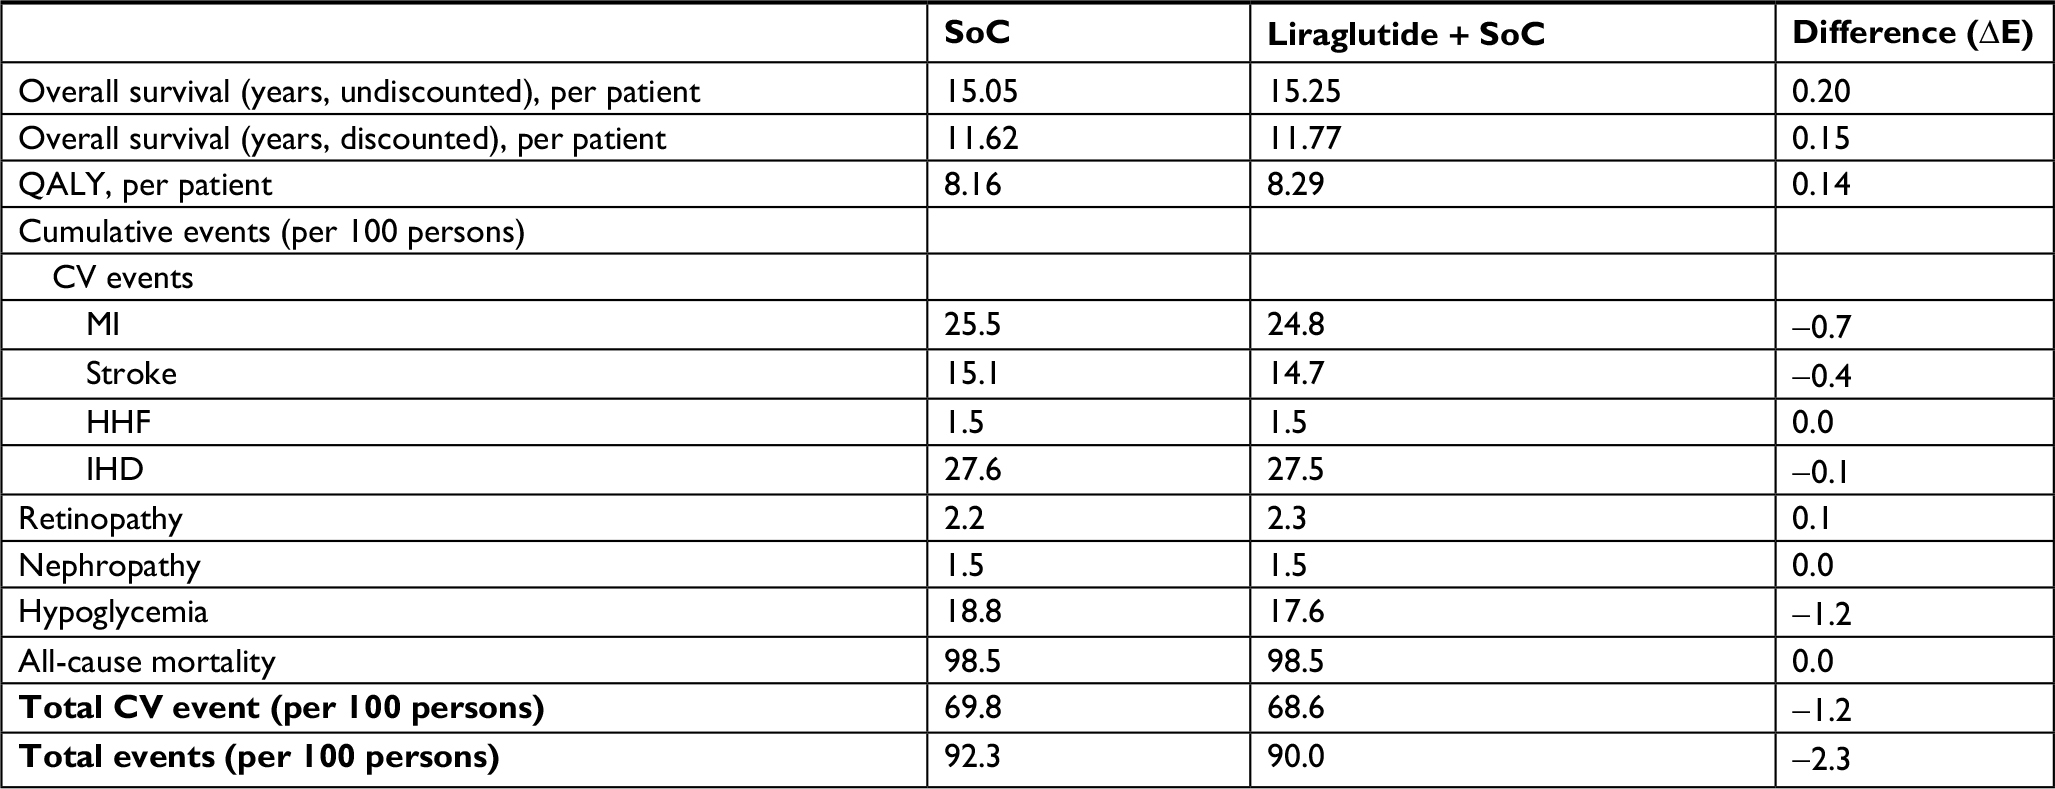
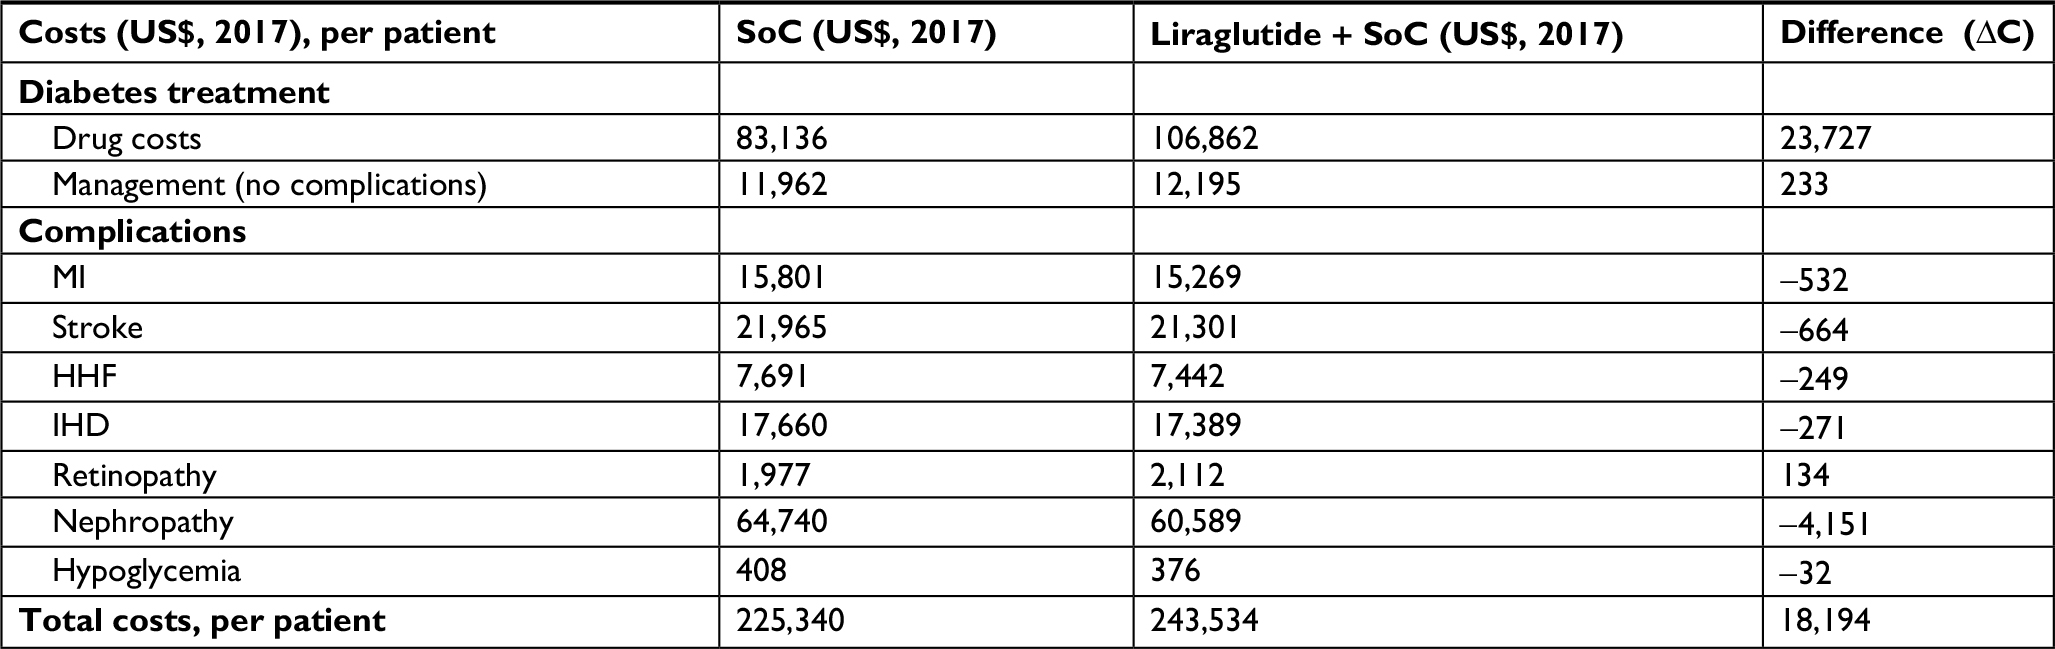
In the base case scenario, patients on liraglutide + SoC were predicted to experience 6.3% fewer events, with a per-patient event-related cost-savings of $15,182 compared with SOC alone. For liraglutide + SoC patients, the predicted gain in LYs was 0.67 and in QALYs was 0.57 compared with SoC alone. Total incremental costs were $60,928 higher for liraglutide + SoC compared with SoC alone. Base case clinical outcomes are shown in Table 5 and cost outcomes in Table 6. The estimated ICER was $106,749/QALY gained and $91,311/LY gained for liraglutide + SoC vs SoC alone. Thus, liraglutide + SoC was cost-effective compared with SoC alone at a willingness-to-pay threshold of $150,000/QALY, as used by the Institute for Clinical and Economic Review.37
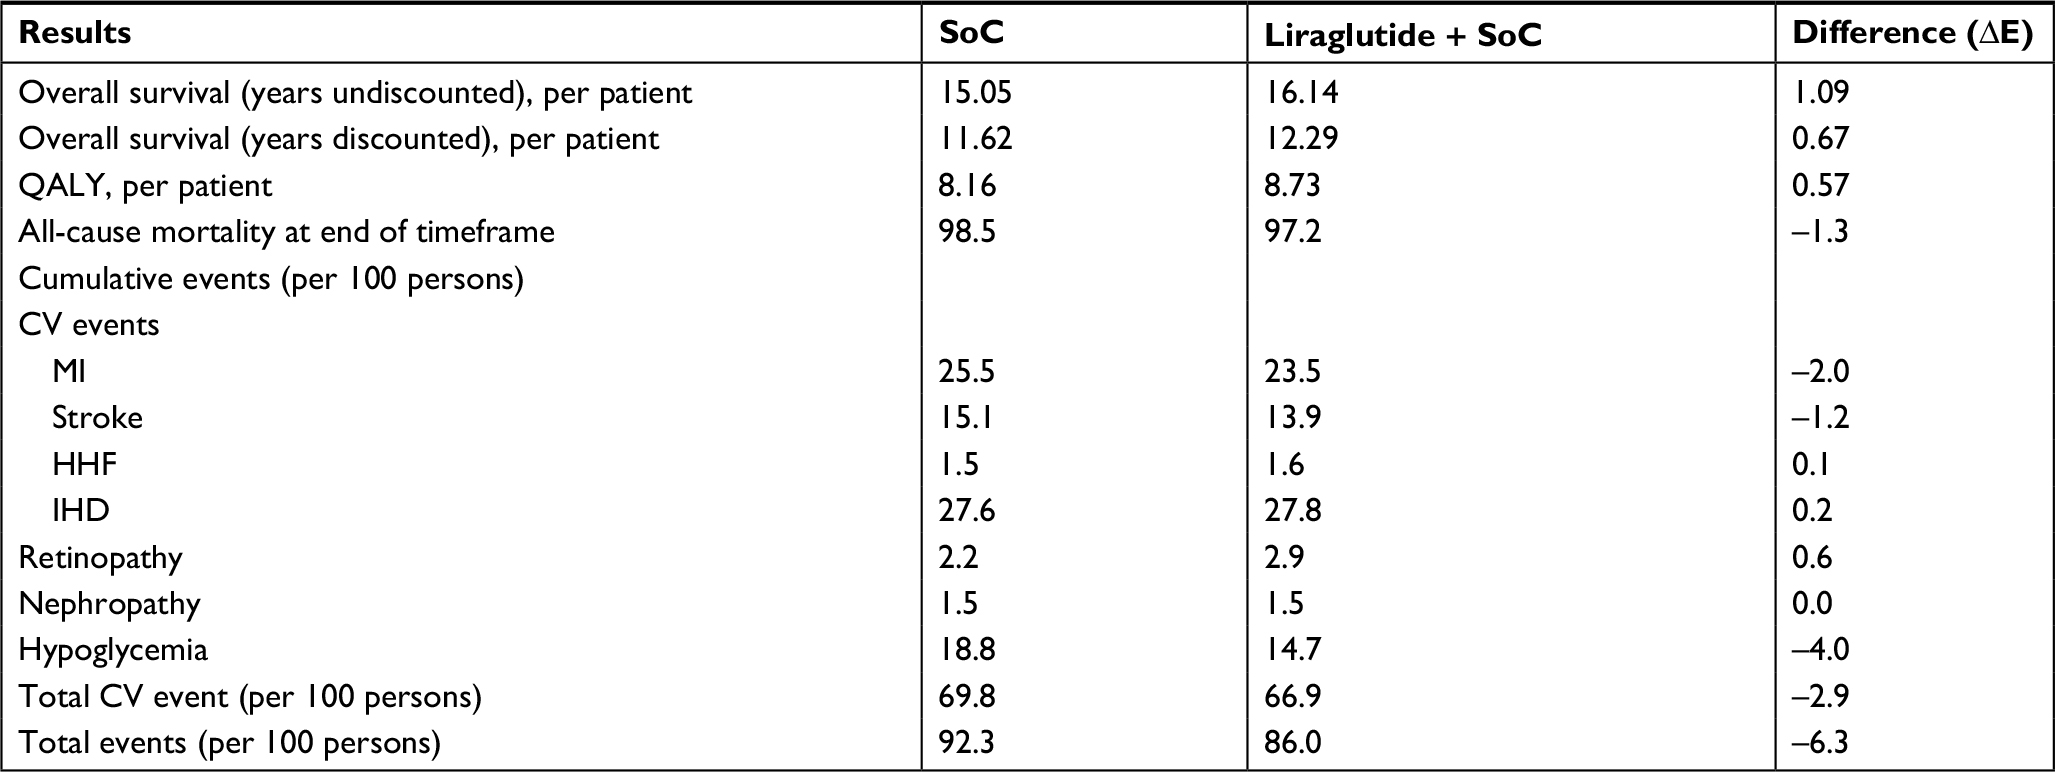 | Table 5 Clinical outcomes, base case Abbreviations: CV, cardiovascular; HHF, hospitalized for heart failure; IHD, ischemic heart disease; MI, myocardial infarction; QALY, quality-adjusted life year; SoC, standard of care; ∆E, incremental effectiveness. |
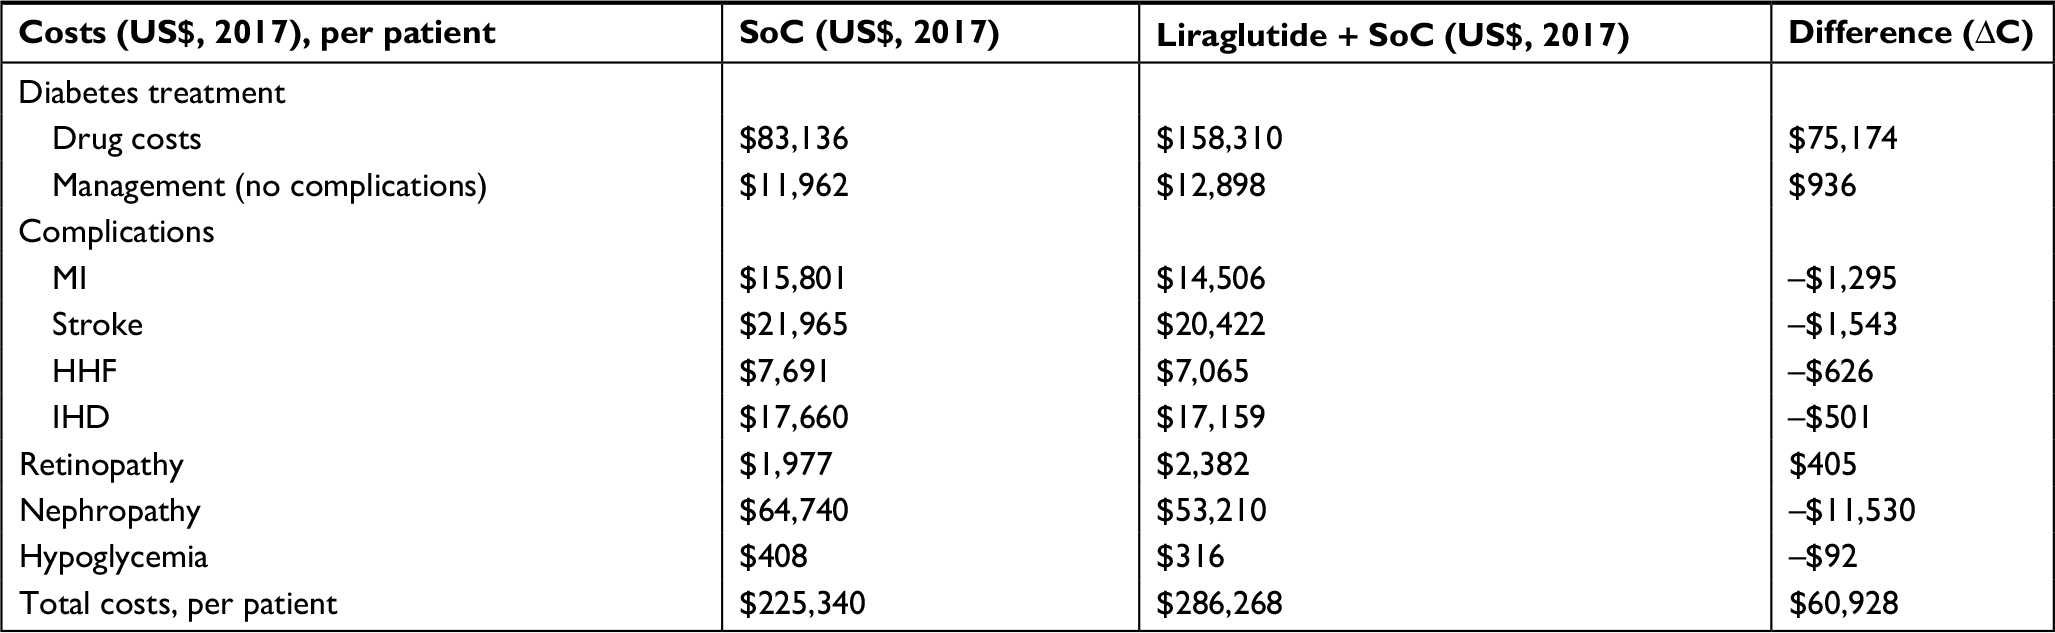 | Table 6 Cost outcomes, base case Abbreviations: HHF, hospitalized for heart failure; IHD, ischemic heart disease; SoC, standard of care; ∆C, incremental cost. |
The “discontinuation” scenario (patients who had not already discontinued liraglutide at 54 months did so at 54 months) was associated with a slightly lower QALY gain for liraglutide + SoC than in the base case, but also with lower incremental costs. Patients on liraglutide were predicted to experience fewer events than with SoC (–2.3%), with predicted per-patient event-related cost-savings of $5,765. Patients also gained additional LYs (0.15) and additional QALYs (0.14). Total incremental costs were $18,194 higher for liraglutide + SoC compared to SoC alone. The ICER per QALY gained was $134,570, thus liraglutide + SoC remained cost-effective under this scenario at a $150,000/QALY willingness-to-pay threshold. All results under the “discontinuation” scenario are shown in Tables S3 and S4.
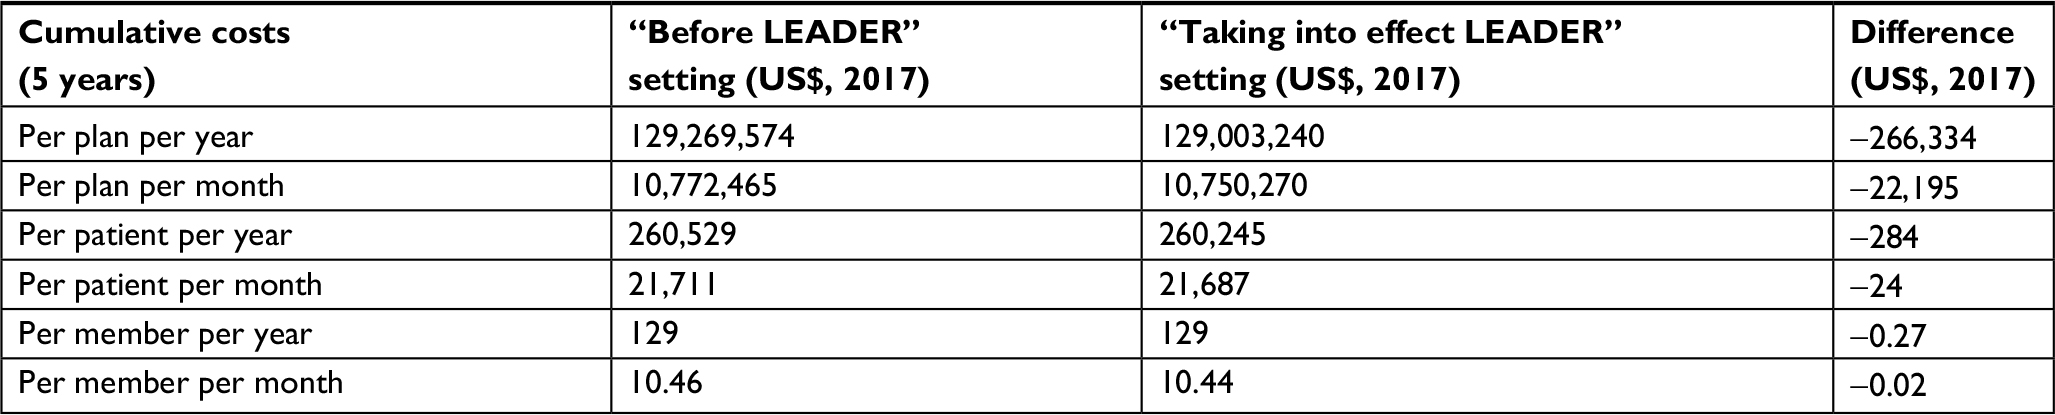
In the BIM, the cumulative number of patients in this target population that received GLP-1 RAs was 1,130 in year 1, 1,287 in year 2, 1,518 in year 3, 1,762 in year 4, and 1,937 in year 5, per million members. The results for the BIM show an almost neutral budget impact in the base case with all market substitution for additional liraglutide uptake coming from dulaglutide. The cumulative cost results over the 5-year time horizon are presented in Table S5. The total per plan per year (PPPY) and per member per month (PMPM) costs in the “Before LEADER” setting was $129,269,574 and $10.46, respectively. In the “Taking into effect LEADER” setting, total PPPY and PMPM costs were estimated to be $129,003,240 and $10.44, respectively, resulting in PPPY and PMPM cost-savings of $266,334 and $0.02, respectively.
Sensitivity analyses
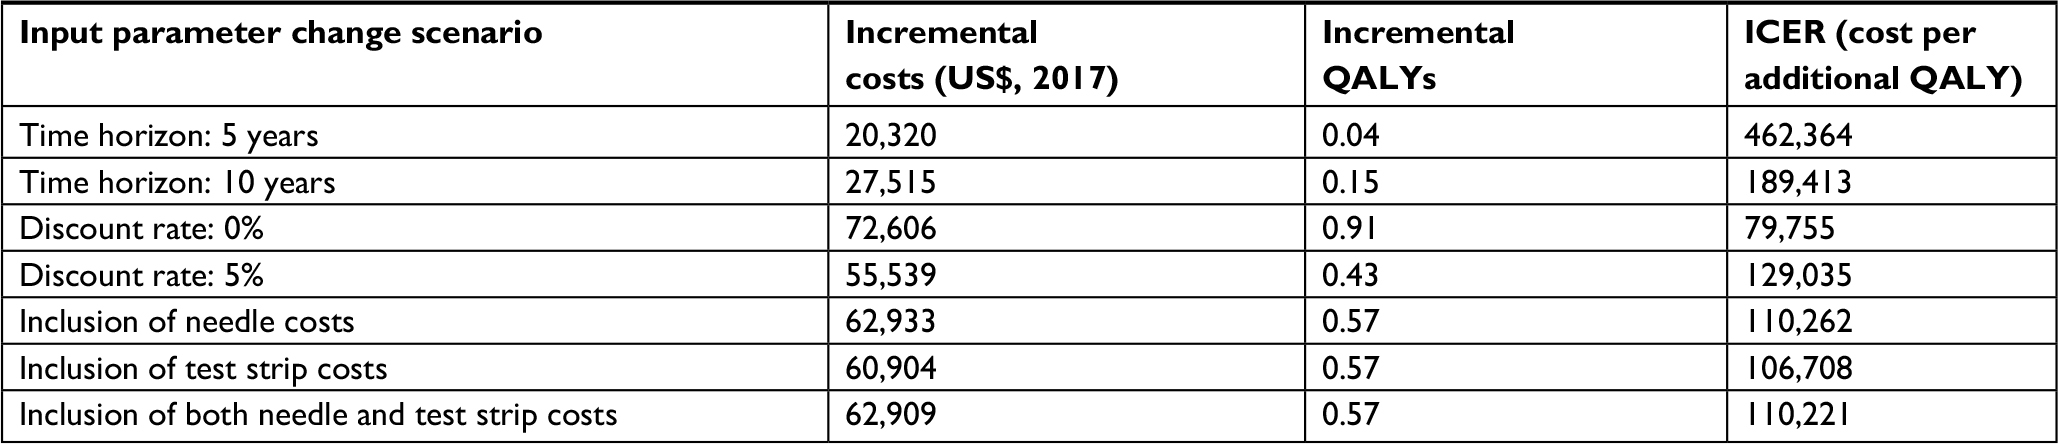
The clinical parameters that had the greatest impact on the ICER in the one-way sensitivity analyses for the CE model were the HR for all-cause mortality, and, to a lesser degree, the HR for nephropathy (Figure 2). The ICER was also sensitive to the time horizon used, with higher ICERs at shorter time horizons of 5 and 10 years (Table S6). The model results were relatively robust in conditions of uncertainty for scenarios (discount rates and test strip/needle costs) and one-way sensitivity analyses (liraglutide daily cost and HRs for treatment effects). The only input parameter where the ICER exceeded the $150,000/QALY threshold value was the HR for all-cause mortality (base case HR 0.85), using the upper CI value of 0.97 in the one-way sensitivity analyses, resulting in an ICER of $277,600 (Figure 2).
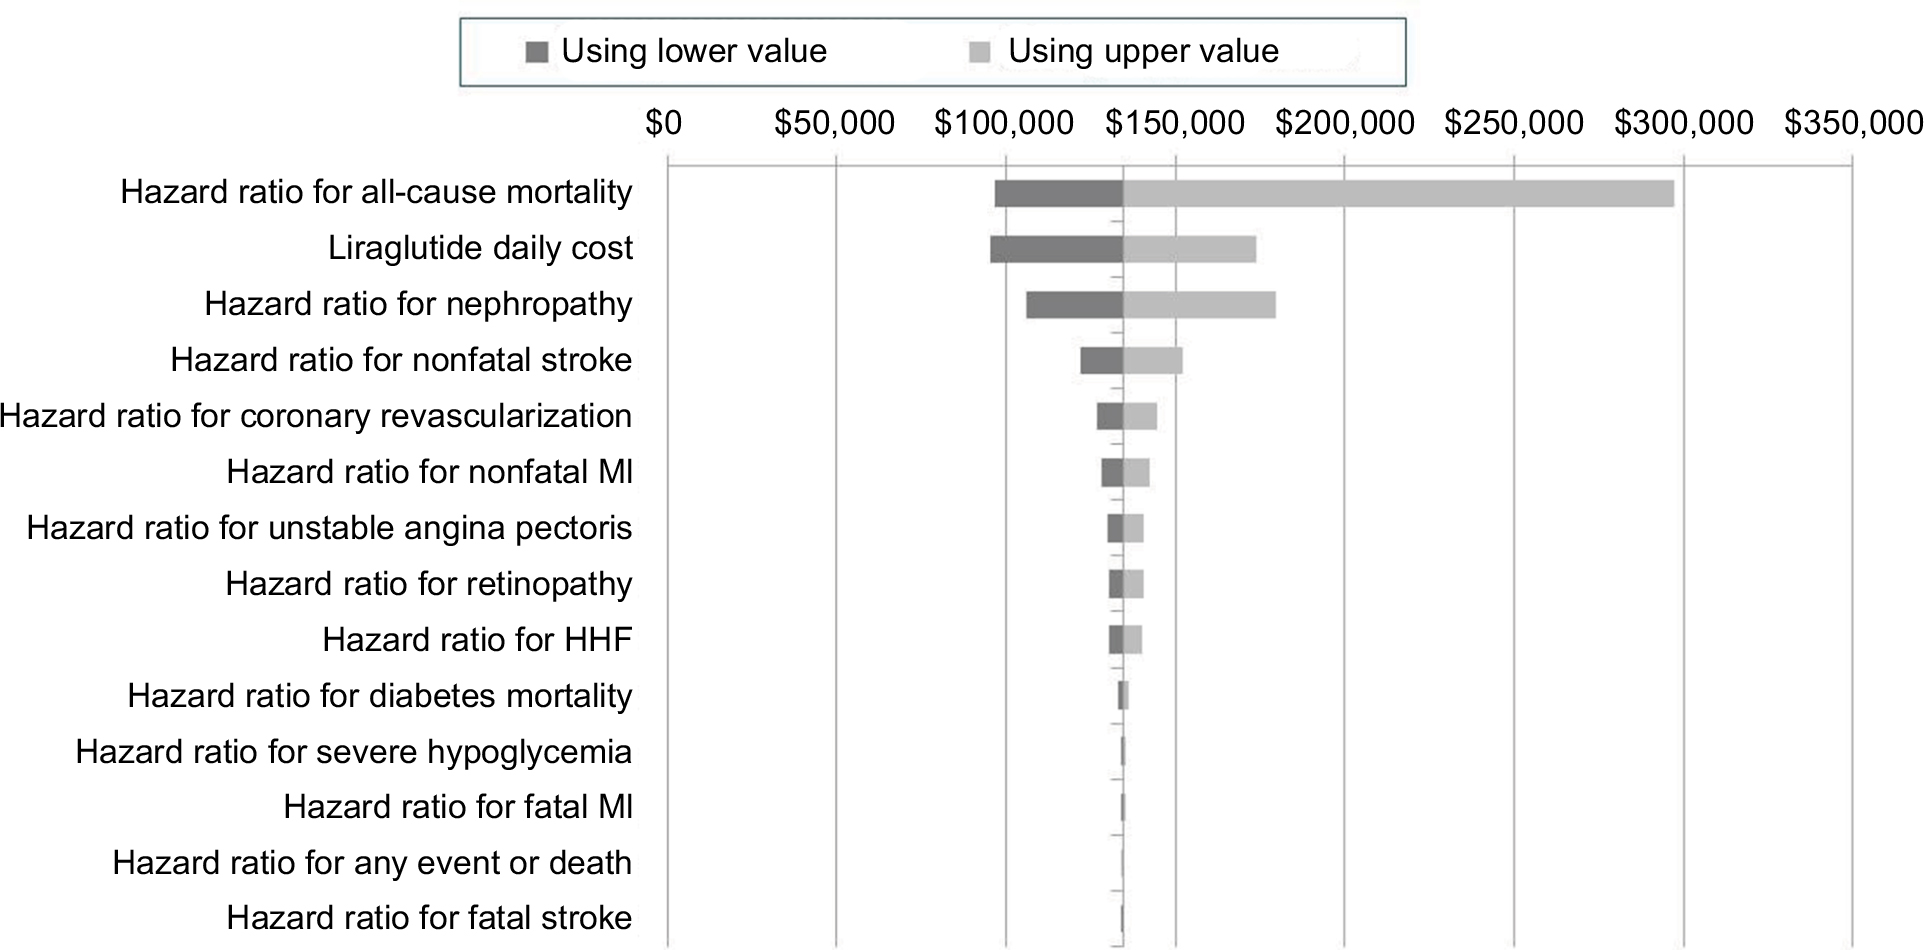 | Figure 2 Tornado diagram of univariate (one-way) sensitivity analyses, base case. Notes: Horizontal bars represent the variation in the incremental cost-effectiveness ratio (ICER) value between two plausible lower and upper values for that parameter centered on the base case ICER value. All costs are presented in US$, 2017. Abbreviations: HHF, hospitalized for heart failure; MI, myocardial infarction. |
The probabilistic sensitivity analysis scatter plots are shown in Figure 3. Liraglutide was more costly but showed greater QALY gains in all the simulations on the CE plane. Across the 3,000 iterations of the PSA, the 95% of the simulations had the ICER in the range between $65,244 and $211,286. At a willingness-to-pay threshold of $150,000/QALY, the probability of liraglutide being cost-effective was 83%, as shown in the net benefit acceptability curve in Figure 4.
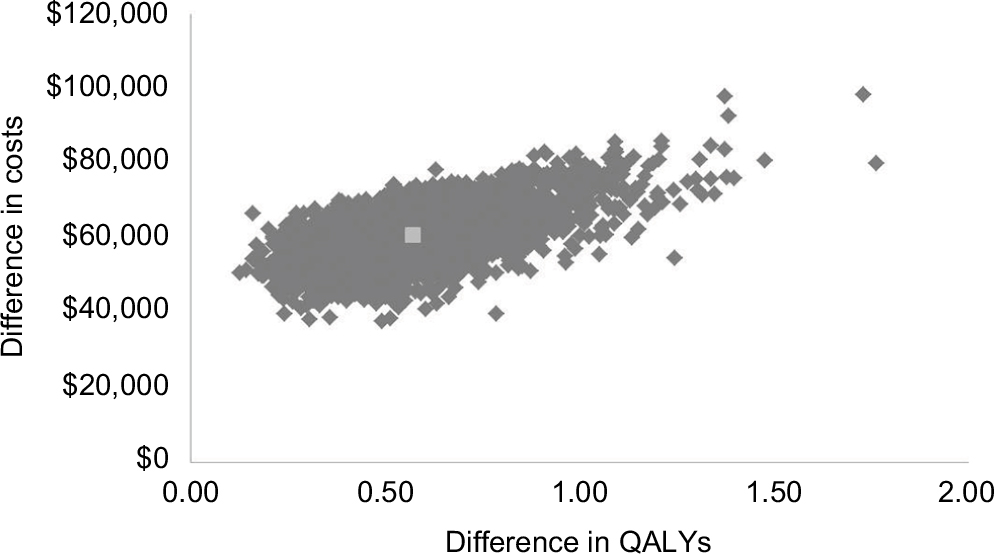 | Figure 3 Probabilistic sensitivity analysis, base case. Notes: This graph represents the incremental cost and corresponding incremental effect for each iteration of the probabilistic sensitivity analysis. The dark central dot represents the base case analysis ICER. All iterations fell within the north-east quadrant of the cost-effectiveness plane (ie, liraglutide was more costly and more effective than liraglutide+ standard of care). All costs are presented in US$, 2017. Abbreviations: ICER, incremental cost-effectiveness ratio; QALY, quality-adjusted life year. |
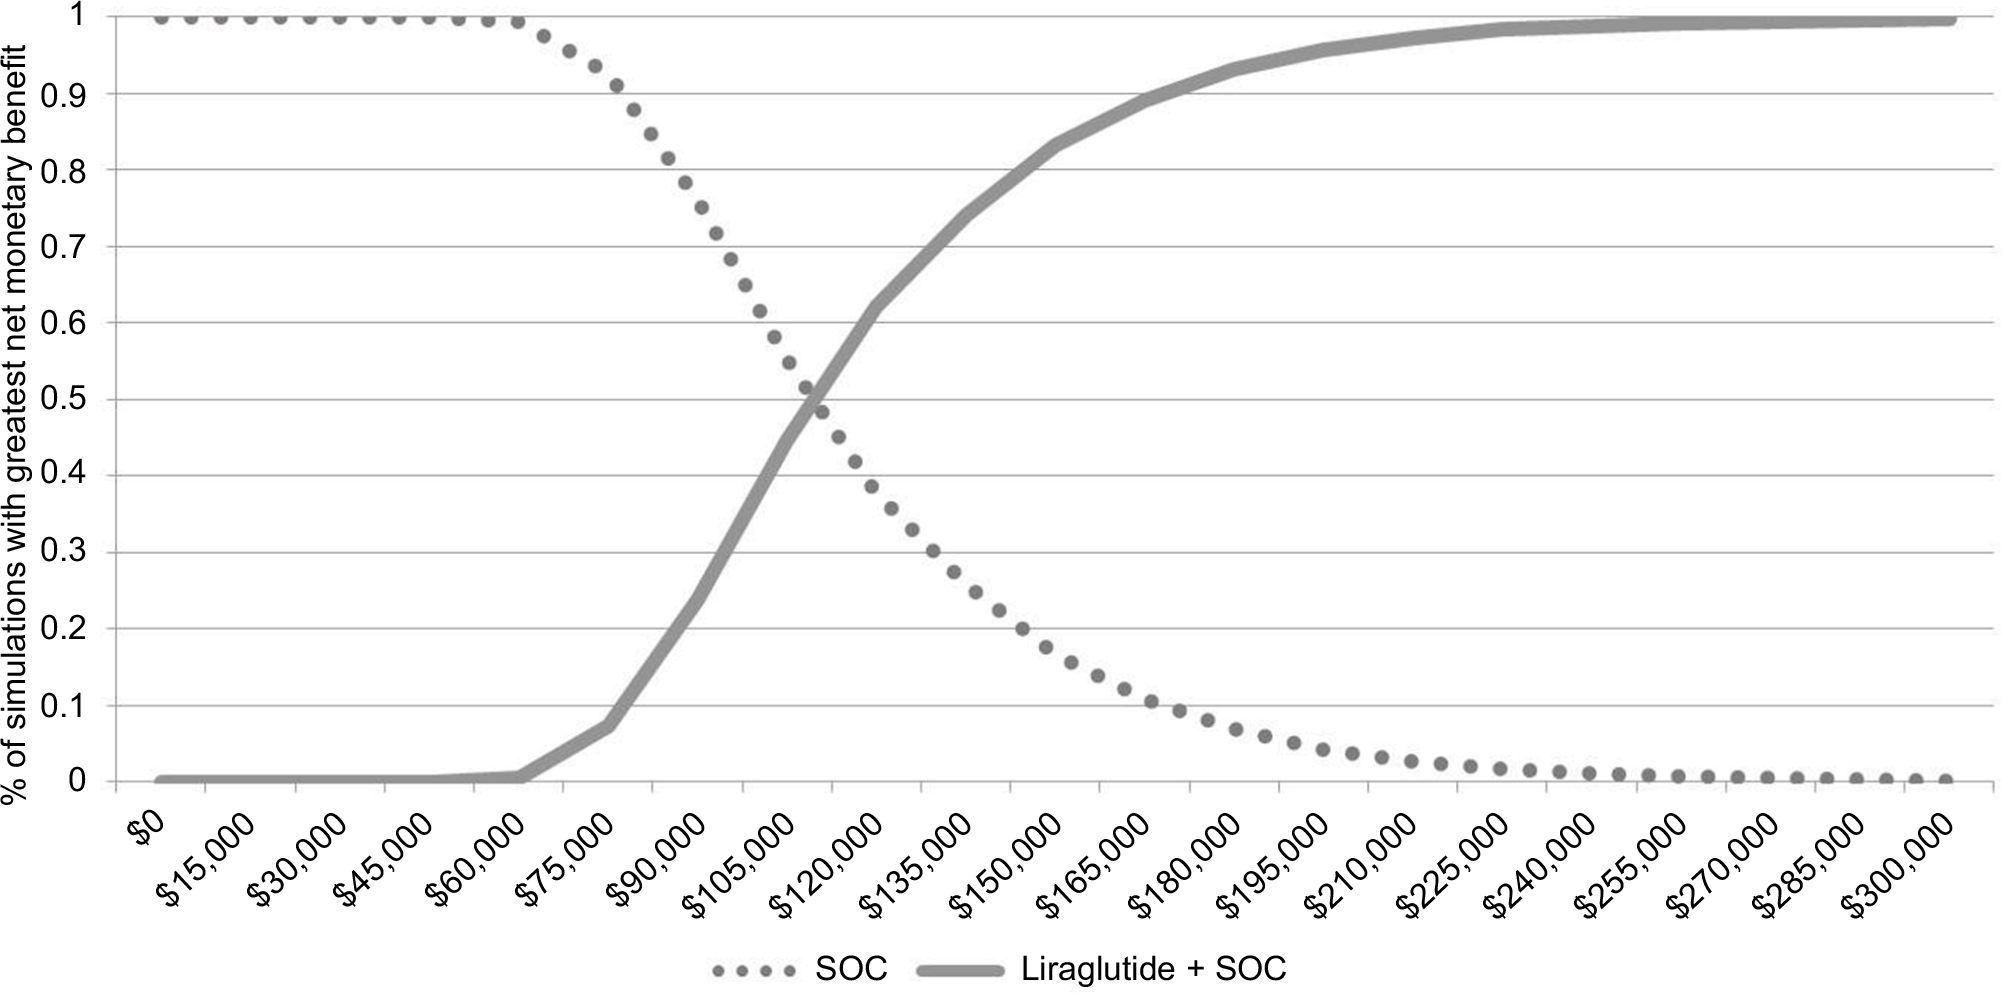 | Figure 4 Net-benefit acceptability curve, base case. Notes: The net benefit acceptability curve displays the probability that liraglutide was cost-effective compared to SoC at different specified willingness-to-pay thresholds ranging from $0 to $300,000 per QALY gained. All costs are presented in US$, 2017. Abbreviations: QALY, quality-adjusted life year; SoC, standard of care. |
Discussion
From a US-managed care perspective, liraglutide can be considered a cost-effective therapy when added to SoC in the management of T2D in patients with established CVD or elevated CV risk. The analysis suggested that using liraglutide in this population results in longer survival (LYs), lower rates of events, and a gain in QALYs. Additional drug acquisition costs from liraglutide are partially offset by a reduction in the costs associated with CV events: over a time horizon of 30 years, these costs were reduced by $15,182 per patient in the base case. The model yielded an ICER of $106,749/QALY gained in the base case, or $134,570/QALY gained under the “discontinuation” scenario. The probability that liraglutide was cost-effective at a willingness-to-pay threshold of $150,000/QALY (the threshold set out by the Institute for Clinical and Economic Review37 and accepted in the US) was 83% in the base case. One-way sensitivity analysis showed that the model was sensitive to estimates of all-cause mortality and nephropathy and to shorter time horizons, but reasonably robust to other variations. Our modeling showed that the budget impact of liraglutide to a US health care plan in the established CVD or elevated CV risk T2D population would be slightly cost-saving or budget neutral over a cumulative 5-year period.
A limitation was that no data were available on treatment patterns with liraglutide in this population beyond the duration of the LEADER trial, hence exploring the two possible extremes regarding discontinuation rates with liraglutide over the long term was deemed appropriate. The true ICER based on our model projections, corresponding to clinical practice in the US, is likely to fall somewhere between these two values. In order to reduce uncertainty around the ICER, research is needed to collect real-world data on treatment patterns with liraglutide in patients with T2D and established CVD or elevated CV risk. Lastly, this analysis is based on an international trial and was thus not based on a North American only cohort (30% of LEADER population in US and Canada) and standard of care may have differed across locations.38 However, SoC could not have differed significantly by country, given the pre-specified definition and guidelines regarding standard of care endorsed by the LEADER steering committee.38
Patients who received liraglutide in LEADER experienced significantly greater weight loss during the trial than those on SoC: weight loss was 2.3 kg (95% CI, 2.5–2.0) greater in the liraglutide group.6 This might be expected to lead to additional cost-savings with liraglutide in relation to weight-related complications. The effects of weight loss were not included in the CE estimates due to lack of data on maintenance of weight loss after the trial duration. Thus, the incremental impact of CV events in patients with T2D and established CVD or elevated CV risk may have been underestimated.
Strength of this analysis was that it captured actual diabetes-related events over an extended period (4.5 years) in patients treated with and without liraglutide from the trial, instead of modeling these events on a surrogate outcome. Many CEA based on outcomes in T2D do not have long-term trial data available and have instead had to rely on HbA1c as a surrogate for event rates for the evaluations.39–42 This is problematic in relation to macrovascular events, where the association between HbA1c and risk is not straightforward and not concretely established.6–15
Our analysis focused on the reduction in CV events associated with liraglutide. Liraglutide has also shown economic benefits in the US setting, compared with a number of different antidiabetic agents, in analyses that examined outcomes in broader T2D populations and without specific provision for CV events.43–48
Conclusion
Liraglutide is a cost-effective therapy and budget neutral treatment option for managing type 2 diabetes patients with established CVD or elevated CV risk, in the setting of the US-managed care system.
Acknowledgment
Editorial assistance was provided by Jo Whelan of Textpharm Ltd, funded by ICON.
Author contributions
JP, DS, and NAR are responsible for the study concept and design, modeling, revising, and approving the manuscript. NNI, CG, and TD-T are responsible for study concept and design, data interpretation, and revising and approving the manuscript. All authors contributed to data analysis, drafting and revising the article, gave final approval of the version to be published, and agree to be accountable for all aspects of the work.
Disclosure
Dhvani Shah, Nancy A Risebrough, and Johnna Perdrizet were paid consultants to Novo Nordisk Inc. Neeraj N Iyer, Cory Gamble and Tam Dang-Tan are employees of Novo Nordisk Inc. The authors report no other conflicts of interest in this work.
References
Centers for Disease Control and Prevention (CDC). National Diabetes Statistics Report, 2017. Atlanta, GA: Centers for Disease Control and Prevention, US Department of Health and Human Services; 2017. | ||
American Diabetes Association. Economic Costs of Diabetes in the U.S. in 2017. Diabetes Care. 2018;36(4):1033–1046. | ||
Muka T, Imo D, Jaspers L, et al. The global impact of non-communicable diseases on healthcare spending and national income: a systematic review. Eur J Epidemiol. 2015;30(4):251–277. | ||
World Heart Federation. Cardiovascular Disease Risk Factors in Diabetes; 2015. Available from: http://www.world-heart-federation.org/cardiovascular-health/cardiovascular-disease-risk-factors/diabetes/. Accessed September 17, 2017. | ||
Briggs AH, Bhatt DL, Scirica BM, et al. Health-related quality-of-life implications of cardiovascular events in individuals with type 2 diabetes mellitus: A subanalysis from the Saxagliptin Assessment of Vascular Outcomes Recorded in Patients with Diabetes Mellitus (SAVOR)-TIMI 53 trial. Diabetes Res Clin Pract. 2017;130:24–33. | ||
Marso SP; LEADER Steering Committee LEADER Trial Investigators. Liraglutide and Cardiovascular Outcomes in Type 2 Diabetes. N Engl J Med. 2016;375(4):311–322. | ||
Kelly TN, Bazzano LA, Fonseca VA, Thethi TK, Reynolds K, He J. Systematic review: glucose control and cardiovascular disease in type 2 diabetes. Ann Intern Med. 2009;151(6):394–403. | ||
Zhang CY, Sun AJ, Zhang SN, et al. Effects of intensive glucose control on incidence of cardiovascular events in patients with type 2 diabetes: a meta-analysis. Ann Med. 2010;42(4):305–315. | ||
Seidu S, Achana FA, Gray LJ, Davies MJ, Khunti K. Effects of glucose-lowering and multifactorial interventions on cardiovascular and mortality outcomes: a meta-analysis of randomized control trials. Diabet Med. 2016;33(3):280–289. | ||
Dormandy JA, Charbonnel B, Eckland DJA, et al; PROactive Investigators. Secondary prevention of macrovascular events in patients with type 2 diabetes in the PROactive Study (PROspective pioglitAzone Clinical Trial In macroVascular Events): a randomised controlled trial. Lancet. 2005;366(9493):1279–1289. | ||
The ORIGIN Trial Investigators. Basal Insulin and Cardiovascular and Other Outcomes in Dysglycemia. N Engl J Med. 2012;367(4):319–328. | ||
Green JB, Bethel MA, Armstrong PW, et al; TECOS Study Group. Effect of Sitagliptin on Cardiovascular Outcomes in Type 2 Diabetes. N Engl J Med. 2015;373(3):232–242. | ||
Home PD, Pocock SJ, Beck-Nielsen H, et al; RECORD Study Team. Rosiglitazone evaluated for cardiovascular outcomes in oral agent combination therapy for type 2 diabetes (RECORD): a multicentre, randomised, open-label trial. Lancet. 2009;373(9681):2125–2135. | ||
Scirica BM, Bhatt DL, Braunwald E, et al; SAVOR-TIMI 53 Steering Committee and Investigators. Saxagliptin and cardiovascular outcomes in patients with type 2 diabetes mellitus. N Engl J Med. 2013;369(14):1317–1326. | ||
White WB, Cannon CP, Heller SR, et al; EXAMINE Investigators. Alogliptin after acute coronary syndrome in patients with type 2 diabetes. N Engl J Med. 2013;369(14):1327–1335. | ||
Novo Nordisk Inc. Victoza (liraglutide) injection, solution for subcutaneous use. Prescribing Information; 2016. Available from: https://www.accessdata.fda.gov/drugsatfda_docs/label/2017/022341s027lbl.pdf. Accessed August 12, 2017. | ||
Marso SP, Poulter NR, Nissen SE, et al. Design of the liraglutide effect and action in diabetes: evaluation of cardiovascular outcome results (LEADER) trial. Am Heart J. 2013;166(5):823–830. | ||
Marso SP, Daniels GH, Brown-Frandsen K, et al. Liraglutide and Cardiovascular Outcomes in Type 2 Diabetes: Supplementary Appendix. N Engl J Med. 2016;375(4). | ||
Academy of Managed Care Pharmacy. The AMCP Format for Formulary Submissions, April 2016, Version 4.0. Alexandria, VA, USA: Academy of Managed Care Pharmacy; 2016. | ||
White WB, Kupfer S, Zannad F, et al; EXAMINE Investigators. Cardiovascular Mortality in Patients With Type 2 Diabetes and Recent Acute Coronary Syndromes From the EXAMINE Trial. Diabetes Care. 2016;39(7):1267–1273. | ||
Cusick M, Meleth AD, Agron E, et al; Early Treatment Diabetic Retinopathy Study Research Group. Associations of mortality and diabetes complications in patients with type 1 and type 2 diabetes: early treatment diabetic retinopathy study report no. 27. Diabetes Care. 2005;28(3):617–625. | ||
Adler AI, Stevens RJ, Manley SE, Bilous RW, Cull CA, Holman RR; UKPDS GROUP. Development and progression of nephropathy in type 2 diabetes: the United Kingdom Prospective Diabetes Study (UKPDS 64). Kidney Int. 2003;63(1):225–232. | ||
Arias E, Heron M, Xu J. United States Life Tables, 2013. Atlanta, GA. Centers for Disease Control and Prevention, National Center for Health Statistics, National Vital Statistics System. 2017:1551–8922. | ||
Stokes A, Preston SH. Deaths Attributable to Diabetes in the United States: Comparison of Data Sources and Estimation Approaches. PLoS One. 2017;12(1):e0170219. | ||
Medi-Span Price Rx. Available from: https://pricerx.medispan.com. Accessed March 15, 2018. | ||
Ward A, Alvarez P, Vo L, Martin S. Direct medical costs of complications of diabetes in the United States: estimates for event-year and annual state costs (USD 2012). J Med Econ. 2014;17(3):176–183. | ||
Raju A, Shetty S, Cai B, D’Souza AO. Hypoglycemia Incidence Rates and Associated Health Care Costs in Patients with Type 2 Diabetes Mellitus Treated with Second-Line Linagliptin or Sulfonylurea After Metformin Monotherapy. J Manag Care Spec Pharm. 2016;22(5):483–492. | ||
Zhuo X, Zhang P, Hoerger TJ. Lifetime direct medical costs of treating type 2 diabetes and diabetic complications. Am J Prev Med. 2013;45(3):253–261. | ||
US Bureau of Labor Statistics. Inflation and Prices – Consumer Price Index. 2017. Available from: https://www.bls.gov/data/#prices. Accessed March 15, 2018. | ||
Canadian Agency for Drugs and Technologies in Health (CADTH). Second-line therapy for patients with diabetes inadequately controlled on metformin: A systematic review and cost-effectiveness analysis. Ottawa, Canada: Canadian Agency for Drugs and Technologies in Health; 2010. Available from: https://www.cadth.ca/media/pdf/C1110_SR_Report_final_e.pdf. Accessed September 12, 2018. | ||
Harris S, Mamdani M, Galbo-Jørgensen CB, Bøgelund M, Gundgaard J, Groleau D. The effect of hypoglycemia on health-related quality of life: Canadian results from a multinational time trade-off survey. Can J Diabetes. 2014;38(1):45–52. | ||
Sullivan PW, Ghushchyan V. Preference-Based EQ-5D index scores for chronic conditions in the United States. Med Decis Making. 2006;26(4):410–420. | ||
Sullivan PW, Lawrence WF, Ghushchyan V. A national catalog of preference-based scores for chronic conditions in the United States. Med Care. 2005;43(7):736–749. | ||
Centers for Disease Control and Prevention (CDC) and the National Center for Chronic Disease Prevention and Health Promotion. Estimates of Diabetes and Its Burden in the United States. Atlanta, GA: Centers for Disease Control and Prevention, US Department of Health and Human Services; 2014. | ||
Centers for Disease Control and Prevention (CDC). Age-Adjusted Percentage of People with Diabetes Aged 35 Years or Older Reporting Heart Disease or Stroke, by Sex, United States, 1997–2011. Atlanta, GA: Centers for Disease Control and Prevention, US Department of Health and Human Services; 2013. | ||
Novo Nordisk. Data on File: market share projections. | ||
Institute for Clinical and Economic Review. Final Value Assessment Framework for 2017–2019. Boston, MA, USA: Institute for Clinical and Economic Review; 2017. Available from: https://icer-review.org/material/final-vaf-2017-2019/. Accessed March 15, 2018. | ||
Marso SP, Poulter NR, Nissen SE, et al. Design of the liraglutide effect and action in diabetes: evaluation of cardiovascular outcome results (LEADER) trial. Am Heart J. 2013;166(5):823–830. | ||
Schwarz B, Gouveia M, Chen J, et al. Cost-effectiveness of sitagliptin-based treatment regimens in European patients with type 2 diabetes and haemoglobin A1c above target on metformin monotherapy. Diabetes Obes Metab. 2008;10(Suppl 1):43–55. | ||
Charokopou M, Mcewan P, Lister S, et al. The cost-effectiveness of dapagliflozin versus sulfonylurea as an add-on to metformin in the treatment of Type 2 diabetes mellitus. Diabet Med. 2015;32(7):890–898. | ||
Klarenbach S, Cameron C, Singh S, Ur E. Cost-effectiveness of second-line antihyperglycemic therapy in patients with type 2 diabetes mellitus inadequately controlled on metformin. CMAJ. 2011;183(16): E1213–E1220. | ||
Dziuba J, Alperin P, Racketa J, et al. Modeling effects of SGLT-2 inhibitor dapagliflozin treatment versus standard diabetes therapy on cardiovascular and microvascular outcomes. Diabetes Obes Metab. 2014;16(7):628–635. | ||
Lee WC, Conner C, Hammer M. Results of a model analysis of the cost-effectiveness of liraglutide versus exenatide added to metformin, glimepiride, or both for the treatment of type 2 diabetes in the United States. Clin Ther. 2010;32(10):1756–1767. | ||
Lee WC, Conner C, Hammer M. Cost-effectiveness of liraglutide versus rosiglitazone, both in combination with glimepiride in treatment of type 2 diabetes in the US. Curr Med Res Opin. 2011;27(5):897–906. | ||
Lee WC, Samyshkin Y, Langer J, Palmer JL. Long-term clinical and economic outcomes associated with liraglutide versus sitagliptin therapy when added to metformin in the treatment of type 2 diabetes: a CORE Diabetes Model analysis. J Med Econ. 2012;15(Suppl 2):28–37. | ||
Dekoven M, Lee WC, Bouchard J, Massoudi M, Langer J. Real-world cost-effectiveness: lower cost of treating patients to glycemic goal with liraglutide versus exenatide. Adv Ther. 2014;31(2):202–216. | ||
Hunt B, Mcconnachie CC, Gamble C, Dang-Tan T. Evaluating the short-term cost-effectiveness of liraglutide versus lixisenatide in patients with type 2 diabetes in the United States. J Med Econ. 2017;20(11):1117–1120. | ||
Langer J, Hunt B, Valentine WJ. Evaluating the short-term cost-effectiveness of liraglutide versus sitagliptin in patients with type 2 diabetes failing metformin monotherapy in the United States. J Manag Care Pharm. 2013;19(3):237–246. |
Supplementary materials
Supplementary details of model inputs
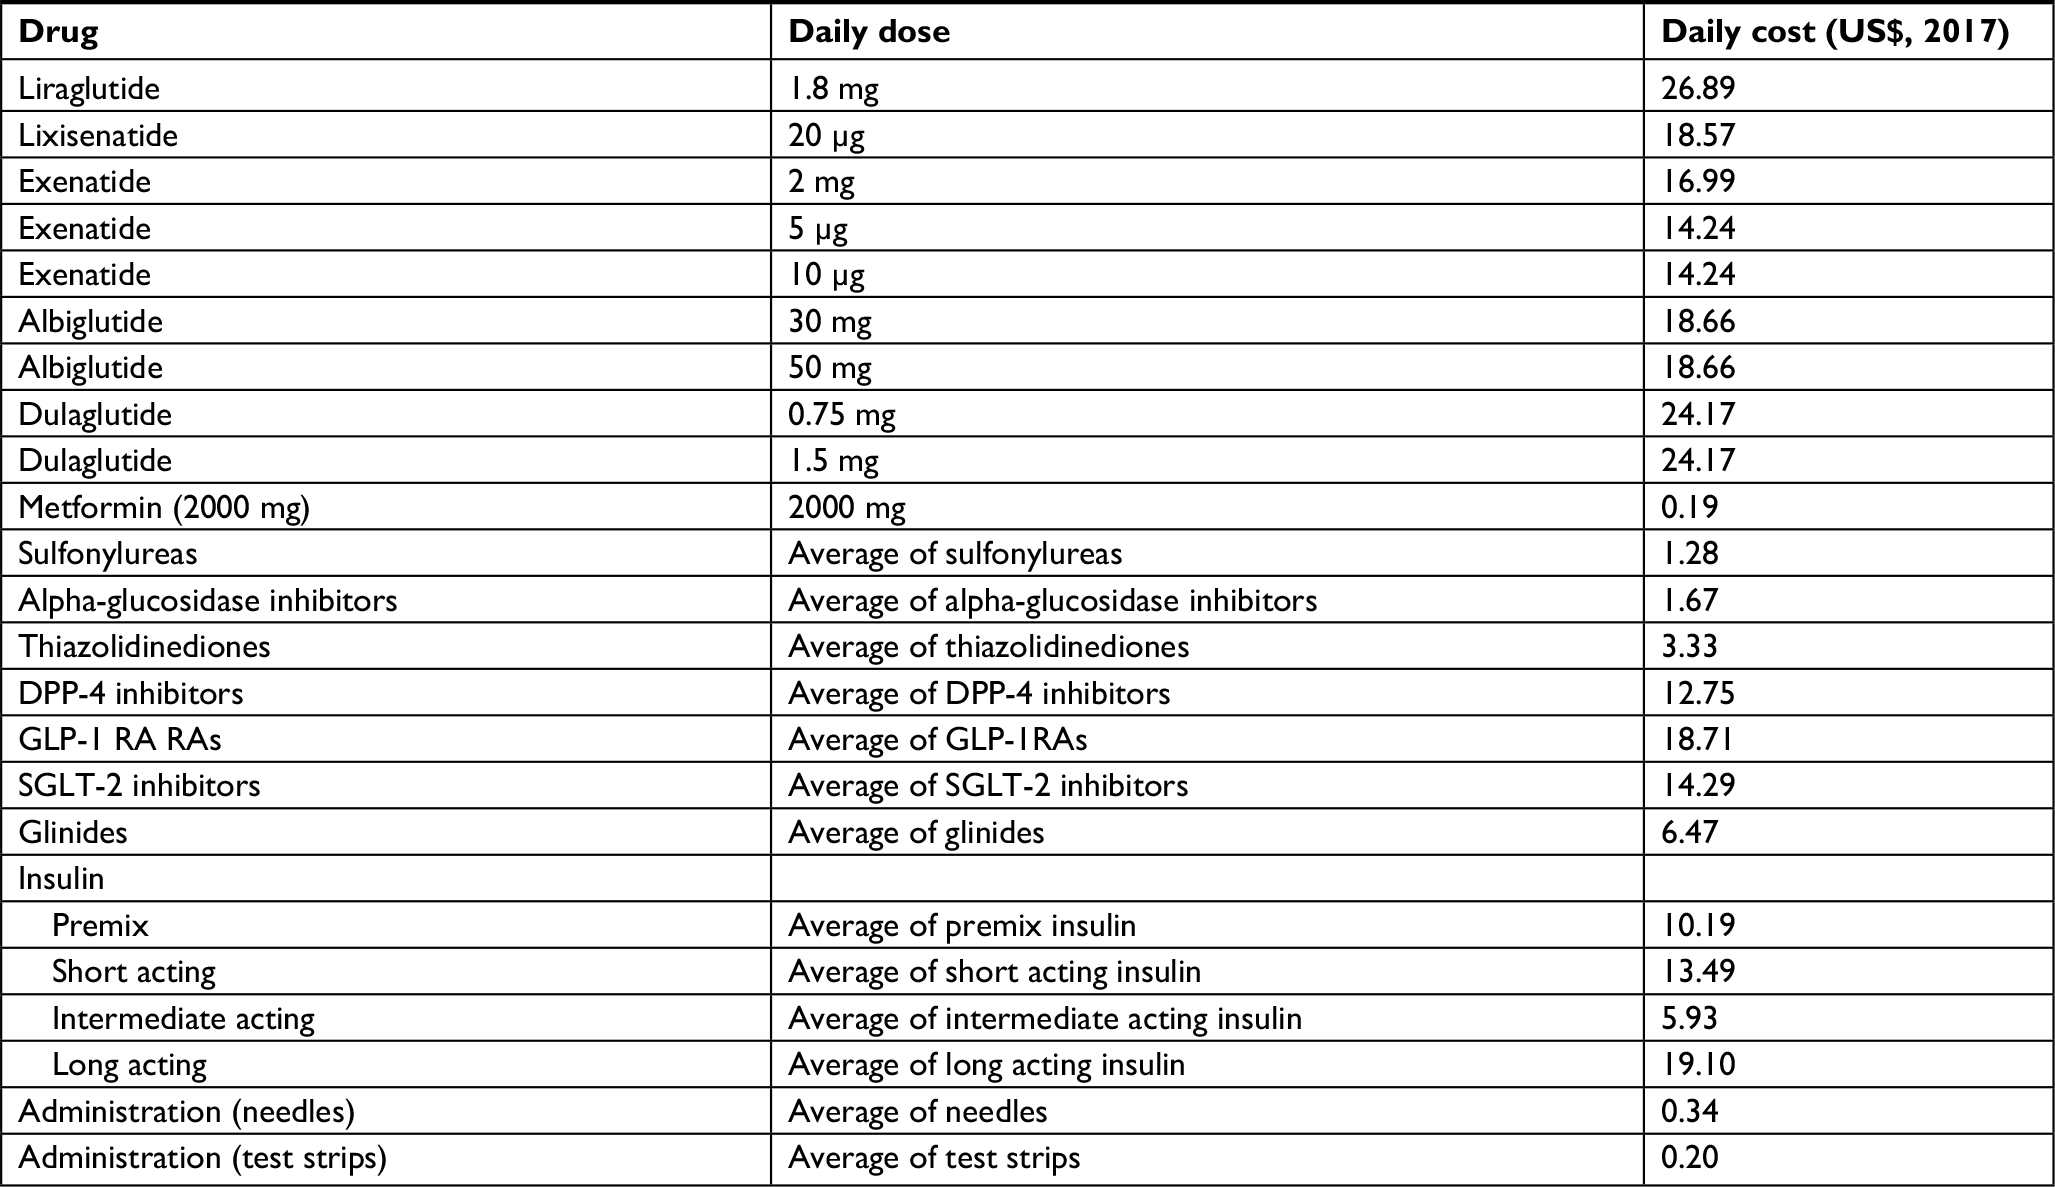 | Table S1 Total daily costs for treatment regimens Note: Medi-Span Price Rx.1 Abbreviations: DPP-4, dipeptidyl peptidase-4; GLP-1 RAs, glucagon-like peptide-1 receptor agonists; SGLT-2, sodium glucose co-transporter 2. |
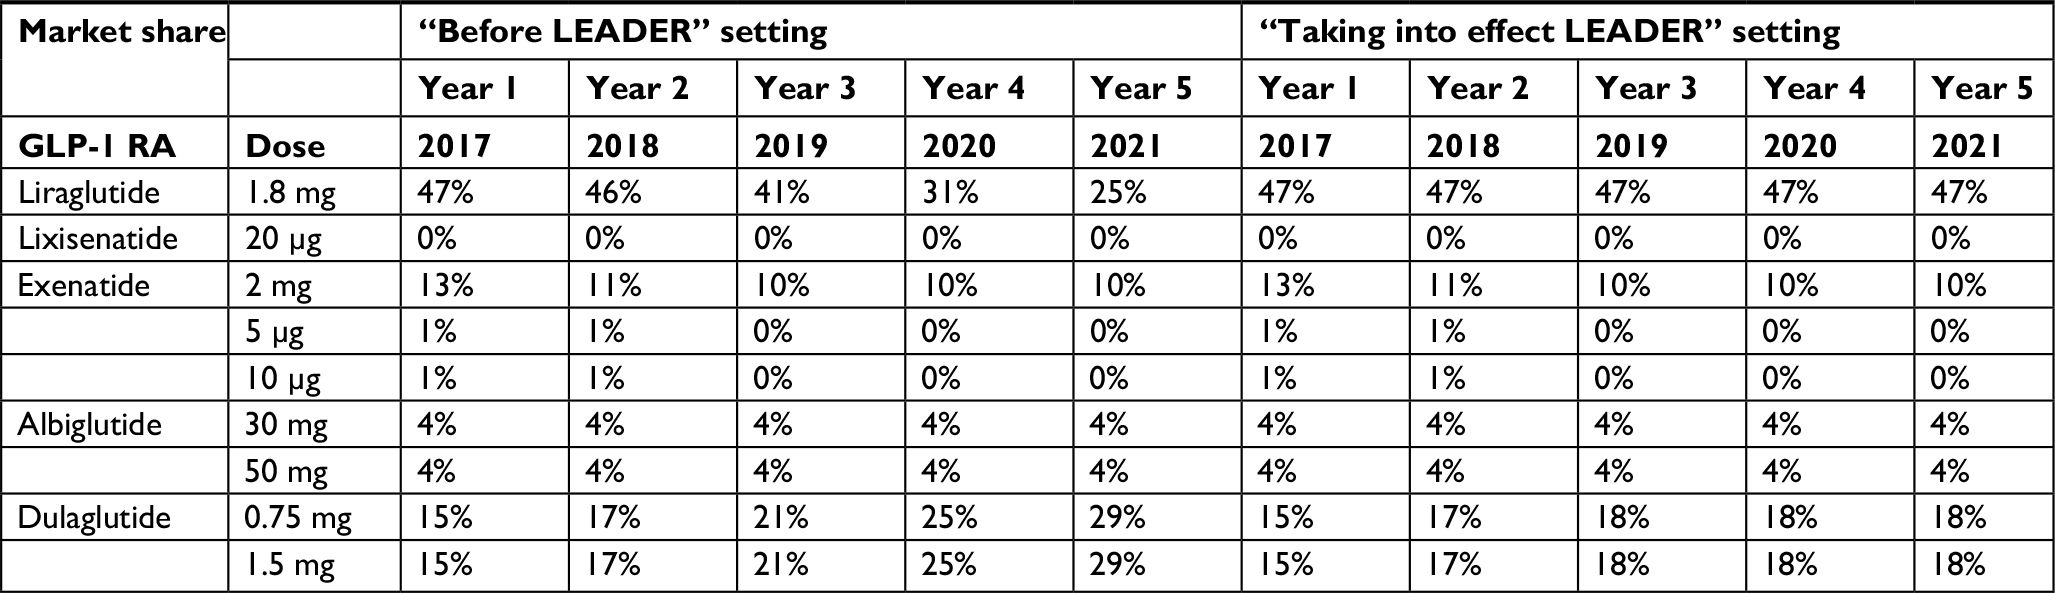 | Table S2 Market share and drug cost data inputs for budget impact analysis Note: Novo Nordisk, data on file.2 |
Supplementary results
Results for the “discontinuation” scenario
 | Table S3 Clinical outcomes, base case, “discontinuation” scenario (all patients discontinue liraglutide after 54 months) Abbreviations: ∆E, incremental effectiveness; CV, cardiovascular; HHF, hospitalized for heart failure; IHD, ischemic heart disease; MI, myocardial infarction; SoC, standard of care; QALY, quality-adjusted life year. |
 | Table S4 Cost outcomes, base case, “discontinuation” scenario (all patients discontinue liraglutide after 54 months) Abbreviations: ∆C, incremental cost; HHF, hospitalized for heart failure; IHD, ischemic heart disease; MI, myocardial infarction; SoC, standard of care. |
Budget Impact analysis results
 | Table S5 Budget impact results |
Sensitivity analyses, base case scenario
 | Table S6 Additional one-way sensitivity analyses, base case scenario Abbreviations: ICER, incremental cost-effectiveness ratio; QALY, quality-adjusted life year. |
References
Medi-Span Price Rx. Available from: https://pricerx.medispan.com. Accessed March 15, 2018. | ||
Novo Nordisk. Data on File: market share projections. |
 © 2018 The Author(s). This work is published and licensed by Dove Medical Press Limited. The full terms of this license are available at https://www.dovepress.com/terms.php and incorporate the Creative Commons Attribution - Non Commercial (unported, v3.0) License.
By accessing the work you hereby accept the Terms. Non-commercial uses of the work are permitted without any further permission from Dove Medical Press Limited, provided the work is properly attributed. For permission for commercial use of this work, please see paragraphs 4.2 and 5 of our Terms.
© 2018 The Author(s). This work is published and licensed by Dove Medical Press Limited. The full terms of this license are available at https://www.dovepress.com/terms.php and incorporate the Creative Commons Attribution - Non Commercial (unported, v3.0) License.
By accessing the work you hereby accept the Terms. Non-commercial uses of the work are permitted without any further permission from Dove Medical Press Limited, provided the work is properly attributed. For permission for commercial use of this work, please see paragraphs 4.2 and 5 of our Terms.