")
Back to Journals » ClinicoEconomics and Outcomes Research » Volume 7
Cost-effectiveness analysis of pregabalin for treatment of chronic low back pain in patients with accompanying lower limb pain (neuropathic component) in Japan
Authors Igarashi A, Akazawa M , Murata T, Taguchi T, Sadosky A, Ebata N , Willke R, Fujii K, Doherty J, Kobayashi M
Received 4 June 2015
Accepted for publication 17 August 2015
Published 7 October 2015 Volume 2015:7 Pages 505—520
DOI https://doi.org/10.2147/CEOR.S89833
Checked for plagiarism Yes
Review by Single anonymous peer review
Peer reviewer comments 4
Editor who approved publication: Professor Giorgio L Colombo
Ataru Igarashi,1 Manabu Akazawa,2 Tatsunori Murata,3 Toshihiko Taguchi,4 Alesia Sadosky,5 Nozomi Ebata,6 Richard Willke,5 Koichi Fujii,6 Jim Doherty,5 Makoto Kobayashi3
1Department of Drug Policy and Management, Graduate School of Pharmaceutical Sciences, The University of Tokyo, Tokyo, Japan; 2Department of Public Health and Epidemiology, Meiji Pharmaceutical University, Tokyo, Japan; 3CRECON Medical Assessment Inc., Tokyo, Japan; 4Department of Orthopaedic Surgery, Yamaguchi University Graduate School of Medicine, Ube, Yamaguchi, Japan; 5Pfizer Inc., New York, NY, USA; 6Pfizer Japan, Inc., Tokyo, Japan
Objective: To assess the cost-effectiveness of pregabalin for the treatment of chronic low back pain with accompanying neuropathic pain (CLBP-NeP) from the health care payer and societal perspectives.
Methods: The cost-effectiveness of pregabalin versus usual care for treatment of CLBP-NeP was evaluated over a 12-month time horizon using the incremental cost-effectiveness ratio (ICER). Quality-adjusted life years (QALYs), derived from the five-dimension, five-level EuroQol (EQ-5D-5L) questionnaire, was the measure of effectiveness. Medical costs and productivity losses were both calculated. Expected costs and outcomes were estimated via cohort simulation using a state-transition model, which mimics pain state transitions among mild, moderate, and severe pain. Distributions of pain severity were obtained from an 8-week noninterventional study. Health care resource consumption for estimation of direct medical costs for pain severity levels was derived from a physician survey. The ICER per additional QALY gained was calculated and sensitivity analyses were performed to evaluate the robustness of the assumptions across a range of values.
Results: Direct medical costs and hospitalization costs were both lower in the pregabalin arm compared with usual care. The estimated ICERs in the base case scenarios were approximately ¥2,025,000 and ¥1,435,000 per QALY gained with pregabalin from the payer and societal perspectives, respectively; the latter included indirect costs related to lost productivity. Sensitivity analyses using alternate values for postsurgical pain scores (0 and 5), initial pain severity levels (either all moderate or all severe), and the actual EQ-5D-5L scores from the noninterventional study showed robustness of results, with ICERs that were similar to the base case. Development of a cost-effectiveness acceptability curve showed high probability (≥75%) of pregabalin being cost-effective.
Conclusion: Using data and assumptions from routine clinical practice, pregabalin is cost-effective for the treatment of CLBP-NeP in Japan.
Keywords: usual care, neuropathic pain, Markov model, quality-adjusted life-year, willingness to pay, health economics
Introduction
Low back pain (LBP) is a major source of disability, as indicated by its ranking in the Global Burden of Disease Study as one of the top ten causes of disability-adjusted life years.1 Chronic LBP (CLBP), defined as LBP lasting >3 months, often has a neuropathic pain (NeP) component; up to 37% of patients with CLBP have characteristics indicative of NeP.2 While LBP is one of the most costly pain conditions, resulting from high health care resource utilization, disability costs, and reductions in work productivity,3,4 CLBP and its association with NeP increase the economic burden. In a US study, CLBP with accompanying NeP (CLBP-NeP) accounted for 96% of the total direct medical costs associated with CLBP, and the mean annual per-patient cost of CLBP with a NeP component was 160% higher than CLBP without a NeP component.5
Similarly, in Japan, the lower back is the most commonly reported site of chronic and persistent musculoskeletal pain,6,7 with an overall lifetime risk of LBP that has been estimated to be 83%.8 The presence of such pain reduces function and quality of life (QOL),9 and results in increased direct medical costs.10 A burden of illness study in patients with LBP in Japan also showed that pain severity was significantly associated with patient-reported and economic outcomes, with higher health care resource utilization and associated costs at increasing levels of pain severity.11
Although a study of NeP in Japanese patients with chronic pain related to spinal disorders suggested that approximately 30% of patients with CLBP have a NeP component,12 this may represent an underestimate since there were few CLBP patients for adequate estimation of prevalence. Nevertheless, the presence of NeP also increases the challenge of CLBP treatment, since many of the most common pain management strategies such as nonsteroidal anti-inflammatory drugs and simple analgesics are only effective for nociceptive pain, have poor efficacy against NeP, and have the risk of side effects with long-term use.
Pregabalin, which is considered a first-line treatment for several of the most common NeP conditions,13,14 has received Japanese manufacturing and marketing approval to treat peripheral NeP. Pregabalin is a high-affinity ligand of α2-δ subunits of voltage-gated calcium channels in the central nervous system15 that has demonstrated efficacy in Japanese studies for peripheral and central NeP.16–18
A Japanese economic analysis of pregabalin for the treatment of postherpetic neuralgia, diabetic peripheral neuropathy, and both cervical and lumbar radiculopathy suggested that pregabalin was a cost-effective option for peripheral NeP.19 However, that analysis was based on results from clinical trials for new drug approval (postherpetic neuralgia and diabetic peripheral neuropathy) or from a study outside of Japan (radiculopathy). Utilization of real-world prescribing data in Japan, ie, from routine clinical practice, with a specific focus on CLBP-NeP, would enhance generalizability for determining the economic impact of treating one of the most prevalent and costly conditions in Japan. Recent results from a noninterventional study (NIS) in Japan that used patient-reported outcomes to evaluate pregabalin versus other analgesic therapy in usual care for the treatment of CLBP with accompanying lower limb pain (ie, a neuropathic component; CLBP-NeP)20 provided an opportunity to perform a cost-effectiveness analysis to determine the true benefit of pregabalin to patients and the health care system. In that study, pregabalin showed significantly greater improvements in pain-related interference with sleep relative to usual care as well as significant improvements in pain, function, and health status. The purpose of the current study was to perform a cost-effectiveness analysis of pregabalin for the treatment of CLBP-NeP using data specific and relevant to Japanese payers and the health care system.
Methods
Model structure
This analysis used cohort simulation based on a Markov model that was constructed to evaluate the cost-effectiveness of pregabalin for the treatment of CLBP-NeP. Analysis was performed using a 12-month time horizon from both the payer and societal perspectives, with the latter including indirect costs associated with work productivity and activity impairment that were also evaluated as a cost component. The model compared pregabalin versus usual care alone (ie, whatever analgesics would be prescribed based on the clinical decision in routine clinical practice by Japanese physicians) by extrapolating effectiveness data for each arm from an 8-week NIS of pregabalin in the primary care setting.20 In that study, the choice of treatment administered to patients (pregabalin, n=157; usual care, n=174) was based on the clinical decision of the physician, reflecting real-world clinical prescribing practice. Patient-reported outcomes assessments that were included in the NIS and are incorporated into the economic model included a numerical rating scale (NRS) for pain severity and the five-level, five-dimension EuroQol health status measure (EQ-5D-5L).21 Responses on the EQ-5D-5L were converted to one-dimensional QOL scores using the recently developed Japanese value set22 to estimate quality-adjusted life-years (QALYs), which is the unit of incremental cost-effectiveness. The pain NRS is an eleven-point scale ranging from 0= no pain to 10= worst possible pain, and pain severity levels have been defined as no/mild (scores 0–3), moderate (scores 4–6), and severe (scores 7–10).23
Patients from the NIS were excluded from the economic analysis if they discontinued treatment in the pregabalin cohort for reasons other than adverse events; discontinued in the usual care cohort; or did not have data for the primary endpoint (pain-related interference with sleep), EQ-5D-5L, or pain NRS at each evaluated time point. These criteria resulted in exclusion of 28 patients (19 from the pregabalin group and nine from usual care), resulting in 303 patients who had data available for evaluating cost-effectiveness. Of note, there were no statistically significant differences in baseline demographics, pain scores, or EQ-5D-5L utility scores between the 28 discontinued patients and those who completed the study.
The Markov model followed transition states among severity levels of no/mild, moderate, and severe pain. Using the baseline NRS pain scores in the NIS, the initial distribution ratio of moderate (70%) and severe pain (30%) among all subjects at baseline was transitioned at monthly intervals for 3 months with extrapolation to 1 year (Figure 1). All subjects’ distribution at baseline was used rather than by treatment group to avoid bias, given the pregabalin cohort was characterized by greater pain severity at baseline.20
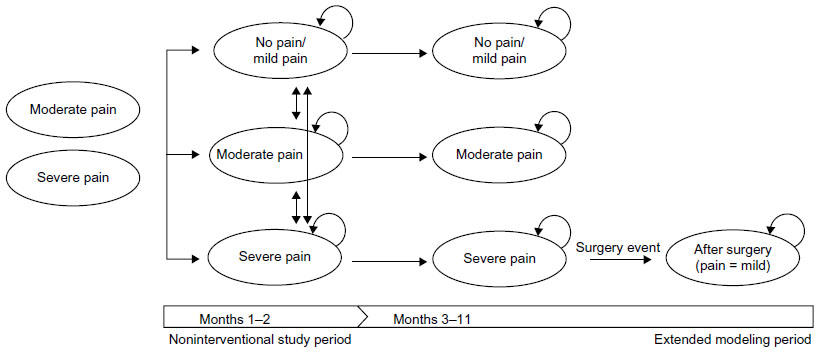 | Figure 1 Cohort simulation using a Markov model. |
The pain level beyond the 8-week NIS was extrapolated to 1 year based on pain scores observed in extension studies of clinical trials of pregabalin for NeP and from de novo long-term, open-label studies in NeP.18,24–26 These studies showed that the improvement in pain scores achieved within 8 weeks of treatment initiation with pregabalin was maintained for up to 52 weeks. The discontinuation rate in the model was taken from the rate in the pregabalin cohort (11.6%) in the NIS. The model adopted a conservative approach, where pain scores at discontinuation were considered equivalent to those at week 0, assuming pregabalin was no longer effective after discontinuation.
Pain transition probabilities for months 1 and 2 in the model utilized pain NRS scores taken directly from the respective pregabalin and usual care arms for weeks 0 to 4 and weeks 4 to 8 in the NIS. The NRS pain category, ie, no/mild, moderate, or severe, attained at the end of month 2 was carried forward for month 3 and for months 4 to 12, except for patients with severe pain who had the potential to undergo surgery. For patients who underwent surgery, the model assumed a postsurgical pain severity score of 2, a pain score confirmed by independent Japanese clinicians.
Physician survey for resource utilization
Resource utilization in the model, and thus cost inputs, were estimated through an internet-based survey (see the Supplementary materials for the survey methodology) that was developed and administered to physicians by Anterio Inc. (Tokyo, Japan). The survey was conducted from December 3–8, 2014 and elicited information on frequency of outpatient visits and tests for CLBP-NeP and medications prescribed for CLBP-NeP patients based on pain severity levels, over a time frame of 3 months (Figure 2). The survey response rate was 20.1%; 205 physicians responded and included orthopedists, general internists, neurological internists, general surgeons, neurosurgeons, and anesthesiologists. Physicians were financially compensated for their participation in the survey.
 | Figure 2 Design of the physician questionnaire for determining resource utilization. |
Physicians provided information in the survey on treatment for CLBP-NeP patients for each of three 1-month treatment periods based on longitudinal pain severity transition patterns assuming either moderate or severe pain as the initial pain category (Figure 2). Approximately 30 physicians completed each longitudinal set of three patterns. The results of the survey are presented in the Supplementary materials.
Events and costs
Direct medical costs were based on resource utilization and medication use reported in the physician survey for the different pain severity levels over the three 1-month treatment periods. Probability estimates of surgery risk were derived from the frequency of surgery observed in the Medical Data Vision Co, Ltd (MDV) (Tokyo, Japan) database (unpublished data, 2015), which provides claims from 140 hospitals using the Diagnosis Procedure Combination (DPC) system for medical service claims. The sample size for surgery risk calculation was 69,325 patients. Using Kaplan–Meier methods, the estimated surgery risk was 2.55% of all LBP patients who matched the NIS population with regard to background patient characteristics and indication for surgery. As supported by expert opinion, surgery was assumed to occur only after the third month of treatment, and only in patients with severe pain. A 15.57% probability of surgery among CLBP-NeP patients with severe pain was calculated from the 16.38% of patients who experienced severe pain at week 8 in the NIS (ie, 2.55/16.38). The MDV claims data were also used for estimation of surgery event costs.
To derive treatment costs from the physician survey, resource utilization was calculated based on pain severity and treatment period (ie, months 1 to 3). For each period and severity level, the costs were calculated using the formula:

The median estimated direct costs other than drug acquisition costs for pregabalin are shown in Table 1 for each of the pain severity levels across the cohort simulation period. Drug acquisition costs of pregabalin, also shown in Table 1, were based on real-world doses observed in the NIS.20 All of the unit costs used in the calculations, including outpatient visits, imaging, and medications, are shown in Table 2.
 | Table 1 Estimated direct costs |
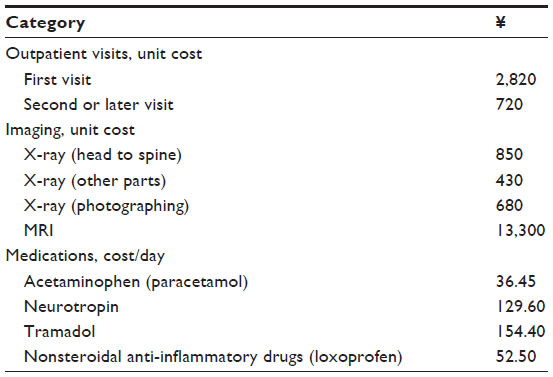 | Table 2 Costs of outpatient visits, imaging, and drugs |
Indirect costs associated with lost productivity at work were calculated using the method of Lofland et al27 based on the Work Productivity and Activity Impairment (WPAI) scale for Special Health Problems (WPAI:SHP) adapted to LBP (WPAI:CLBP-NeP) in the pregabalin NIS.28 The WPAI includes absenteeism and presenteeism, with the “Work productivity” component providing an estimate of the overall work impairment that incorporates both of these types of productivity losses. Lost productivity has been reported to be the main cost driver in patients with chronic pain conditions including CLBP.3,4 Productivity was defined as a percentage from 0% to 100% and mapped to pain scores such that for each point change in pain score, the change in lost productivity could be estimated. Costs were estimated based on mean monthly income in Japan, and total indirect costs per month used in the model for each pain category were ¥34,775 for no/mild pain, ¥35,864 for moderate pain, and ¥56,778 for severe pain.
QALYs
For calculation of the cost-effectiveness, estimates of QOL scores for determination of QALYs were based on regression equations with the pain NRS scores, age, and sex as independent variables. These values, estimated individually for males and females, were then weighted and averaged by sex ratio and average age to derive weighted averages for each NRS score. The final QOL scores for use in the model were averages of the scores for the level of pain severity: 0.867 for no/mild pain, 0.739 for moderate pain, and 0.611 for severe pain.
Cost-effectiveness
Based on QALYs and costs, the incremental cost-effectiveness ratio (ICER) was calculated to evaluate the cost-effectiveness of the pregabalin treatment. The formula used to estimate the ICER was:
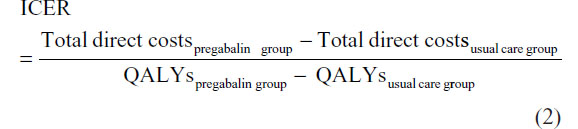
Discounting of costs and QALYs was not applied because of the short time horizon of the analysis.
Sensitivity analyses
Sensitivity analyses were performed to account for uncertainties in the data sources and assumptions, and to confirm the robustness of the ICERs estimated in the base case. These analyses, which used the payer’s perspective only (ie, excluding indirect costs) varied key variables over clinically relevant values. One-way sensitivity analyses were also performed (10,000 iterations) that included sensitivity for pain transitions using the 95% confidence intervals for each possible transition state; direct costs other than pregabalin acquisition costs using interquartile ranges; pregabalin costs at each severity level based on the 95% confidence cost intervals; the 95% confidence interval for surgery costs; and time intervals of 3 and 24 months. A cost-effectiveness acceptability curve was developed based on the probabilistic estimate. All parameters used in both the deterministic and probabilistic sensitivity analyses, including range information and probability distributions, are shown in the Supplementary materials.
Results
Base case
From the health care payer’s perspective, in which only direct costs were included, lower costs for direct medical costs (excluding pregabalin acquisition costs) and hospitalizations were observed with pregabalin treatment relative to usual care (Table 3). These lower costs partially offset the acquisition costs of pregabalin and resulted in total direct costs that were ¥28,324 higher with pregabalin. However, the difference in QALYs of 0.014 favored pregabalin. Thus, an ICER of ¥2,024,901 per QALY gained was estimated for patients treated with pregabalin.
 | Table 3 Base case analysis |
Using the societal perspective, savings in indirect costs associated with pregabalin treatment relative to usual care further offset the pregabalin acquisition costs (Table 3). This offset resulted in a cost difference of ¥20,068, and an estimated ICER of ¥1,434,637 per QALY gained with pregabalin.
Sensitivity analyses (payer perspective)
In the base case scenario, the assumption for surgery was that the postsurgical pain score would reflect mild pain, using a pain NRS score of 2. In the sensitivity analyses (Table 4), alternative values were used that reflected the potential for complete pain relief (NRS score 0), as well as for reducing the pain to only a moderate level (NRS score 5). These analyses resulted in ICERs of ¥2,049,492 and ¥1,982,802 per QALY gained, respectively, that were similar to the base case.
 | Table 4 Sensitivity analysis on key variables |
Varying the pain score after discontinuation to the score of the previous visit rather than at baseline resulted in an estimated ICER of ¥2,024,901 (Table 4). Similarly, using the assumptions that all patients at baseline had either moderate or severe pain did not substantially affect the ICER (Table 4). Use of the actual EQ-5D-5L scores from the NIS to determine QALYs resulted in an ICER of ¥2,244,983 per QALY gained (Table 4).
In the one-way sensitivity analyses, the range of ICERs was generally similar across all varied parameters (Figure 3). The highest calculated ICER was ¥3,854,762, when the time horizon was reduced to 3 months; extending the time horizon to 24 months resulted in an ICER of ¥1,959,142 (Figure 3). However, the parameter for which the results were most sensitive to change was the probability of moderate pain at week 4 transitioning to severe pain at week 8 in the usual care group (¥973,653 to ¥3,854,676 across the probability range of 6.97% to 20.21%) (Figure 3).
 | Figure 3 Tornado diagram of the 20 most sensitive parameters in the one-way sensitivity analysis. |
A cost-effectiveness acceptability curve was developed for pregabalin, where the horizontal axis presents willingness-to-pay thresholds, ie, maximum values accepted for ICER, and the vertical axis shows the probability for “acceptance” of pregabalin, or the probability that the ICER for pregabalin would be lower than the threshold value given in the horizontal axis (Figure 4). This curve shows that the probability of pregabalin being cost-effective is 75% and 80% for thresholds of ¥5,000,000 and ¥6,700,000 per QALY, respectively.
 | Figure 4 Cost-effectiveness acceptability curve for pregabalin. |
Discussion
Previous studies in the clinical practice setting have demonstrated that pregabalin results in significant improvements in patient-reported outcomes in CLBP-NeP.20,29,30 The current study provides evidence, based on results extrapolated from a NIS in patients with at least moderate pain due to CLBP-NeP,20 that these improvements are cost-effective. These results from Japan are consistent with studies from other countries showing the economic benefits of pregabalin for the treatment of NeP.31–35
In the base case, introducing pregabalin would reduce future direct medical costs including hospitalization costs, which resulted in a favorable ICER of ¥2,024,901 per QALY gained from the health care payer’s perspective. This ICER is somewhat higher than the ratios previously reported in a cost-effectiveness analysis of pregabalin for the treatment of other NeP conditions in Japan.19 However, some non-Japanese data were used in the previous model. Thus, the current analysis may provide a more clinically relevant estimate of the cost-effectiveness of pregabalin in Japan. Furthermore, demonstration that pregabalin is cost-effective for the treatment for CLBP-NeP in Japan is consistent with reports in other countries that pregabalin for the treatment of NeP results in economic benefits.31,32,34,35
Even more favorable economic benefits were observed from the societal perspective, since lower indirect costs resulted in a greater offset of pregabalin acquisition costs. These reductions in indirect costs are consistent with other pharmacoeconomic studies of pregabalin versus usual care in patients with NeP conditions that have also suggested that improvements in productivity contribute to the economic benefits of pregabalin.32,34
The key sensitivity analyses resulted in ICERs that were similar to the base case, suggesting robustness of the model’s results regarding the economic benefits of pregabalin. While no ICER thresholds have been formally established in Japan, two studies have estimated values of ¥5,000,000 and ¥6,700,000 respectively for willingness to pay to gain one QALY in Japan.36,37 Using these thresholds, there was high probability that use of pregabalin would be cost-effective, 75% and 80% for the two thresholds, respectively, and in the one-way sensitivity analysis, no parameter resulted in an ICER >¥5,000,000/QALY. More recently, a study of the willingness to pay for a QALY suggested that such a threshold may be dependent on the severity of the condition, ranging from ¥2 million to ¥8 million, with more severe conditions having a higher threshold.38 In the current study, ICER values of base case and key sensitivity analyses approximated the lower limit of the range (¥2 million), supporting the cost-effectiveness of this therapy. It can also be considered that the calculated base case ICER of ¥2,024,901 converts to approximately £11,127 and US$16,863 (exchange rate of May 27, 2015), and even the maximum ICER calculated in the one-way sensitivity analysis (¥3,854,762) converts to approximately £20,545 and US$32,335. These values are substantially lower than the £30,000 and US$50,000–US$200,000 thresholds that are often cited as the upper limits deemed to be acceptable in the United Kingdom39 and the United States,40 respectively, and which are considered benchmarks for cost-effectiveness.
Strengths and limitations
Major strengths of this analysis are the data sources that were used, including that the clinical effects were derived using real-world, patient-level data from routine clinical practice in Japan.20 Additionally, all other assumptions were derived from studies or data specific to the Japanese population, enhancing applicability of the cost-effectiveness to the Japanese health care system. In this regard, it should also be noted that international generalizability is likely a study limitation, since the NIS on which this cost-effectiveness analysis was based reflects Japanese clinical practice, as do the treatment patterns and costs derived for use in the model.
Another limitation is that the costs were derived from a physician survey and a claims database (MDV) rather than directly from evaluated patients. Furthermore, side effects and their related costs were not captured, although these costs would not likely increase the ICER above the threshold considered cost-effective. While the study could also be criticized for potentially double-counting indirect costs by using both the WPAI:SH and the EQ-5D-5L, which incorporates a domain of “Daily Activity”, it has previously been shown that the EQ-5D does not adequately capture earnings loss in its utility assessment.41 Thus, valuing productivity losses in the numerator of the ICER does not represent double-counting. Lastly, since resource utilization patterns were based on information derived from a clinician survey, there is the potential for selection bias, since treatment decisions may differ between clinicians who agreed to participate relative to those who declined.
Conclusion
This study demonstrates that pregabalin is cost-effective for the treatment of CLBP-NeP in Japan, resulting in ICERs that are well below accepted thresholds for cost-effectiveness. The favorability of pregabalin was increased, as indicated by a lower ICER, when indirect costs related to lost productivity were considered. Sensitivity analyses showed the results to be reasonably insensitive to variability in key assumptions and variables. Importantly, all assumptions and values in the current analysis were derived using data relevant to the Japanese clinical setting, confirming the generalizability of results.
Acknowledgment
This study was sponsored by Pfizer. Editorial assistance was provided by E Jay Bienen, who was funded by Pfizer.
Disclosure
Alesia Sadosky, Nozomi Ebata, Richard Willke, Koichi Fujii, and Jim Doherty are employees and shareholders of Pfizer, the sponsor of this study. Tatsunori Murata and Makoto Kobayashi are employees of CRECON Medical Assessment Inc., who were paid consultants to Pfizer in connection with the analysis described in this study and were compensated for development of this paper. Ataru Igarashi, Manabu Akazawa, and Toshihiko Taguchi were not financially compensated for their collaboration in this project or for the development of this paper. The authors report no other conflicts of interest in this work.
References
Vos T, Flaxman AD, Naghavi M, et al. Years lived with disability (YLDs) for 1160 sequelae of 289 diseases and injuries 1990–2010: a systematic analysis for the Global Burden of Disease Study 2010. Lancet. 2012;380(9859):2163–2196. | |
Freynhagen R, Baron R, Gockel U, Tölle TR. painDETECT: a new screening questionnaire to identify neuropathic components in patients with back pain. Curr Med Res Opin. 2006;22(10):1911–1920. | |
Dagenais S, Caro J, Haldeman S. A systematic review of low back pain cost of illness studies in the United States and internationally. Spine J. 2008;8(1):8–20. | |
Stewart WF, Ricci JA, Chee E, Morganstein D, Lipton R. Lost productive time and cost due to common pain conditions in the US workforce. JAMA. 2003;290(18):2443–2454. | |
Mehra M, Hill K, Nicholl D, Schadrack J. The burden of chronic low back pain with and without a neuropathic component: a healthcare resource use and cost analysis. J Med Econ. 2012;15(2):245–252. | |
Nakamura M, Nishiwaki Y, Ushida T, Toyama Y. Prevalence and characteristics of chronic musculoskeletal pain in Japan. J Orthop Sci. 2011;16(4):424–432. | |
Nakamura M, Nishiwaki Y, Sumitani M, et al. Investigation of chronic musculoskeletal pain (third report): with special reference to the importance of neuropathic pain and psychogenic pain. J Orthop Sci. 2014;19(4):667–675. | |
Fujii T, Matsudaira K. Prevalence of low back pain and factors associated with chronic disabling back pain in Japan. Eur Spine J. 2013;22(2):432–438. | |
Suka M, Yoshida K. Low back pain deprives the Japanese adult population of their quality of life: a questionnaire survey at five healthcare facilities in Japan. Environ Health Prev Med. 2008;13(2):109–115. | |
Itoh H, Kitamura F, Yokoyama K. Estimates of annual medical costs of work-related low back pain in Japan. Ind Health. 2013;51(5):524–529. | |
Sadosky AB, DiBonaventura M, Cappelleri JC, Ebata N, Fujii K. The association between lower back pain and health status, work productivity, and health care resource use in Japan. J Pain Res. 2015;8: 119–130. | |
Yamashita T, Takahashi K, Yonenobu K, Kikuchi S. Prevalence of neuropathic pain in cases with chronic pain related to spinal disorders. J Orthop Sci. 2014;19(1):15–21. | |
Dworkin RH, O’Connor AB, Audette J, et al. Recommendations for the pharmacological management of neuropathic pain: an overview and literature update. Mayo Clin Proc. 2010;85(3 Suppl):S3–S14. | |
Japan Society of Pain Clinicians. Guideline for the Pharmacologic Management of Neuropathic Pain. Tokyo: Shinko Trading Company Ltd, Publication Department of Medical Books; 2011. Available from: http://www.sshinko.com/?p=2690. Accessed September 3, 2015. | |
Field MJ, Cox PJ, Stott E, et al. Identification of the alpha2-delta-1 subunit of voltage-dependent calcium channels as a molecular target for pain mediating the analgesic actions of pregabalin. Proc Natl Acad Sci U S A. 2006;103(46):17537–17542. | |
Satoh J, Yagihashi S, Baba M, et al. Efficacy and safety of pregabalin for treating neuropathic pain associated with diabetic peripheral neuropathy: a 14 week, randomized, double-blind, placebo-controlled trial. Diabet Med. 2011;28(1):109–116. | |
Ogawa S, Suzuki M, Arakawa A, et al. Evaluation of the efficacy and safety of pregabalin in the treatment of postherpetic neuralgia: a randomized, double-blind, multicenter, placebo-controlled study. J Japan Soc Pain Clin. 2010;17(2):141–152. Available from: https://www.jstage.jst.go.jp/article/jjspc/17/2/17_2_141/_article/-char/ja/. Accessed September 3, 2015. | |
Onouchi K, Koga H, Yokoyama K, Yoshiyama T. An open-label, long-term study examining the safety and tolerability of pregabalin in Japanese patients with central neuropathic pain. J Pain Res. 2014;7: 439–447. | |
Ikeda S, Ogawa S, Hosokawa T, et al. Cost-effectiveness analysis of pregabalin for treatment of peripheral neuropathic pain. Japanese Journal of Pharmacoepidemiology. 2011;16(1):1–9. | |
Taguchi T, Igarashi A, Watt S, et al. Effectiveness of pregabalin compared with usual care for the treatment of chronic low back pain with a neuropathic component in Japan; the patient’s perspective. J Pain Res. 2015;8:487–497. | |
Herdman M, Gudex C, Lloyd A, et al. Development and preliminary testing of the new five-level version of EQ-5D (EQ-5D-5L). Qual Life Res. 2011;20(10):1727–1736. | |
Ikeda S, Shiroiwa T, Igarashi A, et al. [Developing a Japanese version of the EQ-5D-5L value set]. Journal of the National Institute of Public Health. 2015;64(1):47–55. Japanese. | |
Zelman D, Dukes E, Brandenburg N, Bostrom A, Gore M. Identification of cut-points for mild, moderate and severe pain due to diabetic peripheral neuropathy. Pain. 2005;115(1–2):29–36. | |
Satoh J, Yagihashi S, Baba M, Suzuki M, Arakawa A, Yoshiyama T. Efficacy and safety evaluation of pregabalin treatment over 52 weeks in patients with diabetic neuropathic pain extended after a double-blind placebo-controlled trial. J Diabetes Investig. 2011;2(6):457–463. | |
Ogawa S, Suzuki M, Arakawa A, Yoshiyama T, Suzuki M. [Long-term efficacy and safety of pregabalin in patients with postherpetic neuralgia: results of a 52-week, open-label, flexible-dose study]. Masui. 2010;59(8):961–970. Japanese. | |
Simpson DM, Rice AS, Emir B, et al. A randomized, double-blind, placebo-controlled trial and open-label extension study to evaluate the efficacy and safety of pregabalin in the treatment of neuropathic pain associated with human immunodeficiency virus neuropathy. Pain. 2014; 155(10):1943–1954. | |
Lofland JH, Pizzi L, Frick KD. A review of health-related workplace productivity loss instruments. Pharmacoeconomics. 2004;22(3):165–184. | |
WPAI:SHP V2.0 [webpage on the Internet]. New York: Reilly Associates [updated August 18, 2010]. Available from: http://www.reillyassociates.net/WPAI_SHP.html. Accessed January 16, 2015. | |
Toelle T, Varvara R, Nimour M, Emir B, Brasser M. Pregabalin in neuropathic pain related to DPN, cancer and back pain: analysis of a 6-week observational study. Open Pain J. 2012;5:1–11. | |
Saldaña MT, Navarro A, Pérez C, Masramón X, Rejas J. Patient-reported-outcomes in subjects with painful lumbar or cervical radiculopathy treated with pregabalin: evidence from medical practice in primary care settings. Rheumatol Int. 2010;30(8):1005–1015. | |
Chevalier P, Lamotte M, Van Campenhout H, Eyckerman R, Annemans L. Cost-utility of pregabalin as add-on to usual care versus usual care alone in the management of peripheral neuropathic pain in Belgium. J Med Econ. 2013;16(5):596–605. | |
Morera-Domínguez C, Ceberio-Balda F, Flórez-García M, Masramón X, López-Gómez V. A cost-consequence analysis of pregabalin versus usual care in the symptomatic treatment of refractory low back pain: sub-analysis of observational trial data from orthopaedic surgery and rehabilitation clinics. Clin Drug Investig. 2010;30(8):517–531. | |
Pérez C, Navarro A, Saldaña MT, Figueras-Balsells M, Muñoz-Tudurí M, Rejas J. Cost savings associated with early initiation of pregabalin in the management of peripheral neuropathic pain. Clin J Pain. 2013;29(6):471–477. | |
Prettyjohns M, Sandelin R, Lister S, Norrefalk JR. A cost-utility study of the use of pregabalin added to usual care in refractory neuropathic pain patients in a Swedish setting. J Med Econ. 2012;15(6):1097–1109. | |
Gordon J, Lister S, Prettyjohns M, McEwan P, Tetlow A, Gabriel Z. A cost-utility study of the use of pregabalin in treatment-refractory neuropathic pain. J Med Econ. 2012;15(2):207–218. | |
Ohkusa Y, Sugawara T. [Research for willingness to pay for one QALY gain]. Journal of Health Care and Society. 2006;16(2):157–165. Japanese. | |
Shiroiwa T, Sung YK, Fukuda T, Lang HC, Bae SC, Tsutani K. International survey on willingness-to-pay (WTP) for one additional QALY gained: what is the threshold of cost effectiveness? Health Econ. 2010;19(4):422–437. | |
Shiroiwa T, Igarashi A, Fukuda T, Ikeda S. WTP for a QALY and health states: more money for severer health states? Cost Eff Resour Alloc. 2013;11:22. | |
Guide to the Methods of Technology Appraisal. London: National Institute for Health and Clinical Excellence; 2013. Available from: https://www.nice.org.uk/article/pmg9/chapter/foreword. Accessed September 3, 2015. | |
Neumann PJ, Cohen JT, Weinstein MC. Updating cost-effectiveness – the curious resilience of the $50,000-per-QALY threshold. N Engl J Med. 2014;371(9):796–797. | |
Tilling C, Krol M, Tsuchiya A, Brazier J, Exel Jv, Brouwer W. Does the EQ-5D reflect lost earnings? Pharmacoeconomics. 2012;30(1):47–61. |
Supplementary materials
Physician survey methods
The survey was conducted from December 3–8, 2014 and elicited information on health care resource use (Table S1) for chronic low back pain with accompanying neuropathic pain (CLBP-NeP), and medications prescribed for CLBP-NeP patients based on pain severity levels, over a time frame of 3 months using an internet questionnaire written in the Japanese language.
Severity of pain was defined as no/mild (scores 0–3), moderate (scores 4–6), and severe (scores 7–10) in this survey to fit the definitions in the model.
There were 18 combinations of pain sequences by severity and months, and at least 30 physicians were asked to answer questions on each three-pattern group of 18 combinations.
Questionnaire details
Target patient definition
The target patients had chronic low back pain with sciatica assumed to be caused by lumbar spondylosis and met all of the following criteria:
- Mean age: 60 years.
- Patients with refractory pain after 3 months of nonsteroidal anti-inflammatory drug (NSAID) treatment.
- Patients with no bladder or rectal disturbance.
- Patients with no contraindication for any medication.
- Patients with no leg paralysis in the study period.
Survey response conditions
- Please answer based on your overall opinion on average regarding daily clinical practices.
- Your intuitive answer is expected. You do not need to look back in the medical chart or other documents.
- Please answer only about treatments which depend on the severity of pain from chronic low back pain, regardless of treatments for patient’s complication.
Cost calculation methods from answers about resource utilization
Resource utilization was separately calculated depending on the severity of pain and the period from the first visit (Table S2).
The costs for each period and each severity were calculated with the following formula:

Test costs calculation was conducted using the below criteria:
- Tests with low administration rates (about 30% or lower in the overall average) were excluded.
- X-rays and MRI scans remained as the result of the above.
- Only medicines with a high administration rate (approximately 30% or higher in the overall average) were included.
- Resulted in acetaminophen (paracetamol), neurotropin, tramadol, and NSAIDs.
- NSAIDs were represented by loxoprofen sodium hydrate, which had the highest administration rate among NSAIDs.
Medication costs calculation was conducted using the below criteria:
Physician survey results
The results of the physician survey are shown in Tables S3–S15.
Parameters used in the sensitivity analyses
Range information, probability distributions, and sources used for all parameters in the sensitivity analyses are shown in Table S16.
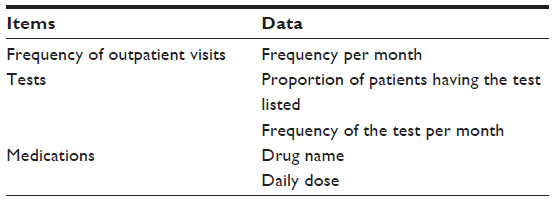 | Table S1 Information for determining health care resource utiilization |
 | Table S2 Method of cost calculation |
 | Table S3 Number of outpatient visits per month |
 | Table S4 Proportion of patients having X-ray |
 | Table S5 Number of X-ray tests per month in patients having one or more tests in each month |
 | Table S6 Proportion of patients having an MRI |
 | Table S7 Number of MRI tests per month in patients having one or more tests in each month |
 | Table S8 Proportion of physicians reporting use of acetaminophen (paracetamol) |
 | Table S9 Acetaminophen (paracetamol) use, mg per day |
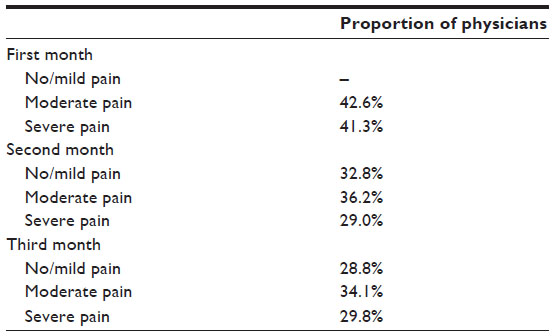 | Table S10 Proportion of physicians reporting use of neurotropin |
 | Table S11 Use of neurotropin, units per day |
 | Table S12 Proportion of physicians reporting use of tramadol |
 | Table S13 Tramadol use, mg per day |
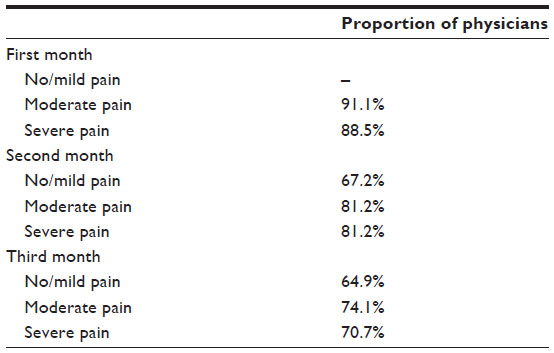 | Table S14 Proportion of physicians reporting use of nonsteroidal anti-inflammatory drugs |
 | Table S15 Use of nonsteroidal anti-inflammatory drugs (loxoprofen), mg per daya |
 | Table S16 |
 © 2015 The Author(s). This work is published and licensed by Dove Medical Press Limited. The full terms of this license are available at https://www.dovepress.com/terms.php and incorporate the Creative Commons Attribution - Non Commercial (unported, v3.0) License.
By accessing the work you hereby accept the Terms. Non-commercial uses of the work are permitted without any further permission from Dove Medical Press Limited, provided the work is properly attributed. For permission for commercial use of this work, please see paragraphs 4.2 and 5 of our Terms.
© 2015 The Author(s). This work is published and licensed by Dove Medical Press Limited. The full terms of this license are available at https://www.dovepress.com/terms.php and incorporate the Creative Commons Attribution - Non Commercial (unported, v3.0) License.
By accessing the work you hereby accept the Terms. Non-commercial uses of the work are permitted without any further permission from Dove Medical Press Limited, provided the work is properly attributed. For permission for commercial use of this work, please see paragraphs 4.2 and 5 of our Terms.