")
Back to Journals » Cancer Management and Research » Volume 11
Cost-Effectiveness Analysis Of Pembrolizumab In The Treatment Of Advanced Recurrent Metastatic Head And Neck Squamous Cell Carcinoma In China And The United States
Authors Liu M, Han S, Zheng B, Cai H, Yang J, Zhuang Q, Li N
Received 6 August 2019
Accepted for publication 10 October 2019
Published 11 November 2019 Volume 2019:11 Pages 9483—9493
DOI https://doi.org/10.2147/CMAR.S226243
Checked for plagiarism Yes
Review by Single anonymous peer review
Peer reviewer comments 2
Editor who approved publication: Dr Chien-Feng Li
Maobai Liu,1,2,* Sijie Han,2,* Bin Zheng,1,2 Hongfu Cai,1,2 Jing Yang,1,2 Qian Zhuang,1,2 Na Li1,2
1Department of Pharmacy, Fujian Medical University Union Hospital, Fuzhou, Fujian, People’s Republic of China; 2The School of Pharmacy, Fujian Medical University, Fuzhou, People’s Republic of China
*These authors contributed equally to this work
Correspondence: Na Li
Department of Pharmacy, Fujian Medical University Union Hospital, No. 29 Xinquan Road, Fuzhou, Fujian 350001, People’s Republic of China
Email [email protected]
Background: Pembrolizumab, a programmed cell death-1 (PD-1) inhibitor, has recently gained prominence as a second-line treatment for recurrent and/or metastatic head and neck squamous cell cancer (R/M HNSCC). This study compares the acceptance and different influencing factors of pembrolizumab in the treatment of R/M HNSCC in developed (i.e., the United States) and developing (i.e., China) countries through cost-effectiveness analysis and provides valuable suggestions for clinical decision making.
Methods: A Markov model was constructed using TreeAge Pro 2015 software to evaluate the economic value of four treatment strategies. Quality-adjusted life years (QALY) and incremental cost-effectiveness ratio (ICER) were used as economic indicators for incremental cost-effectiveness analysis. The stability of the model was evaluated by one-way sensitivity and probability sensitivity analyses.
Results: The ICERs for the pembrolizumab group versus PD-L1 CPS treatment in China and the US were $7892/QALY and $11,900/QALY, respectively. All ICERs were less than the threshold of $29,306 in China and $50,000 in the US; thus, pembrolizumab is cost effective. Sensitivity analysis confirmed a stable economic advantage in the single-drug regimen of pembrolizumab in China and the US.
Conclusion: Pembrolizumab monotherapy as a second-line treatment for R/M HNSCC presents more health benefits in comparison with the standard, PD-L1 TPS and PD-L1 CPS groups in China and the US.
Keywords: pembrolizumab, head and neck cancer, cost-effectiveness
Introduction
Head and neck squamous cell carcinoma (HNSCC) is the most common pathological type of head and neck cancer and the incidence of this pathology accounts for about 80% in all head and neck cancers. The incidence of HNSCC is fairly high worldwide, and this pathology ranks 7th among malignant cancers in terms of incidence1. China and the the United States of America (USA) approved the domestic listing of pembrolizumab in August 2016 and June 2018, respectively. In 2018, the National Comprehensive Cancer Network (NCCN) added pembrolizumab as a second-line treatment for recurrent and/or metastatic (R/M) HNSCC after platinum-based chemotherapy2 According to the NCCN2 and the China Clinical Oncology Society guidelines for the diagnosis and treatment of head and neck cancer3 non-first line standard treatment options for R/M HNSCC include docetaxel, methotrexate, and cetuximab.
Pembrolizumab is an inhibitor of programmed cell death protein 1 (PD-1). When T cells function normally, they can recognize and fight cancer cells. Binding of the PD-L1 protein of cancer cells to the PD-1 receptor on T cells can prevent T cells from functioning properly and escape immune attacks. Pembrolizumab blocks the binding of PD-L1 protein to the PD-1 receptor, thereby allowing T cells to prevent tumor cells from functioning normally.1 Two test strategies have been developed to determine the PD-L1 status: PD-L1 tumor proportion score (TPS) and PD-L1 combined positive score (CPS). TPS refers to the percentage of tumor cells with partially or completely stained cell membranes. The immunotherapeutic effect of some cancer species is related to not only the expression of PD-L1 in the tumor cells of the patients but also the expression of PD-L1 in immune cells. CPS is used as an index to evaluate the status of PD-L1 in immune cells and represents the ratio of the number of PD-L1-positive cells (e.g., tumor cells, lymphocytes, macrophages) to the total number of tumor cells.
Pembrolizumab showed prominent characteristics in a 24-month clinical trial (KEYNOTE-040). The median survival of pembrolizumab group (8.4 months) was 1.5 months longer than that of the standard group (6.9 months). In terms of PD-L1 TPS group, the median survival time of patients whose PD-L1 status was >50% (11.6 months) was 5 months longer than that of the standard group (6.6 months), and the median survival period was nearly doubled. Moreover, the incidence of serious adverse events (SAEs) in pembrolizumab was significantly lower than that in standard chemotherapy drugs. No serious SAEs with a rate of >5% were found in this trial, which indicates that the drug could greatly improve patients’ quality of lives.4
Although the efficacy of pembrolizumab has shown great advantages in many clinical studies, its high cost limits its wider application. The income level of different countries exerts a certain influence on the choice of clinical treatment. This analysis aims to assess the cost effectiveness of pembrolizumab in R/M HNSCC treatment from the perspective of health care. The present study takes China and the United States of America (US) into consideration to compare the medical-related costs of patients in developing and developed countries.
Materials And Methods
Decision Model
In this study, the optimal strategy will be determined by incremental cost-effectiveness analysis. R/M HNSCC is the type of disease selected in this study, and the clinical data are obtained from patients in China and the USA who participated in a clinical trial (KEYNOTE-040)4 A 10-year rather than 5-year horizon was selected because this analysis should ensure that more than 90% of patients completed the entire Markov model.
This study establishes a decision tree model based on four schemes by referring to the decision tree model of Hirschmann et al5. The four protocols were the pembrolizumab group, the standard group, the PD-L1 CPS group, and thePD-L1 TPS group. In the PD-L1 CPS group, pembrolizumab was used when CPS ≥ 1%; otherwise (ie, CPS < 1%), treatment by standard protocols was conducted. In the PD-L1 TPS group, patients with TPS ≥ 50% chose pembrolizumab, and only those with TPS < 50% considered standard treatment options4 The two test strategies were compared with Pembrolizumab and standard groups. In Pembrolizumab and standard groups, patients received treatment directly without any test (Figure 1).
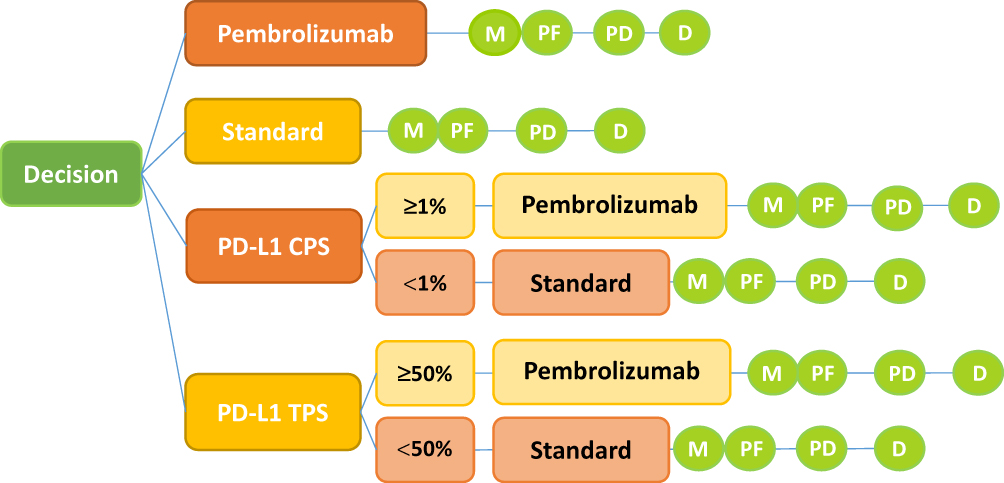 |
Figure 1 Model structure. Notes: Decision tree and Markov model are constructed to evaluate the cost effectiveness of four strategies. Abbreviations: M, Markov node; PF, progression free; PD, progressive disease; D, death; PD-L1, programmed death ligand; CPS, combined positive score; TPS, tumor proportion score; standard, standard drugs. |
A Markov model was built by using TreeAge Pro 2015 software to calculate the incremental cost and quality-adjusted life years (QALYs) of these four scenarios. The model has three healthy states: progression-free survival (PFS), progression survival (PS), and death (Figure 2). All patients entered the model from the PFS state; they could then either survive the PFS status or enter the PS status or even die. Patients who were transferred from PFS to PS could not recover their PFS status but could continue to progress or die. Once a patient enters the PS state, medication is discontinued, and the best supportive care (BSC) is provided.
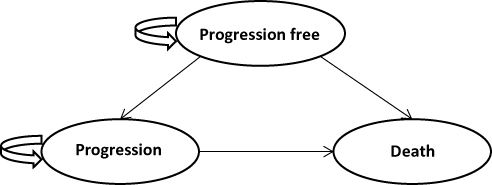 |
Figure 2 Markov state transition model. Notes: The Markov model considers the transition states of R/M HNSCC. All patients start in the progression-free survival (PFS) state and receive treatment according to three treatment plans. Patients can enter the state of progressed survival (PS) and subsequently move to the state of death. |
Clinical Data
Clinical trials (KEYNOTE-040) screened adult patients with HNSCC that progressed during or after Pt-containing treatment for recurrent or metastatic disease (or both) or whose disease recurred or progressed within 3–6 months of previous multimodal therapy containing Pt for locally advanced disease. Four treatment strategies were employed in this study: the pembrolizumab group, the standard group, the PD-L1 CPS group, and the PD-L1 TPS group. Patients in the standard group chose different drugs based on their doctor’s clinical diagnosis and experience (27.4% methotrexate, 42.3% docetaxel, 30.3% cetuximab). The specific dosages and times of administration were as follows. Patients received 40–60 mg/m2 methotrexate chemotherapy per week or 75 mg/m2 docetaxel every 3 weeks. Some patients received cetuximab at a dose of 400 mg/m2 in the first week followed by a dose of 250 mg/m2 per week thereafter. The pembrolizumab group received a dose of 200 mg every 3 weeks for 2 years4 We estimated the body surface area of Chinese and American patients to be 1.72 and 1.86 m2, respectively, and calculated the patients’ dose based on this surface area.6,7 All rescue treatments were stopped as soon as the disease began to progress and BSC was provided.
Clinical Input Parameters And Utilities
The overall survival (OS) and progression-free survival (PFS) parameters in the model were derived from the clinical trial. We digitized the OS and PFS curves obtained from the clinical trial by using GetData software and calculated the area under curves using R software. The Weibull survival function S(t) = exp(−αtβ) was used to fit the OS and PFS curves obtained in the clinical trial. Part of the curve was corrected by the log-logistic survival function S(t) = 1/(1 + αtβ)8 so that the fitted curve is more in line with the actual trend. The parameters gained in the Weibull survival function and the log-logistic survival function model are shown in Table 1. The obtained parameters were used to calculate the probability of metastasis between disease states under the four strategies.
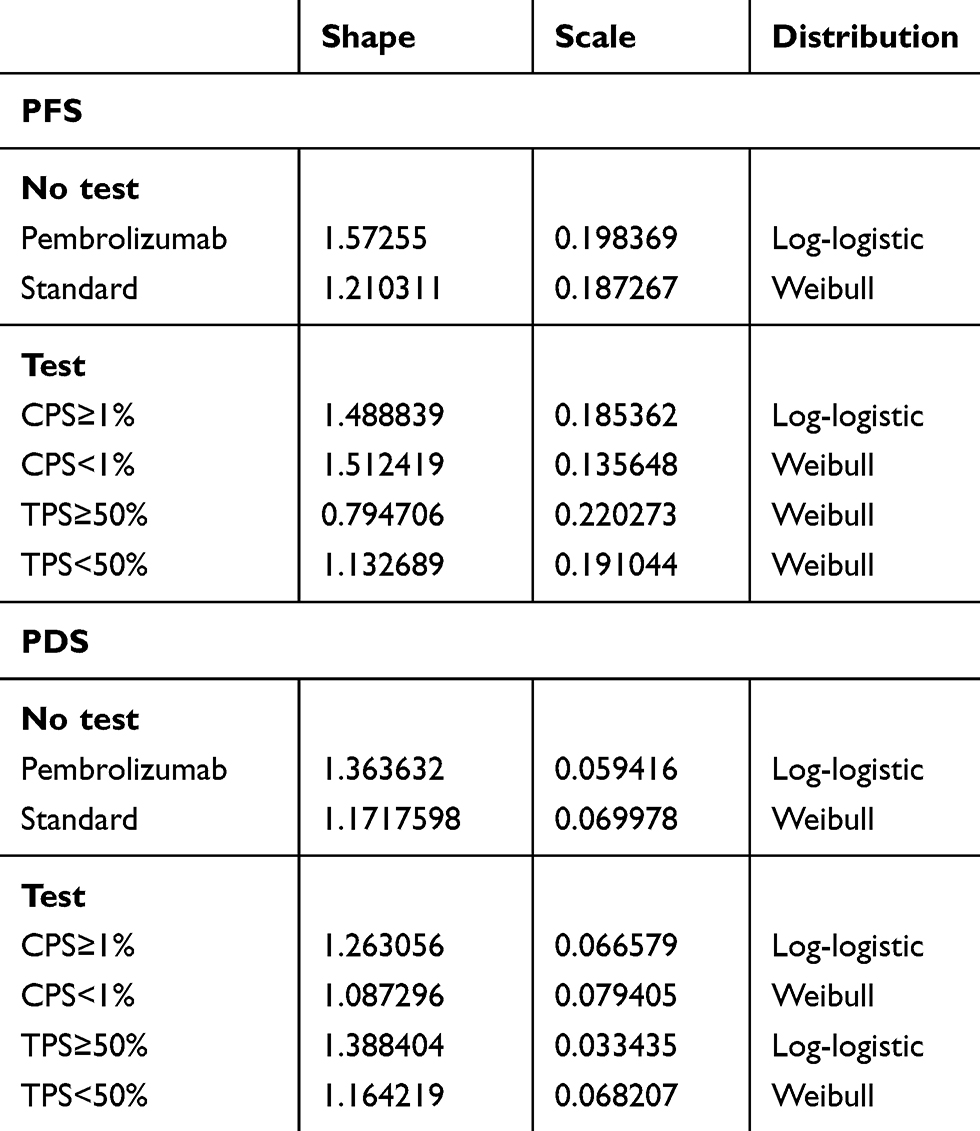 |
Table 1 Key Model Parameters |
R/M HNSCC patients in the free-progression and progression states require appropriate adjustments in their quality of life. In this study, cost-effectiveness was measured by QALY (i.e., health-state utility × life years, where the health-state utility ranges from 0 (death) to 1 (complete health). A discount rate of 3% was applied to the QALY calculations. Since neither pembrolizumab nor nivolumab had SAEs of grade 3 or higher with ≥5% incidence,4,8 the utility values of patients with R/M HNSCC under pembrolizumab in this study refer to healthy utility value of nivolumab in previous study (Table 2).
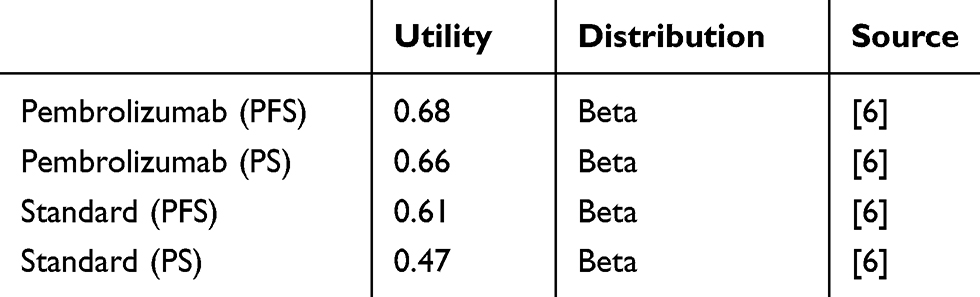 |
Table 2 Health Preference Data |
Costs
The costs involved in this study mainly include direct medical expenses, including drug costs, the PD-L1 test cost, BSC costs, hospice care costs, and the treatment cost of grade III or IV SAEs with >5% incidence (Table 3). In the standard-of-care group, the cost of medicines in China was obtained from the Drug Price Information Public Inquiry Platform in the Fujian Province Medicine and Machinery Joint Limit Sunshine Purchasing Network.9 The price of pembrolizumab imported into China was obtained from the YaoZhi Network10 The costs of pembrolizumab and standard treatments in the US in this study were obtained through the cost-effectiveness studies by Ward MC, Insinga RP et al.6,11 The cost of PD-L1 testing in China refers to the actual charging standards of local medical institutions. In the US, the cost of testing PD-L1 is based on the study by Matthew C. Ward et al.6
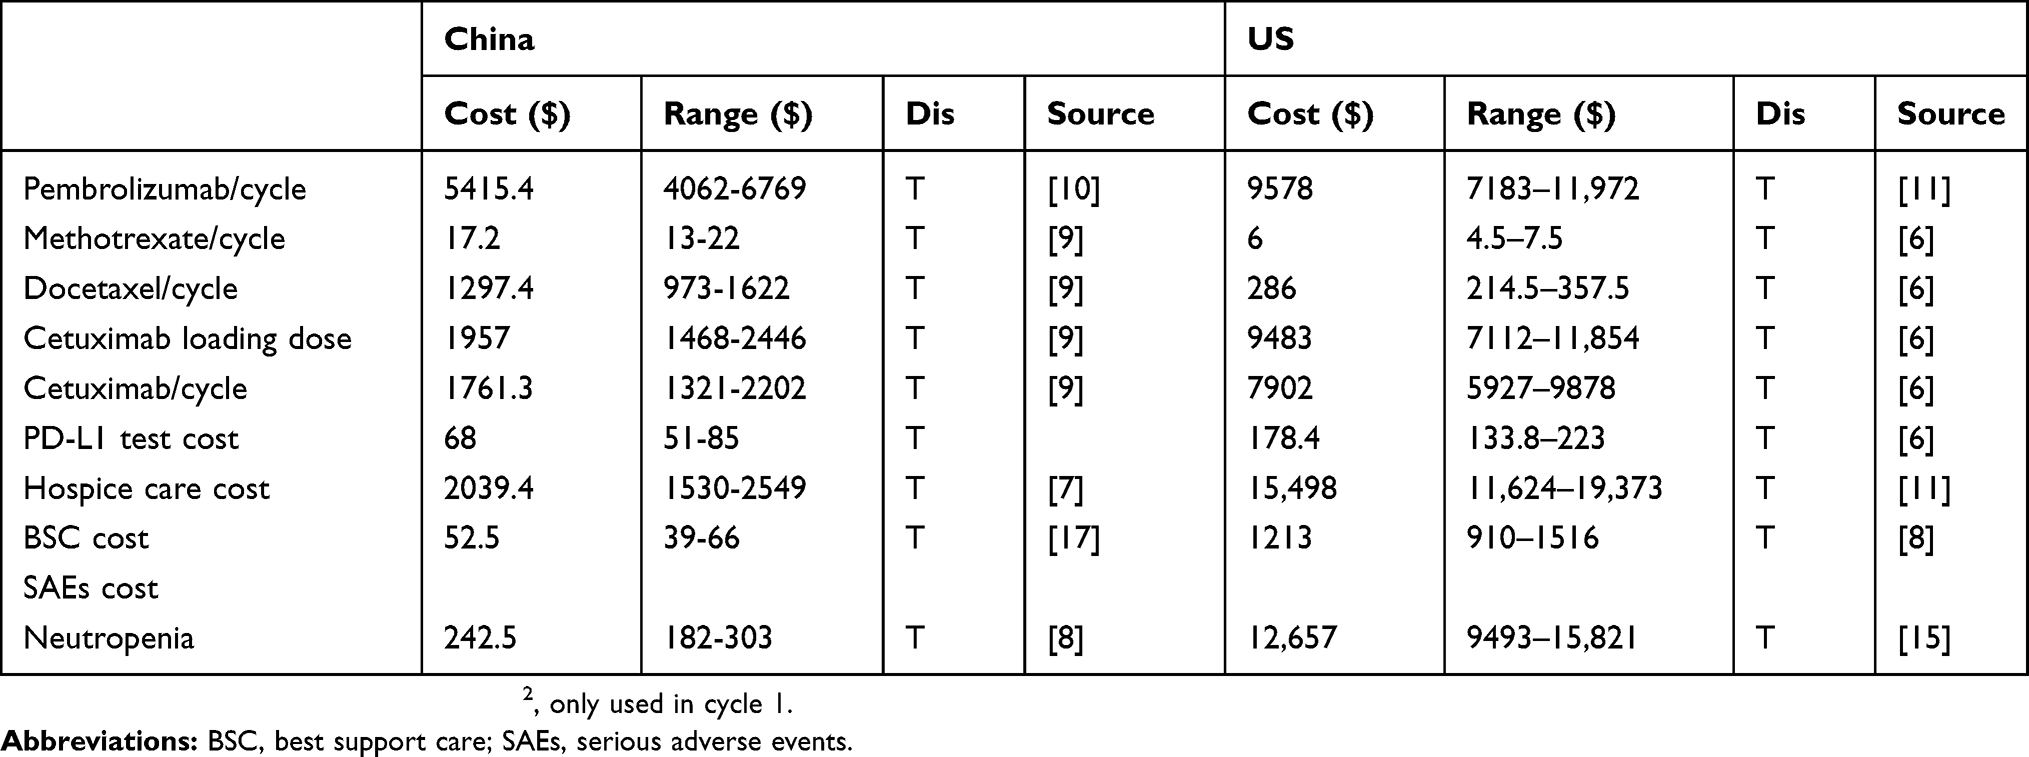 |
Table 3 Cost Parameters |
BSC and hospice care are necessary in all strategies because of the lack of ideal replacement therapy after R/M HNSCC using first-line Pt-based chemotherapy and the high mortality of R/M HNSCC (>80%) over 2 years of treatment. BSC and hospice care costs were obtained from studies on immune checkpoint inhibitors for different diseases in the China and US.7,8,11 Clinically, SAEs of grades III or IV degree mainly indicate neutropenia, and the cost of treatment for drug intervention must be considered. The cost of treatment for SAEs refers to the research of Joanne L. Yu et al in the US and Wu Bin et al in China.7,12 The costs in the model are shown in US dollars based on the 2018 exchange rate (6.6174 yuan/US dollar) and discounted at a discount rate of 3%.
Sensitivity Analysis
The parameters in this study will vary within a certain range, and this volatility may have a certain impact on the results of the model study. The stability of the model was examined by one-way sensitivity and probabilistic sensitivity analyses (PSA) with a range of ±25%. PSA was performed by Monte Carlo simulation with 1000 iterations. Referring to the research of Wu Bin et al, Beta distributions and Triangular distributions are used, for the utility parameters and cost parameters, respectively.7
For the US population in this study, $50,000 was set as an acceptable threshold. Due to the lack of acceptable thresholds for the Chinese population, the World Trade Organization recommendations13 were adopted. These thresholds are as follows: When the incremental cost-effectiveness ratio (ICER) < 1×GDP per capita, the incremental cost can be fully accepted. When 1×GDP per capita < ICER < 3×GDP per capita, the incremental cost is partially acceptable. When ICER > 3×GDP per capita, the incremental cost is considered unacceptable. This study takes 3×China’s GDP per capita in 2018 as the threshold. According to the website of the National Bureau of Statistics, China’s GDP per capita in 2018 was 64,644 yuan ($9768.79)14 thus, 3×GDP per capita is 193,932 yuan or $29,306.
Results
Base Case
We calculated the 174-cycle (10 years) cost of the four treatment strategies and their respective QALYs by establishing a Markov decision tree model. The considering the lowest cost treatment strategy as the baseline. The cost-effectiveness of the four treatment strategies was evaluated by comparing ICERs (ICER = incremental cost/incremental effectiveness).
Over a 10-year period, the total costs of pembrolizumab in the US and China were $132,716 and $34,376, respectively. Moreover, the total costs of the PD-L1 CPS group in the US and China were $128,588 and $31,661, respectively. Because pembrolizumab (PFS, 0.68; PS, 0.66) provided a much better quality of life than standard treatment (PFS, 0.61; PS, 0.47) and was administered for a shorter period of time (2 years), the QALY of each patient increased from 2.05 to 2.40. Thus, the final ICERs in the US and China were $11,900 and $7,892, respectively (Table 4).
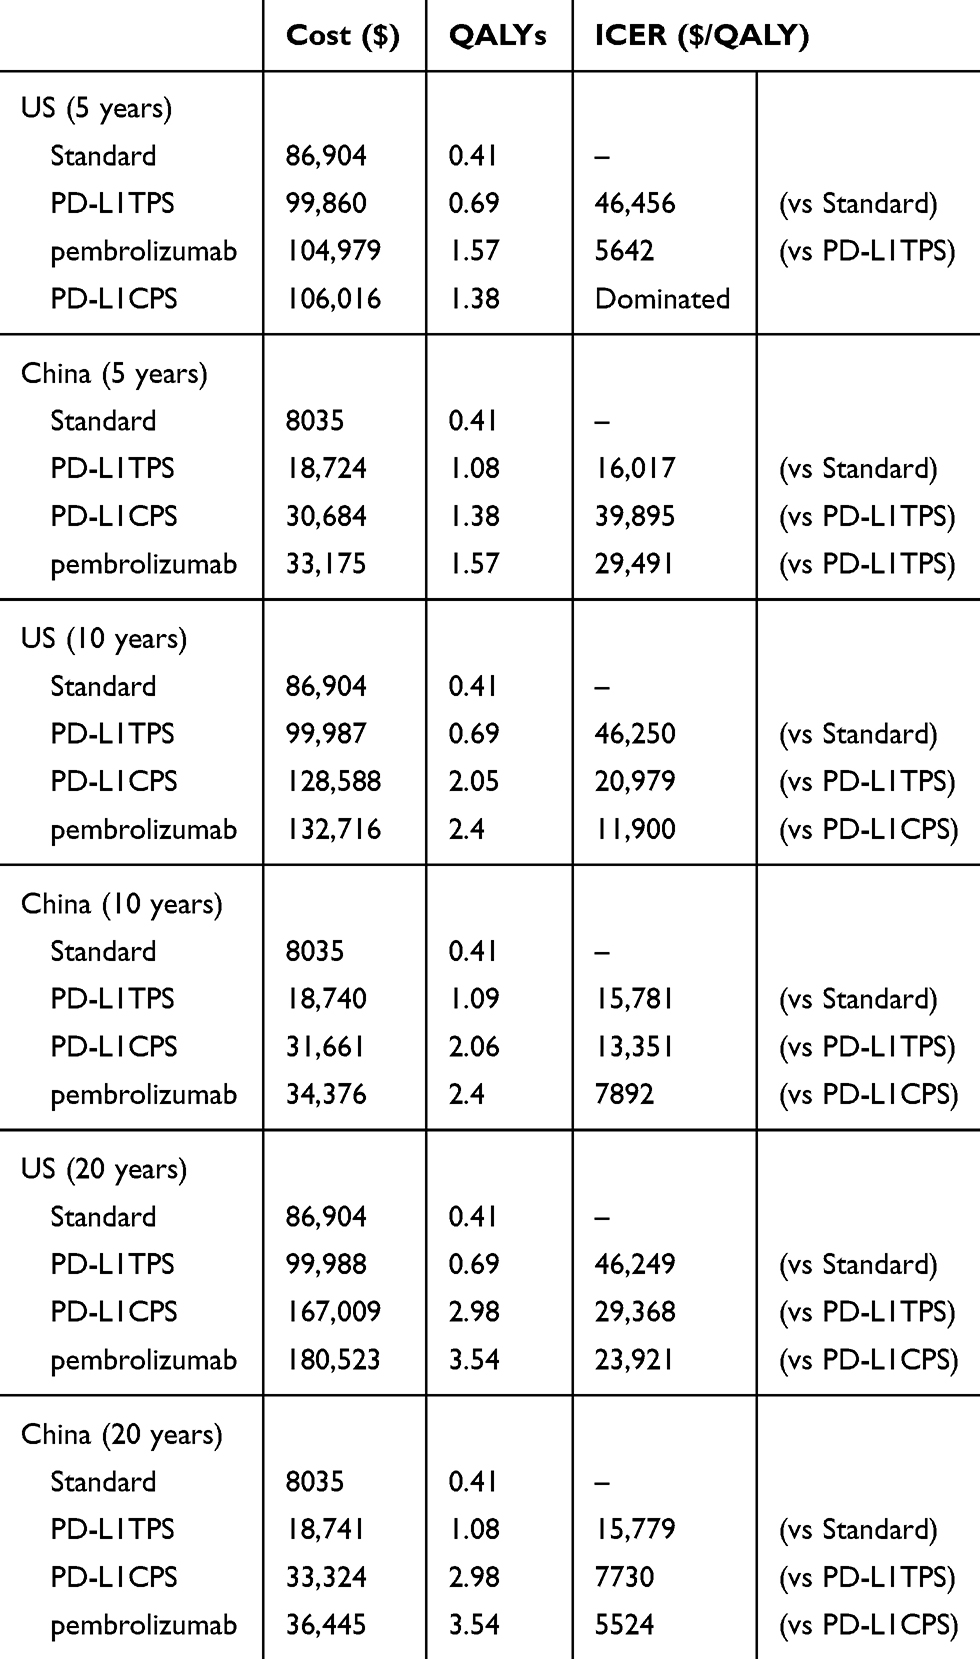 |
Table 4 Summary Of Cost ($) And Outcome Results In R/M HNSCC |
Scenario Analyses
The follow-up time was adjusted to 5 and 20 years, and the cost effectiveness obtained was subjected to incremental analysis. When the follow-up period was 5 years, the most cost-effective treatment in the US was pembrolizumab, with an overall cost of $104,979, a QALY of 1.57, and an ICER of $5,642 per QALY gained compared with that of PD-L1TPS. In the China, when the pembrolizumab group (overall cost, $33,175; QALY, 1.57) compared with PD-L1 TPS group (overall cost, $18,724; QALY: 1.08), ICER was $29,492/QALY, higher than the threshold ($29,306). Since the ICER of the pembrolizumab group is higher than the acceptable threshold for China, PD-L1 TPS is the most economical treatment option in China during the 5-year follow-up period. Due to a longer time horizon of 20 years, pembrolizumab group reinforces its advantage. Increasing overall costs, as well as QALYs, led to an ICER of $5,524 per QALY and $23,921 per QALY gained in China and the US, respectively (Table 4).
Sensitivity Analysis
The results calculated by the model will be affected by the instability of the parameters and fluctuate. The parameters were analyzed for single-factor sensitivity based on a reasonable range (25%). In China, the utility value of patients with disease progression in pembrolizumab, discount rate, and price of pembrolizumab are factors primarily affecting the outcome of ICER, as shown in Figure 3. In the US, the price of pembrolizumab, cost of optimal supportive treatment, cost of SAEs, and utility value of pembrolizumab in patients with disease progression have a great influence on the ICER results, as shown in Figure 4.
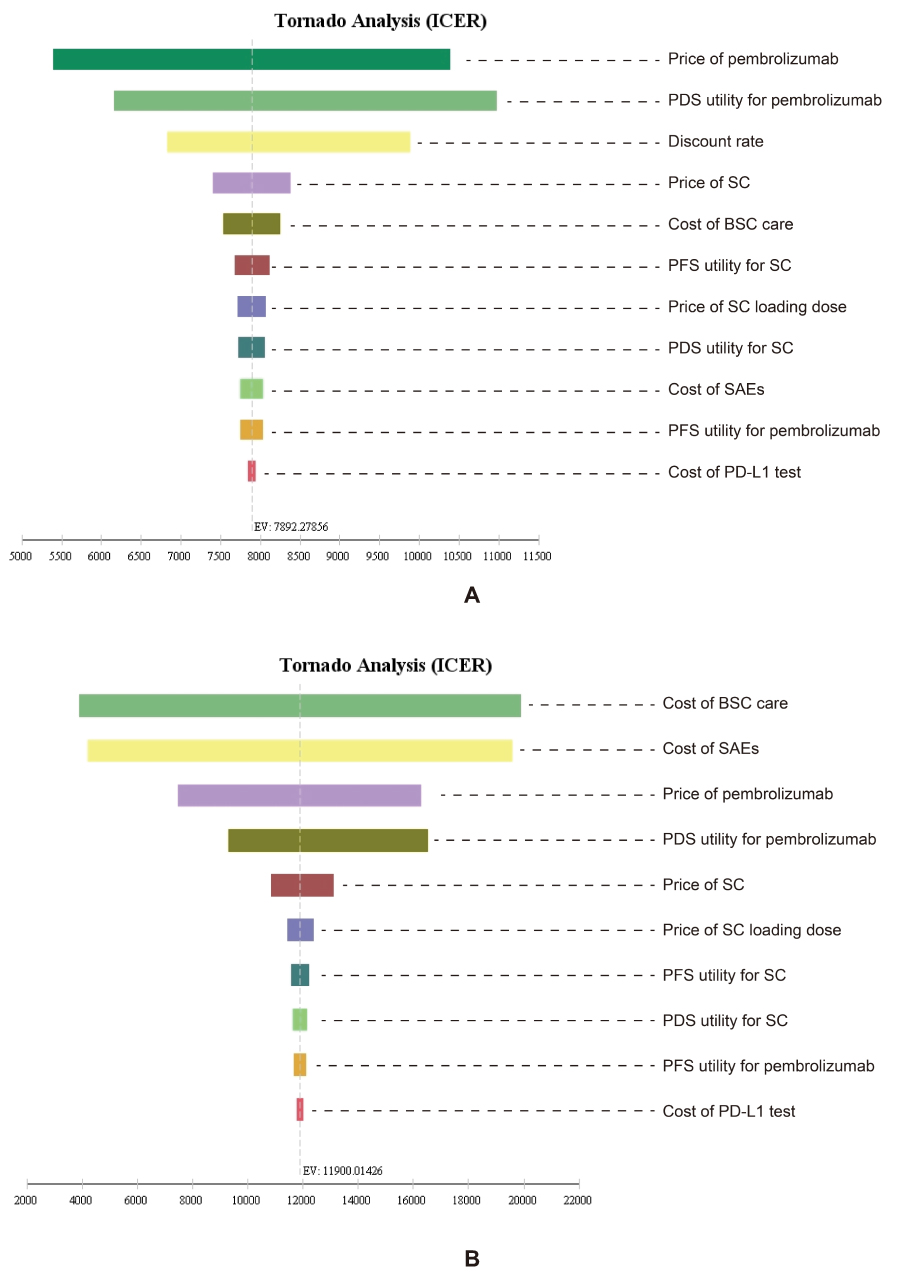 |
Figure 3 One-way sensitivity analyses of pembrolizumab in comparison with the PD-L1 CPS treatment in China (A) and the US (B). Notes: The tornado diagrams show the influence of several factors on the model. The factors are listed in descending order of their influence on ICER. Abbreviations: PFS, progression free survival; PDS, progressive disease survival; SC, standard of care; SC loading dose, standard of care with cetuximab 400 mg/m2, only used in cycle 1; BSC, best supportive care; SAEs, serious adverse events. |
 |
Figure 4 Probabilistic sensitivity analyses for pembrolizumab in comparison with the PD-L1 CPS treatment in China (A) the US (B). Notes: The dot represents the results of the Monte Carlo simulation, and the ellipse represents the 95% confidence interval. The diagonal line represents the WTP. A dot falling below the diagonal line indicates that the test group has a cost effect compared with the corresponding control group. Abbreviations: WTP, willingness to pay; all costs are in US dollars. |
The range of values determined by the two countries and their respective distributions were simulated 1000 times in the Monte Carlo model. The resulting incremental cost-effectiveness scatter plot suggested that the outcomes were below the respective thresholds ($50,000 in the US and $29,306 in China) for both countries (99.9%). The acceptability curves for the four treatment strategies in China and the US are shown in Figure 5. Acceptance rates for pembrolizumab monotherapy without any tests in both countries increased with increasing willingness to pay and exceeded that of the standard group before the country’s threshold of acceptability was reached.
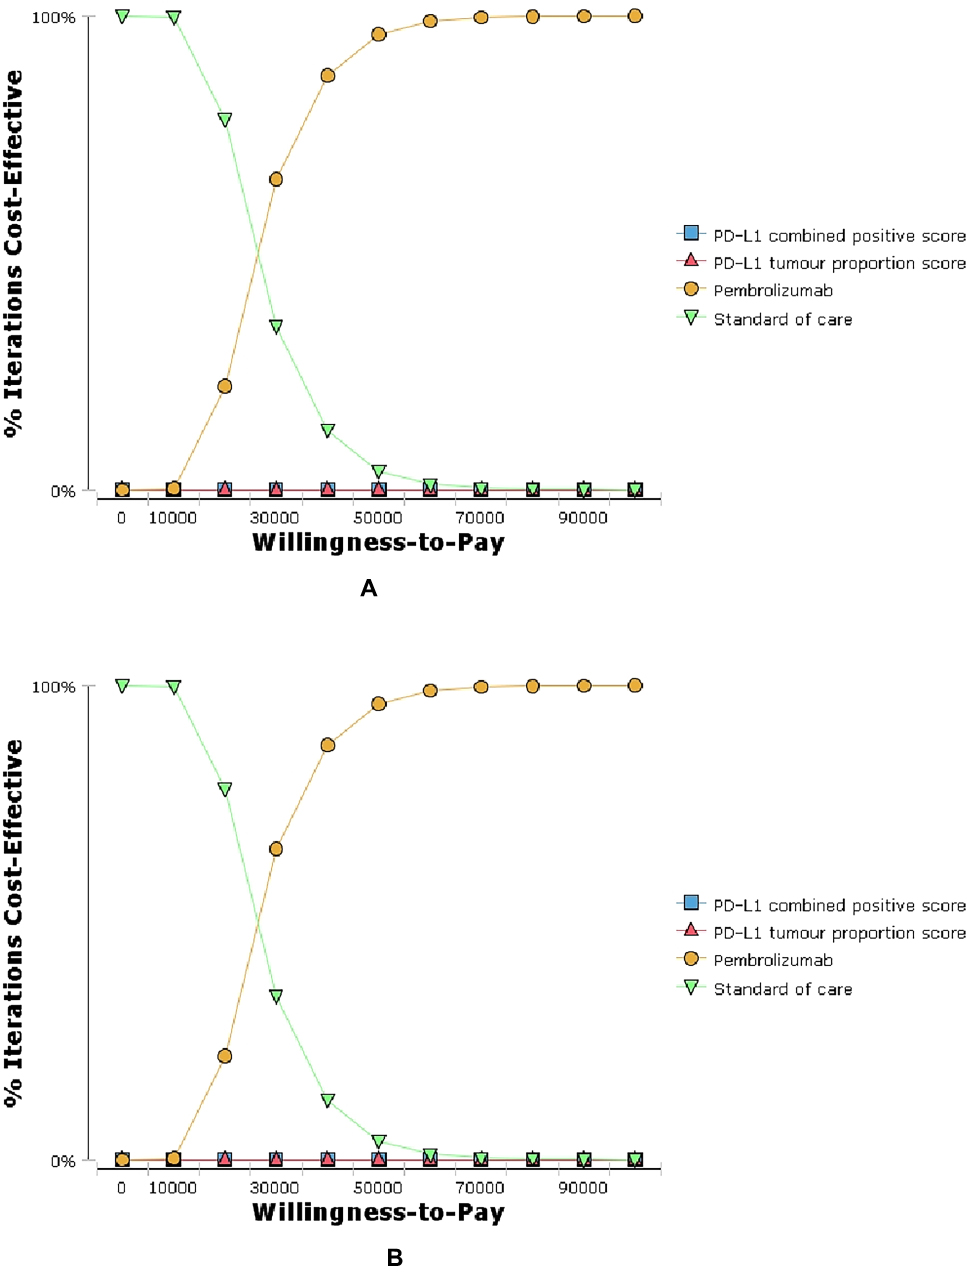 |
Figure 5 Cost-effectiveness acceptability curves (CEAC) of the four treatments in China (A) and the US (B). Notes: The CEAC is a curve used to indicate the probability of a drug being economical. The magnitude of the WTP directly affects the cost effectiveness of the protocol. The acceptable curve shows the percentage of the cost-effectiveness of the simulation by using different treatment options. That is, the function of the relative change in cost effect is the ICER threshold change. |
Discussion
Due to the low cure rate of R/M HNSCC, pembrolizumab, which has recently been approved for use in these patients, is highly expected to improve patients’ quality of life and cure rate. Cost-effectiveness research on HNSCC is used to guide the choice of clinical treatment. Because the prices of drugs and local affordability vary in different regions, cost-effectiveness evaluations must consider several factors. In this study, we used the Markov model to simulate the transformation of the disease, evaluate the cost effectiveness of the four treatment strategies in China and the US, and consider the different treatment costs and willingness to pay between the two countries. We used three times the GDP per capita ($29,306) and $50,000 as acceptable thresholds for China and the US, respectively. Cost-effectiveness and sensitivity analyses confirmed that pembrolizumab is a cost-effective option.
This study obtained the epidemiological data, cost, and utility value of R/M HNSCC from Chinese and American populations and is suitable to describe Chinese and American patients with R/M HNSCC. Since the patients’ disease progression through immunological checkpoint inhibitor therapy differs from that with chemotherapeutic drugs, a certain correction is required for the OS and PFS curves in this study. The log-logistic distribution was applied to correct the curves and ensure that QALYs and probability of metastasis are consistent with the actual situation after treatment with pembrolizumab.
Pembrolizumab has certain cost-effective advantages in China and the US. Since pembrolizumab therapy significantly prolongs the median survival of patients with R/M HNSCC, the QALY value of this treatment strategy is increased. Besides, because the incidence of SAEs in pembrolizumab therapy is very low, with no >5% III or Ⅳ adverse events, the cost of treating SAEs in patients treated with pembrolizumab is low. Moreover, approximately 30% of the patients treated with the higher-cost therapy, cetuximab, leads to a reduction in the cost effectiveness of the standard group.
The factors primarily affecting the results of cost-effectiveness analysis vary. In China, the price of pembrolizumab and the PDS utility value of the disease in patients undergoing treatment with pembrolizumab are the greatest influencing factors; in the US, however, the PDS utility value of patients who received pembrolizumab, the cost of treatment, BSC, and SAEs have a large impact on the cost-effectiveness analysis.
Nivolumab is another PD-1 inhibitor that has received much attention. Recent analyses have revealed the cost-effectiveness of nivolumab in R/M HNSCC in the UK, the US, Canada, Switzerland, and other countries. Unlike pembrolizumab, the results indicate that nivolumab is not the most cost effective option.5,6,15,16 Compared with pembrolizumab, nivolumab has a higher incidence of SAEs, such as pneumonia (5%), hyponatremia (10%), and lymphopenia (16%), despite its affording patients with good prognosis.17 These SAEs will increase the economic burden of patients on the basis of high drug costs, and this factor may be an important reason behind the failure of nivolumab to show a more cost-effective advantage over other drugs. However, the researchers attempted to consider the possibility of long-term survivors by extending the follow-up period to 10 years, and the therapeutic advantages of nivolumab in patients with long-term response were reflected5 In this study, the economics of pembrolizumab was also compared at different follow-up times (5, 10, and 20 years). As the treatment time increased, the cost of each additional QALY of pembrolizumab decreased, and the economics were enhanced. During the 5-year treatment period, pembrolizumab treatment was not the most cost-effective option because some of the patients who responded well to the immunotherapy were not considered for follow-up treatment. In addition, the longer the follow-up time, the higher the health utility of the treatment group with pembrolizumab (Table 4).
This study has the following limitations: First, the clinical trial data of this study were obtained from R/M HNSCC patients who met the conditions in 97 medical centers in 20 countries, rather than clinical trials specifically targeting the Chinese and US populations. Thus, the utility values of different disease states in Chinese and American patients are not differentiated. This problem could blur differences in drug response between Chinese and American patients. However, we considered this shortcoming during single-factor sensitivity analyses and found that fluctuations in utility values do not cause ICERs to exceed acceptable thresholds in the US and China. Second, in this analysis, the utility values of patients with R/M HNSCC under pembrolizumab in this study refer to healthy utility value of nivolumab in previous study, which will exert a certain impact on the analysis results. Nevertheless, considering that the action mode and probability of SAEs of nivolumab are similar to those of pembrolizumab, the difference of the utility between pembrolizumab and nivolumab are not remarkable. Thus, the utility of the disease in this study refers to research from the US on the application of nivolumab to R/M HNSCC. Third, the model designed in this study was based on the simplified development of R/M HNSCC. Therefore, an accurate description of disease progression cannot be made for individual patients. However, in this study, the trend of disease progression was simulated and corrected by the Weibull and log-logistic distributions. Thus, the actual cost of disease and the quality of life of patients were reasonably estimated. Fourth, in this study, only the treatment cost of grade III or Ⅳ SAEs with an incidence >5% was considered, and the effects of immune-related AEs were ignored. The economic advantages of pembrolizumab may be overestimated because the drug showed no >5% grade III or Ⅳ SAEs. In China, cost-effectiveness analysis results were not sensitive to SAE costs and can be ignored. In the US, the cost of SAE treatment is likely to have a great impact on outcomes. However, according to the results of one-way sensitivity analysis, although the cost of SAE treatment had a great impact on outcomes, the ICERs of pembrolizumab compared with PD-L1 CPS treatment did not exceed the threshold within the fluctuation range specified in this study (Figure 3). Thus, the results of this study were not affected by SAEs cost. Fifth, in some studies, the use of cetuximab has been shown to affect the effects of certain PD-1 drugs.18 In this study, we were unable to differentiate patients based on first-line drug therapy, and we could not estimate the impact of first-line treatment on second-line treatment. However, because no studies have confirmed that cetuximab adversely affects the treatment of pembrolizumab, ignoring this effect is reasonable.
Acknowledgment
This work was supported by grants from the National Natural Science Foundation of China [grant number 71804025], Science and Technology Department of Fujian Province of the People’s Republic of China [grant number 2019R0054], Joint Funds for the Innovation of Science and Technology,Fujian Province [Grant number 2018Y9037].
Disclosure
The funders had no role in the study design, data collection and analysis, decision to publish, or preparation of the manuscript. The authors declare that they have no conflicts of interest in this work.
References
1. Kou F, Liu W. Current status and exploration of immunotherapy for recurrent and metastatic squamous cell carcinoma of the head and neck. Chin J Cancer Prev Treat. 2017;24:1102–1108.
2. National Comprehensive Cancer Network (NCCN). Clinical practice guidelines in oncology. Head and Neck Cancers Version 2. Fort Washington: NCCN; 2018. Available from: https://www.nccn.org.
3. Chinese society of clinical oncology guidelines working committee. The Chinese cancer association (CSCO) guidelines for the diagnosis and treatment of head and neck cancers Version 1. 2018.
4. Cohen E, Soulières D, Le Tourneau C, et al. Pembrolizumab versus methotrexate, docetaxel, or cetuximab for recurrent or metastatic head-and-neck squamous cell carcinoma (KEYNOTE-040): a randomised, open-label, phase 3 study. Lancet. 2019;393:156–167. doi:10.1016/S0140-6736(18)31999-8
5. Hirschmann A, Lupatsch JE, Schwenkglenks M, et al. Cost-effectiveness of nivolumab in the treatment of head and neck cancer. Oral Oncol. 2018;87:104–110. doi:10.1016/j.oraloncology.2018.10.032
6. Ward MC, Shah C, Adelstein DJ, et al. Cost-effectiveness of nivolumab for recurrent or metastatic head and neck cancer. Oral Oncol. 2017;74:49–55. doi:10.1016/j.oraloncology.2017.09.017
7. Wu B, Yao Y, Zhang K, Ma X. RAS testing and cetuximab treatment for metastatic colorectal cancer: a cost-effectiveness analysis in a setting with limited health resources. Oncotarget. 2017;8:71164–71172. doi:10.18632/oncotarget.17029
8. Wu B, Zhang Q, Sun J. Cost-effectiveness of nivolumab plus ipilimumab as first-line therapy in advanced renal-cell carcinoma. J Immunother Cancer. 2018;6:124. doi:10.1186/s40425-018-0440-9
9. Fujian province drug equipment joint limited price sunshine purchasing network. Available from: www.fjyxcg.gov.cn/.
10. Yaozhi network. Available from: https://www.yaozh.com/.
11. Insinga RP, Vanness DJ, Feliciano JL, et al. Cost-effectiveness of pembrolizumab in combination with chemotherapy versus chemotherapy and pembrolizumab monotherapy in the first-line treatment of squamous non-small-cell lung cancer in the US. Curr Med Res Opin. 2019;35:1–16.
12. Yu JL, Chan K, Kurin M, et al. Clinical outcomes and cost-effectiveness of primary prophylaxis of febrile neutropenia during adjuvant docetaxel and cyclophosphamide chemotherapy for breast cancer. Breast J. 2015;21:658–664. doi:10.1111/tbj.12501
13. Research group of “evaluation guide of Chinese pharmaceutical economics”. Evaluation guide for Chinese pharmacoeconomics. Chin Pharmacoecon. 2011;3:7–48.
14. National Bureau of Statistics(NBS). Available from: http://www.stats.gov.cn/.
15. Tringale KR, Carroll KT, Zakeri K, Sacco AG, Barnachea L, Murphy JD. Cost-effectiveness analysis of nivolumab for treatment of platinum-resistant recurrent or metastatic squamous cell carcinoma of the head and neck. J Natl Cancer Inst. 2018;110:479–485. doi:10.1093/jnci/djx226
16. Zargar M, McFarlane T, Chan K, Wong W. Cost-effectiveness of nivolumab in recurrent metastatic head and neck squamous cell carcinoma. Oncologist. 2018;23:225–233. doi:10.1634/theoncologist.2017-0277
17. Ang KK, Zhang Q, Rosenthal DI, et al. Randomized phase III trial of concurrent accelerated radiation plus cisplatin with or without cetuximab for stage III to IV head and neck carcinoma: RTOG 0522. J Clin Oncol. 2014;32:2940–2950. doi:10.1200/JCO.2013.53.5633
18. Ferris RL, Blumenschein G
 © 2019 The Author(s). This work is published and licensed by Dove Medical Press Limited. The full terms of this license are available at https://www.dovepress.com/terms.php and incorporate the Creative Commons Attribution - Non Commercial (unported, v3.0) License.
By accessing the work you hereby accept the Terms. Non-commercial uses of the work are permitted without any further permission from Dove Medical Press Limited, provided the work is properly attributed. For permission for commercial use of this work, please see paragraphs 4.2 and 5 of our Terms.
© 2019 The Author(s). This work is published and licensed by Dove Medical Press Limited. The full terms of this license are available at https://www.dovepress.com/terms.php and incorporate the Creative Commons Attribution - Non Commercial (unported, v3.0) License.
By accessing the work you hereby accept the Terms. Non-commercial uses of the work are permitted without any further permission from Dove Medical Press Limited, provided the work is properly attributed. For permission for commercial use of this work, please see paragraphs 4.2 and 5 of our Terms.