")
Back to Journals » ClinicoEconomics and Outcomes Research » Volume 9
Cost analysis of facial injury treatment in two university hospitals in Malaysia: a prospective study
Authors Saperi BS, Ramli R, Ahmed Z, Muhd Nur A , Ibrahim MI, Rashdi MF, Nordin R, Rahman NA, Yusoff A, Nazimi AJ, Abdul Rahman R, Abdul Razak N, Mohamed N
Received 16 August 2016
Accepted for publication 14 December 2016
Published 7 February 2017 Volume 2017:9 Pages 107—113
DOI https://doi.org/10.2147/CEOR.S119910
Checked for plagiarism Yes
Review by Single anonymous peer review
Peer reviewer comments 2
Editor who approved publication: Professor Giorgio Colombo
Bin Sulong Saperi,1 Roszalina Ramli,2 Zafar Ahmed,1 Amrizal Muhd Nur,1 Mohd Ismail Ibrahim,3 Muhd Fazlynizam Rashdi,2 Rifqah Nordin,2 Normastura Abd Rahman,4 Azizah Yusoff,4 Abd Jabar Nazimi,2 Roselinda Abdul Rahman,4 Noorhayati Abdul Razak,4 Norlen Mohamed 5
1International Centre for Casemix and Clinical Coding, Universiti Kebangsaan Malaysia Medical Centre, Kuala Lumpur, 2Department of Oral and Maxillofacial Surgery, Universiti Kebangsaan Malaysia Medical Centre, Kuala Lumpur, 3Department of Community Medicine, School of Medical Sciences, Universiti Sains Malaysia, Kubang Kerian, 4School of Dental Sciences, Universiti Sains Malaysia, Kubang Kerian, 5Malaysian Institute of Road Safety Research, Kuala Lumpur, Malaysia
Objective: Facial injury (FI) may occur in isolation or in association with injuries to other parts of the body (facial and other injury [FOI]). The objective of this study was to determine the direct treatment costs incurred during the management of facial trauma.
Materials and methods: A prospective cohort study on treatment cost for FIs and FOIs due to road-traffic crashes in two university hospitals in Malaysia was conducted from July 2010 to June 2011. The patients were recruited from emergency departments and reviewed after 6 months from the date of initial treatment. Direct cost analysis, comparison of cost and length of hospital stay, and Injury Severity Score (ISS) were performed.
Results: A total of 190 patients were enrolled in the study, of whom 83 (43.7%) had FI only, and 107 (56.3%) had FOI. The mean ISS was 5.4. The mean length of stay and costs for patients with FI only were 5.8 days with a total cost of US$1,261.96, whereas patients with FOI were admitted for 7.8 days with a total cost of US$1,716.47. Costs doubled if the treatment was performed under general anesthesia compared to local anesthesia.
Conclusion: Treatment of FI and FOI imposes a financial burden on the health care system in Malaysia.
Keywords: facial injury, road traffic crashes, cost analysis, university hospitals, Malaysia
Introduction
Road traffic crashes (RTCs) are a leading cause for the global burden of disease and injury1,2 and an acknowledged major public health problem. The Decade of Action for Road Safety 2011–2020 was declared by the United Nations Assembly in an effort to address the problem. According to the World Health Organization, middle-income countries have the highest rates of fatality compared to low- or high-income countries.3 This stands true in Malaysia, where the vast majority of injuries are related to RTCs. RTCs are ranked as the fourth highest cause of death (8.03%) and the seventh highest reason for admission to public hospitals (4.85%).4 Statistics provided by the Malaysian Institute of Road Safety Research showed that in 2010, 414,421 RTCs occurred, resulting in 28,269 casualties and 6,872 deaths.5 This huge figure inflicts a massive cost burden on society.
In a high-income country like the US, the cost of fatal or nonfatal RTCs was estimated to be US$99 billion.6 A publication from Malaysia reported that the costs involved in RTCs was RM623.5 million, which was equivalent at the time to US$243.6 million (at an exchange rate of US$1= RM2.56 in 1988).7
Oral and maxillofacial injuries are among the most common injuries occurring in RTCs.8,9 The facial area is susceptible to injury resulting from the impact of an accident, as it is the most exposed part of the body.10 Several studies have reported the incidence and treatment of facial injury (FI);11–13 however, the actual cost of managing these injuries is not frequently reported. In addition, there are no local or regional data on economic loss due to FI.
Studies specific to the costs of FI have been conducted in other countries, particularly those with high income. A study in North Carolina showed that the mean hospital charge for inpatients with isolated facial fractures admitted directly from the emergency department was significantly higher (US$3,556.66; length of stay [LOS]: 2 days) compared to similarly injured patients admitted electively as outpatients, with no significant differences in complication rate. This indicated a significant decrease in cost for patients admitted with scheduled surgery compared with urgent admission from the emergency department.14 Most trauma cases in Malaysia are admitted through emergency departments. This prospective study was conducted in two tertiary care centers to determine the direct treatment costs incurred in managing facial trauma caused by RTCs.
Materials and methods
This study was approved by the ethics committees of Universiti Kebangsaan Malaysia (1.5.3.5/FG-002-2010) and Universiti Sains Malaysia (USMKK/PPP/JePeM/217.3.06). A prospective cohort study was conducted to determine the etiology and cost of managing facial trauma due to RTCs in two university hospitals in Malaysia from July 2010 to June 2011. The patients were recruited from the emergency departments and reviewed after 6 months from the date of the initial treatment to ascertain the usage of health care facilities. The two study sites were Universiti Kebangsaan Malaysia Medical Centre in Kuala Lumpur and Hospital Universiti Sains Malaysia in Kota Bharu. Both have large medical facilities, with 1,040 and 747 beds, respectively.
Inclusion criteria were patients with FIs sustained as the result of RTCs, and treated in the selected hospitals until fit to be discharged. Patients were excluded from the study if they 1) were dead on arrival, 2) had been transferred from other hospitals, as hospital costs are different, or 3) did not provide consent to participate in this study. Informed consent was provided by all the selected patients.
FI is defined as any injury that occurs between the hairline and the chin region. Body injuries include injuries that occur on other body parts except the face. Demographic and clinical data were obtained from the patients’ medical records. Injury severity was assessed using the Glasgow Coma Scale (GCS)15 and the Abbreviated Injury Scale (AIS).16 GCS scores range from 3 to 15, with a score of >12 indicating mild injury, a score of 9–12 indicating moderate injury, and a score of <9 indicating severe brain injury.15 In this study, we used the GCS score that had been documented upon presentation at emergency departments.
The AIS measures severity according to injuries sustained in six regions of the body: head and neck, face, chest, abdomen, extremities, and the external.16 Following that, the Injury Severity Score (ISS) was calculated.17 ISS values range from 0 to 75, with higher values indicating greater severity.17 Mild injury is defined as scores <9, followed by moderate injury (9–15), severe (16–25), and very severe (>25).17,18 In addition, the Maximum AIS (MAIS) is used to determine the most severe injury within a body region, especially when multiple injuries are present.
Patient care was categorized as inpatient care or outpatient care. Inpatient care may involve single or multiple hospital admissions. The length of hospitalization is described as LOS, calculated according to number of days stay in the respective wards. The cost of treatment included direct costs incurred by the hospitals, consisting of all admissions and outpatient visits for 6 months from the initial treatment. The cost of treatment was calculated using the top-down costing methodology based on the unit cost of in-hospital medical care.
Using the hospital case-mix system, the costs took into account differences in severity and incorporated direct medical costs incurred by the hospital in providing medical care, as well as overhead costs, administration costs, pharmacy and laboratory department overheads, as well as other support costs.19 An additional cost that involved the plating system was included into the total payment when an open reduction and internal fixation was performed.
This study applied an annual discount rate of 5% for all capital costs to the net present value at 2010, the study reference year. Buildings were depreciated over a period of 20 years, while equipment was depreciated over a period of 5 years. Only capital inputs used within the activity scope of this study were considered.
Step-down costing was performed to determine the cost of managing FIs and facial and other injuries (FOIs) in both hospitals based on the patient characteristics. All costs were converted to US$ values based on the average exchange rate during the study period (US$1 was equivalent to RM3.1.20
Statistical analysis
Data analysis was carried out using PASW, version 18 (SPSS, Chicago, IL, USA). Descriptive analyses were performed, and are presented as means and standard deviation (SD) for numerical variables or frequency and percentage for categorical variables. The χ2 test or Fisher’s exact test was carried out for comparisons among independent categorical variables (age groups, sex, level of education, ISS categories, GCS categories, discharge outcome, and number of admissions) and dependent categorical variables (FI, FOI and injury severity). For comparison between each independent numerical variable (age, ISS, LOS, inpatient cost for admission), FI and FOI, Student’s t-test was used. Analysis of variance (ANOVA) was used for comparison between each independent numerical variable (LOS and inpatient cost for admission) and injury severity. Normality was checked prior to the use of t-test or ANOVA. The level of significance was set at P<0.05.
Results
A total of 190 patients who fulfilled the inclusion criteria at the two emergency departments were recruited into the study: 83 (43.7%) had FI only, and the remaining 107 (56.3%) had FOI, as shown in Table 1. Most of the patients had a secondary level of education (n=149, 78.4%). They were mostly males (n=158, 83.2%) with a mean age of 28 years (SD= 15.3). There were no statistically significant differences in age, sex, or education level between patients with FI and FOI. Most of the patients (n=171, 90%) sustained mild injury, with a mean ISS of 5.4 (SD= 4.2). Patients with FOI had significantly greater mean ISS than those with FI only (8.1 vs 1.9, P<0.001) (Table 1).
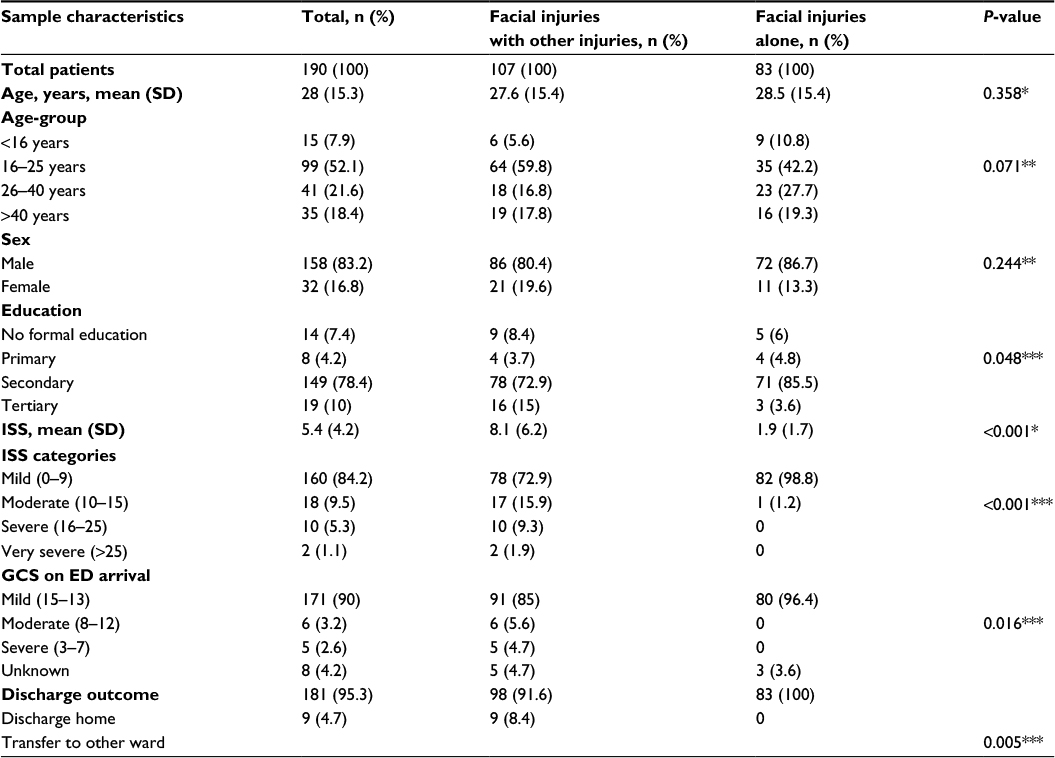 | Table 1 Descriptive data on patients who sustained facial injuries alone and facial injuries with other injuries Notes: *Student’s t-test; **Pearson’s χ2; ***Fisher’s exact test. Data presented as n (%) unless stated otherwise. Abbreviations: SD, standard deviation; ISS, Injury Severity Score; GCS, Glasgow Coma Scale; ED, emergency department. |
Hospitalization was required for 63.6% of patients treated for FOI compared to 22.9% of patients presenting with FI only (22.9%), as shown in Table 2. The majority of patients admitted for FOI (n=58, 54.2%) and FI only (n=16, 19.3%) required one hospital admission only. Nine patients with FOI were admitted twice (8.4%), and one patient was admitted four times (0.9%). In the FI-only group, two patients (2.4%) were admitted twice and one was admitted three times (1.2%). The mean LOS per admission was longer for patients with FOI (7.8 days) compared to patients with FI only (5.8 days), and this was shown to be statistically significant (P<0.05) (Table 2).
 | Table 2 Hospital admission according to injury type Notes: *Fisher’s exact test; **Student’s t-test. Data presented as n (%) unless stated otherwise. Abbreviations: SD, standard deviation; LOS, length of stay. |
Patients with FOI had higher treatment costs, with a mean cost of US$1,716.47, compared to patients admitted for FI only, with a mean cost of US$1,261.96 (P<0.05), as shown in Table 3. Graded by ISS, the majority of the patients (84.2%) fell into the mild category, followed by moderate (9.5%), severe (5.3%), and very severe (1.1%) as shown in Table 4.
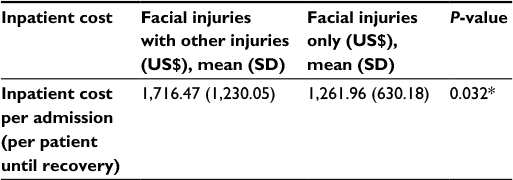 | Table 3 Cost by injury type Note: *Student’s t-test. Abbreviation: SD, standard deviation. |
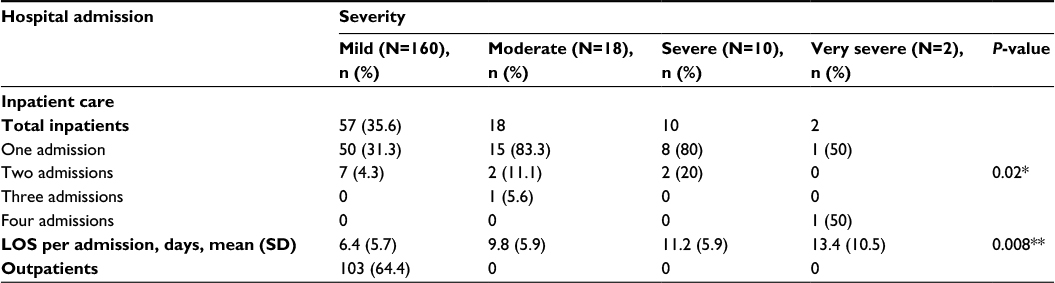 | Table 4 Hospital admission according to injury severity Notes: *Pearson’s χ2; **Student’s t-test. Data presented as n (%) unless stated otherwise. Abbreviations: SD, standard deviation; LOS, length of stay. |
For patients with multiple admissions, 4.3% of patients (seven patients) with mild injury were admitted twice. Two patients (11.1%) with moderate injury were admitted twice, and one patient (5.6%) was admitted three times. Two patients (20%) with severe injury were admitted twice. One patient (50%) with very severe injury was admitted four times. The average lengths of stay for mild, moderate, severe, and very severe injuries were 6.4, 9.8, 11.2, and 13.4 days, respectively (Table 4).
The mean costs for LOS by severity were US$1,335.23 for mild, US$2,044.57 for moderate, US$2,336.66 for severe, and US$2,795.64 for very severe patients, as shown in Table 5. Statistically significant differences were found in the number of admissions (P<0.05), LOS per admission (P<0.05), and inpatient hospital cost according to LOS with injury severity (P<0.05) as shown in Tables 4 and 5.
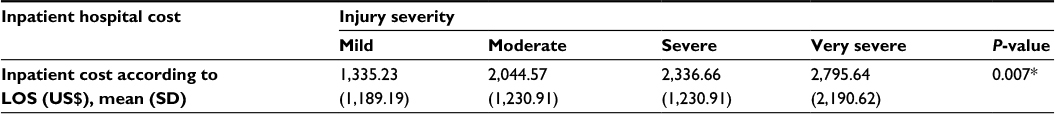 | Table 5 Inpatient hospital cost according to LOS and injury severity Note: *Analysis of variance. Cost of inpatient US$208.63 per day. Abbreviations: LOS, length of stay; SD, standard deviation. |
Treatment costs for some common procedures in one of the university hospitals are shown in Table 6. The costs shown were estimated from the actual cost and following subsidization by the government. The costs doubled if the treatment was performed under general anesthesia (GA) compared to local anesthesia (LA). For example, wound cleansing and suturing under LA cost US$93.80–$110.50 compared to US$277.70 under GA. Similarly, a doubling in cost was also observed in closed reduction of mandibular fractures under GA compared to LA.
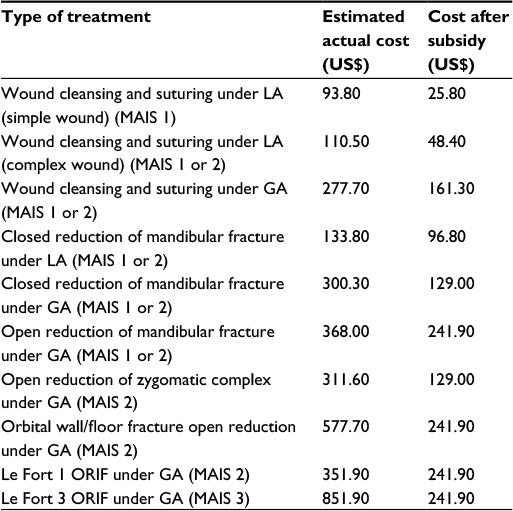 | Table 6 Costs for various treatments in one of the university hospitals Abbreviations: LA, local anesthesia; MAIS, Maximum Abbreviated Injury Scale; GA, general anesthesia; ORIF, open reduction and internal fixation. |
MAIS 2 fracture treatment costs ranged between US$133.80 and US$577.70. MAIS 3 fracture treatment was shown to be US$851.90. Moreover, an extra cost, usually between US$322.6 and US$483.9, is included in a patients’ final payment if a plating system is used. This cost increases with the number of miniplates and screws (Table 6).
Discussion
The most common injuries sustained in RTCs were lacerations and open wounds (50.7%) and superficial wounds (29.2%).21 These types of injuries were also common in other parts of the body, such as the head, chest, abdomen, and spine.22,23 Many of the RTC-related injuries contribute to a range of morbidities, and there have been earlier studies ascertaining the prevalence of facial injuries in Malaysia.11,24,25 However, despite the possibility of substantial health and burden of injuries, there has not been any research conducted to estimate the cost of managing these injuries. This study attempted to provide some insight into the costs related to FIs in the country.
This study showed that patients with FI were hospitalized for an average of 5.8 days, whereas patients with FOI had a longer LOS of 7.8 days. This result was consistent with previous studies that reported longer duration for treatment and recovery in patients with multiple injuries.14,26,27 Similarly, patients with mild injury (ISS <9) had shorter LOS (6.4 days) compared with patients with very severe injury (ISS >25, LOS=13.4 days).
The results were consistent with the expectation that the more severe the injury, the longer the LOS, as treatment and recovery for more severely affected patients takes a longer time. Multiple hospital admissions to manage a fracture are common in maxillofacial practice in this country. The first admission is related to emergency or urgent treatment, which includes pain control and feeding. The patient will be discharged and return the next few days for an elective admission for surgery. The reason for this practice is the unavailability of the GA session during the first admission.
The inpatient cost per admission for FOI was US$1,716.47, while for patients with FI it was US$1,261.96. This cost was without plating system usage. With the use of a plating system, an additional cost of US$322.6–$483.9 was imposed on patients. The cost per admission increased with higher severity scores. These results are consistent with findings from other studies.28–31 The most significant cost-related factors in this study were LOS, severity, and type of injury.
US hospital ward charges alone can vary between US$2,759 and US$5,041, and if an operating theater is included, then charges can vary between US$5,792 and US$8,069.32 The health system in high-income countries like the US differs very much compared to the health system in a middle-income country like Malaysia. The majority of hospital care in Malaysia is still dominated by the public or government sector. Generally, the Malaysian government supports 98% of the health costs for every patient.33 A 2010 Malaysian government financial report showed that 4.4% of gross domestic product was allocated to health care.34
Hospital costs (except plating system cost) are waived for all government employees and pensioners. Whether in full or partial, waivers are provided to senior citizens, as well as government school students and persons with disabilities. There are some differences in costing between the Ministry of Health (MOH) and the Ministry of Education hospitals (or university hospitals).35 There are >130 MOH hospitals and three university hospitals in Malaysia.
Zaloshnja et al showed in the US that the medical costs for MAIS 1 and 2 of nonfracture cases were US$959 and US$9,540, respectively. Additionally, MAIS 1, 2, and 3 fracture cases cost US$2,370, US$3,730, and US$5,091, respectively.36 In Australia, treatment of mandibular fractures was shown to be AU$793–$12,780, orbital fractures AU$6,991–$14,339, zygomatic complex AU$5,448–$14,512, and maxillary sinus AU$8,385–$15,772.31
In addition, Naumann et al in the US estimated that total medical and lost productivity costs of all injuries were US$99 billion in 2005.6 Of the $99 billion, the costs of managing nonfatal hospitalized injuries were US$28 billion, whereas the costs for treatment at the emergency department followed by release were US$14 billion.6 Nonfatal injuries would have included injuries similar to those examined in our study. Therefore, the total economic costs of even minor nonfatal injuries can be significant when other economic costs are taken into account.
Limitations
There were several limitations to this study. Firstly, the study obtained primary data from two hospitals only, both tertiary care centers, and may not be representative of all Malaysian hospitals. A bigger sample drawn from more diverse health institutions, particularly from MOH hospitals, would increase the representativeness of the study results. However, the cost needs to be calculated as actual cost and not subsidized cost, as MOH hospitals are heavily subsidized by the government.
Secondly, this study addressed only direct medical cost incurred in the emergency department, ward, operating theater, pharmacy, and outpatient clinic. Information from the time of the crash through prehospital management to completion of treatment (including rehabilitation) would provide sufficient data for economic planning that includes preventive strategies.
Conclusion
This study found that FOI incurs greater costs than FI alone. The cost increases with severity of injury, hospital LOS, type of anesthesia, and operating theater involvement. It is hoped that these findings are helpful in understanding the medical costs incurred by health care institutions that provide care for these injuries. Further research should be conducted to attain better representativeness of the Malaysian population, as well as gain better insight into the types of accidents and vehicles involved. In addition, the economic costs of all injuries caused by RTCs should be undertaken. Additional information would allow better decision making by health care providers and policy makers.
Acknowledgment
The project was fully supported by the Malaysian Institute of Road Safety Research (grant number 10-21-0202-003).
Disclosure
The authors report no conflicts of interest in this work.
References
Krug EG, Sharma GK, Lozano R. The global burden of injuries. Am J Public Health. 2000;90(4):523–526. | ||
Nantulya VM, Reich MR. The neglected epidemic: road traffic injuries in developing countries. BMJ. 2002;324(7346):1139–1141. | ||
World Health Organization. The road traffic death rate by WHO region and income level. 2013. Available from: http://www.who.int/gho/road_safety/en. Accessed December 20, 2016. | ||
Ministry of Health Malaysia. Health Facts 2009. Kuala Lumpur: MOH; 2010. | ||
Malaysian Institute of Road Safety Research. General road accident data in Malaysia (1995–2010). 2013. Available from: https://www.miros.gov.my/1/page.php?id=17. Accessed January 9, 2017. | ||
Naumann RB, Dellinger AM, Zaloshnja E, Lawrence BA, Miller TR. Incidence and total lifetime costs of motor vehicle-related fatal and nonfatal injury by road user type, United States, 2005. Traffic Inj Prev. 2010;11(4):353–360. | ||
Arokiasamy JT, Krishnan R. Some epidemiological aspects and economic costs of injuries in Malaysia. Asia Pac J Public Health. 1994;7(1):16–20. | ||
Singh R, Singh HK, Gupta SC, Kumar Y. Pattern, severity and circumstances of injuries sustained in road traffic accidents: a tertiary care hospital-based study. Indian J Community Med. 2014;39(1):30–34. | ||
Adebayo ET, Ajike OS, Adekeye EO. Analysis of the pattern of maxillofacial fractures in Kaduna, Nigeria. Br J Oral Maxillofac Surg. 2003;41(6):396–400. | ||
Adeyemo WL, Ladeinde AL, Ogunlewe MO, James O. Trends and characteristics of oral and maxillofacial injuries in Nigeria: a review of the literature. Head Face Med. 2005;1:7. | ||
Hussaini HM, Rahman NA, Rahman RA, Nor GM, Al Idrus SM, Ramli R. Maxillofacial trauma with emphasis on soft-tissue injuries in Malaysia. Int J Oral Maxillofac Surg. 2007;36(9):797–801. | ||
van Beek GJ, Merkx CA. Changes in the pattern of fractures of the maxillofacial skeleton. Int J Oral Maxillofac Surg. 1999;28(6):424–428. | ||
Adekeye EO. The pattern of fractures of the facial skeleton in Kaduna, Nigeria: a survey of 1,447 cases. Oral Surg Oral Med Oral Pathol. 1980;49(6):491–495. | ||
Sanger C, Argenta LC, David LR. Cost-effective management of isolated facial fractures. J Craniofac Surg. 2004;15(4):636–642. | ||
Teasdale G, Jennett B. Assessment of coma and impaired consciousness: a practical scale. Lancet. 1974;2(7872):81–84. | ||
Gennarelli TA, Wodzin E, editors. Abbreviated Injury Scale 2005: Update 2008. Barrington (IL): Association for the Advancement of Automotive Medicine; 2008. | ||
Baker SP, O’Neill B, Haddon W Jr, Long WB. The injury severity score: a method for describing patients with multiple injuries and evaluating emergency care. J Trauma. 1974;14(3):187–196. | ||
Bolorunduro OB, Villegas C, Oyetunji TA, et al. Validating the injury severity score (ISS) in different populations: ISS predicts mortality better among Hispanics and females. J Surg Res. 2011;166(1):40–44. | ||
Aljunid SM, Hamzah SM, Mutalib SA, Nur AM, Shafie N, Sulong S. The UNU-CBGs: development and deployment of a real international open source Casemix grouper for resource challenged countries. BMC Health Serv Res. 2011;11 Suppl 1:A4. | ||
Bank Negara Malaysia. Exchange rates. Available from: http://www.bnm.gov.my/index.php?ch=statistic&pg=stats_exchangerates. Accessed March 1, 2013. | ||
Rampal KG, Shaharudin R, Ali R, et al. The Third National Health and Morbidity Survey 2006 (NHMS III): Injury and Risk Reduction Practice. Kuala Lumpur: Ministry of Health; 2008. | ||
Ali F, Gwenmesia I, Simmons J. Maxillofacial trauma. In: Hettiarachy S, Ali F, Gwenmesia I, Simmons J, editors. Plastic Surgery: A Problem Based Approach. London: Springer; 2012:93–102. | ||
Akama MK, Chindia ML, Macigo FG, Guthua SW. Pattern of maxillofacial and associated injuries in road traffic accidents. East Afr Med J. 2007;84(6):287–295. | ||
Ramli R, Rahman NA, Rahman RA, Hussaini HM, Hamid AL. A retrospective study of oral and maxillofacial injuries in Seremban Hospital, Malaysia. Dent Traumatol. 2011;27(2):122–126. | ||
Hashim H, Iqbal S. Motorcycle accident is the main cause of maxillofacial injuries in the Penang mainland, Malaysia. Dent Traumatol. 2011;27(1):19–22. | ||
Wong EC, Marshall GN. Barriers to the collaborative care of patients with orofacial injury. Oral Maxillofac Surg Clin North Am. 2010;22(2):247–250. | ||
Ravindran V, Nair KS. Meta-analysis of maxillofacial trauma in the northern districts of Kerala: one year prospective study. J Maxillofac Oral Surg. 2011;10(4):321–327. | ||
Bagheri SC, Dierks EJ, Kademani D, et al. Application of a facial injury severity scale in craniomaxillofacial trauma. J Oral Maxillofac Surg. 2006;64(3):408–414. | ||
Furr AM, Schweinfurth JM, May WL. Factors associated with long-term complications after repair of mandibular fractures. Laryngoscope. 2006;116(3):427–430. | ||
Kudebong M, Wurapa F, Nonvignon J, Norman I, Awoonor-Williams JK, Aikins M. Economic burden of motorcycle accidents in northern Ghana. Ghana Med J. 2011;45(4):135–142. | ||
Moncrieff NJ, Qureshi C, Deva AK. A comparative cost analysis of maxillofacial trauma in Australia. J Craniofac Surg. 2004;15(4):686–691. | ||
David LR, Bisseck M, Defranzo A, Marks M, Molnar J, Argenta LC. Cost-based analysis of the treatment of mandibular fractures in a tertiary care center. J Trauma. 2003;55(3):514–517. | ||
Sun Daily. Gov’t hospital charges are cheapest in the world, says Najib. 2015. Available from: http://www.thesundaily.my/news/1342018. Accessed March 12, 2015. | ||
Economist Intelligence Unit. Malaysia: healthcare and pharmaceuticals report. 2011. Available from: www.eiu.com. Accessed November 21, 2011. | ||
Nordin R, Rahman NA, Rashdi MF, et al. Oral and maxillofacial trauma caused by road traffic accident in two university hospitals in Malaysia: a cross-sectional study. J Oral Maxillofac Surg Med Pathol. 2015;27(2):166–171. | ||
Zaloshnja E, Miller T, Romano E, Spicer R. Crash costs by body part injured, fracture involvement, and threat-to-life severity: United States, 2000. Accid Anal Prev. 2004;36(3):415–427. |
 © 2017 The Author(s). This work is published and licensed by Dove Medical Press Limited. The full terms of this license are available at https://www.dovepress.com/terms.php and incorporate the Creative Commons Attribution - Non Commercial (unported, v3.0) License.
By accessing the work you hereby accept the Terms. Non-commercial uses of the work are permitted without any further permission from Dove Medical Press Limited, provided the work is properly attributed. For permission for commercial use of this work, please see paragraphs 4.2 and 5 of our Terms.
© 2017 The Author(s). This work is published and licensed by Dove Medical Press Limited. The full terms of this license are available at https://www.dovepress.com/terms.php and incorporate the Creative Commons Attribution - Non Commercial (unported, v3.0) License.
By accessing the work you hereby accept the Terms. Non-commercial uses of the work are permitted without any further permission from Dove Medical Press Limited, provided the work is properly attributed. For permission for commercial use of this work, please see paragraphs 4.2 and 5 of our Terms.