")
Back to Journals » Neuropsychiatric Disease and Treatment » Volume 14
Cortical gyrification in schizophrenia: current perspectives
Received 23 March 2018
Accepted for publication 15 June 2018
Published 19 July 2018 Volume 2018:14 Pages 1861—1869
DOI https://doi.org/10.2147/NDT.S145273
Checked for plagiarism Yes
Review by Single anonymous peer review
Peer reviewer comments 2
Editor who approved publication: Dr Taro Kishi
Yukihisa Matsuda,1 Kazutaka Ohi2,3
1Faculty of Pharmacy and Pharmaceutical Sciences, Fukuyama University, Hiroshima, Japan; 2Department of Neuropsychiatry, Kanazawa Medical University, Ishikawa, Japan; 3Medical Research Institute, Kanazawa Medical University, Ishikawa, Japan
Abstract: The cerebral cortex of the human brain has a complex morphological structure consisting of folded or smooth cortical surfaces. These morphological features are referred to as cortical gyrification and are characterized by the gyrification index (GI). A number of cortical gyrification studies have been published using the manual tracing GI, automated GI, and local GI in patients with schizophrenia. In this review, we highlighted abnormal cortical gyrification in patients with schizophrenia, first-episode schizophrenia, siblings of patients, and high-risk and at-risk individuals. Previous researches also indicated that abnormalities in cortical gyrification may underlie the severity of clinical symptoms, neurological soft signs, and executive functions. A substantial body of research has been conducted; however, some researches showed an increased GI, which is called as “hypergyria,” and others showed a decreased GI, which is called as “hypogyria.” We discussed that different GI methods and a wide variety of characteristics, such as age, sex, stage, and severity of illness, might be important reasons for the conflicting findings. These issues still need to be considered, and future studies should address them.
Keywords: schizophrenia, cortical gyrification, gyrification index
Introduction
Several brain structural abnormalities in schizophrenia have been demonstrated by a large number of computed tomographic and MRI studies. These findings have most commonly been demonstrated by region of interest (ROI) studies, and a more detailed examination has been achieved by voxel-based morphometry (VBM) studies. Meta-analytic reviews of ROI and VBM studies have consistently shown that schizophrenia is associated with a reduction in gray matter volume and indicated that the frontal lobe, anterior cingulate gyrus, thalamus, superior temporal gyrus, and left medial temporal lobe are key regions for structural deficits.1–5 A consensus has emerged that schizophrenia arises, at least in part, due to abnormalities in brain development.6–8 Over the last two decades, surface-based morphometry (SBM) techniques, such as the FreeSurfer software package (https://surfer.nmr.mgh.harvard.edu/), have been developed, enabling the examination of various brain features that are not limited to volume but also include surface area, curvature, cortical thickness,9–29 and cortical gyrification.30
The cerebral cortex of the human brain has a complex morphological structure that consists of folded or smooth cortical surfaces. These morphological features are called cortical gyrification (or cortical folding) and are characterized by the gyrification index (GI). The GI is the ratio between the complete superficial contour (“the pial surface”) and the outer contour of the cortical part of the cortex (“the outer smoothed surface”).31–33 The cortical gyrification represented by the GI in schizophrenia is of great interest because alterations in cortical gyrification may reflect an underlying disorder in neural connectivity during the maturation of the brain.34,35
Development of a measure of the GI
In early studies on cortical gyrification, the pial surface (Figure 1A, red) and outer smoothed surface (Figure 1A, green) are used to calculate the ratio because the GI is traced manually in 2D space, such as in the coronal plane for MRI data36 or in a postmortem brain.32,37 This method, called the manual tracing GI, is used in initial studies of cortical gyrification in schizophrenia; however, this method has some limitations. The human brain is very complex and is hard to trace precisely, so the sensitivity of the manual trace of the human brain can easily be lost due to the heterogeneity of the disorder group and/or the healthy control group. Thus, results from the manual tracing GI are less accurate and repeatable. Moreover, due to hand tracing requirements, the time and costs of implementing in vivo manual tracing GI are significant.38
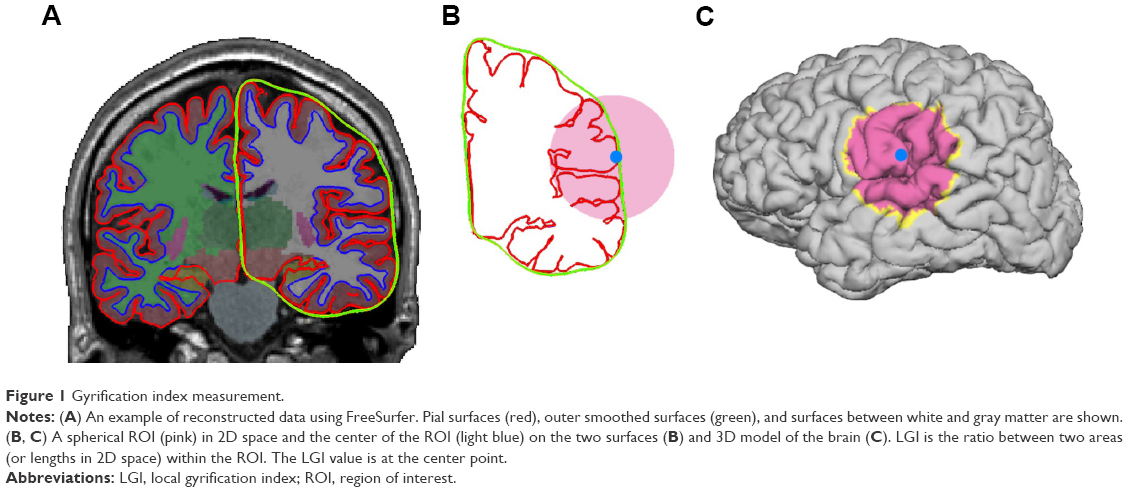 | Figure 1 Gyrification index measurement. |
The automated GI (A-GI)38,39 enables the ability to trace the pial surface and outer smoothed surface automatically and also to analyze the surfaces with segmented ROIs, such as the whole prefrontal lobe38 and four segmented prefrontal lobes.40 However, the manual tracing and A-GI are biased by the slice orientation and/or by the presence of buried sulci, and these methods have only been used to explore broad regional differences without targeting anatomically defined gyri and sulci.
The local GI (LGI), which is performed by FreeSurfer, is a measurement based on the SBM technique. The pial surface is defined automatically, and the outer smoothed surface is mathematically determined. The accuracy and repeatability of the LGI are maintained at higher levels compared with those of the manual tracing GI method. In the FreeSurfer pipeline, MRI data, which is in 2D space, are reconstructed into 3D models that consist of over 300,000 vertexes (Figure 1C). Each vertex has an LGI value, which is the ratio of the pial surface and outer smoothed surface within a spherical ROI (Figure 1B, C).30 The LGI method enables whole brain analysis and ROI analysis with 40–74 cortical parcellations in each hemisphere.11,15,41 Today, measurement of the LGI is widely accepted and used in psychiatric studies, such as in first-episode psychosis,42 depression,43 mental retardation,44 22q11 deletion,45 and schizophrenia.
Biology of cortical gyrification
The GI increases rapidly and reaches a transient maximum between weeks 66 and 80 postconception. Then, the GI decreases by 18% from the maximal value to the adult level, which is reached at an age of almost 23 years.32–34 From birth to 2 years of age, there is regionally heterogeneous cortical gyrification development, with high growth regions located in the association cortex and low growth regions located in sensorimotor, auditory, and visual cortices.46 The regional heterogeneity of cortical gyrification is also confirmed by the decreasing phase. In a study investigating alternations in the GI between 20 and 85 years using the LGI method, the LGI was decreased until 85 years of age in the whole brain but was strongly decreased in the postcentral, supramarginal, and inferior parietal lobes (IPLs). The decreasing functions of LGI vary between regions, and the LGI in the frontal lobe decreases quadratically.47
While in the decreasing phase, the degree of alteration differs between males and females. Mutlu et al examined alternations of cortical gyrification over the period of 5–30 years of age.90 They reported that the slope of the LGI decreased with age in the prefrontal region and that the decrease was steeper in males than in females. In addition, the findings regarding sex differences in cortical gyrification are mixed.48 The postmortem study using the manual tracing GI method showed no differences,32 but an MRI study using cortical pattern matching methods49 revealed greater cortical complexity in female in the superior frontal and parietal lobes.50
There are two major hypotheses of the process of cortical gyrification,33 the gray matter hypothesis32 and mechanical tension hypothesis.51,52 Briefly, the gray matter hypothesis states that regional cortical gyrification is caused by growth processes during cortical development, such as neuronal differentiation and migration. These prenatal and early postnatal events provide a crucial foundation for subsequent changes in cortical gyrification that may occur during childhood, adolescence, and adulthood. The mechanical tension hypothesis states that underlying intracortical axonal connections influence cortical gyrification. Cortical regions with greater neural connectivity are associated with greater tension, which allows these brain regions to remain in closer proximity during brain growth, resulting in the formation of cortical gyri. Alterations in neural connectivity, such as those that occur during synaptic pruning and dendritic arborization, could conceivably alter the morphology of the gyri and sulci.
Abnormal cortical gyrification in chronic schizophrenia
A number of cortical gyrification studies in schizophrenia using the manual tracing GI, A-GI, and LGI have been published in the last two decades. In the manual tracing GI study, the mean GIs were significantly reduced in patients with schizophrenia in both anterior and posterior regions.53 Patients showed a decreased GI in both hemispheres relative to healthy controls in the other study.54 However, it has also been reported that the mean GI on the right hemisphere was significantly increased in male patients with schizophrenia compared with healthy controls.37 In the A-GI study, patients showed a decreased GI in the prefrontal lobe, regardless of whether they had a low intelligence quotient (IQ).39 Moreover, patients with schizophrenia and bipolar disorder have a decreased GI in the prefrontal lobe, including the ventral and dorsal subregions.40 In these studies, the findings were inconsistent, with some studies showing an increased GI, called “hypergyria,” and others showing a decreased GI, called “hypogyria.” These conflicting findings were obtained using the manual tracing GI and A-GI. When using these methods, the findings depend on various factors, such as the specific chosen slices, whole brain, or whole prefrontal lobe. This variation might be one reason for the conflicting findings.
Palaniyappan et al used the FreeSurfer package that enables the LGI to be calculated in multiple subregions of prefrontal cortex.55 The results revealed both hypergyria and hypogyria regions in the prefrontal cortex of patients with schizophrenia. Decreased LGIs were observed in most of the ROIs in the left and right prefrontal cortexes, and increased LGIs were observed in the left and right front marginal regions. These findings measuring the LGI might resolve the dissociated findings using the manual tracing GI and A-GI. Sallet et al used the manual tracing GI and reported hypergyria in the anterior-most slice of the prefrontal lobe in patients with schizophrenia.54 Palaniyappan et al discussed that it is likely that these slices included the frontomarginal sulcus, in which they found an increased LGI in their LGI study.
Whole brain analysis in the LGI study provides rich information about abnormal cortical gyrification in schizophrenia. In the study that performed whole brain analysis, decreased LGIs (hypogyria) were observed in the left hemisphere, with the greatest reduction occurring in the left insula, extending into the superior temporal gyrus and sulcus posteriorly and Broca’s area anteriorly.56 Decreased LGIs were also confirmed in two large independent sample studies on Swedish and Norwegian subjects. Whole brain analyses combining the two samples showed decreased LGIs in the left pericentral region, right temporo-occipital region, and right medial parietal region; however, the regions with decreased LGIs were not identical between the Swedish sample and the Norwegian sample.57 To summarize the results of the LGI studies, it is thought that a characteristic of cortical gyrification in schizophrenia is a decreased GI and hypogyria.
Abnormal cortical gyrification in first-episode schizophrenia and at-risk mental state (ARMS) individuals
In an earlier study of the A-GI, Harris et al examined the GI in four lobar regions of patients with first-episode schizophrenia. The results showed the increased GI in the right temporal lobe, a trend toward a significantly increased GI in the left temporal lobe, and also the decreased GI in the left frontal lobe of patients with first-episode schizophrenia.58 Subsequent findings of cortical gyrification in first-episode schizophrenia have been inconsistent. Hypergyria was found in the frontal,59,60 temporal,58,61 and parietal lobes,60 whereas some other studies did not find abnormal cortical gyrification.42,62,63 These studies used different methods in terms of the measurement (the manual tracing GI, the A-GI, and a curvature) and different regions for analysis (sulcal, lobar, and ROI). Here, methodological differences might be one of the reasons for the inconsistent findings, as well as those of studies on chronic patients. Recently, Sasabayashi et al used the FreeSurfer package, calculated the LGI, and performed whole brain analysis. Their findings showed an increased GI in widespread clusters in the left frontal pole and bilateral occipital regions, including the rostral anterior cingulate gyri, right medial orbitofrontal region, and right superior parietal region.64 In terms of the early phase of the illness, research on adolescent patients was also conducted. Palaniyappan et al examined the cortical gyrification of the whole brain using the LGI method in normal adolescents and individuals with the onset of schizophrenia at that age (the mean age was approximately 16 years).65 They conducted a longitudinal study that involved a follow-up scan 2 years later. First, increased LGIs were found in the left fronto-insular cortex, including Broca’s area and the anterior insula, and a decreased LGI was found in the right region of Wernicke’s area extending into the posterior insula. Second, at the 2-year follow-up, a progressively decreased LGI was observed in the left fronto-insular cortex in patients, whereas the LGI continued to increase in healthy controls.
Abnormal cortical gyrification, especially in the frontal lobe, is also confirmed in ARMS. Tepest et al conducted comparisons of manual tracing GIs between patients with schizophrenia, individuals at risk, and healthy controls. The findings showed increased GIs in the frontal and parietal cortices of patients with schizophrenia and individuals at risk compared with healthy controls. Interestingly, the degree of the manual tracing GI increased stepwise. In the frontal lobe, the mean GI of individuals at risk was increased by 10% compared with the GI in healthy controls and the mean GI of patients with schizophrenia was increased by 9% compared with individuals who were at risk, and these trends were identical to the results in the parietal lobe. These findings indicate that an abnormal cortical gyrification in the frontal and/or parietal cortices can be a biological marker to predict the development of schizophrenia. Additionally, Tepest et al mentioned that there were at least (only) four individuals at risk who subsequently developed schizophrenia, meaning that the subsample was too small, so it was unclear whether the GI was predictive of developing schizophrenia or not. Sasabayashi et al added more evidence using a large ARMS cohort with and without later transition to psychotic disorders.66 ARMS individuals showed an increased LGI compared with healthy controls in widespread cortical areas, including the bilateral frontal, temporal, parietal, and occipital regions; this risk was partly associated with prodromal symptomatology. In comparison between ARMS individuals who exhibited the transition to psychotic disorders (ARMS-T) and those who did not (ARMS-NT), ARMS-T individuals showed an increased GI in the left medial occipital region compared with ARMS-NT individuals. Sasabayashi et al discussed that an increased GI could be a surrogate marker of the transition to psychotic disorders.
Abnormal cortical gyrification in siblings, high-risk individuals, and genetic factors
Abnormal cortical gyrification is found in siblings of patients with schizophrenia and “high-risk” (HR) individuals who have family members with schizophrenia. Vogeley et al compared the manual tracing GI in the frontal lobe in a sibling with schizophrenia or schizoaffective disorder and a sibling without the disease. The results showed an increased GI in the right prefrontal region in the sibling with schizophrenia compared with those without the disease.67
The Edinburgh High Risk Study (EHRS) collected structural MRI scans of young individuals at familial HR of schizophrenia.68,69 In the HR study using EHRS data, Harris et al compared manual tracing GIs between HR individuals who developed schizophrenia and HR individuals who did not.36 The whole brain scans were divided into four regions, the prefrontal, temporal, parietal, and occipital lobes. Individuals were 16–25 years of age with a family history of schizophrenia. The finding was that the mean GI in the right prefrontal lobe of individuals who subsequently developed schizophrenia was increased compared with that of individuals who did not develop schizophrenia. This finding was replicated in a later study by Harris et al using the A-GI in a larger number of subjects, 17 HR individuals who developed schizophrenia and 128 HR individuals who did not.70 Harris et al also conducted backward elimination logistic regression with group diagnosis (remained well or subsequently unwell). As the outcome, the A-GI in the right prefrontal lobe predicted group membership. They concluded that an increased GI in the right prefrontal lobe is a factor that can predict schizophrenia several years before illness onset. Additionally, these two studies noted that the measures of genetic liability were similar between those who did and did not develop schizophrenia; thus, they concluded that the GI difference was related to the phenotypic expression of the disease rather than purely to genetically mediated factors.36,70
These studies examined the differences between two HR individual groups, one included individuals who developed schizophrenia and the other included individuals who did not develop schizophrenia. Jou et al conducted a comparison between offspring or siblings of individuals with schizophrenia and healthy controls as a pilot study. The results showed a decreased GI in the left frontal lobe of HR individuals who developed schizophrenia.71 However, Jou et al mentioned the limitations of their study, namely, that the sample size was small (9 HR individuals and 12 healthy controls) and consisted of only males. They noted that these factors limited the generalizability of the results. Falkai et al reported results that contradicted the decreased GI found in the Jou et al study. Falkai et al91 conducted a comparison between four groups, 48 patients with schizophrenia, 29 family members suffering from a psychiatric illness other than schizophrenia, 53 family members lacking a psychiatric diagnosis, and 41 healthy controls. The results showed an increased GI in the schizophrenia and two-family member groups compared with healthy controls in the bilateral prefrontal lobe. If the decreased GI of HR individuals in the Jou et al study is an exceptional result, the other studies revealed that HR individuals who developed schizophrenia have an increased GI in the prefrontal lobe and HR individuals who have family who developed schizophrenia or another psychiatric disorder also have an increased GI.
The HR research explores the relationship between cortical gyrification and functional connectivity. Dauvermann et al hypothesized that an increased GI in the prefrontal cortex may reflect increased short range regional connectivity.72 The data set consisted of 68 young unaffected relatives of patients with schizophrenia and 21 healthy controls of the EHRS who were used in the analysis of structural and functional MRI data with the Hayling task. The results showed positive associations between the A-GI in the prefrontal cortex and prefrontal lateral–medial connectivity in HR individuals, whereas a negative correlation was found between the A-GI in the prefrontal cortex and prefrontal–thalamic connectivity. These two correlations were more pronounced in HR individuals than in healthy controls.
Focusing on the genetic factors for schizophrenia and cortical gyrification, a study on the polygenic risk for schizophrenia was performed. Liu et al examined the correlation between the cumulative genetic risk for schizophrenia and cortical gyrification in healthy individuals using the LGI method. The results showed that a greater polygenic risk score was associated with a decreased GI in the bilateral IPLs. In contrast to the findings that showed an increased GI with the manual tracing GI and A-GI, a decreased GI was the major result of the LGI method, and a decreased GI in the bilateral IPL was consistent with the results in the case–control studies.56,73,74 Liu et al discussed that common genetic variants of schizophrenia affect the cortical morphometry of the IPL and thus increase schizophrenia vulnerability.
Association between cortical gyrification and clinical symptoms, neurological soft signs (NSS), and executive functions
Sallet et al performed a study that used the manual tracing GI method,54 and the clinical symptoms were assessed with the positive and negative syndrome scale (PANSS),75 brief psychiatric rating scale,76,77 and negative symptom rating scale.78 Symptom scores that tended to cluster around the paranoid dimension were associated with an increased GI. They also confirmed that the severity of the negative symptoms was inversely related to the values of the GI. In an LGI study, Sasabayashi et al examined the correlation between the LGI of patients with first-episode schizophrenia and the severity of clinical symptoms,64 which was assessed with the scale for the assessment of positive and negative symptoms.92,93 The results showed that the severity of positive symptoms was related to increased LGIs in the right temporal pole, right insula, and right parahippocampal gyrus. In combination with those findings, it has been commonly found that the severity of positive symptoms is related to an increased GI, even though the methods used to calculate the GIs were not identical.
Auditory hallucination is a common positive symptom in schizophrenia. Meta-analyses of VBM studies revealed that the severity of auditory verbal hallucination (AVH) was significantly associated with gray matter volume reductions in the left superior temporal gyri (STG) and marginally with the right STG, including Heschl’s gyri,79 the left insula, and the left inferior frontal gyrus, including Broca’s area.80 In a cortical gyrification study using the LGI method, Kubera et al compared the LGIs of patients with persistent auditory verbal hallucinations (pAVH), those without hallucinatory symptoms (nAVH), and healthy controls. The results were that pAVH showed a decreased LGI in the right Broca’s region compared with both nAVH patients and healthy controls. However, the correlations between the LGI and PANSS-P scores were not significant, and thus, a decreased LGI in the right Broca’s region, which reflected the presence of AVH, pointed to cortical gyrification being primarily state-independent.81,94
NSS are a broad range of subtle neurological deficits represented by minor neurological signs, such as minor motor and sensory deficits, which indicate nonspecific cerebral dysfunction. Originally, NSS were described as nonlocalizing neurological abnormalities that cannot be related to the impairment of a specific brain region.82,83 However, recent studies have revealed significant correlations between NSS and cortical features, including cortical gyrification in patients with schizophrenia84,85 and also healthy individuals.86 Hirjak et al examined the relationship between the NSS levels and LGI in recent-onset schizophrenia patients in whole brain analysis. They revealed that higher sensory and spatial NSS were negatively associated with LGI changes in the left precentral gyrus and left precuneus and higher motor NSS were positively related to LGI changes in the bilateral supramarginal gyrus, right superior parietal area, and left superior temporal gyrus. The results of their subsequent study were not identical to those of the first study but showed negative correlations between the NSS scores and LGI in the left hemisphere in the ROI analysis.85 Efforts to reveal the neural basis of the NSS are still ongoing, but an abnormal cortical gyrification may play a role in the presence of NSS in schizophrenia.
Several studies have examined the correlations between cognitive functions and alterations of cortical gyrification. Stanfield et al examined the relationship between the A-GI in the prefrontal lobe and IQ of two groups of young people, one group included individuals who were above the cutoff on the structured interview for schizotypy (SIS+) and the other included individuals who were below the cutoff (SIS−).87,95 Positive relationships between the A-GI in the right prefrontal lobe and IQ were shown in both groups; however, these relationships did not differ between the groups. In the LGI study, Sasabayashi et al examined the relationship between the LGI and executive functions in patients with first-episode schizophrenia.64 They assessed the executive functions using the Wisconsin card sorting test (WCST).88 The results were negative correlations between the category archived values of WCST and LGI in a cluster including the superior frontal gyrus, rostral and caudal anterior cingulate gyri, and rostral middle frontal gyrus in the right hemisphere.
Future research
In summary, a number of studies have found abnormal cortical gyrification in various stages of schizophrenia that abnormal cortical gyrification is correlated with clinical and behavioral abnormalities. However, there are conflicting findings in various studies that examine characteristics of cortical gyrification in schizophrenia. Different GI methods might be the most important reason for the conflicting findings. Moorhead et al examined the interclass correlation coefficients (ICC) between the manual tracing GI and A-GI of each side prefrontal lobe. The ICC for the two methods on the right side prefrontal lobe was 0.67 and that on the left side was 0.63.38 These scores seemed to be somewhat low, but the statistical results between the two groups using two methods were identical to each other. Thus, the manual tracing GI and A-GI are similar methods, methodologically and also statistically. The LGI method based on the ROI, which is restricted within 25 mm, differs from the cantered vertex and does not contain the whole 2D brain on one slice, so the LGI on the single vertex was used for ROI analysis and whole brain analysis.30 The LGI methods are based on the same concept, calculation of the ratio between two surfaces, as the two other methods. However, it is difficult to call them “identical.”
The other reason for the conflicting findings is that studies examining abnormal cortical gyrification included a wide variety of characteristics, such as age, sex, stage, and severity of illness. As revealed in this review, these characteristics correlate with cortical gyrification. Hence, patient groups that include individuals who have various characteristics derive different results and/or an absence of results. Further investigations controlling for various factors will resolve these puzzling issues and reveal the nature of abnormal cortical gyrification in schizophrenia and in individuals who developed schizophrenia.
Many studies have discussed abnormal cortical gyrification as a biological marker for schizophrenia, which is conceivable, and several studies have succeeded in classifying patients with schizophrenia and healthy controls using structural features of the brain with high accuracies between 80% and 90%.89 With this in mind, can cortical gyrification be used as a predictable marker in schizophrenia? If this is the case, can it have an even greater accuracy? In the study on HR individuals who subsequently developed schizophrenia and those who did not, the A-GI in right prefrontal lobe was able to predict individuals who developed schizophrenia.70 Cortical gyrification develops in the early stages of life, and abnormalities of cortical gyrification are observed in individuals with an onset of schizophrenia at approximately 16 years.65 Based on the above findings, abnormal cortical gyrification might predict younger individuals who will develop schizophrenia.
Conclusion
A number of structural neuroimaging studies have revealed abnormal cortical gyrification in patients with schizophrenia, first-episode schizophrenia, siblings of patients, HR, and at-risk individuals. Abnormalities in cortical gyrification may also underlie the severity of clinical symptoms, NSS, and executive functions. An abnormal cortical gyrification can be a biological marker for schizophrenia. A substantial body of research has been conducted; however, conflicting issues are still unresolved. These issues still need to be considered, and future studies should address them.
Disclosure
The authors report no conflicts of interest in this work.
References
Davidson LL, Heinrichs RW. Quantification of frontal and temporal lobe brain-imaging findings in schizophrenia: a meta-analysis. Psychiatry Res. 2003;122(2):69–87. | ||
Glahn DC, Laird AR, Ellison-Wright I, et al. Meta-analysis of gray matter anomalies in schizophrenia: application of anatomic likelihood estimation and network analysis. Biol Psychiatry. 2008;64(9):774–781. | ||
Honea R, Crow TJ, Passingham D, Mackay CE. Regional deficits in brain volume in schizophrenia: a meta-analysis of voxel-based morphometry studies. Am J Psychiatry. 2005;162(12):2233–2245. | ||
Shepherd AM, Laurens KR, Matheson SL, Carr VJ, Green MJ. Systematic meta-review and quality assessment of the structural brain alterations in schizophrenia. Neurosci Biobehav Rev. 2012;36(4):1342–1356. | ||
Wright IC, Rabe-Hesketh S, Woodruff PWR, David AS, Murray RM, Bullmore ET. Meta-analysis of regional brain volumes in schizophrenia. Am J Psychiatry. 2000;157(1):16–25. | ||
Lewis DA, Levitt P. Schizophrenia as a disorder of neurodevelopment. Annu Rev Neurosci. 2002;25(1):409–432. | ||
Woods BT. Is schizophrenia a progressive neurodevelopmental disorder? Toward a unitary pathogenetic mechanism. Am J Psychiatry. 1998;155(12):1661–1670. | ||
Rapoport JL, Giedd JN, Gogtay N. Neurodevelopmental model of schizophrenia: update 2012. Mol Psychiatry. 2012;17(12):1228–1238. | ||
Dale AM, Fischl B, Sereno MI. Cortical surface-based analysis. I. Segmentation and surface reconstruction. Neuroimage. 1999;9(2):179–194. | ||
Dale AM, Sereno MI. Improved localization of cortical activity by combining EEG and MEG with MRI cortical surface reconstruction: a linear approach. J Cogn Neurosci. 1993;5(2):162–176. | ||
Desikan RS, Ségonne F, Fischl B, et al. An automated labeling system for subdividing the human cerebral cortex on MRI scans into gyral based regions of interest. Neuroimage. 2006;31(3):968–980. | ||
Fischl B, Dale AM. Measuring the thickness of the human cerebral cortex from magnetic resonance images. Proc Natl Acad Sci U S A. 2000;97(20):11050–11055. | ||
Fischl B, Liu A, Dale AM. Automated manifold surgery: constructing geometrically accurate and topologically correct models of the human cerebral cortex. IEEE Trans Med Imaging. 2001;20(1):70–80. | ||
Fischl B, Salat DH, Busa E, et al. Whole brain segmentation: automated labeling of neuroanatomical structures in the human brain. Neuron. 2002;33(3):341–355. | ||
Fischl B, Salat DH, van der Kouwe AJW, et al. Sequence-independent segmentation of magnetic resonance images. Neuroimage. 2004;23(Suppl 1):S69–S84. | ||
Fischl B, Sereno MI, Dale AM. Cortical surface-based analysis. II: Inflation, flattening, and a surface-based coordinate system. Neuroimage. 1999;9(2):195–207. | ||
Fischl B, Sereno MI, Tootell RBH, Dale AM. High-resolution intersubject averaging and a coordinate system for the cortical surface. Hum Brain Mapp. 1999;8(4):272–284. | ||
Fischl B, van der Kouwe A, Destrieux C, et al. Automatically parcellating the human cerebral cortex. Cereb Cortex. 2004;14(1):11–22. | ||
Han X, Jovicich J, Salat D, et al. Reliability of MRI-derived measurements of human cerebral cortical thickness: the effects of field strength, scanner upgrade and manufacturer. Neuroimage. 2006;32(1):180–194. | ||
Jovicich J, Czanner S, Greve D, et al. Reliability in multi-site structural MRI studies: Effects of gradient non-linearity correction on phantom and human data. Neuroimage. 2006;30(2):436–443. | ||
Kuperberg GR, Broome MR, Mcguire PK, et al. Regionally localized thinning of the cerebral cortex in schizophrenia. Arch Gen Psychiatry. 2003;60(9):878–888. | ||
Reuter M, Fischl B. Avoiding asymmetry-induced bias in longitudinal image processing. Neuroimage. 2011;57(1):19–21. | ||
Reuter M, Rosas HD, Fischl B. Highly accurate inverse consistent registration: A robust approach. Neuroimage. 2010;53(4):1181–1196. | ||
Reuter M, Schmansky NJ, Rosas HD, Fischl B. Within-subject template estimation for unbiased longitudinal image analysis. Neuroimage. 2012;61(4):1402–1418. | ||
Rosas HD, Liu AK, Hersch S, et al. Regional and progressive thinning of the cortical ribbon in Huntington’s disease. Neurology. 2002;58(5):695–701. | ||
Salat DH, Buckner RL, Snyder AZ, et al. Thinning of the cerebral cortex in aging. Cereb Cortex. 2004;14(7):721–730. | ||
Ségonne F, Dale AM, Busa E, et al. A hybrid approach to the skull stripping problem in MRI. Neuroimage. 2004;22(3):1060–1075. | ||
Segonne F, Pacheco J, Fischl B. Geometrically accurate topology-correction of cortical surfaces using nonseparating loops. IEEE Trans Med Imaging. 2007;26(4):518–529. | ||
Sled JG, Zijdenbos AP, Evans AC. A nonparametric method for automatic correction of intensity nonuniformity in MRI data. IEEE Trans Med Imaging. 1998;17(1):87–97. | ||
Schaer M, Cuadra MB, Tamarit L, Lazeyras F, Eliez S, Thiran J-P. A surface-based approach to quantify local cortical gyrification. IEEE Trans Med Imaging. 2008;27(2):161–170. | ||
Zilles K, Armstrong E, Moser KH, Schleicher A, Stephan H. Gyrification in the cerebral cortex of primates. Brain Behav Evol. 1989;34(3):143–150. | ||
Zilles K, Armstrong E, Schleicher A, Kretschmann H-J. The human pattern of gyrification in the cerebral cortex. Anat Embryol. 1988;179(2):173–179. | ||
Zilles K, Palomero-Gallagher N, Amunts K. Development of cortical folding during evolution and ontogeny. Trends Neurosci. 2013;36(5):275–284. | ||
Armstrong E, Schleicher A, Omran H, Curtis M, Zilles K. The ontogeny of human gyrification. Cereb Cortex. 1995;5(1):56–63. | ||
Jalil Razavi M, Zhang T, Liu T, Wang X. Cortical folding pattern and its consistency induced by biological growth. Sci Rep. 2015;5(1):14477. | ||
Harris JM, Whalley H, Yates S, Miller P, Johnstone EC, Lawrie SM. Abnormal cortical folding in high-risk individuals: a predictor of the development of schizophrenia? Biol Psychiatry. 2004;56(3):182–189. | ||
Vogeley K, Schneider-Axmann T, Pfeiffer U, et al. Disturbed gyrification of the prefrontal region in male schizophrenic patients: a morphometric postmortem study. Am J Psychiatry. 2000;157(1):34–39. | ||
Moorhead TWJ, Harris JM, Stanfield AC, et al. Automated computation of the Gyrification Index in prefrontal lobes: methods and comparison with manual implementation. Neuroimage. 2006;31(4):1560–1566. | ||
Bonnici HM, William T, Moorhead J, et al. Pre-frontal lobe gyrification index in schizophrenia, mental retardation and comorbid groups: An automated study. Neuroimage. 2007;35(2):648–654. | ||
Mcintosh AM, Moorhead TWJ, Mckirdy J, et al. Prefrontal gyral folding and its cognitive correlates in bipolar disorder and schizophrenia. Acta Psychiatr Scand. 2009;119(3):192–198. | ||
Destrieux C, Fischl B, Dale A, Halgren E. Automatic parcellation of human cortical gyri and sulci using standard anatomical nomenclature. Neuroimage. 2010;53(1):1–15. | ||
Janssen J, Reig S, Alemán Y, et al. Gyral and sulcal cortical thinning in adolescents with first episode early-onset psychosis. Biol Psychiatry. 2009;66(11):1047–1054. | ||
Zhang Y, Yu C, Zhou Y, Li K, Li C, Jiang T. Decreased gyrification in major depressive disorder. Neuroreport. 2009;20(4):378–380. | ||
Zhang Y, Zhou Y, Yu C, Lin L, Li C, Jiang T. Reduced cortical folding in mental retardation. AJNR Am J Neuroradiol. 2010;31(6):1063–1067. | ||
Schaer M, Glaser B, Cuadra MB, Debbane M, Thiran J-P, Eliez S. Congenital heart disease affects local gyrification in 22q11.2 deletion syndrome. Dev Med Child Neurol. 2009;51(9):746–753. | ||
Li G, Wang L, Shi F, et al. Mapping longitudinal development of local cortical gyrification in infants from birth to 2 years of age. J Neurosci. 2014;34(12):4228–4238. | ||
Hogstrom LJ, Westlye LT, Walhovd KB, Fjell AM. The structure of the cerebral cortex across adult life: age-related patterns of surface area, thickness, and gyrification. Cereb Cortex. 2013;23(11):2521–2530. | ||
White T, Su S, Schmidt M, Kao C-Y, Sapiro G. The development of gyrification in childhood and adolescence. Brain Cogn. 2010;72(1):36–45. | ||
Thompson PM, Woods RP, Mega MS, Toga AW. Mathematical/computational challenges in creating deformable and probabilistic atlases of the human brain. Hum Brain Mapp. 2000;9(2):81–92. | ||
Luders E, Narr KL, Thompson PM, et al. Gender differences in cortical complexity. Nat Neurosci. 2004;7(8):799–800. | ||
Essen DCV, van Essen DC. A tension-based theory of morphogenesis and compact wiring in the central nervous system. Nature. 1997;385(6614):313–318. | ||
Budday S, Raybaud C, Kuhl E. A mechanical model predicts morphological abnormalities in the developing human brain. Sci Rep. 2015;4(1):5644. | ||
Kulynych JJ, Luevano LF, Jones DW, Weinberger DR. Cortical abnormality in schizophrenia: an in vivo application of the gyrification index. Biol Psychiatry. 1997;41(10):995–999. | ||
Sallet PC, Elkis H, Alves TM, et al. Reduced cortical folding in schizophrenia: an MRI morphometric study. Am J Psychiatry. 2003;160(9):1606–1613. | ||
Palaniyappan L, Mallikarjun P, Joseph V, White TP, Liddle PF. Folding of the prefrontal cortex in schizophrenia: regional differences in gyrification. Biol Psychiatry. 2011;69(10):974–979. | ||
Palaniyappan L, Liddle P. Aberrant cortical gyrification in schizophrenia: a surface-based morphometry study. J Psychiatry Neurosci. 2012;37(6):399–406. | ||
Nesvåg R, Schaer M, Haukvik UK, et al. Reduced brain cortical folding in schizophrenia revealed in two independent samples. Schizophr Res. 2014;152(2-3):333–338. | ||
Harris JM, Yates S, Miller P, Best JJK, Johnstone EC, Lawrie SM. Gyrification in first-episode schizophrenia: a morphometric study. Biol Psychiatry. 2004;55(2):141–147. | ||
Narr KL, Bilder RM, Kim S, et al. Abnormal gyral complexity in first-episode schizophrenia. Biol Psychiatry. 2004;55(8):859–867. | ||
Tepest R, Schwarzbach CJ, Krug B, Klosterkötter J, Ruhrmann S, Vogeley K. Morphometry of structural disconnectivity indicators in subjects at risk and in age-matched patients with schizophrenia. Eur Arch Psychiatry Clin Neurosci. 2013;263(1):15–24. | ||
Schultz CC, Koch K, Wagner G, et al. Increased parahippocampal and lingual gyrification in first-episode schizophrenia. Schizophr Res. 2010;123(2-3):137–144. | ||
Wiegand LC, Warfield SK, Levitt JJ, et al. An in vivo MRI study of prefrontal cortical complexity in first-episode psychosis. Am J Psychiatry. 2005;162(1):65–70. | ||
Fornito A, Yung AR, Wood SJ, et al. Anatomic abnormalities of the anterior cingulate cortex before psychosis onset: an MRI study of ultra-high-risk individuals. Biol Psychiatry. 2008;64(9):758–765. | ||
Sasabayashi D, Takayanagi Y, Nishiyama S, et al. Increased frontal gyrification negatively correlates with executive function in patients with first-episode schizophrenia. Cerebral Cortex. 2017;27(4):2686–2694. | ||
Palaniyappan L, Crow TJ, Hough M, et al. Gyrification of Broca’s region is anomalously lateralized at onset of schizophrenia in adolescence and regresses at 2 year follow-up. Schizophr Res. 2013;147(1):39–45. | ||
Sasabayashi D, Takayanagi Y, Takahashi T, et al. Increased occipital gyrification and development of psychotic disorders in individuals with an at-risk mental state: a multicenter study. Biol Psychiatry. 2017;82(10):737–745. | ||
Vogeley K, Tepest R, Pfeiffer U, et al. Right frontal hypergyria differentiation in affected and unaffected siblings from families multiply affected with schizophrenia: a morphometric MRI study. Am J Psychiatry. 2001;158(3):494–496. | ||
Hodges A, Byrne M, Grant E, Johnstone E. People at risk of schizophrenia. Sample characteristics of the first 100 cases in the Edinburgh High-Risk Study. Br J Psychiatry. 1999;174:547–553. | ||
Johnstone EC, Abukmeil SS, Byrne M, et al. Edinburgh high risk study – findings after four years: demographic, attainment and psychopathological issues. Schizophr Res. 2000;46(1):1–15. | ||
Harris JM, Moorhead TWJ, Miller P, et al. Increased prefrontal gyrification in a large high-risk cohort characterizes those who develop schizophrenia and reflects abnormal prefrontal development. Biol Psychiatry. 2007;62(7):722–729. | ||
Jou RJ, Hardan AY, Keshavan MS. Reduced cortical folding in individuals at high risk for schizophrenia: a pilot study. Schizophr Res. 2005;75(2–3):309–313. | ||
Dauvermann MR, Mukherjee P, Moorhead WT, et al. Relationship between gyrification and functional connectivity of the prefrontal cortex in subjects at high genetic risk of schizophrenia. Curr Pharm Des. 2012;18(4):434–442. | ||
Palaniyappan L, Liddle PF. Dissociable morphometric differences of the inferior parietal lobule in schizophrenia. Eur Arch Psychiatry Clin Neurosci. 2012;262(7):579–587. | ||
Nanda P, Tandon N, Mathew IT, et al. Local gyrification index in probands with psychotic disorders and their first-degree relatives. Biol Psychiatry. 2014;76(6):447–455. | ||
Kay SR, Fiszbein A, Opler LA. The Positive and Negative Syndrome Scale (PANSS) for schizophrenia. Schizophr Bull. 1987;13(2):261–276. | ||
Overall JE, Gorham DR. The Brief Psychiatric Rating Scale. Psychological Reports. 1962;10(3):799–812. | ||
Woerner MG, Mannuzza S, Kane JM. Anchoring the BPRS: an aid to improved reliability. Psychopharmacol Bull. 1988;24(1):112–117. | ||
Iager A-C, Kirch DG, Wyatt RJ. A negative symptom rating scale. Psychiatry Res. 1985;16(1):27–36. | ||
Modinos G, Costafreda SG, van Tol M-J, Mcguire PK, Aleman A, Allen P. Neuroanatomy of auditory verbal hallucinations in schizophrenia: a quantitative meta-analysis of voxel-based morphometry studies. Cortex. 2013;49(4):1046–1055. | ||
Palaniyappan L, Balain V, Radua J, Liddle PF. Structural correlates of auditory hallucinations in schizophrenia: a meta-analysis. Schizophr Res. 2012;137(1–3):169–173. | ||
Kubera KM, Thomann PA, Hirjak D, et al. Cortical folding abnormalities in patients with schizophrenia who have persistent auditory verbal hallucinations. Eur Neuropsychopharmacol. 2018;28(2):297–306. | ||
Schröder J, Niethammer R, Geider F-J, et al. Neurological soft signs in schizophrenia. Schizophr Res. 1991;6(1):25–30. | ||
Bombin I, Arango C, Buchanan RW. Significance and meaning of neurological signs in schizophrenia: two decades later. Schizophr Bull. 2005;31(4):962–977. | ||
Hirjak D, Kubera KM, Wolf RC, et al. Local brain gyrification as a marker of neurological soft signs in schizophrenia. Behav Brain Res. 2015;292:19–25. | ||
Hirjak D, Wolf RC, Paternoga I, et al. Neuroanatomical markers of neurological soft signs in recent-onset schizophrenia and Asperger-syndrome. Brain Topogr. 2016;29(3):382–394. | ||
Hirjak D, Wolf RC, Kubera KM, Stieltjes B, Thomann PA. Multiparametric mapping of neurological soft signs in healthy adults. Brain Struct Funct. 2016;221(3):1209–1221. | ||
Kendler KS, Lieberman JA, Walsh D. The Structured Interview for Schizotypy (SIS): a preliminary report. Schizophr Bull. 1989;15(4):559–571. | ||
Nelson HE. A modified card sorting test sensitive to frontal lobe defects. Cortex. 1976;12(4):313–324. | ||
Veronese E, Castellani U, Peruzzo D, Bellani M, Brambilla P. Machine learning approaches: from theory to application in schizophrenia. Comput Math Methods Med. 2013;2013(2):867924. | ||
Mutlu AK, Schneider M, Debbane M, Badoud D, Eliez S, Schaer M. Sex differences in thickness, and folding developments throughout the cortex. NeuroImage. 2013;82:200–207. | ||
Falkai P, Honer WG, Kamer T, et al. Disturbed frontal gyrification within families affected with schizophrenia. Journal of Psychiatric Research. 2007;41(10):805–813. | ||
Andreasen NC. The Scale for the Assessment of Negative Symptoms (SANS): conceptual and theoretical foundations. Br J Psychiatry Suppl. 1989;155:49–52. | ||
Andreasen NC. Scale for the Assessment of Positive Symptoms. Iowa City: University of Iowa Press; 1984. | ||
Liu B, Zhang X, Cui Y, et al. Polygenic Risk for Schizophrenia Influences Cortical Gyrification in 2 Independent General Populations. Schizophrenia Bulletin. 2017;43(3):673–680. | ||
Stanfield AC, Moorhead TW, Harris JM, et al. Increased right prefrontal cortical folding in adolescents at risk of schizophrenia for cognitive reasons. Biological Psychiatry. 2008;63(1):80–85. |
 © 2018 The Author(s). This work is published and licensed by Dove Medical Press Limited. The full terms of this license are available at https://www.dovepress.com/terms.php and incorporate the Creative Commons Attribution - Non Commercial (unported, v3.0) License.
By accessing the work you hereby accept the Terms. Non-commercial uses of the work are permitted without any further permission from Dove Medical Press Limited, provided the work is properly attributed. For permission for commercial use of this work, please see paragraphs 4.2 and 5 of our Terms.
© 2018 The Author(s). This work is published and licensed by Dove Medical Press Limited. The full terms of this license are available at https://www.dovepress.com/terms.php and incorporate the Creative Commons Attribution - Non Commercial (unported, v3.0) License.
By accessing the work you hereby accept the Terms. Non-commercial uses of the work are permitted without any further permission from Dove Medical Press Limited, provided the work is properly attributed. For permission for commercial use of this work, please see paragraphs 4.2 and 5 of our Terms.