")
Back to Journals » International Journal of General Medicine » Volume 14
Correlation of Serum Transaminase Levels with Liver Fibrosis Assessed by Transient Elastography in Vietnamese Patients with Nonalcoholic Fatty Liver Disease
Received 4 March 2021
Accepted for publication 23 March 2021
Published 16 April 2021 Volume 2021:14 Pages 1349—1355
DOI https://doi.org/10.2147/IJGM.S309311
Checked for plagiarism Yes
Review by Single anonymous peer review
Peer reviewer comments 2
Editor who approved publication: Dr Scott Fraser
Vo Duy Thong,1,2 Bui Thi Huong Quynh3
1Department of Internal Medicine, Faculty of Medicine, University of Medicine and Pharmacy at Ho Chi Minh City, Ho Chi Minh City, Vietnam; 2Department of Gastroenterology, Cho Ray Hospital, Ho Chi Minh City, Vietnam; 3Department of Clinical Pharmacy, Faculty of Pharmacy, University of Medicine and Pharmacy at Ho Chi Minh City, Ho Chi Minh City, Vietnam
Correspondence: Vo Duy Thong
Department of Internal Medicine, Faculty of Medicine, University of Medicine and Pharmacy at Ho Chi Minh City, 217 Hong Bang, Ward 11, District 5, Ho Chi Minh City, Vietnam
Tel +84 932039888
Email [email protected]
Background: Non-alcoholic fatty liver disease (NAFLD) is increasingly recognized as a cause of chronic liver disease, often resulting in liver cirrhosis, portal hypertension, and hepatocellular carcinoma damaging outcomes. Alanine transaminase (ALT) and aspartate aminotransferase (AST) are indicators of hepatocellular injury. Several studies have demonstrated that high ALT levels are correlated with higher nonalcoholic steatohepatitis (NASH) risk. The aim was to determine the correlation of serum alanine aminotransferase and aspartate transaminase with liver stiffness in Vietnamese patients with NAFLD.
Patients and Methods: The study included 18 to 80 years old patients diagnosed with fatty liver on ultrasound at the University of Medical Center (UMC) liver clinic. Liver stiffness was measured using transient elastography. The histopathological, demographic, and laboratory data of the participants were also collected. The baseline and clinical characteristics of NAFLD patients were stratified by serum ALT levels.
Results: There were 138 NAFLD patients, including 82 men (59.4%) and 56 women (40.6%) (mean ± SD age of 41 ± 11 years). Liver fibrosis (F0) between the two groups showed no significant difference (p = 0.469). Similarly, no difference was found in the mild fibrosis level (F2) of the two groups of patients (p = 0.371). ALT level was significantly higher in NAFLD patients with advanced fibrosis (F3, F4) (3.2% vs 15.9%, p = 0.0013; 3.2% vs 13.2%, p = 0.0047, respectively). NAFLD patients with mild to moderate fibrosis (F1-F2) were detected at 59 U/L cut-off value with 67% sensitivity and 51% specificity. However, severe fibrosis and/or cirrhosis patients (F3-F4) had a cut-off value of 81 U/L with 53% sensitivity and 67% specificity in patients.
Conclusion: Using ALT level as a marker for severe NAFLD would consider high-risk patients as mild cases, even though there is still the risk of progressive and severe hepatic disease. Our study underlines the small contribution of ALT as an independent factor for detecting NAFLD severity.
Keywords: alanine transaminase, aspartate aminotransferase, body mass index, fibrosis, NAFLD, triglyceride
Introduction
As non-alcoholic fatty liver disease (NAFLD) is a common disorder worldwide with 10–30% prevalence in various countries.1 NAFLD is increasingly recognized as a cause of chronic liver disease that often results in liver cirrhosis, portal hypertension, and hepatocellular carcinoma damaging outcomes.1,2 NAFLD is commonly associated with diabetes and is an essential feature of metabolic syndromes and insulin resistance.1,3,4 NAFLD severity spectrum varies. It ranges from mild symptoms to different inflammation degrees, nonalcoholic steatohepatitis (NASH), or a severe form of decompensated liver cirrhosis, which occurs in few patients.2 NAFLD diagnosis is based on a patient’s clinical history, laboratory analysis, imaging, and histology. Hepatic steatosis on abdominal imaging may be sufficient for NAFLD diagnosis. However, liver fibrosis assessment is essential for predicting chronic liver disease forms, prognosis, and outcomes. Liver biopsy is the gold standard for assessing liver fibrosis, but due to potentially life-threatening complications, it is performed as a last resort.5 Transient elastography (TE) is an ultrasound-based method that can simultaneously evaluate hepatic steatosis and liver fibrosis by measuring the controlled attenuation parameter (CAP) and liver stiffness (LS). Studies have shown that LS strongly correlated with the liver fibrosis stage assessed by liver biopsy.3,6 Thus, TE is more accurate than biomarkers or scoring systems for detecting significant liver fibrosis and cirrhosis.7
Alanine transaminase (ALT) and aspartate aminotransferase (AST) are indicators of hepatocellular injury. Several studies have demonstrated that high ALT levels are correlated with a higher risk of NASH.4,8 Some studies have shown that patients with a normal ALT level may also have histological features of NASH and are at risk of disease progression.9,10 Additionally, some recent studies have introduced a new ALT upper limit for a healthy individual, which is ≤ 40 U/L for both sexes. Elevated ALT levels are sometimes associated with an underlying NAFLD.11 Therefore, this study investigated the correlation of liver stiffness measurement with serum alanine aminotransferase and aspartate transaminase as a screening tool for disease progression in high-risk patients; thereby reducing liver biopsies need.
Patients and Methods
Study Population and Data Collection
The study population included patients diagnosed with NAFLD based on abdominal ultrasound examination and serum liver enzyme testing performed at the University of Medical Center (UMC) liver clinic. Patients were aged between 18 to 80 years diagnosed with fatty liver on ultrasound (hyperechoic liver where the liver’s echo-texture was brighter than the kidney and had blurred vascular margins and deep attenuation of ultrasound signal). NAFLD was diagnosed based on the ultrasonic criteria suggested by the Chinese Medical Association.12 The criteria are described as follows: (1) diffuse enhancement of near-field echo in the hepatic region (stronger than in the kidney and spleen region) and gradual attenuation of the far-field echo, (2) unclear display of intra-hepatic lacuna structure, (3) mild to moderate hepatomegaly with a round and blunt border, and (4) reduction of the blood flow signal in the liver but with a normal distribution of blood flow as shown by color Doppler ultrasonography. NAFLD was diagnosed if item 1 and any one or more items 2–4 were matched. A trained ultrasonographist performed the hepatic ultrasonic examination in a blinded manner. Patients were included if they had available ultrasound and blood test results in the hospital information system and had undergone Transient Elastography (TE) examinations within the study period. Patients with incomplete data were excluded from the analysis.
Other exclusion criteria were evidence of other chronic liver diseases, including hepatitis B or C, autoimmune hepatitis (AIH) (as indicated by testing positive for autoimmune antibodies, demonstrating a favorable response to steroids, those on hepatotoxic medications, such as chronic methotrexate, were also excluded, as well as those with advanced liver disease, cardiac failure, and hepatic congestion. In addition, those with very high body mass index (BMI) who could not undergo TE examinations for other reasons, and those with clinical or ultrasound evidence of decompensated cirrhosis, and patients with daily alcohol intake greater than 20 g history (during the previous 5 years) were also excluded from the study (Figure 1).
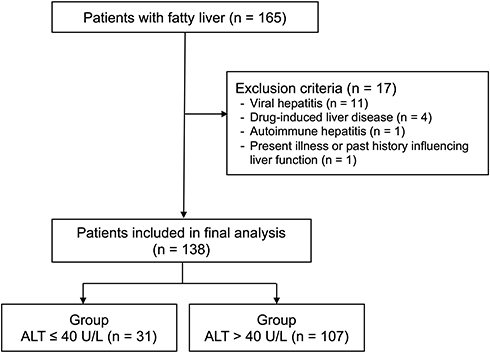 |
Figure 1 Flow chart of the study. |
Clinical and Laboratory Data
Clinical and laboratory data were obtained from 165 eligible patients. Demographic and baseline data (patient age, sex, BMI), laboratory information on levels of ALT and AST, alkaline phosphatase (ALP), total serum cholesterol, triglycerides, low-density lipoprotein (LDL), high-density lipoprotein (HDL), fasting blood sugar (FBS), partial thromboplastin time (PTT), serum platelet count, and serum gamma-glutamyl transpeptidase (GGT) were recorded. Laboratory indices were measured using standard techniques. To determine ALT healthy range in the study population, after excluding patients with positive viral markers, regular drug users, and alcohol drinkers, serum ALT upper normal limit (the 95th percentile) was set at 40 U/L. This reference laboratory cut-off value of 40 U/L was used to classify ALT activity as “normal” and “elevated” according. Thus, 27 NAFLD patients had normal ALT levels (≤ 40 U/L), while the remaining 138 patients had elevated ALT levels (> 40 U/L). All the measured baseline, clinical, and laboratory findings were compared between the two groups.
Liver Stiffness Measurements
An Echosens FibroScan (42 Rue Monge 74,005, Paris, France) was used in this study. The manufacturer’s guidelines and findings from previous studies indicate that 10 valid TE readings are necessary for a test to be deemed successful.13–15 A success rate greater than 70% was achieved for all patients included in the study. The following fibrosis stages were defined based on several previous studies and the manufacturer’s references: F0 1–6, F1 6.1–7, F2 7–9, F3 9.1–10.3, and F4 ≥ 10.4.16 Enrolled NAFLD patients’ fibrosis stages were evaluated and compared between the two groups with normal and elevated ALT levels.
Statistical Analysis
All statistical analyses were conducted using the SPSS software package version 20 for Windows (SPSS, Inc., Chicago, IL). Independent-sample Student’s t-test and Mann–Whitney U-test were used to test the differences between parametric and non-parametric variables in the two study groups. Categorical variables were analyzed using the Chi-square test. Kendall τ was used to determine the correlation between the TE results and the AST, ALT, and AST/ALT ratios. Receiver operating characteristic (ROC) curve analysis was performed. The area under the curve (AUC) and the diagnostic values of each cut-off point, including sensitivity and specificity, were calculated to determine a better cut-off value for serum ALT to detect more advanced stages of fibrosis in patients with NAFLD. Statistical significance was set at p-value <0.05. A study power of 80% was assumed in the analysis.
Result
Baseline Characteristics
The baseline characteristics of the NAFLD patients are summarized in Table 1. Among the 165 patients enrolled in this study, 138 were diagnosed with NAFLD, including 82 (59.4%) males and 56 (40.6%) females. They had a mean age of 41 ± 11 years (range: 30–52); 71.0% (98/138), were overweight (BMI > 25 kg/m2) at baseline. Diabetes and hypertension were the major comorbidities (20.3% and 15.9%, respectively). The mean ± SD serum ALT, AST, and GGT levels were 63 ± 32, 57± 34, and 65 ± 29 U/L, respectively.
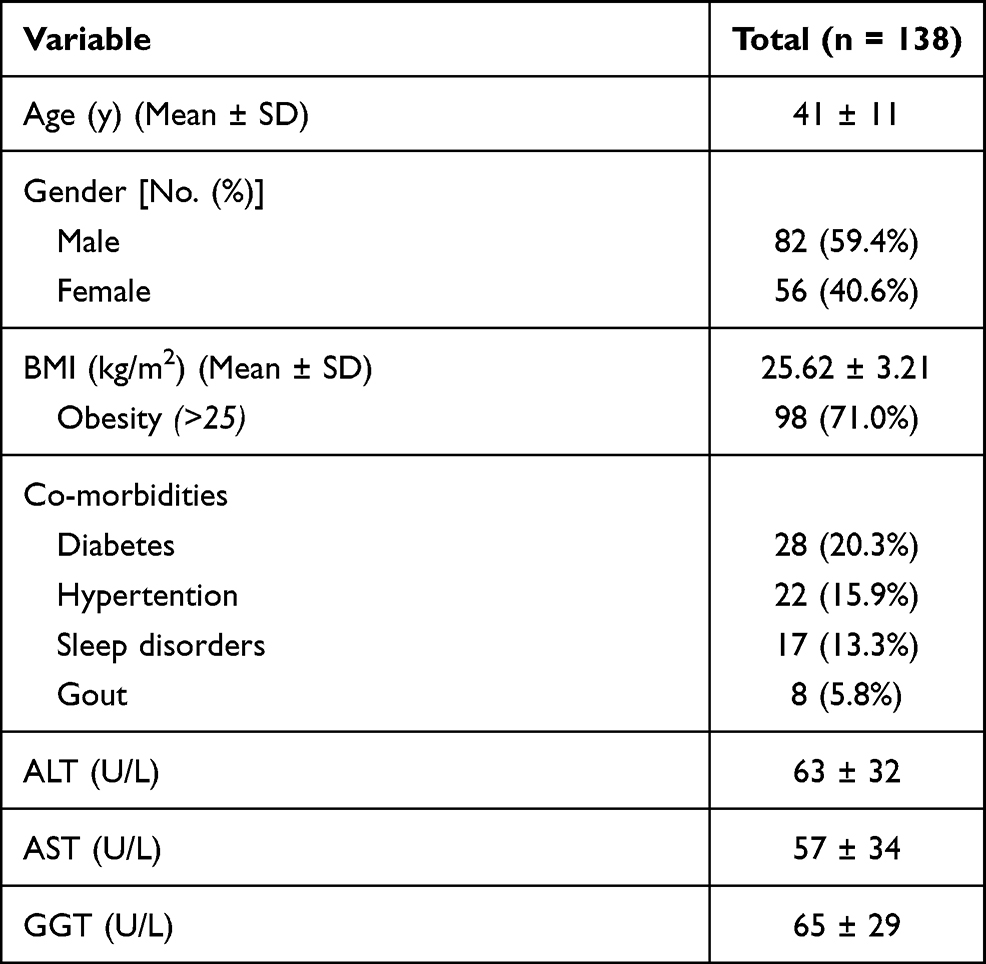 |
Table 1 Baseline Characteristics of NAFLD Patients |
Clinical Characteristics Regarding Elevated ALT
The baseline and clinical characteristics of NAFLD patients stratified by serum ALT levels are shown in Table 2. Age and sex of the patients were not significantly different between the two groups (p = 0.142 and p = 0.096, respectively). The mean ± SD serum total cholesterol and AST levels were significantly higher in those with elevated ALT (208 ± 49 vs 177 ± 37 mg/dL, p = 0.013) and (61 ± 31 vs 26 ± 13 U/L, p < 0.001), respectively. There was no significant difference in triglyceride, LDL cholesterol, platelet count, GGT, and ALP between the two groups (p = 0.472, 0.821, p = 0.751, p = 0.385 and p = 0.187, respectively).
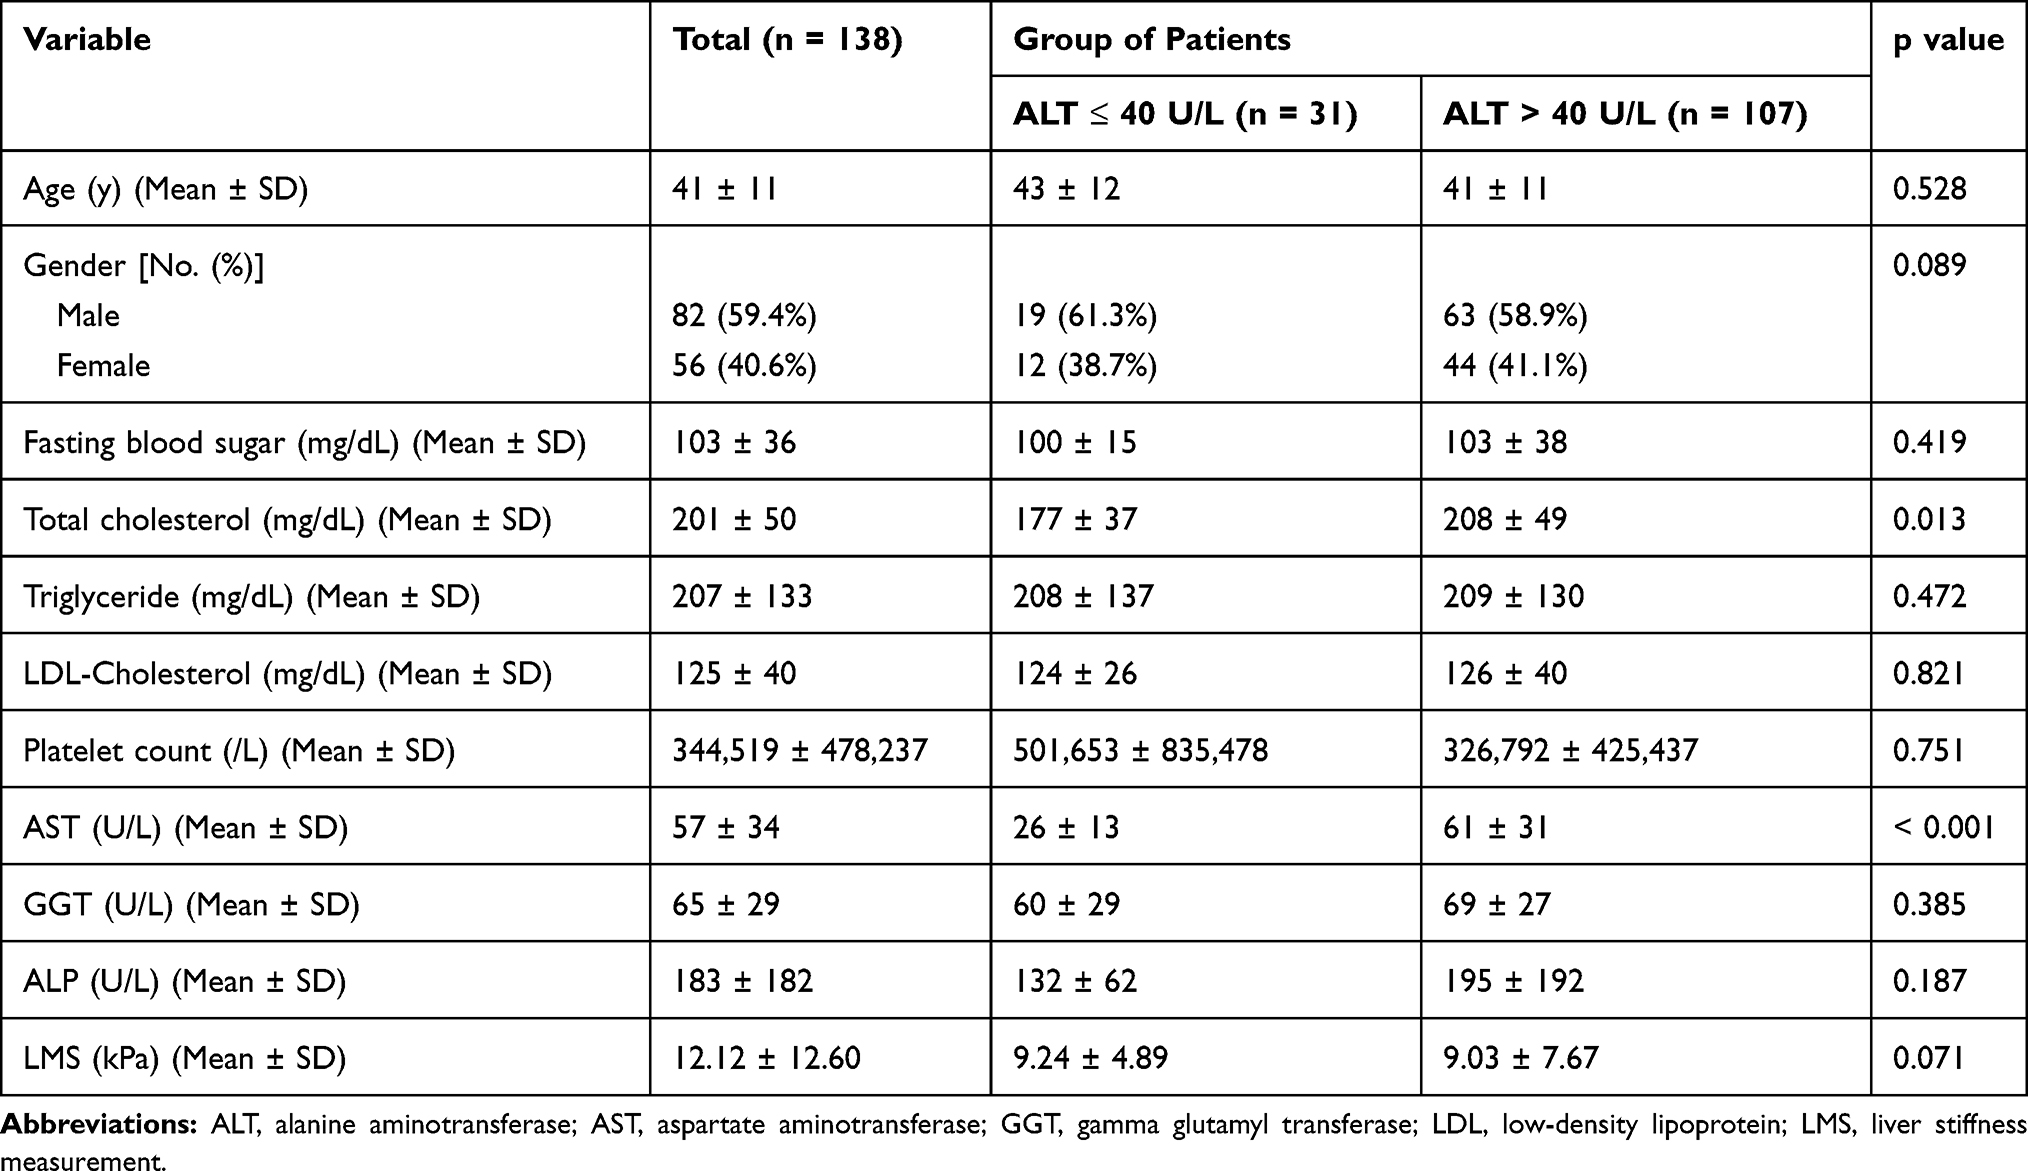 |
Table 2 Baseline and Clinical Characteristics of NAFLD Patients Stratified by Serum ALT Level |
Relationship Between Serum ALT, AST Levels and Stages of Fibrosis of Patients with NAFLD
All patients diagnosed with fatty liver on ultrasound had successful TE. The mean stiffness score was 12.12 ±12.60 kPa, and most patients exhibited either no fibrosis or an advanced level of the disease. The distribution of patients according to the stage of liver fibrosis is shown in Table 3. The proportion of significant liver fibrosis in patients with normal ALT level was 51.6%. The most common liver fibrosis stages were F0, with 47 (34.1%) and F1 with 32 (23.2%). There was no significant difference in AST and GGT levels in terms of liver stiffness. Association between serum ALT levels and liver fibrosis showed that in the non-fibrous NAFLD group (F0), there was no statistically significant difference between the normal (48.4%) and elevated ALT groups (29.9%) (p = 0.109). There was no significant difference in the F1 and F2 between the two groups (p = 0.469 and p = 0.371, respectively). When considering the cases of advanced fibrosis in the analysis, the ALT level was significantly higher in NAFLD patients who had advanced fibrosis (F3, F4) (3.2% vs 15.9%, p = 0.0013; 3.2% vs 13.2%, p = 0.0047, respectively).
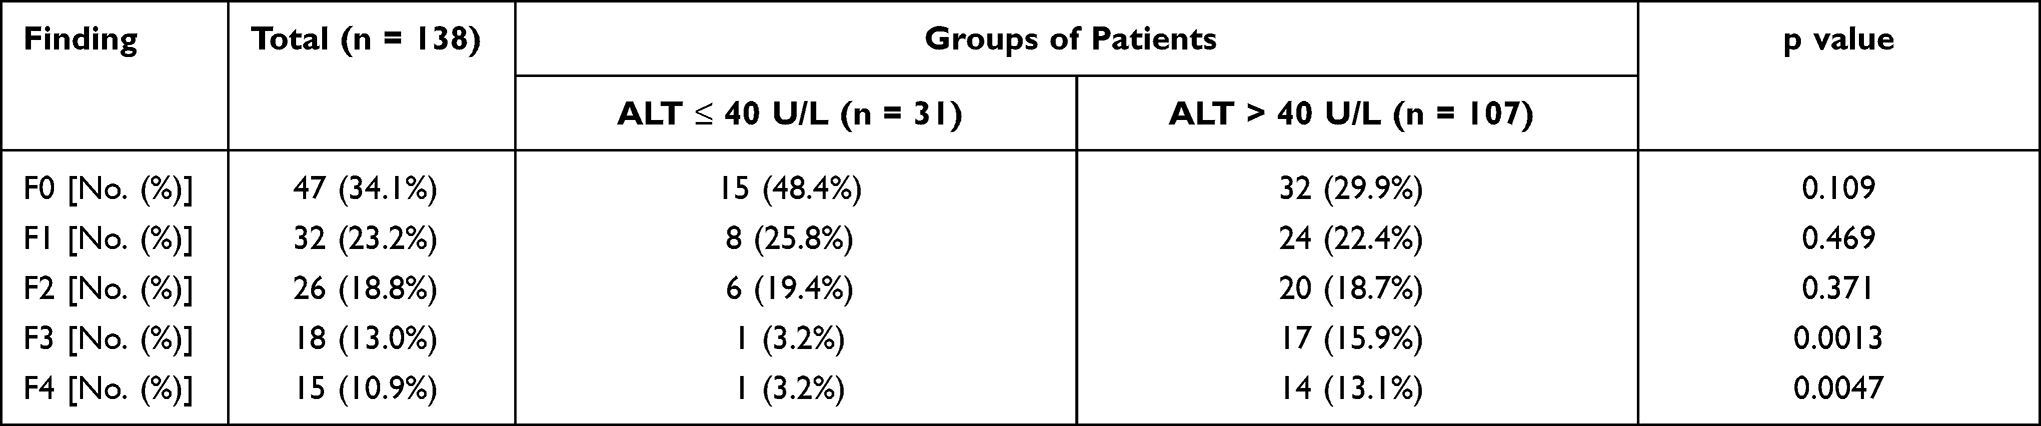 |
Table 3 Liver Fibrosis Characteristics of NAFLD Patients Stratified by Serum ALT Level |
Receiver Operating Characteristics (ROC) Curve Analysis
The ROC curve analysis revealed that the serum concentration of ALT could significantly predict the involvement of advanced fibrosis (F3, F4) in mild fibrosis (AUC = 0.602, p = 0.021, Figure 2). In addition, NAFLD patients with mild to moderate fibrosis (F1-F2) were detected at a cut-off value of 59 U/L with 67% sensitivity and 51% specificity, while patients with severe fibrosis and/or cirrhosis (F3-F4) were detected at a cut-off value of 81 U/L with 53% sensitivity of and 67% specificity.
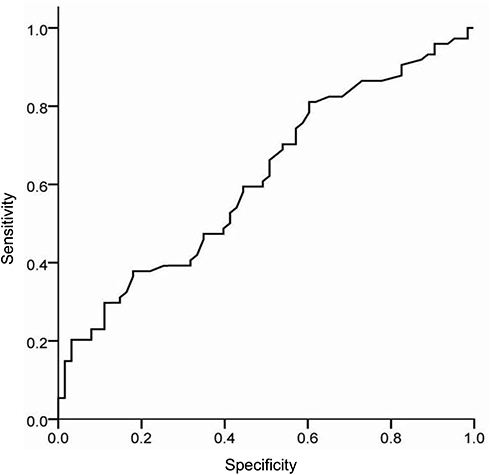 |
Figure 2 ROC curve of serum ALT level predicts more than 32% hepatocytes involvement in hepatosteatosis of patients with NAFLD without advanced fibrosis. Area under curve [AUC] = 0.602, p = 0.021. |
TE fibrosis scores were significantly correlated with the AST/ALT ratio (Figure 3). The AST/ALT ratio was a significant predictor of advanced fibrosis (AUC = 0.829, p = 0.001). A cut-off value of the ratio for detecting patients with severe fibrosis and/or cirrhosis was 0.87 with 86.9% sensitivity and 79.8% specificity.
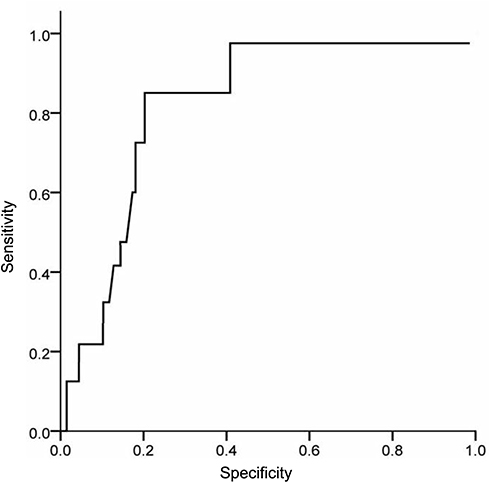 |
Figure 3 ROC curve of AST/ALT ratio predicts advanced fibrosis in NAFLD patients. Area under curve (AUC)= 0.829, p=0.001. |
Discussion
The prevalence of NAFLD in Western countries is estimated to be 17% to 46%, depending on the population.17 NAFLD prevalence among the Vietnamese population increased due to improved socioeconomic status and Western lifestyle adoption, especially in the urban population. NAFLD covers a range of conditions, from simple steatosis to NASH and fibrosis.1 Fibrosis and inflammation may eventually progress to cirrhosis in up to 20% of patients.18 A recent large UK study found that NAFLD detected by ultrasound was the most common cause of abnormal liver biochemistry.19 ALT is found in the cytosol of hepatocytes, where it transfers amino groups, while the major site for AST is the mitochondria.20 ALT is a specific marker of liver inflammation and hepatocellular injury21 and is commonly used as a liver disease indicator. Recent observational studies have suggested that liver damage already exists even when ALT levels are within the normal range. Thus, a diagnosis of elevated serum ALT levels might underestimate the prevalence of NAFLD.22
In this study, we found that the current cut-off value of 40 U/L was not significantly different between patients with NAFLD and non-fibrous findings. Normal liver enzyme levels have been demonstrated in subjects with the entire spectrum of NAFLD; therefore, some studies based on liver enzyme screening reported a lower prevalence of NAFLD (3–12%) than imaging or histology-based studies consistently.23 NAFLD is usually caused by abnormal metabolism in patients and is closely associated with dyslipidemia, diabetes mellitus, and obesity.16 Previous large population-based studies showed that abnormal ALT levels (ALT > 43 U/L) are present in 2.8% of the adult population, which increases to 6.6% in class II or III obesity.24 Using the same ALT cut-off value (43 U/L), Kunde et al showed elevated ALT levels in 8.6% of their study population, which consisted of women with class II or III obesity.25 However, we used a cut-off value of 40 U/L for ALT in this study; according to this level, 92 (86%) of 107 patients had abnormal ALT levels. There was no statistically significant difference in non-fibrous findings (F0) to mild fibrosis (F1-F2) in our results.
Previous studies have demonstrated that the occurrence of significant fibrosis in NASH might be seen in patients with NAFLD who have a normal ALT value.10,13 Fracanzani et al reported that normal ALT levels correlated with less severe steatosis and necroinflammation. However, no correlation was observed between the severity of fibrosis and ALT levels. They considered ALT values ≤ 40 U/L to be normal.22 Fracanzani AL et al study was also in concordance with these findings, as results showed correlation between abnormal ALT levels and severity of fibrosis in these patients.22 Our results showed that the ALT level of 59 U/L is required to detect mild to moderate fibrosis (F1-F2) in NAFLD patients, and 81 U/L is required to detect severe fibrosis (F3-F4). The AST/ALT ratio was 0.87, which was used to predict progressive fibrosis with severe fibrosis and/or cirrhosis. This ratio is lower than that reported by Angulo et al, who suggested AST/ALT ratio <1 in patients with no mild fibrosis or fibrosis. The ratio > 1 reflects the severe progression of NAFLD.
There are some limitations to this study. The study is observational; thus, a causal relationship cannot be established. Secondly, NAFLD was diagnosed by ultrasonography, not by liver biopsy, which is the gold standard, though invasive. Future larger multi-center cohort studies with liver biopsy should be considered while measuring ALT level to identify the correlation with liver stiffness stages more precisely.
Conclusion
In conclusion, it appears that using ALT level as a marker for severe NAFLD would result in considering high-risk patients as mild cases as with normal ALT, even though there is still the risk of progressive and severe hepatic disease. Our study underlines the small contribution of ALT as an independent factor for detecting the severity of NAFLD. Therefore, using ALT levels as an indicator of severity might result in false reassurance for patients and physicians.
Institutional Review Board Statement
The study was reviewed and approved by the Ethical Committee of the Faculty of Medicine, University of Medicine and Pharmacy at Ho Chi Minh City (Vietnam). The study complied with the Declaration of Helsinki Principles.
Informed Consent Statement
All study participants provided informed written consent before enrolment in the study.
Acknowledgments
The authors gratefully acknowledge the Liver Clinics of the University Medical Center and Faculty of Medicine, University of Medicine and Pharmacy at Ho Chi Minh City for providing the facilities.
Author Contributions
Vo Duy Thong was the guarantor and designed the study; Vo Duy Thong and Bui Thi Huong Quynh participated in the acquisition, analysis, and interpretation of the data, and drafted the initial manuscript; Vo Duy Thong revised the article critically for important intellectual content. All authors made substantial contributions to conception and design, acquisition of data, or analysis and interpretation of data; took part in drafting the article or revising it critically for important intellectual content; agreed to submit to the current journal; gave final approval of the version to be published; and agree to be accountable for all aspects of the work.
Disclosure
The authors report no conflicts of interest in this work.
References
1. Asrani SK, Devarbhavi H, Eaton J, Kamath P. Burden of liver diseases in the world. J Hepatol. 2019;70(1):151–171. PMID: 30266282. doi:10.1016/j.jhep.2018.09.014]
2. Vernon G, Baranova A, Younossi ZM. Systematic review: the epidemiology and natural history of non-alcoholic fatty liver disease and non-alcoholic steatohepatitis in adults. Aliment Pharmacol Ther. 2011;34(3):274–285. PMID: 21623852. doi:10.1111/j.1365-2036.2011.04724.x]
3. Li H, Wang YJ, Tan K, et al. Prevalence and risk factors of fatty liver disease in Chengdu, Southwest China. Hepatobiliary Pancreat Dis Int. 2009;8(4):377–382. PMID: 19666406.
4. Ulasoglu C, Enc FY, Kaya E, Yilmaz Y. Characterization of patients with biopsy-proven non-alcoholic fatty liver disease and normal aminotransferase levels. J Gastrointestin Liver Dis. 2019;28(4):427–431. PMID: 31826068. doi:10.15403/jgld-293
5. Machado MV, Cortez-Pinto H. Non-invasive diagnosis of non-alcoholic fatty liver disease. A critical appraisal. J Hepatol. 2013;58(5):1007–1019. PMID: 23183525. doi:10.1016/j.jhep.2012.11.021
6. Prashanth M, Ganesh HK, Vima MV, et al. Prevalence of nonalcoholic fatty liver disease in patients with type 2 diabetes mellitus. J Assoc Physicians India. 2009;57:205–210. PMID: 19588648.
7. Amarapurka DN, Amarapurkar AD, Patel ND, et al. Nonalcoholic steatohepatitis (NASH) with diabetes: predictors of liver fibrosis. Ann Hepatol. 2006;5(1):30–33. PMID: 16531962. doi:10.1016/S1665-2681(19)32036-8
8. Angulo P, Hui JM, Marchesini G, et al. The NAFLD fibrosis score: a noninvasive system that identifies liver fibrosis in patients with NAFLD. Hepatology. 2007;45(4):846–854. PMID: 17393509. doi:10.1002/hep.21496
9. Ma X, Liu S, Dong M, Wang Y, Wang M, Xin Y. Proportion of NAFLD patients with normal ALT value in overall NAFLD patients: a systematic review and meta-analysis. BMC Gastroenterol. 2020;20(1):10. PMID: 31937252. doi:10.1186/s12876-020-1165-z
10. Mofrad P, Contos MJ, Haque M, et al. Clinical and histologic spectrum of nonalcoholic fatty liver disease associated with normal ALT values. Hepatology. 2003;37(6):1286–1292. PMID: 12774006. doi:10.1053/jhep.2003.50229
11. Prati D, Taioli E, Zanella A, et al. Updated definitions of healthy ranges for serum alanine aminotransferase levels. Ann Intern Med. 2002;137(1):1–10. PMID: 12093239. doi:10.7326/0003-4819-137-1-200207020-00006
12. Zeng MD, Fan JG, Lu LG, et al. Guidelines for the diagnosis and treatment of nonalcoholic fatty liver diseases. J Dig Dis. 2008;9(2):108–112. PMID: 18419645. doi:10.1111/j.1751-2980.2008.00331.x
13. Wong VW, Vergniol J, Wong GL, et al. Diagnosis of fibrosis and cirrhosis using liver stiffness measurement in nonalcoholic fatty liver disease. Hepatology. 2010;51(2):454–462. PMID: 20101745. doi:10.1002/hep.23312
14. Lupsor M, Badea R, Stefanescu H, et al. Performance of unidimensional transient elastography in staging non-alcoholic steatohepatitis. J Gastrointestin Liver Dis. 2010;19(1):53–60. PMID: 20361076.
15. Kumar R, Rastogi A, Sharma MK, et al. Liver stiffness measurements in patients with different stages of nonalcoholic fatty liver disease: diagnostic performance and clinicopathological correlation. Dig Dis Sci. 2013;58(1):265–274. PMID: 22790906. doi:10.1007/s10620-012-2306-1]
16. Chalasani N, Younossi Z, Lavine JE, et al. The diagnosis and management of non-alcoholic fatty liver disease: practice guideline by the American association for the study of liver diseases, American college of gastroenterology, and the American gastroenterological association. Hepatology. 2012;55(6):2005–2023. PMID: 22488764. doi:10.1002/hep.25762
17. Blachier M, Leleu H, Peck-Radosavljevic M, Valla DC, Roudot-Thoraval F. The burden of liver disease in Europe: a review of available epidemiological data. J Hepatol. 2013;58(3):593–608. PMID: 23419824. doi:10.1016/j.jhep.2012.12.005
18. Caldwell SH, Oelsner DH, Iezzoni JC, Hespenheide EE, Battle EH, Driscoll CJ. Cryptogenic cirrhosis: clinical characterization and risk factors for underlying disease. Hepatology. 1999;29(3):664–669. PMID: 10051466. doi:10.1002/hep.510290347]
19. Armstrong MJ, Houlihan DD, Bentham L, et al. Presence and severity of non-alcoholic fatty liver disease in a large prospective primary care cohort. J Hepatol. 2012;56(1):234–240. PMID: 21703178. doi:10.1016/j.jhep.2011.03.020]
20. Rej R. Aspartate aminotransferase activity and isoenzyme proportions in human liver tissues. Clin Chem. 1978;24(11):1971–1979. PMID: 213206. doi:10.1093/clinchem/24.11.1971
21. Pratt DS, Kaplan MM. Evaluation of abnormal liver-enzyme results in asymptomatic patients. N Engl J Med. 2000;342(17):1266–1271. PMID: 10781624. doi:10.1056/NEJM200004273421707
22. Fracanzani AL, Valenti L, Bugianesi E, et al. Risk of severe liver disease in nonalcoholic fatty liver disease with normal aminotransferase levels: a role for insulin resistance and diabetes. Hepatology. 2008;48(3):792–798. PMID: 18752331. doi:10.1002/hep.22429
23. Musso G, Gambino R, Cassader M, Pagano G. Meta-analysis: natural history of non-alcoholic fatty liver disease (NAFLD) and diagnostic accuracy of non-invasive tests for liver disease severity. Ann Med. 2011;43(8):617–649. PMID: 21039302. doi:10.3109/07853890.2010.518623
24. Ruhl CE, Everhart JE. Determinants of the association of overweight with elevated serum alanine aminotransferase activity in the United States. Gastroenterology. 2003;124(1):71–79. PMID: 12512031. doi:10.1053/gast.2003.50004
25. Kunde SS, Lazenby AJ, Clements RH, Abrams GA. Spectrum of NAFLD and diagnostic implications of the proposed new normal range for serum ALT in obese women. Hepatology. 2005;42(3):650–656. PMID: 16037946. doi:10.1002/hep.20818
 © 2021 The Author(s). This work is published and licensed by Dove Medical Press Limited. The full terms of this license are available at https://www.dovepress.com/terms.php and incorporate the Creative Commons Attribution - Non Commercial (unported, v3.0) License.
By accessing the work you hereby accept the Terms. Non-commercial uses of the work are permitted without any further permission from Dove Medical Press Limited, provided the work is properly attributed. For permission for commercial use of this work, please see paragraphs 4.2 and 5 of our Terms.
© 2021 The Author(s). This work is published and licensed by Dove Medical Press Limited. The full terms of this license are available at https://www.dovepress.com/terms.php and incorporate the Creative Commons Attribution - Non Commercial (unported, v3.0) License.
By accessing the work you hereby accept the Terms. Non-commercial uses of the work are permitted without any further permission from Dove Medical Press Limited, provided the work is properly attributed. For permission for commercial use of this work, please see paragraphs 4.2 and 5 of our Terms.