")
Back to Journals » OncoTargets and Therapy » Volume 8
Correlation of 18F-fluoroethyl tyrosine positron-emission tomography uptake values and histomorphological findings by stereotactic serial biopsy in newly diagnosed brain tumors using a refined software tool
Authors Lopez WO, Cordeiro JG, Albicker U, Doostkam S, Nikkhah G, Kirch R, Trippel M, Reithmeier T
Received 22 April 2015
Accepted for publication 16 July 2015
Published 17 December 2015 Volume 2015:8 Pages 3803—3815
DOI https://doi.org/10.2147/OTT.S87126
Checked for plagiarism Yes
Review by Single anonymous peer review
Peer reviewer comments 5
Editor who approved publication: Dr Faris Farassati
William Omar Contreras Lopez,1,2 Joacir Graciolli Cordeiro,1 Ulrich Albicker,3 Soroush Doostkam,4 Guido Nikkhah,1,5 Robert D Kirch,6 Michael Trippel,1 Thomas Reithmeier1,7
1Department of Stereotactic and Functional Neurosurgery, University Medical Center Freiburg, Freiburg im Breisgau, Germany; 2Division of Functional Neurosurgery, Department of Neurology, Hospital das Clinicas, University of São Paulo Medical School, São Paulo, Brazil; 3Inomed, Emmendingen, 4Department of Neuropathology, University Medical Center Freiburg, Freiburg im Breisgau, 5Department of Neurosurgery, University Clinic Erlangen, Erlangen, 6Neuroelectronic Systems, Department of Neurosurgery, University Medical Center Freiburg, Freiburg im Breisgau, 7Department of Neurosurgery, Schwabing Academic Teaching Hospital of Technical University and Ludwig Maximilian University of Munich, Munich, Germany
Background: Magnetic resonance imaging (MRI) is the standard neuroimaging method to diagnose neoplastic brain lesions, as well as to perform stereotactic biopsy surgical planning. MRI has the advantage of providing structural anatomical details with high sensitivity, though histological specificity is limited. Although combining MRI with other imaging modalities, such as positron-emission tomography (PET), has proven to increment specificity, exact correlation between PET threshold uptake ratios (URs) and histological diagnosis and grading has not yet been described.
Objectives: The aim of this study was to correlate exactly the histopathological criteria of the biopsy site to its PET uptake value with high spatial resolution (mm3), and to analyze the diagnostic value of PET using the amino acid O-(2-[18F]fluoroethyl)-L-tyrosine (18F-FET) PET in patients with newly diagnosed brain lesions in comparison to histological findings obtained from stereotactic serial biopsy.
Patients and methods: A total of 23 adult patients with newly diagnosed brain tumors on MRI were enrolled in this study. Subsequently to diagnoses, all patients underwent a 18F-FET PET-guided stereotactic biopsy, using an original newly developed software module, which is presented here. Conventional MRI, stereotactic computed tomography series, and 18F-FET PET images were semiautomatically fused, and hot-spot detection was performed for target planning. UR was determined using the uptake value from the biopsy sites in relation to the contralateral frontal white matter. UR values ≥1.6 were considered positive for glioma. High-grade glioma (HGG) was suspected with URs ≥3.0, while low-grade glioma (LGG) was suspected with URs between 1.6 and 3.0. Stereotactic serial biopsies along the trajectory at multiple sites were performed in millimeter steps, and the FET URs for each site were correlated exactly with a panel of 27 different histopathological markers. Comparisons between FET URs along the biopsy trajectories and the histological diagnoses were made with Pearson product-moment correlation coefficients. Analysis of variance was performed to test for significant differences in maximum UR between different tumor grades.
Results: A total of 363 biopsy specimens were taken from 23 patients by stereotactic serial biopsies. Histological examination revealed eight patients (35%) with an LGG: one with a World Health Organization (WHO)-I lesion and seven with a WHO-II lesion. Thirteen (57%) patients revealed an HGG (two with a WHO-III and three with a WHO-IV tumor), and two patients (9%) showed a process that was neither HGG nor LGG (group X or no-grade group). The correlation matrix between histological findings and the UR revealed five strong correlations. Low cell density in tissue samples was found to have a significant negative correlation with the measured cortical uptake rate (r=-0.43, P=0.02), as well as moderate cell density (r=-0.48, P=0.02). Pathological patterns of proliferation (r=0.37, P=0.04), GFAP (r=0.37, P=0.04), and Olig2 (r=0.36, P=0.05) showed a significant positive correlation with cortical URs. Analysis of variance tests showed a significant difference between the LGG and the HGG groups (F=8.27, P<0.002), but no significant differences when differentiating between the X group and the HGG (P=0.2)/LGG (P=0.8) groups, nor between the no-grade group and the WHO-I group.
Conclusion: 18F-FET PET is a valuable tool, as it allows the differentiation of HGGs from LGGs. Its use is not limited to preoperative evaluation; it may also refine biopsy targeting and improve tumor delimitation for radiotherapy. Histology is still necessary, and remains the gold standard for definitive diagnosis of brain lesions.
Keywords: stereotactic serial biopsy, newly developed software module, newly diagnosed brain lesions, biopsy target, diagnostic and treatment management of cerebral gliomas, 18F-FET PET-guided stereotactic biopsy
Introduction
Intracerebral tumors represent a significant health problem and major imaging challenge, comprising a heterogeneous group of tumors, mainly represented by gliomas (50%), other neuroepithelial tumors, lymphomas, and tumors of the myelin sheath.1 Additional important differential diagnoses include brain metastases, infectious diseases, and demyelinating disorders. The overall annual incidence rate of primary malignant and benign brain tumors in developed countries is approximately 15 per 100,000 individuals, and for primary malignant brain tumors it is seven per 100,000. Brain-tumor incidence and mortality have increased by up to 300% over the past 3 decades, primarily in people aged over 75 years.2
Differentiating between a glioma and nonglioma disease, as well as being aware of the exact histopathological grading, is still not possible, even with sophisticated neuroimaging techniques.3–6 Given its wide distribution and prevalence, the study of gliomas is one of the pillars of neuro-oncology. It is known that the histological differentiation of gliomas and grading are predictors for both aggressiveness and outcome.7,8 High-grade gliomas (HGGs) represent the increased complexity in neuroimaging diagnostics, by evaluating aberrant microvascular proliferations, large tissue invasion, necrosis, and perilesional edema, among others. Such heterogeneity represents a diagnosis and therapeutic challenge when facing a stereotactic biopsy or surgical resection decision.9 In the former case, it is a priority to sample areas of high malignancy, in order to avoid tumor subgrading. In the latter, it is the definition of tumor borders for surgical resection. Another challenge, of equal magnitude, is postoperative imaging control, since discernment between tumor remnants, treatment-induced tissue changes (ie, necrosis, pseudoprogression and pseudoregression), and tumor proliferation is difficult.10
Stereotactic serial biopsy (SSB) is a minimally invasive procedure to obtain tissue from an intracerebral lesion, with low morbidity and mortality. In neuro-oncological patients, SSB has been used to establish histopathological diagnosis prior to therapeutic decisions.4
At present, magnetic resonance imaging (MRI) is the standard imaging modality which is employed to guide for surgical planning of a brain tumor biopsy or resection in neurosurgery. This is so in part due to the large anatomical detail that the method offers.11 Advantages of MRI include its accurate morphological and structural neural tissue evaluation, however this method does not provide information about biological tumor activity.12
Law et al evaluated the value of conventional and sophisticated MRI techniques like perfusion MRI and proton MR spectroscopy imaging for noninvasive grading of gliomas. Sensitivity, specificity, positive predictive value (PPV), and negative predictive values (NPV) for determining an HGG with conventional MRI were 72.5%, 65.0%, 86.1%, and 44.1%, respectively. Moreover, the integration of cerebral blood-volume measurements, metabolic ratios (choline:creatine, choline:N-acetylaspartate, and N-acetylaspartate:creatine) resulted in increased sensitivity, specificity, PPV, and NPV of 93.3%, 60.0%, 87.5%, and 75.0%, respectively. Differentiating grade III from grade IV tumors in the high-grade group, as well as differentiating grade II from grade I tumors in the low-grade group, was not performed, nor was the cellular origin of the glioma defined (astrocytes, oligodendrocytes, etc).13
All these findings may have a significant impact on therapeutic decisions. Therefore molecular imaging using positron-emission tomography (PET) is an interesting alternative that might overcome these limitations of MRI. Based on the tracer used to perform PET,15 this image modality can provide information about glucose, amino acid, thymidine, and choline metabolism, thereby allowing identification of hypermetabolic zones and determining the extent of a proliferation activity.14
This method has been used to evaluate patients with gliomas since 1970; however, it is not present in every center around the world, when compared to MRI which is generally cheaper and more available worldwide.15 PET can characterize the biological process from the metabolic to molecular level, and may define the limits of the tumor.16 There are many radiotracers used, depending on the information to be obtained.16,17 The use of radiolabeled amino acids in PET, such as O-(2-[18F]fluoroethyl)-L-tyrosine (18F-FET) allows a better delineation of tumoral margins, improving target biopsy and radiotherapy sites, as well as the surgical plan.18 Other imaging agents used in PET for evaluation of gliomas are: 3,4-dihydroxy-6-[18F]fluoro-l-phenylalanine (18F-DOPA)19 and 11C-methionine.20
The objective of this original work was to explore the diagnostic value of PET using amino acid 18F-FET in patients with newly diagnosed brain lesions by an exact comparison of FET uptake ratios (URs) to histological findings obtained from SSB with high spatial resolution. The literature dealing with the diagnostic value of metabolic imaging does not consider this aspect, as the exact definition of URs to the biopsy site has not been possible with conventional stereotactic software tools.
Patients and methods
A total of 23 adult patients with newly diagnosed brain lesions on MRI were enrolled in this study, performed at the Neurosurgery Department of Freiburg University Medical Center, Germany. The study was presented to and approved by the Freiburg University ethics committee. An informed consent form was signed by all patients. All patients underwent 18F-FET PET examination and subsequently PET-guided stereotactic biopsy, using an originally developed software package.21 Conventional MRI, stereotactic frame computed tomography (CT) images and 18F-FET PET images were semiautomatically fused, and automatic hot-spot detection within the tumor was performed. The URs along the trajectory and biopsy were automatically calculated in 1 mm steps and analyzed to correlate URs exactly with 27 different histopathological criteria: coagulated blood, diapedesis bleeding, acute hemorrhage, exudate, edema, gliosis, tissue-infiltration zone, low cell density, moderate cell density, strong cell density, pathological pattern of proliferation, prominent blood vessels, mitosis, necrosis, GFAP (GFAP immunoreactivity highlights the glioblastomatous component of the tumor), NogoA (oligodendrocytic marker, strongly expressed in 71% of oligodendrogliomas), MAP2 (marker for mature neurons), Olig2 (oligodendroglial lineage marker, universally expressed in diffused gliomas, higher in anaplastic oligodendrogliomas versus glioblastomas), p53 (tumor-suppressor gene), tibor peroxidase–antiperoxidase silver impregnation for reticulin (increased reticulin staining highlights the spindle-cell sarcomatous component tumor), vimentin (positive in glial processes of cerebellar pilocytic astrocytomas, in Schwann cell neurinomas, and in endothelial cells of all oncotypes), strong gliosis, central nervous system with cell proliferation, macrophages, lateral fluid percussion (tumor-necrosis factor), periodic acid–Schiff stain (used to detect fungal organisms and cytoplasmic accumulation of glycogen) positive myelin, reactive changes, and lymphocyte infiltration.
Definition of uptake ratio
18F-FET UR is determined by calculating the relationship between the mean maximum standardized uptake value from the biopsy area and the mean standardized uptake value from an arbitrary reference area. For this work, we employed the contralateral frontal lobe white matter (Figures 1–7). A UR value ≥1.6 was considered positive for glioma. HGG was suspected with UR ≥3.0, while low-grade glioma (LGG) was suspected with UR between 1.6 and 3.0.
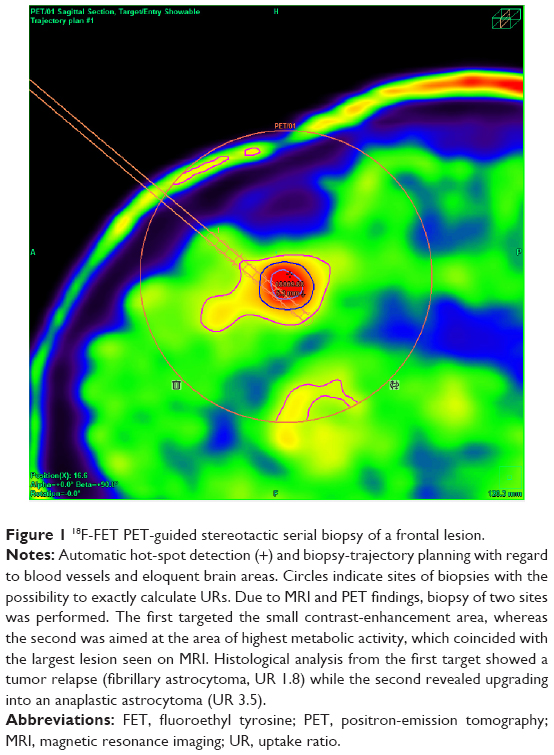 | Figure 1 18F-FET PET-guided stereotactic serial biopsy of a frontal lesion. |
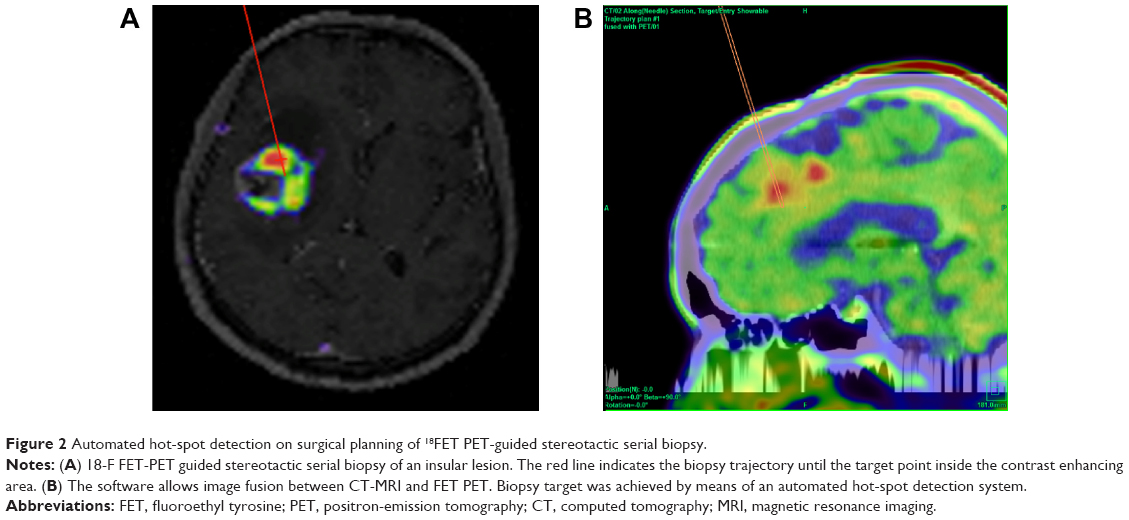 | Figure 2 Automated hot-spot detection on surgical planning of 18FET PET-guided stereotactic serial biopsy. |
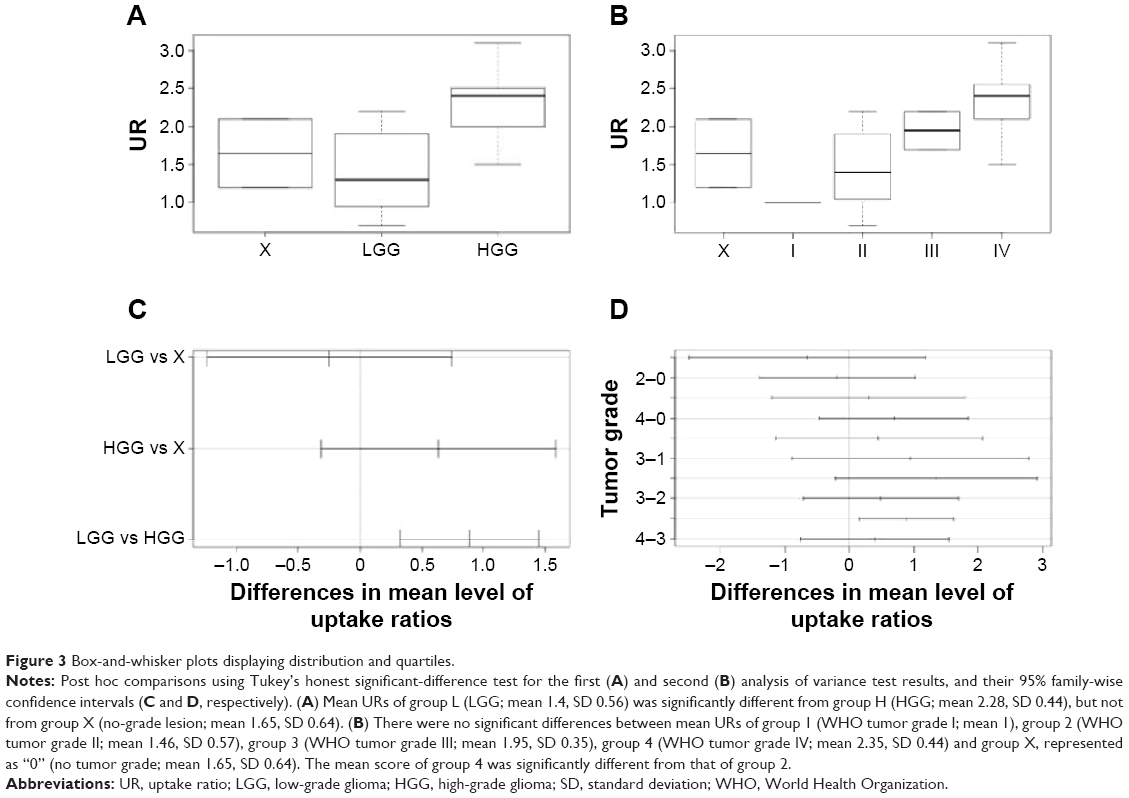 | Figure 3 Box-and-whisker plots displaying distribution and quartiles. |
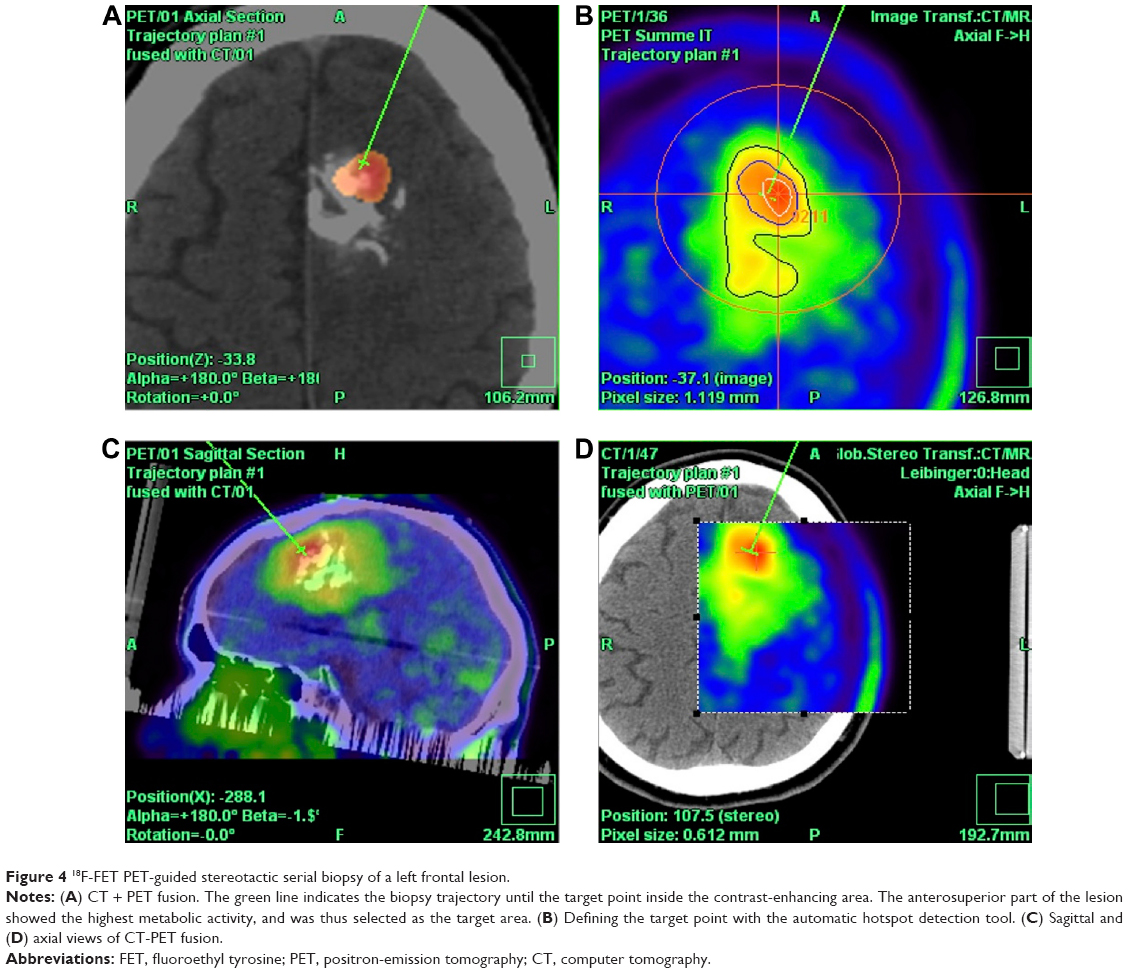 | Figure 4 18F-FET PET-guided stereotactic serial biopsy of a left frontal lesion. |
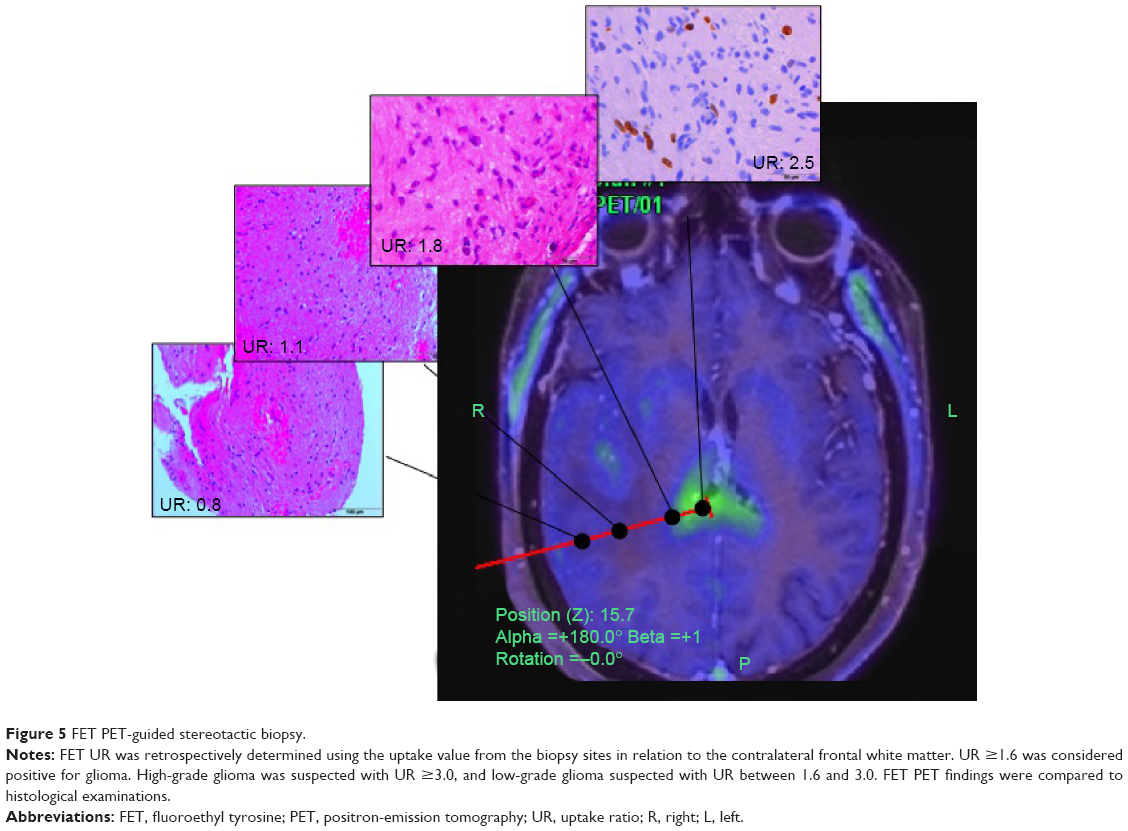 | Figure 5 FET PET-guided stereotactic biopsy. |
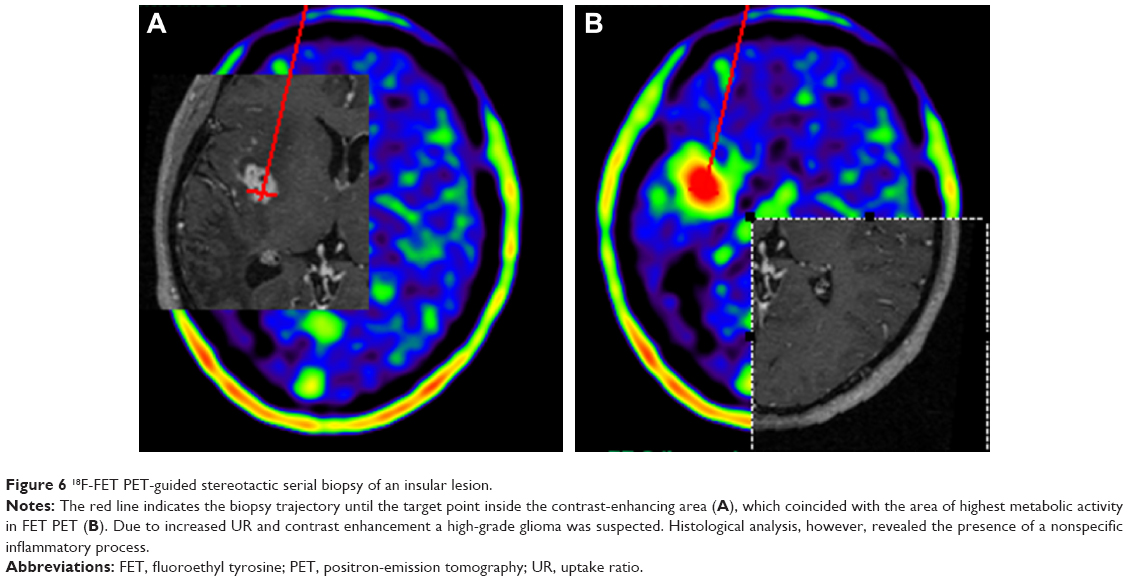 | Figure 6 18F-FET PET-guided stereotactic serial biopsy of an insular lesion. |
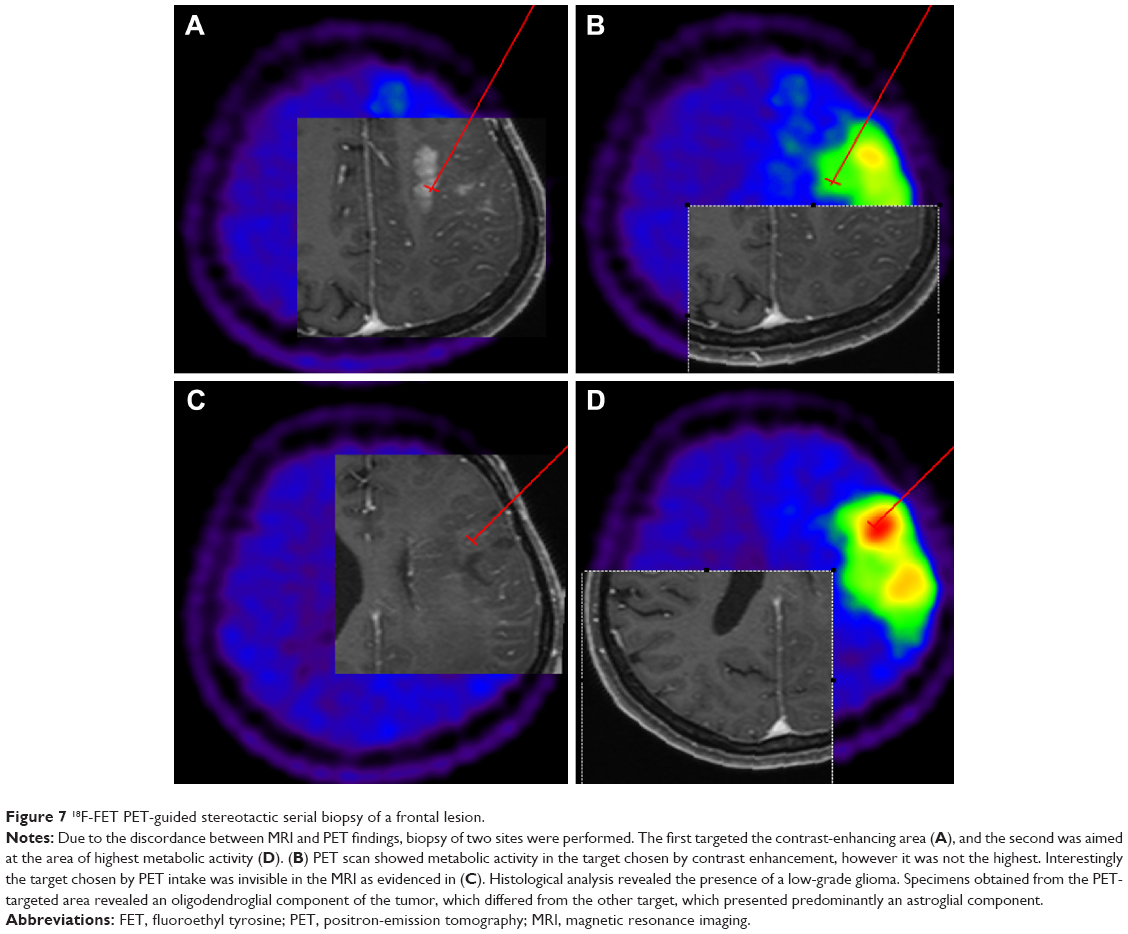 | Figure 7 18F-FET PET-guided stereotactic serial biopsy of a frontal lesion. |
Preoperative evaluation
SSB was indicated as the final diagnostic step to obtain a histopathological diagnosis for brain lesions when clinical and neuroradiological findings were inconclusive, for lesions not amenable for resection, diffusely infiltrating lesions, and small deep-seated or multiple lesions.22 In patients with tumors nearby functionally relevant areas and an unclear radiological diagnosis, SSB was first indicated for establishing a histopathological diagnosis and to plan further therapeutic steps, and afterward to offer the patient alternatives to a sometimes risky resection.
For SSB, a modified Riechert–Mundinger stereotactic system was used, and serial biopsies were taken with microforceps with a diameter of 1.4 mm as previously described.13 Preoperative workup included 1.5 or 3.0 T MRI of 1 mm slices, sagittal T1-weighted MRI after gadolinium enhancement, and additionally a T2-weighted sequence of 1 mm sagittal slices in the case of non-contrast-enhancing lesions.
MRI and 18F-FET PET were taken the day before surgery. Prior to PET, patients fasted for at least 6 hours. Euro PET GmbH (Freiburg, Germany) provided the FET PET medium. Scanning was performed with an ECAT Exact 922 scanner (CTI/Siemens, Knoxville, TN, USA). Per case, a total of 250 MBq of FET was intravenously infused. Emission scans were performed in three-dimensional mode from 10 to 25 minutes after FET injection, with measured attenuation correction. PET data were iteratively reconstructed using the ordered subset-expectation maximization-reconstruction algorithm.
On the day of operation, cranial CT after contrast enhancement with the stereotactic frame mounted to the head of the patient was performed and semi-automatically fused with the MRI and 18-FET-PET images.
Trajectory planning
Stereotactic planning was performed using the Inomed planning system (TatraMed SRO, Bratislava, Slovak Republic; Inomed, Emmendingen, Germany). Stereotactic CT was transformed, coregistered, and fused with preoperative MRI and FET PET through the software package.
The biopsy target point (highest FET uptake inside the hot spot) was defined automatically by the software hot spot-detection tool, selecting the area that presented the strongest metabolic activity; the trajectory was manually adopted to avoid prominent blood vessels or eloquent brain areas (Figures 4–7).
Statistical analysis
18F-FET PET URs were compared with histological examinations. Descriptive statistics were calculated first for the following histopathological characteristics: coagulated blood, diapedesis bleeding, acute hemorrhage, exudate, edema, gliosis, tissue-infiltration zone, low cell density, moderate cell density, strong cell density, pathological pattern of proliferation, prominent blood vessels, mitosis, necrosis, GFAP, NogoA, GFAP, MAP2, Olig2, p53, tibor peroxidase–antiperoxidase silver impregnation for reticulin, vimentin, strong gliosis, central nervous system with cell proliferation, macrophages, lateral fluid percussion- or periodic acid–Schiff-positive myelin, reactive changes, and lymphocyte infiltrates.
The 18F-FET PET uptake values of all biopsy sites taken along the stereotactic trajectory were calculated exactly with the aid of the newly developed software tool. In order to assess linear dependencies between histological findings and the calculated cortical URs, the Pearson product-moment correlation coefficient was calculated for each finding. We considered P-values <0.05 as indicators for a significant relationship between UR and histopathological characteristics.
In a second step, significant differences in URs between the groups of HGG, LGG, and other pathological entities were assessed using analysis of variance (ANOVA). Here also, P<0.05 was considered to indicate statistical significance.
Results
Patient data
A total of 23 adult patients with image-based newly diagnosed brain tumors were enrolled in this study at the Department of Neurosurgery, University of Freiburg, Germany. The population consisted of five females (22%) and 18 males (78%) with ages between 26 and 84 years (average 56 years, median 60 years).
Histopathology
A total of 363 tissue samples were taken from these 23 patients by frame-based SSB, with a range of seven to 50 samples per trajectory and an average of 16 samples taken per patient (median 15). Eight patients (35%) were diagnosed with an LGG: one with a World Health Organization (WHO) grade I lesion and seven with a WHO grade II lesion. Another 13 (57%) patients revealed an HGG: two a WHO grade III and eleven a WHO grade IV tumor. Two patients (9%) showed a process that was neither graded HGG nor LGG, called group X or the no-grade group.
Linear dependencies
The correlation matrix among histological findings and cortical UR revealed five strong correlations (Table 1). Low cell density in tissue samples was found to have a significant negative correlation with measured cortical UR (r=−0.43, P=0.02), as well as moderate cell density (r=−0.48, P=0.02). Additionally to those two negative correlations, we found three positive and significant associations. Pathological pattern of proliferation showed a coefficient of 0.37 (P=0.04), GFAP also correlated at 0.37 (P=0.04), and Olig2 showed a strong positive correlation with cortical UR (r=0.36, P=0.05).
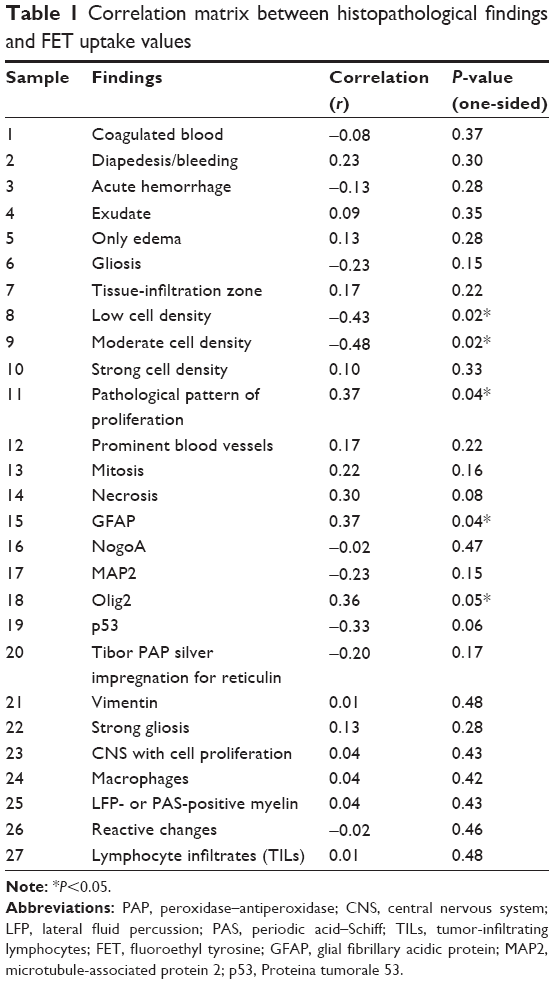 | Table 1 Correlation matrix between histopathological findings and FET uptake values |
Differences between means
A major objective in the assessment of the diagnostic value of PET is to look for differences between the cortical uptake rates per tumor grading. Consequently, two ANOVAs23 were calculated, the first to see if there were differences between three grading groups on cortical uptake rate: LGG, HGG, and the no-grade group. The second ANOVA was calculated over all four WHO tumor grades plus the no-grade group.
First ANOVA (three groups: H, L, and X)
A one-way ANOVA was calculated to test for differences in cortical UR among three different groups of brain lesions (X, LGG, HGG). Average cortical UR differed significantly across the three types (F=8.27, P=0.002) (Table 2).
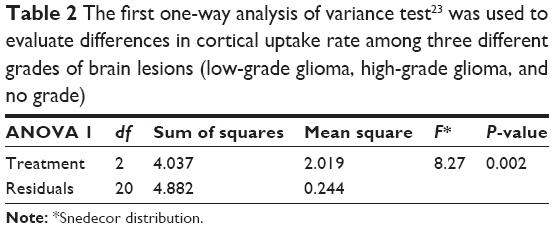 | Table 2 The first one-way analysis of variance test23 was used to evaluate differences in cortical uptake rate among three different grades of brain lesions (low-grade glioma, high-grade glioma, and no grade) |
Post hoc comparisons using Tukey’s honest significant difference test indicated that the mean score of the LGG group (1.4, standard deviation [SD] 0.56) differed significantly (P=0.002) from the HGG group (2.28, SD 0.44). The mean score of group X (no-grade lesion; 1.65, SD 0.64) was neither significantly different from that of the HGG group (P=0.23) nor of the LGG group (P=0.8) (Table 3 and Figure 3).
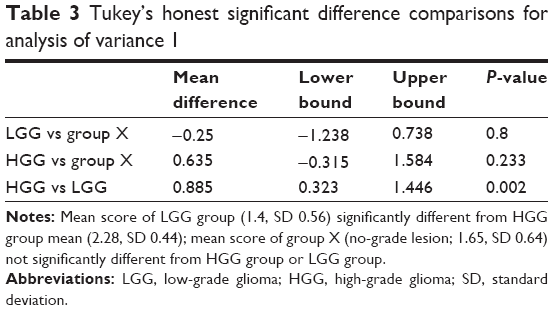 | Table 3 Tukey’s honest significant difference comparisons for analysis of variance 1 |
Second ANOVA (five groups: 1, 2, 3, 4, and X)
Another one-way between-group ANOVA was run to find differences in cortical UR among five different grade groups (WHO grades I–IV and group X). Again, a significant difference between groups was found: (F=4.5, P=0.01) (Table 4). However, Tukey’s honest significance test (Table 5) indicated that the group 1 mean (WHO grade I; 1) was neither different from group 2 (WHO grade II; 1.46, SD 0.57), group 3 (WHO grade III; 1.95, SD 0.35), group 4 (WHO grade IV; 2.35, SD 0.44), nor group X (1.65, SD 0.64). The only significant difference found here was between tumor grades II and IV (P=0.012) (Figure 3, B and D and Tables S1 and S2).
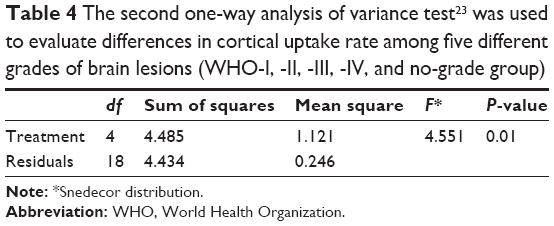 | Table 4 The second one-way analysis of variance test23 was used to evaluate differences in cortical uptake rate among five different grades of brain lesions (WHO-I, -II, -III, -IV, and no-grade group) |
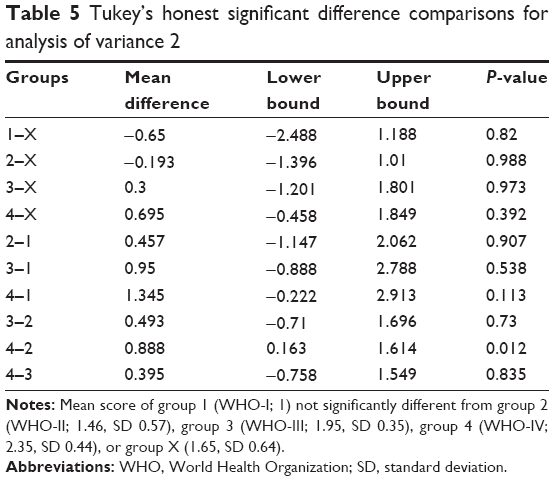 | Table 5 Tukey’s honest significant difference comparisons for analysis of variance 2 |
Discussion
The aim of this study was to correlate exactly URs of 18F-FET PET examinations to detailed histomorphological criteria in patients with newly diagnosed brain lesions. Amino acid radiotracers used in PET are highly taken up by glial tumors compared to normal brain tissue, resulting in a high tumor-to-brain contrast. Several radiotracers have been suggested to evaluate gliomas for different purposes, such as diagnostic, grading, recurrence, planning, and monitoring therapy. 18F-FET is an artificial amino acid that is increasingly taken up by upregulated tumor cells due to increased metabolism, though not incorporated into proteins.24,25 However, inflammatory and ischemic lesions can also have enhanced amino acid uptake in humans, which could compromise the specificity of the technique. Other imaging agents used in evaluations of gliomas are 18F-DOPA19 and 11C-methionine.20
In a systematic review and meta-analysis25 on the performance of 18F-FET PET for the differential diagnosis of primary brain tumors, PET showed great performance for newly diagnosed brain lesions, with sensitivity of 82% and 84% and average specificity of 76% and 75% for the diagnosis of brain tumor and glioma, respectively. Etiologic diagnosis based on MRI has high sensitivity, but limited specificity of approximately 68%. The ability of FET to assess tumor nature is superior to that provided by single MRI, and combined PET–MRI-guided diagnostic biopsy increases specificity of 53% for MRI alone and to 94% when combined.26 When both were combined with MR spectroscopy, a specificity of even 97% was achieved.27
Several authors have evaluated the usefulness of multimodal imaging approaches in the diagnosis of gliomas. Gempt et al10 evaluated the performance of such an approach for newly diagnosed brain lesions to distinguish the different areas of malignant gliomas and to investigate the predictive power of such an approach toward the histology of the lesions. They performed conventional MRI (MR spectroscopy, perfusion-weighted imaging) and FET PET of brain lesions prior to surgical resection, established eight points of biopsy sites, and evaluated the performance of each modality both individually and jointly, while biopsy samples were histopathologically assessed. MIB-1 and CD31 markers correlated with findings defined as “tumor” (T2 hyperintensity, contrast enhancement, increased choline:creatine ratios, relative cerebral blood volume, and pathological T:B-cell ratios). Significances in correlation between N-acetylaspartate:creatine ratio and PET tracer uptake were found, and also between choline:creatine, cell density and N-acetylaspartate:creatine ratio. The presence of MIB-1 was also predominant in biopsies marked as “tumor” when obtained by MRI + PET, but not when MRI or PET were applied individually. The authors concluded that lesions targeted with a multimodal imaging approach increased positive correlations with histological indices of malignancy (eg, MIB-1) compared to those targets only biopsied based on amino acid uptake or MRI contrast enhancement alone.
In this study, a significant negative relationship between low-to-moderate cell density and 18F-FET UR was observed. On the other hand, a significant and positive relationship between 18F-FET UR and patterns of pathological proliferation, as well as expression of GFAP and Olig-2, was observed. Interestingly, no other histopathological criteria showed a strong correlation with 18F-FET URs. This is a further indicator that 18F-FET is selectively incorporated by proliferating astrocytes (GFAP expression) or oligodendrocytes (Olig-2). Based on the results after the implementation of the first ANOVA test, we found that the diagnostic value of 18F-FET PET is to allow for differentiation between HHG and LGG, but not between the X group and HGG or LGG. The latter probably was due to the fact that inflammation might also accumulate 18FET. While Tukey’s honest significance test for ANOVA 2 did not show significance between the WHO-I group and group X (P<0.82), this can reasonably be explained by the insufficient sample size (n=1). According to the observations reported in this paper and those already supported by the literature, the use of PET is not limited to preoperative evaluation, but refines the determination of biopsy targets, improves tumor delineation, and facilitates radiation targets. So far, static 18FET PET still cannot provide a gradation with acceptable accuracy. Therefore, histological evaluation remains essential in making treatment decisions. However, dynamic FET-PET techniques may overcome these limitations in the future.
Conclusion
Although MRI is the standard imaging modality for tumor biopsy or resection in neurosurgery, stereotactic biopsy guided only by this modality may lead to inadequate tumor grading, resulting in undertreatment. 18F-FET PET provides identification of pathological areas within a newly diagnosed brain lesion, and thus defines the most reliable biopsy target. It also achieves differentiation of LGGs from HGGs with high statistical significance. However, 18F-FET PET was not able to offer acceptable grading accuracy or cell-type differentiation, which makes histological analysis still indispensable for therapeutic decisions.
Disclosure
Inomed partly sponsored this work. The authors report no other conflicts of interest in this work.
References
Rigau V, Zouaoui S, Mathieu-Daudé H, et al. French brain tumor database: 5-year histological results on 25,756 cases. Brain Pathol. 2011;21(6):633–644. | ||
Minn Y, Bondy M, Wrensch M. Epidemiology. In: Bernstein M, Berger MS, editors. Neuro-oncology: The Essentials. 2nd ed. Stuttgart: Thieme Medical Publishers; 2008:3–17. | ||
Choksey MS, Valentine A, Shawdon H, Freer CE, Lindsay KW. Computed tomography in the diagnosis of malignant brain tumours: do all patients require biopsy? J Neurol Neurosurg Psychiatry. 1989;52(7):821–825. | ||
Chandrasoma PT, Smith MM, Apuzzo ML. Stereotactic biopsy in the diagnosis of brain masses: comparison of results of biopsy and resected surgical specimen. Neurosurgery. 1989;24(2):160–165. | ||
Feiden W, Steude U, Bise K, Gündisch O. Accuracy of stereotactic brain tumor biopsy: comparison of the histologic findings in biopsy cylinders and resected tumor tissue. Neurosurg Rev. 1991;14(1):51–56. | ||
Glantz MJ, Burger PC, Herndon JE, et al. Influence of the type of surgery on the histologic diagnosis in patients with anaplastic gliomas. Neurology. 1991;41(11):1741–1744. | ||
Nakazato Y. [Revised WHO classification of brain tumours]. Brain Nerve. 2008;60(1):59–77. Japanese. | ||
Louis DN, Ohgaki H, Wiestler OD, et al. The 2007 WHO classification of tumours of the central nervous system. Acta Neuropathol. 2007;114(2):97–109. | ||
Paulus W, Peiffer J. Intratumoral histologic heterogeneity of gliomas. A quantitative study. Cancer. 1989;64(2):442–447. | ||
Gempt J, Soehngen E, Förster S, et al. Multimodal imaging in cerebral gliomas and its neuropathological correlation. Eur J Radiol. 2014;83(5):829–834. | ||
Essig M, Weber MA, von Tengg-Kobligk H, Knopp MV, Yuh WT, Giesel FL. Contrast-enhanced magnetic resonance imaging of central nervous system tumors: agents, mechanisms, and applications. Top Magn Reson Imaging. 2006;17(2):89–106. | ||
Upadhyay N, Waldman AD. Conventional MRI evaluation of gliomas. Br J Radiol. 2011;84 Spec 2:S107–S111. | ||
Law M, Yang S, Wang H, et al. Glioma grading: sensitivity, specificity, and predictive values of perfusion MR imaging and proton MR spectroscopic imaging compared with conventional MR imaging. AJNR Am J Neuroradiol. 2003;24(10):1989–1998. | ||
La Fougère C, Suchorska B, Bartenstein P, Kreth FW, Tonn JC. Molecular imaging of gliomas with PET: opportunities and limitations. Neuro Oncol. 2011;13(8):806–819. | ||
Waldman AD, Jackson A, Price SJ, et al. Quantitative imaging biomarkers in neuro-oncology. Nat Rev Clin Oncol. 2009;6(8):445–454. | ||
Singhal T. Positron emission tomography applications in clinical neurology. Semin Neurol. 2012;32(4):421–431. | ||
Demetriades AK, Almeida AC, Bhangoo RS, Barrington SF. Applications of positron emission tomography in neuro-oncology: a clinical approach. Surgeon. 2014;12(3):148–157. | ||
Galldiks N, Langen KJ. [Use of amino acid PET in the diagnostic and treatment management of cerebral gliomas]. Fortschr Neurol Psychiatr. 2012;80(1):17–23. German. | ||
Pafundi DH, Laack NN, Youland RS, et al. Biopsy validation of 18F-DOPA PET and biodistribution in gliomas for neurosurgical planning and radiotherapy target delineation: results of a prospective pilot study. Neuro Oncol. 2013;15(8):1058–1067. | ||
Glaudemans AW, Enting RH, Heesters MA, et al. Value of 11C-methionine PET in imaging brain tumours and metastases. Eur J Nucl Med Mol Imaging. 2013;40(4):615–635. | ||
Reithmeier T, Cordeiro J, Mix M, Trippel M, Rottenburger C, Nikkhah G. Impact of automated hotspot detection for (18)FET PET-guided stereotactic biopsy. Acta Neurochir Suppl. 2013;117:93–99. | ||
Reithmeier T, Lopez WO, Doostkam S, et al. Intraindividual comparison of histopathological diagnosis obtained by stereotactic serial biopsy to open surgical resection specimen in patients with intracranial tumours. Clin Neurol Neurosurg. 2013;115(10):1955–1960. | ||
Wessa, P. Free Statistics Software, Office for Research Development and Education, version 1.1.23-r7. 2015. Avaiable from: http://www.wessa.net/ | ||
Wester HJ, Herz M, Weber W, et al. Synthesis and radiopharmacology of O-(2-[18F]fluoroethyl)-L-tyrosine for tumor imaging. J Nucl Med. 1999;40(1):205–212. | ||
Dunet V, Rossier C, Buck A, Stupp R, Prior JO. Performance of 18F-fluoro-ethyl-tyrosine (18F-FET) PET for the differential diagnosis of primary brain tumor: a systematic review and metaanalysis. J Nucl Med. 2012;53(2):207–214. | ||
Pauleit D, Floeth F, Hamacher K, et al. O-(2-[18F]fluoroethyl)-L-tyrosine PET combined with MRI improves the diagnostic assessment of cerebral gliomas. Brain. 2005;128(Pt 3):678–687. | ||
Floeth FW, Pauleit D, Wittsack HJ, et al. Multimodal metabolic imaging of cerebral gliomas: positron emission tomography with [18F]fluoroethyl-L-tyrosine and magnetic resonance spectroscopy. J Neurosurg. 2005;102(2):318–327. |
Supplementary materials
Analysis of variance 1
Groups: three (other, LGG, HGG)
F=36.28
P<0.001
Post hoc comparison
There were significant differences between groups with regard to UR value:
- other versus LGG
- P=0.15
- no significant difference in UR between other and LGG
- other versus HGG
- P=0.0032
- significant difference in UR between other and HGG
- LGG versus HGG
- P<0.01
- significant difference in UR between LGG and HGG
Analysis of variance 2
Groups: five (other, WHO-I, WHO-II, WHO-III, WHO-IV)
F=40.37
P<0.01
Post hoc comparison
There were significant differences between groups with regard to UR value:
- other versus WHO-I
- P<0.01
- significant difference in UR between other and WHO-I
- WHO-I versus WHO-II
- P<0.01
- significant difference in UR between WHO-I and WHO-II
- WHO-II versus WHO-III
- P=0.36
- no significant difference in UR between WHO-II and WHO-III
- WHO-III versus WHO-IV
- P<0.01
- significant difference in UR between WHO-III and WHO-IV
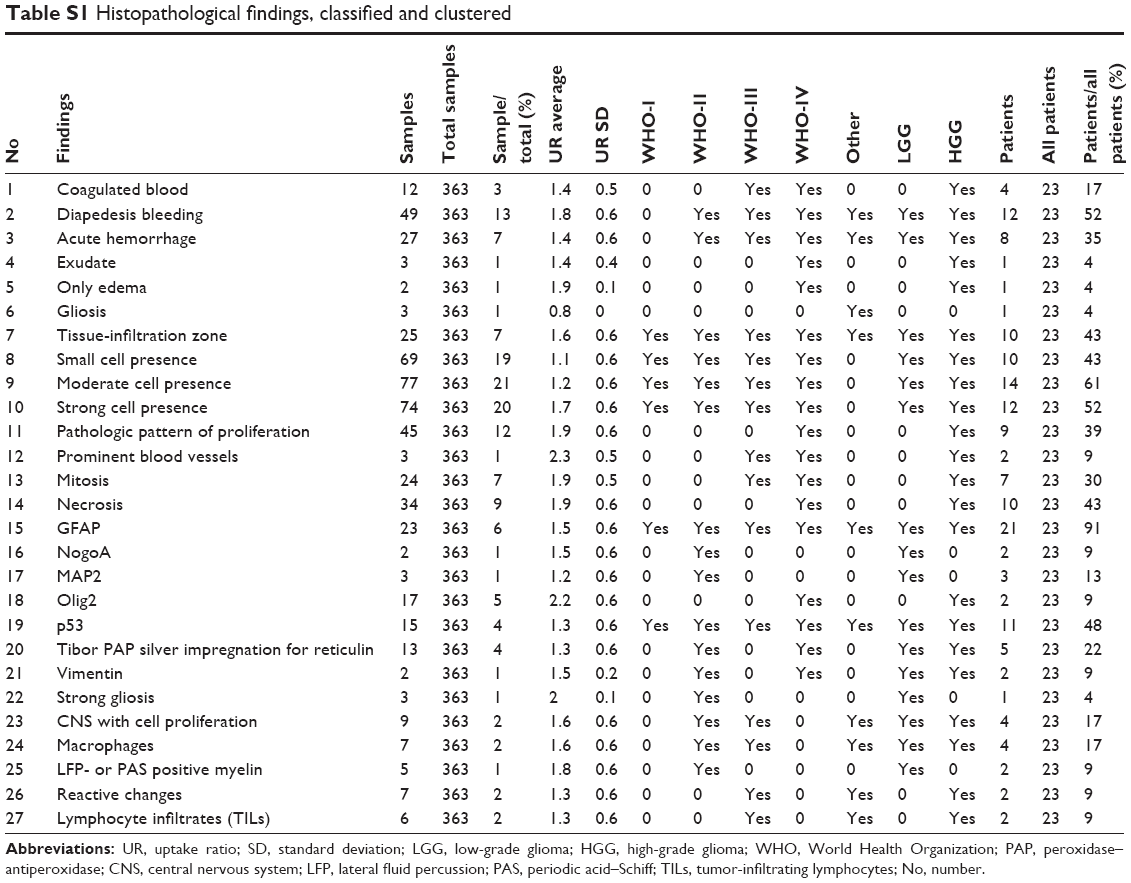 | Table S1 Histopathological findings, classified and clustered |
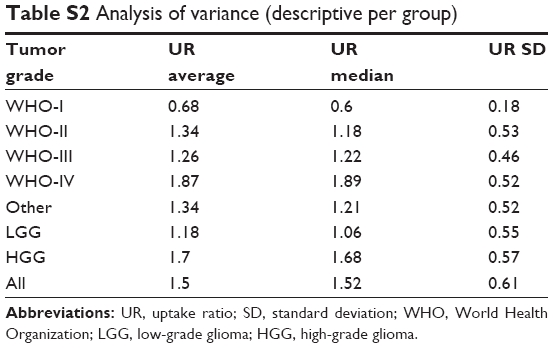 | Table S2 Analysis of variance (descriptive per group) |
 © 2015 The Author(s). This work is published and licensed by Dove Medical Press Limited. The full terms of this license are available at https://www.dovepress.com/terms.php and incorporate the Creative Commons Attribution - Non Commercial (unported, v3.0) License.
By accessing the work you hereby accept the Terms. Non-commercial uses of the work are permitted without any further permission from Dove Medical Press Limited, provided the work is properly attributed. For permission for commercial use of this work, please see paragraphs 4.2 and 5 of our Terms.
© 2015 The Author(s). This work is published and licensed by Dove Medical Press Limited. The full terms of this license are available at https://www.dovepress.com/terms.php and incorporate the Creative Commons Attribution - Non Commercial (unported, v3.0) License.
By accessing the work you hereby accept the Terms. Non-commercial uses of the work are permitted without any further permission from Dove Medical Press Limited, provided the work is properly attributed. For permission for commercial use of this work, please see paragraphs 4.2 and 5 of our Terms.