")
Back to Journals » Veterinary Medicine: Research and Reports » Volume 8
Correlation between thromboelastography and traditional coagulation test parameters in hospitalized dogs
Authors Rubanick JV, Pashmakova MB, Bishop MA, Barr JW
Received 15 September 2016
Accepted for publication 14 December 2016
Published 8 February 2017 Volume 2017:8 Pages 21—26
DOI https://doi.org/10.2147/VMRR.S122437
Checked for plagiarism Yes
Review by Single anonymous peer review
Peer reviewer comments 3
Editor who approved publication: Professor Young Lyoo
Jean V Rubanick, Medora B Pashmakova, Micah A Bishop, James W Barr
Department of Veterinary Small Animal Clinical Sciences, Texas A&M University, College Station, TX, USA
Abstract: A hospital-based, prospective cross-sectional study was used to compare kaolin-activated thromboelastography (TEG) parameters with traditional coagulation tests in 29 hospitalized dogs. Cases were included if the attending clinician requested coagulation testing. Blood was obtained from each dog and coagulation (prothrombin time, partial thromboplastin time, antithrombin activity, d-dimer concentration, and fibrinogen concentration) and TEG analyses were performed. Hematocrit (Hct) was also measured. Traditional coagulation results were evaluated for correlation with those from kaolin-activated TEG. Spearman’s correlation was used to calculate correlation coefficients. Fibrinogen was positively correlated with maximum amplitude (Pearson r=0.72, P<0.001) and global clot strength (Pearson r=0.72, P<0.001). There was no correlation between any of the remaining coagulation variables, TEG parameters, or Hct. Results of kaolin-activated TEG and traditional coagulation tests are not interchangeable means of monitoring coagulation derangements in this intensive care unit patient population. Determination of a true outcome measure is necessary to establish TEG’s clinical relevance to veterinary medicine.
Keywords: TEG, thromboelastography, coagulation, hemostasis
Introduction
Clotting tests are useful in the diagnosis of coagulation disorders and the monitoring of anticoagulant therapy. Prothrombin time (PT), partial thromboplastin time (PTT), and fibrinogen concentration in plasma samples are widely used screening tests in the clinical setting for coagulation profile evaluation. Although modern coagulation diagnostics are becoming increasingly complex, PT, PTT, and fibrinogen concentration are still important and reflect the activity of several coagulation factors of the extrinsic and intrinsic systems.1
Thromboelastography (TEG) is a viscoelastic test used to assess global hemostasis. Unlike traditional plasma-based coagulation tests, TEG incorporates all blood components and evaluates all phases of cell-based coagulation. It provides a graphical representation of the rate of fibrin polymerization, the overall clot strength, and fibrinolysis.2,3
Viscoelastic testing is commonly used in human medicine to guide transfusion therapy and predict hemorrhage in traumatized patients and those undergoing hepatic and cardiac surgery.3–5 It has been shown to be useful in determining hemorrhage etiology, as well as in assessing the effect of thrombocytopenia on coagulation.3–7
The focus of TEG in veterinary medicine has largely been on identifying hypercoagulable states. Hypercoagulability has been demonstrated in parvoviral enteritis, immune-mediated hemolytic anemia (IMHA), protein-losing enteropathies and nephropathies, portosystemic shunts, hyperadrenocorticism, neoplasia, and fungal disease.8–14 It has also been used to provide prognostic information in disease states such as IMHA, sepsis, and disseminated intravascular coagulation in companion animals.2,10,15
Originally designed for fresh whole blood (WB) and without the addition of an activator, TEG has now been modified so that it can be performed with anticoagulated blood and with the addition of calcium and an activator to initiate coagulation.16–18 However, results from each methodology are not interchangeable, and each activator has specific indications.15,17–21 Machine use relies heavily on the operator, and interuser variability may influence the results. Additional factors such as recalcification, time from blood sampling, sampling technique, hematocrit (Hct), altered platelet count, fibrinogen concentration, and concurrent corticosteroid therapy can also alter TEG results.19,20,22 Additionally, the manufacturer recommends calibration two to three times a day and a strict quality assurance program if TEG is to be used as an accurate point-of-care test.23
The absence of true outcome measures limits the most effective use of TEG in veterinary patients. While TEG has been used to identify hypercoagulable states, there is still insufficient evidence to define hypercoagulability in companion animals based on TEG parameters, and only 1 veterinary study has retrospectively compared TEG results with postmortem evidence of thrombosis.24,25 No studies evaluating TEG as a transfusion guide in veterinary patients exist at this time.
TEG’s variable methodology, extensive quality control requirements, effect of preanalytic and hemostatic variables, lack of standardization, and cost limit its global use in veterinary patients.3,13,16,19,20,22,23 Lack of a therapeutic end point has also complicated its use.24 This has led to the formation of the Partnership on Rotational ViscoElastic Test Standardization (PROVETS) collaboration, with the intent of developing universally accepted guidelines on TEG use in veterinary medicine.24
Studies comparing tissue factor-activated TEG to traditional coagulation variables exist in veterinary medicine; however, this has not been evaluated for kaolin-activated TEG.26 Since kaolin-activated TEG has more widespread clinical use and a lower activator cost, the objective of this study was to compare kaolin-activated TEG parameters with traditional coagulation parameters in hospitalized dogs.
Materials and methods
Venipuncture was performed and blood obtained for various laboratory analyses. From each sample, 2.7 mL of blood was placed into a 3.2% sodium citrate tube with a final blood to citrate ratio of 9:1 for coagulation (PT, PTT, antithrombin [AT] activity, d-dimer concentration, and fibrinogen concentration) and TEG analyses. Hct and platelet count were obtained concurrently from the complete blood count (CBC, Cell-Dyn 3500; Abbott, Abbott Park, IL, USA). If a CBC was not performed, an automated or manual platelet count and a packed cell volume (PCV) were obtained. TEG was performed using a single TEG Hemostasis Analyzer 5000 (Haemoscope Corporation, Niles, IL, USA) in citrated WB samples within 2 hours, as per manufacturer’s instructions. The analyzer was calibrated prior to running the first sample of the day.
Briefly, coagulation was initiated for TEG analysis using kaolin. TEG was performed by adding 20 μL of 0.2 M calcium chloride and 340 μL of citrated WB to kaolin. The reaction time (R), clot formation (K), α-angle, maximum amplitude (MA), and global clot strength (G) were recorded. All TEG analyses were performed in duplicate simultaneously in the dual sample wells and left to run at least until the MA was reached.
Plasma was subsequently prepared by centrifugation of citrated WB samples at 2,900 rpm for 10 minutes, divided into aliquots, and, after coagulation panel analysis, stored at -80°C for 3 months, as per standard laboratory protocol. Coagulation analyses were immediately performed on an automated coagulation analyzer (ACL 900; Instrumentation Laboratory, Orangeburg, NY, USA); d-dimer concentration was measured using a chromogenic assay (ACL 900; Instrumentation Laboratory), fibrinogen concentration was measured using the Clauss method, and AT activity was measured using a chromogenic assay (ACL 900; Instrumentation Laboratory). All of the testing other than the TEG was performed in our institution’s clinical pathology laboratory.
The protocol was approved by the Texas A&M University Institutional Animal Care and Use Committee (AUP# 2012-134), and owner informed consent was obtained for each sample taken.
Statistical analysis
Data were checked for normality using Kolmogorov–Smirnov normality and the D’Agostino–Pearson omnibus tests. Spearman’s correlation was used to calculate correlation coefficients. Alpha was set to 0.05. Traditional measures of coagulation were evaluated for correlation with those derived from kaolin-activated TEG.
Results
The study population included dogs that presented to the Texas A&M University Veterinary Teaching Hospital between July 2013 and February 2014, for which the attending clinician requested coagulation testing. Dogs that received blood product transfusions and drugs known to affect coagulation and TEG (anticoagulants, steroids, non-steroidal anti-inflammatory drugs, etc.) were excluded from analysis, as were samples that were hemolyzed.
Twenty-nine dogs were included in the study, including 14 females (13 spayed and 1 intact) and 15 males (8 castrated and 7 intact) with ages ranging from 0.6 to 13 years (mean ± SD, 7.4±3.5). Dogs included 4 mixed breed dogs, 4 Dachshunds, 2 Labradors, 2 Bullmastiffs, 2 Goldendoodles, and 1 each of Australian Shepherd, English Cocker Spaniel, French Bulldog, Cavalier King Charles Spaniel, Walker Hound, Labradoodle, Border Collie, Pit Bull, Brittany Spaniel, Greyhound, Doberman, English Bulldog, West Highland White Terrier, Boxer, and Yorkshire Terrier. Disease conditions of all included dogs are listed in Table 1.
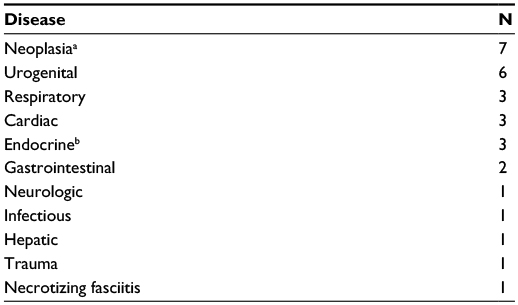 | Table 1 Disease conditions of hospitalized dogs Notes: aNeoplastic conditions included lymphosarcoma, osteosarcoma, and hemangiosarcoma. bEndocrine diseases included diabetes mellitus and hyperadrenocorticism. |
The results of the coagulation and TEG assays, Hct, and platelet count are summarized in Table 2. Due to the integrity of some of the samples, fibrinogen concentration was measured in 28/29 dogs and platelet count in 26/29 dogs. The remaining parameters were measured in all 29 dogs.
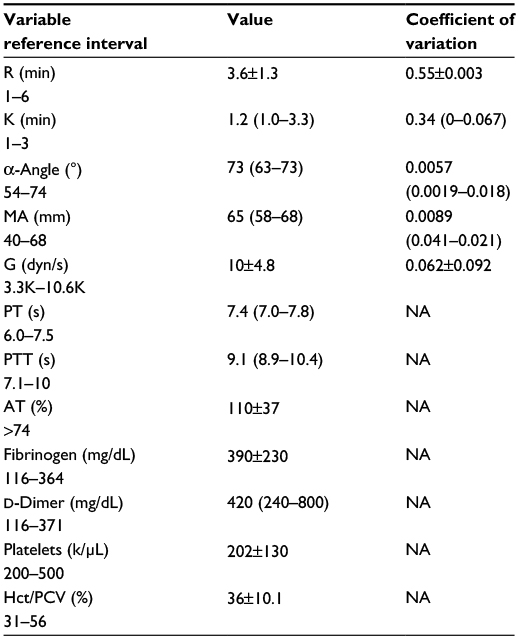 | Table 2 Mean ± SD and median (IQR) of TEG and coagulation parameters Notes: Variables are recorded as mean ± SD if normally distributed, and median (range) if not normally distributed. Coefficient of variation was calculated for each of the duplicate TEG measurements. Abbreviations: TEG, thromboelastography; MA, maximum amplitude; PT, prothrombin time; NA, not applicable; PTT, partial thromboplastin time; AT, antithrombin; Hct, hematocrit; PCV, packed cell volume; SD, standard deviation; R, reaction time; K, clot formation; G, global clot strength. |
Spearman r-values and P-values for all correlations are listed in Table 3. Most notably, fibrinogen was positively correlated with MA (r=0.72, P<0.001) and G (r=0.72, P<0.001). There were no correlations found between any of the other measures.
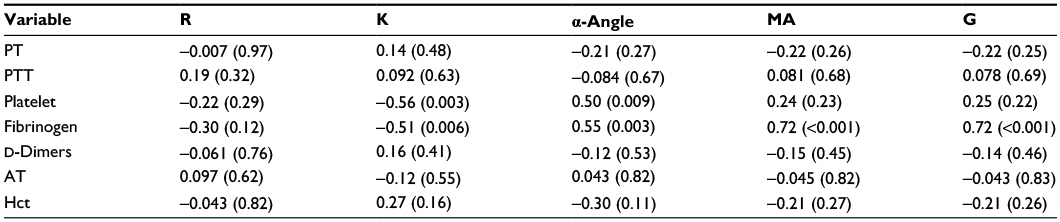 | Table 3 Spearman’s correlation coefficients (P-values) for traditional coagulation tests and TEG variables Abbreviations: TEG, thromboelastography; MA, maximum amplitude; PT, prothrombin time; PTT, partial thromboplastin time; AT, antithrombin; Hct, hematocrit; R, reaction time; K, clot formation; G, global clot strength. |
Discussion
This study demonstrated significant positive correlation between fibrinogen concentration and MA. This relationship has been shown in previous studies in human and animal species.6,21,26 A correlation was also found between fibrinogen and G. This is not surprising as G, which represents the global clot strength, is a derivative of MA [G = (5,000 × MA)/(100 - MA)]. It has been proposed that G is more sensitive to hemostatic changes, particularly as MA increases.27
This study also demonstrated overall lack of correlation between traditional coagulation assays and TEG parameters. While some studies have found this to be true, the presence or absence of correlation between traditional coagulation assays and TEG parameters has been inconsistent.26,28–30 One possible reason for this lack of correlation lies within the methodologies of TEG and traditional coagulation tests. Traditional coagulation tests are plasma-based, representing only small fragments of the coagulation process, whereas TEG is a WB assay that includes blood’s cellular components, more closely representing the in vivo cell-based model of coagulation.
R-time is the time to initiation of clot formation and, in theory, is analogous to PT and PTT, which measure the time to fibrin gel formation. Some studies have found a positive correlation between R and PT or PTT, but this finding has not been reproduced in other studies, including this one.26,28,29
A significant correlation was not found between AT activity and K- and R-times and MA. AT is one of the three main endogenous anticoagulants, and it has been theorized that the hypercoagulable state seen in protein-losing diseases is due to AT loss. However, multiple studies have shown a lack of association between decreased AT and hypercoagulability in those disease processes.11,31
Correlation was checked between platelet count and all TEG parameters. TEG references report that platelet count is the strongest contributor to MA.23 However, it has been observed that fibrinogen seems to have a much greater impact on clot firmness than platelet count.6,32 In a recent study using Rotational Thromboelastometry, another global hemostasis test, with a platelet inhibitor, it was demonstrated that clot strength increases in a fibrinogen concentration-dependent manner.6 Of interest in that same study, the platelet contribution to clot strength also increased with fibrinogen concentration at a constant platelet count, whereas the increase in clot strength tended to reach a plateau at normal platelet counts.
Platelets form the primary hemostatic plug and provide the catalytic surface for thrombin activation.3 The minimum platelet count for “normal” clot formation is unknown, but it has been shown in humans that thrombocytopenia does not usually induce a clinically significant thromboelastographic change until the platelet count is <66,000/μL.7,33 Based on the available literature and this study, MA may be more indicative of platelet and fibrinogen interaction rather than either one individually. Additional studies are necessary to further evaluate this relationship.
No correlation was found between Hct and any of the TEG parameters. This is in contrast to the results of multiple studies.19,21,34 Anemia is associated with an artifactual hypercoagulable TEG tracing. Red blood cell mass is the main determinant of WB viscosity and may act as a diluent for coagulation factors. When red blood cell mass, and thus blood viscosity, is decreased, coagulation factors are in closer contact and may interact more readily.20,34 In this study, the mean Hct measured was 36%, a value within the reference interval for the CBC machine used. Additionally, the mean values for MA and G, the TEG parameters suggested to define a hypercoagulable state, were within reference intervals. The absence of overall anemia may have contributed to the lack of hypercoagulable state and subsequent lack of correlation.
In humans, TEG’s accuracy in predicting thrombotic events varies. A recent systematic review found an association between hypercoagulable TEG traces with postoperative thrombotic events in some but not all studies.35 Although MA (and G) seems to be the best TEG parameter for defining hypercoagulability, no consensus exists for the cutoff value for prediction of thrombotic events.35 Likewise, there are limited diagnostic tests to detect thromboembolic risk in veterinary medicine, and conventional tests determine only the ability to generate thrombin at best.32
It has been shown that TEG has the ability to correctly identify dogs with clinical signs of bleeding more accurately than traditional coagulation tests and may be superior for hemorrhage prediction in dogs.30,36 Perhaps, utilizing TEG to guide interventional therapy such as transfusions and procoagulant and antithrombotic treatments would prove more fruitful than to predict thrombotic events.
This study has several limitations. 1) The sample holding time for TEG analysis was not standardized. Rather, samples were run within 2 hours, as per manufacturer’s instructions.23 The PROVETS guidelines recommend a 30-minute holding time; however, these guidelines were published after the data collection for this study was completed.24 2) The study was not case-controlled. The only inclusion criterion was that the attending clinician requested a coagulation panel. It is possible that a population of dogs with a single disease process may have exhibited more correlation between traditional coagulation tests and TEG. 3) The sample size, particularly the number of cases that fell outside the reference intervals, was small. This limited variability in the sample population may have impacted interpretation of the results.
With the exception of a strong correlation between fibrinogen and MA and G, TEG parameters did not correlate with traditional coagulation parameters. It is likely that TEG provides complementary, but not interchangeable, information to the traditional coagulation tests that are currently available. Determination of a true outcome measure is necessary to establish TEG’s clinical relevance to veterinary medicine.
Acknowledgments
The study was supported by the Ginn Fund, Department of Veterinary Small Animal Clinical Sciences, Texas A&M University. It was presented in poster abstract form at the 20th International Veterinary Emergency and Critical Care Society conference, Indianapolis, IN, USA, September 2014.
Disclosure
The authors report no conflicts of interest in this work.
References
Piccione G, Casella S, Giannetto C, Giudice E. Effect of storage conditions on prothrombin time, activated partial thromboplastin time and fibrinogen concentration on canine plasma samples. J Vet Sci. 2010;11(2):121–124. | ||
Wiinberg B, Jensen AL, Johansson PI, Rozanski E, Tranholm M, Kristensen AT. Thromboelastographic evaluation of hemostatic function in dogs with disseminated intravascular coagulation. J Vet Intern Med. 2008;22(2):357–365. | ||
Bolliger D, Seeberger MD, Tanaka KA. Principles and practice of thromboelastography in clinical coagulation management and transfusion practice. Transfus Med Rev. 2012;26(1):1–13. | ||
da Luz L, Nascimento B, Rizoli S. Thrombelastography (TEGW): practical considerations on its clinical use in trauma resuscitation. Scand J Trauma Resusc Emerg Med. 2013;21(29):1–8. | ||
Essell JH, Martin TJ, Salinas J, Thompson JM, Smith VC. Comparison of thromboelastography to bleeding time and standard coagulation tests in patients after cardiopulmonary bypass. J Cardiothorac Vasc Anesth. 1993;7(4):410–415. | ||
Lang T, Johanning K, Metzler H, et al. The effects of fibrinogen levels on thromboelastometric variables in the presence of thrombocytopenia. Anesth Analg. 2009;108(3):751–758. | ||
Oshita K, Az-ma T, Osawa Y, Yuge O. Quantitative measurement of thromboelastography as a function of platelet count. Anesth Analg. 1999;89(2):296–299. | ||
Saavedra P, Garcia A, Lopez S, Couto G. Hemostatic abnormalities in dogs with carcinoma: a thromboelastographic characterization of hypercoagulability. Vet J. 2011;190(2):e78–e83. | ||
Otto CM, Rieser TM, Brooks MB, Russell MW. Evidence of hypercoagulability in dogs with parvoviral enteritis. J Am Vet Med Assoc. 2000;217(10):1500–1504. | ||
Goggs R, Kjelgaard-Hansen M, Chan D. Serial assessment of the coagulation status of dogs with immune-mediated haemolytic anaemia using thromboelastography. Vet J. 2012;191(3):347–353. | ||
Lennon E, Hanel R, Walker J, Vaden S. Hypercoagulability in dogs with protein-losing nephropathy as assessed by thromboelastography. J Vet Intern Med. 2013;27(3):462–468. | ||
Kelley D, Lester C, DeLaforcade A, Webster CR. Thromboelastographic evaluation of dogs with congenital portosystemic shunts. J Vet Intern Med. 2013;27(5):1262–1267. | ||
Pace SL, Creevy KE, Krimer PM, Brainard BM. Assessment of coagulation and potential biochemical markers for hypercoagulability in canine hyperadrenocorticism. J Vet Intern Med. 2013;27(5):1113–1120. | ||
McMichael M, O’Brien M, Smith S. Hypercoagulability in dogs with blastomycosis. J Vet Intern Med. 2015;29(2):499–504. | ||
Bentley AM, Mayhew PD, Culp WT, Otto CM. Alterations in the hemostatic profiles of dogs with naturally occurring septic peritonitis. J Vet Emerg Crit Care (San Antonio). 2013;23(1):14–22. | ||
Flatland B, Koenigshof AM, Rozanski EA, Goggs R, Wiinberg B. Systematic evaluation of evidence on veterinary viscoelastic testing part 2: sample acquisition and handling. J Vet Emerg Crit Care (San Antonio). 2014;24(1):30–36. | ||
Larsen OH, Fenger-Eriksen C, Christiansen K, Ingerslev J, Sorensen B. Diagnostic performance and therapeutic consequence of thromboelastometry activated by kaolin versus a panel of specific reagents. Anesthesiology. 2011;115(2):294–302. | ||
Flint SK, Wood RD, Abrans-Ogg ACG, Kruth SA, Bersenas A. Comparison of citrated native and kaolin-activated samples for thromboelastographic analysis in healthy dogs. Vet Clin Pathol. 2012;41(2):249–255. | ||
MacDonald SG, Luddington RJ. Critical factors contributing to the thromboelastography trace. Semin Thromb Hemost. 2010;36(7):712–722. | ||
Smith SA, McMichael M, Galligan A, Gilor S, Hoh CM. Clot formation in canine whole blood as measured by rotational thromboelastometry is influenced by sample handling and coagulation activator. Blood Coagul Fibrinolysis. 2010;21(7):692–702. | ||
Smith SA, McMichael M, Gilor S, Galligan AJ, Hoh CM. Correlation of hematocrit, platelet concentration, and plasma coagulation factors with results of thromboelastometry in canine whole blood samples. Am J Vet Res. 2012;73(6):789–798. | ||
Ralph AG, Brainard BM, Pittman JR, Babski DM, Koenig A. Effects of rest temperature, contact activation, and sample technique on canine thrombelastography. J Vet Emerg Crit Care. 2012;22(3):320–326. | ||
Haemoscope Corp. editor. TEG 5000 User Manual. Niles, IL: 2011:160. | ||
Goggs R, Brainard B, de Laforcade AM, et al. Partnership on Rotational ViscoElastic Test Standardization (PROVETS): evidence-based guidelines on rotational viscoelastic assays in veterinary medicine. J Vet Emerg Crit Care (San Antonio). 2014;24(1):1–22. | ||
Thawley VJSM, Drobatz KJ, King LG. Retrospective comparison of thromboelastography results to postmortem evidence of thrombosis in critically ill dogs: 39 cases (2005–2010). J Vet Emerg Crit Care. 2016;26(3):428–436. | ||
Wagg CR, Boysen SR, Bedard C. Thrombelastography in dogs admitted to an intensive care unit. Vet Clin Pathol. 2009;38(4):453–461. | ||
Hanel RM, Chan DL, Conner B, et al. Systematic evaluation of evidence on veterinary viscoelastic testing part 4: definitions and data reporting. J Vet Emerg Crit Care (San Antonio). 2014;24(1):47–56. | ||
Alexander DC, Butt WW, Best JD, Donath SM, Monagle PT, Shekerdemian LS. Correlation of thromboelastography with standard tests of anticoagulation in paediatric patients receiving extracorporeal life support. Thromb Res. 2010;125(5):387–392. | ||
Park M, Martini W, Dubick M, et al. Thromboelastography as a better indicator of hypercoagulable state after injury than prothrombin time or activated partial thromboplastin time. J Trauma. 2009;67(2):266–275. | ||
Wiinberg B, Jensen A, Rozanski E, et al. Tissue factor activated thromboelastography correlates to clinical signs of bleeding in dogs. Vet J. 2009;179(1):121–129. | ||
Goodwin LV, Goggs R, Chan DL, Allenspach K. Hypercoagulability in dogs with protein-losing enteropathy. J Vet Intern Med. 2011;25(2):273–277. | ||
Lang T, von Depka M. Possibilities and limitations of thromboelastometry/thromboelastography. Hämostas. 2007;26(suppl 1):S21–S29. | ||
Roeloffzen WW, Kluin-Nelemans HC, Mulder AB, de Wolf JT. Thrombocytopenia affects plasmatic coagulation as measured by thromboelastography. Blood Coagul Fibrinolysis. 2010;21(5):389–397. | ||
Brooks AC, Guillaumin J, Cooper ES, Couto CG. Effects of hematocrit and red blood cell-independent viscosity on canine thromboelastographic tracings. Transfusion. 2014;54(3):727–734. | ||
Dai Y, Lee A, Critchley L, White P. Does thromboelastography predict postoperative thromboembolic events? A systematic review of the literature. Anesth Analg. 2009;108(3):734–742. | ||
Bucknoff MC, Hanel RM, Marks SL, Motsinger-Reif AA, Suter SE. Evaluation of thromboelastography for prediction of clinical bleeding in thrombocytopenic dogs after total body irradiation and hematopoietic cell transplantation. Am J Vet Res. 2014;75(5):425–432. |
 © 2017 The Author(s). This work is published and licensed by Dove Medical Press Limited. The full terms of this license are available at https://www.dovepress.com/terms.php and incorporate the Creative Commons Attribution - Non Commercial (unported, v3.0) License.
By accessing the work you hereby accept the Terms. Non-commercial uses of the work are permitted without any further permission from Dove Medical Press Limited, provided the work is properly attributed. For permission for commercial use of this work, please see paragraphs 4.2 and 5 of our Terms.
© 2017 The Author(s). This work is published and licensed by Dove Medical Press Limited. The full terms of this license are available at https://www.dovepress.com/terms.php and incorporate the Creative Commons Attribution - Non Commercial (unported, v3.0) License.
By accessing the work you hereby accept the Terms. Non-commercial uses of the work are permitted without any further permission from Dove Medical Press Limited, provided the work is properly attributed. For permission for commercial use of this work, please see paragraphs 4.2 and 5 of our Terms.