")
Back to Journals » Clinical Ophthalmology » Volume 12
Correlation between glycemic control and peripapillary retinal nerve fiber layer thickness in Saudi type II diabetics
Authors Fahmy RM , Bhat RS, Al-Mutairi M, Aljaser FS, El-Ansary A
Received 13 September 2017
Accepted for publication 17 November 2017
Published 1 March 2018 Volume 2018:12 Pages 419—425
DOI https://doi.org/10.2147/OPTH.S151564
Checked for plagiarism Yes
Review by Single anonymous peer review
Peer reviewer comments 2
Editor who approved publication: Dr Scott Fraser
Rania M Fahmy,1,2 Ramesa S Bhat,3 Manar Al-Mutairi,4 Feda S Aljaser,5 Afaf El-Ansary4
1Department of Optometry, College of Applied Medical Sciences, King Saud University, Riyadh, Saudi Arabia; 2Department of Ophthalmology, Faculty of Medicine, Cairo University, Giza, Egypt; 3Biochemistry Department, College of Science, King Saud University, Riyadh, Saudi Arabia; 4Central Laboratory, Female Center for Medical Studies and Scientific Section, King Saud University, Riyadh, Saudi Arabia; 5Department of Clinical Laboratory Sciences, College of Applied Medical Sciences, King Saud University, Riyadh, Saudi Arabia
Objective: To evaluate the effect of diabetes mellitus (DM), diabetic retinopathy, and degree of glycemic control (glycosylated hemoglobin [HbA1c]) on peripapillary retinal nerve fiber layer thickness (RNFLT) using optical coherence tomography.
Methods: The study included 126 eyes of healthy controls (n=32) and diabetics patients (n=31), whose ages ranged from 40 to 70 years. The diabetic group was divided into: Subgroup 1: with HbA1c <7% and Subgroup 2: with HbA1c ≥7%. All patients underwent full ophthalmic examination. HbA1c level was obtained with the A1cNow+ system and the peripapillary RNFLT was measured using 3D-OCT 2000 Topcon (360-degree circular scan with 3.4 mm diameter centered on optic disc).
Results: The obtained data demonstrates significant decrease in peripapillary RNFLT in superior and inferior quadrants of the right eye (p=0.000 and p=0.039, respectively), and in superior quadrant of the left eye (p=0.002) with impairment of glycemic control. Pearson’s correlation test showed significant negative correlation of RNFLT with HbA1c in the superior quadrant in both eyes.
Conclusion: Impairment of glycemic control affects the peripapillary RNFLT mainly in the superior quadrant. This thickness also tends to decrease with long-standing DM, use of DM medications, and development of diabetic retinopathy. The measurement of peripapillary RNFLT may become a useful method to monitor early retinal changes in diabetic patients.
Keywords: retina, RNFL, optical coherence tomography, diabetic retinopathy, glycosylated hemoglobin
Introduction
Diabetes mellitus (DM) is considered one of the most epidemic diseases of the 21st century, showing a high prevalence of 2%–6% worldwide.1 It is a multifactorial metabolic disease clinically presenting as sustained hyperglycemia together with disturbances of carbohydrate, fat, and protein metabolism resulting from defects in insulin secretion, insulin action, or both.2 Insufficient insulin action arises either due to the damage of β pancreatic cells (type 1) or because the produced insulin does not function sufficiently, which is known as insulin resistance (type 2) DM. The World Health Organization3 defined DM as a fasting venous plasma glucose level that is equal to or higher than 7.0 mmol/L or venous plasma level is equal to or greater than 11.1 mmol/L, measured 2 hours after oral intake of 75 g glucose.4
Diabetic patients are at high risk of developing nephropathy, neuropathy, retinopathy, and cardiac diseases as the four major complications. Diabetic retinopathy (DR) is the most common complication of this chronic disease (approximately 90%).5 In most of the developing countries, DR is one of the most common contributing factors of blindness.6 DR clinically presents as retinal ischemia, intraretinal microvascular abnormalities, hemorrhages, neovascularization, and increased vascular permeability.7 It can progress from mild, nonproliferative to moderate or severe nonproliferative disease, which may consequently result in proliferative disease.8 This progression of retinopathy might be affected by environmental risk factors such as age, stress, diet, genetic susceptibility, lifestyle, and gut microbiota; the latter is an emerging risk factor that has been recently related to type 2 DM and its complications.
In 2015, the American Diabetes Association reported that according to the Clinical Practice, glycosylated hemoglobin (HbA1c) was recommended as an excellent predictive marker for the diagnosis of diabetes.9 Each 1% reduction in HbA1c minimizes the risk of developing systemic and ocular complications by 40%.3 The measurement of HbA1c is considered as important as blood glucose measurement, and it can facilitate the accomplishment of improved glycemic control. HbA1c is a reflection of average plasma glucose over the past 2–3 months and does not require patients to fast and can be measured at any time. Recently, there has been an increased interest to use HbA1c as a marker for screening of those at high risk of developing diabetes as it shows high sensitivity and specificity.10
The use of HbA1c is considered as one of the most discriminative and effective tools for the diagnosis of diabetic patients who are vulnerable to develop complications including retinopathy.11 An association between HbA1c and mortality risk factors among men and women with type 2 diabetes was recently reported.12 Higher frequency of Gram-positive bacteria such as Staphylococci was detected in diabetic patients, especially those with retinopathy.13
Current research demonstrated that beneficial bacteria, known as probiotic, can provide a positive impact on HbA1c as a marker of diabetic severity. However, further investigations are recommended for future therapeutic trials of T2DM. This information motivates the interest to test the effectiveness of HbA1c as a predictive biomarker for early development of retinopathy. This will be through an attempt to find correlation between controlled HbA1c (<7%) and uncontrolled HbA1c (≥7%) on peripapillary retinal nerve fiber layer thickness (RNFLT) in diabetic patients as marker of severity of retinopathy. The obtained data might support the suggestion of the use of the noninvasive probiotic as a protective strategy against retinopathy, a complication of DM that may consequently lead to blindness.14
Participants and methods
The study involved 126 eyes of healthy subjects (n=32) and type II diabetic patients (n=31; Table 1; Figure 1). The study was conducted over the period from the first of January 2016 until the end of April 2016 at the Department of Ophthalmology at the Specialized Medical Center Hospital in Riyadh. Patients with cataract, glaucoma, optic disc anomalies, or any systemic diseases with ocular complications were excluded. Patients were divided into a control group with healthy subjects and two study groups, one (subgroup 1) with HbA1c that is less than 7% and the other (subgroup 2) with HbA1c that is equal or more than 7%. All participants underwent full ophthalmic examination including measurement of refractive error using Auto Refractometer, visual acuity assessment by Snellen chart, slit-lamp anterior segment examination, intraocular pressure measurement using applanation tonometer, fundus examination using +90 dioptre lens, and peripapillary RNFLT measurement using 3D-OCT 2000 (360-degree circular scan with 3.4 mm diameter centered on optic disc).15 In addition, an assessment of glycemic control was performed using A1cNow+ system, which provides quantitative measurement of HbA1c level in a capillary or venous blood sample.16
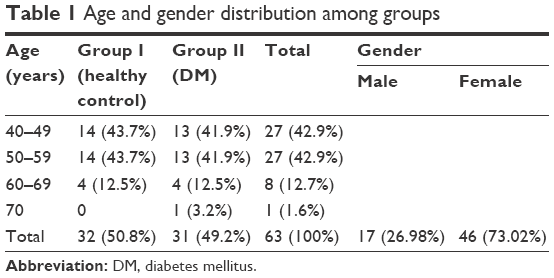 | Table 1 Age and gender distribution among groups |
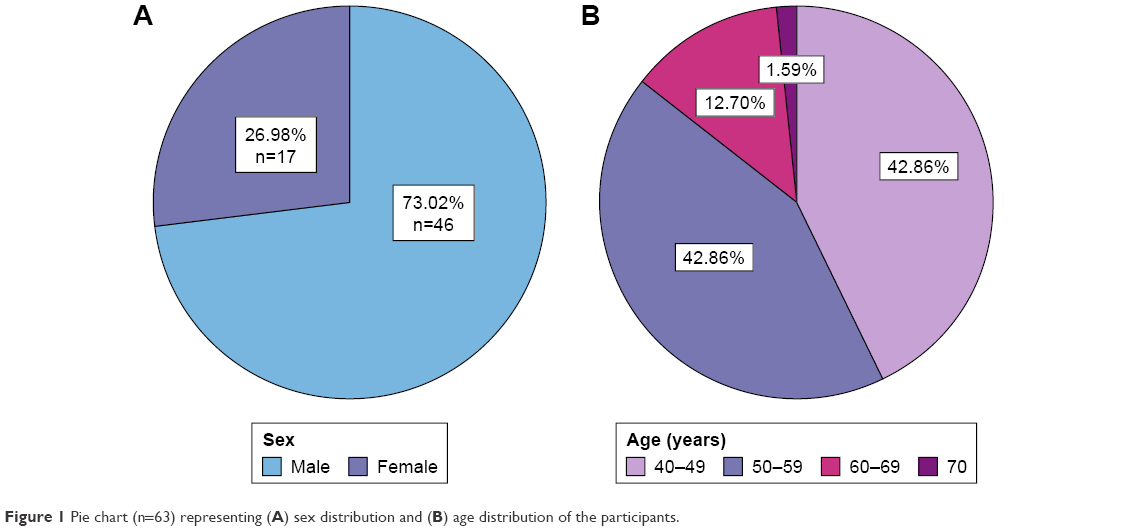 | Figure 1 Pie chart (n=63) representing (A) sex distribution and (B) age distribution of the participants. |
Statistical analysis
Statistical analysis was performed using the commercially available statistical software package (SPSS for windows, version 21.0, IBM Corp., Armonk, NY, USA). Both eyes were taken for analysis. Student’s t-test was used for normally distributed variables. Pearson’s correlation analysis was applied according to the distribution type of the variables to analyze the relationship between variables. Analysis of variance has been used to find the significance of the study parameters between three or more groups of data. p-value of <0.05 was considered as statistically significant.
Ethical consideration
The protocol of the study was explained to each participant at the time of recruitment and informed written consent was obtained according to the Declaration of Helsinki. The research was approved by the research ethical committee at The College of Applied Medical Sciences, King Saud University.
Results and discussion
DM as a chronic disease can result in multiple complications, one among which is retinopathy. Controlling such a disease is of critical importance in order to avoid the development of different complications. The present study revealed the correlation between the level of HbA1c and RNFLT. Current results showed that the peripapillary RNFLT was affected in the superior quadrant of diabetic patients in relation to glycemic control as compared to healthy subjects (Table 2, Figures 2 and 3). This is consistent with the outcome of previous studies, which demonstrated that RNFLT was decreased in patients with preclinical DR in all 4 quadrants, but the difference was significant only at the superior quadrant.17,18 However, the current results are contradictory to those of Chen et al,19 who reported significant changes in other quadrants as well. This can be attributed to the use of different optical coherence tomography instruments. In addition, this study was conducted for less than 2 months, which might have a negative impact on the sample size, and thus the outcome. The observed variation in the current study may be due to dense arrangement of peripapillary retinal nerve fibers.20 Also, the present data demonstrate significant thinning in retinal nerve fiber layer in patients with HbA1c <7% (controlled DM). This reduction was increased in patients with HbA1c ≥7% (uncontrolled DM), in accordance with previous studies (Table 3).18,21
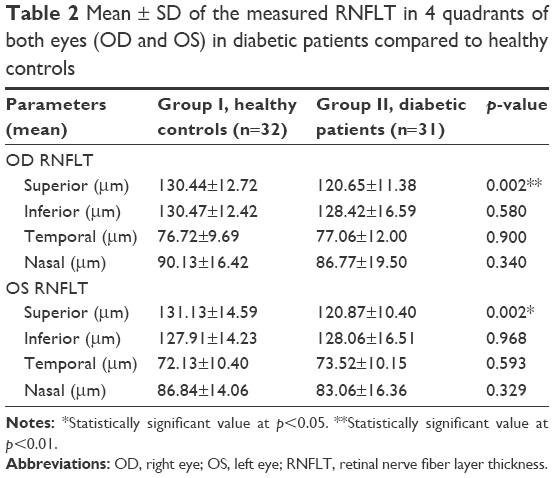 | Table 2 Mean ± SD of the measured RNFLT in 4 quadrants of both eyes (OD and OS) in diabetic patients compared to healthy controls |
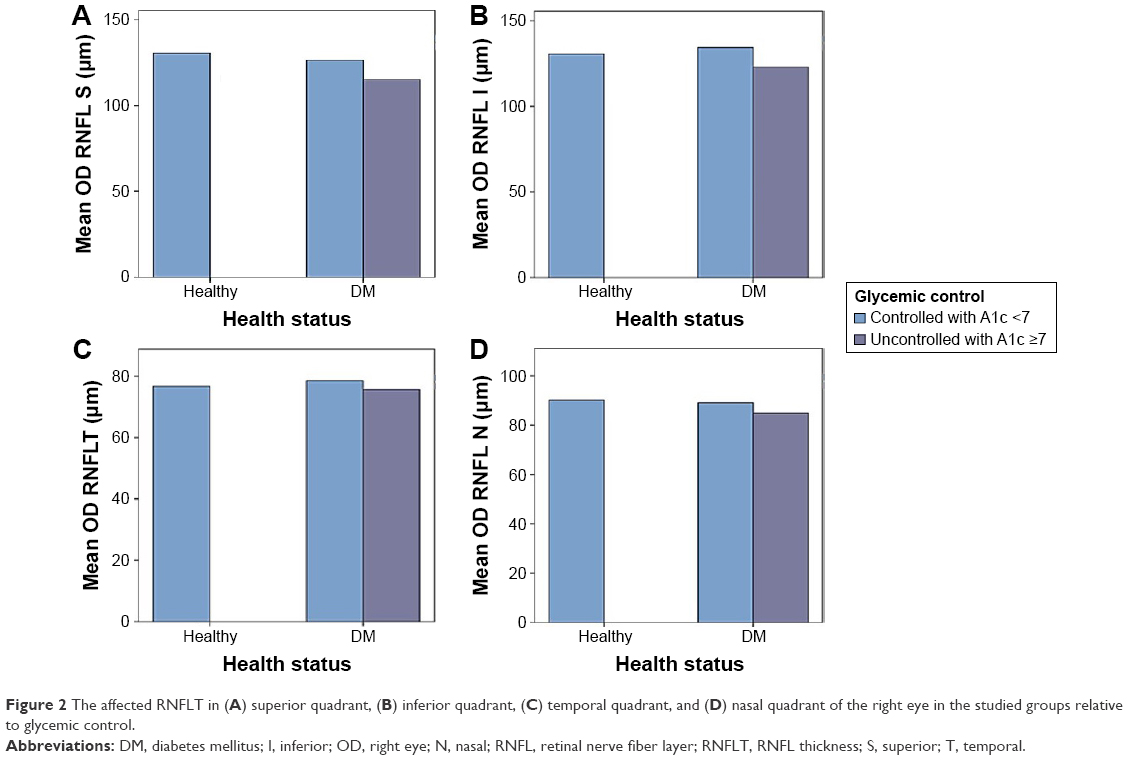 | Figure 2 The affected RNFLT in (A) superior quadrant, (B) inferior quadrant, (C) temporal quadrant, and (D) nasal quadrant of the right eye in the studied groups relative to glycemic control. |
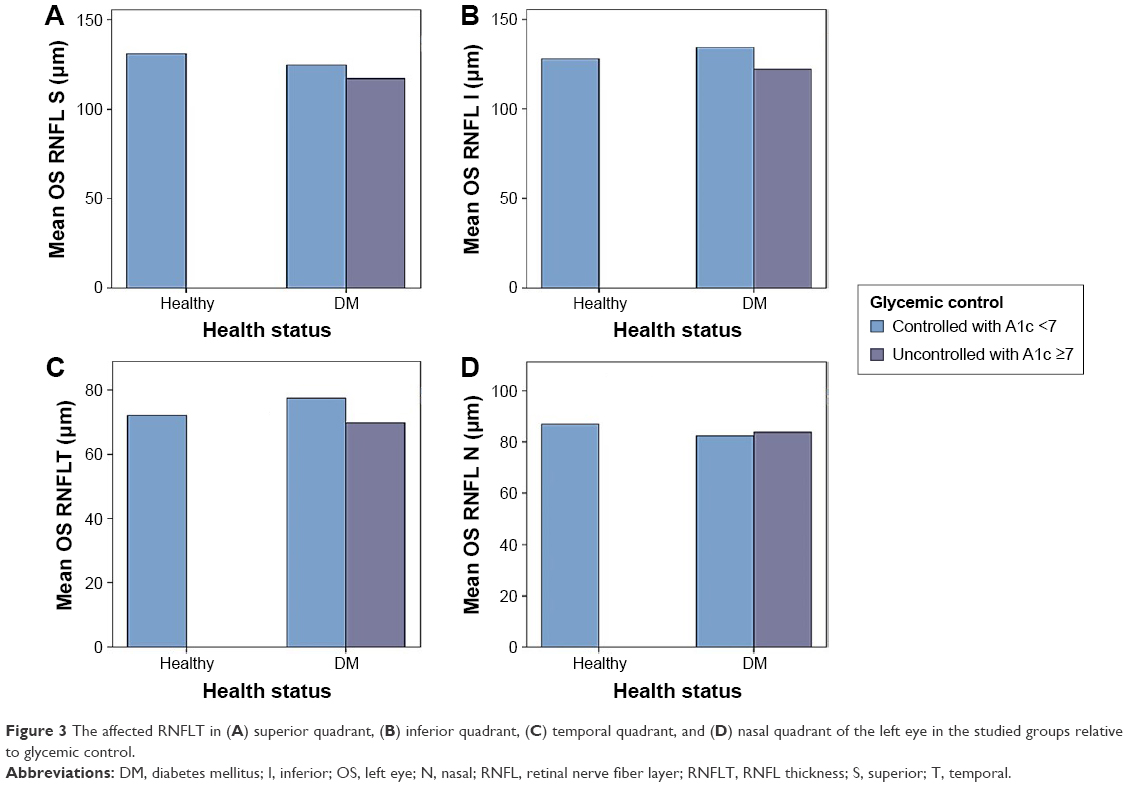 | Figure 3 The affected RNFLT in (A) superior quadrant, (B) inferior quadrant, (C) temporal quadrant, and (D) nasal quadrant of the left eye in the studied groups relative to glycemic control. |
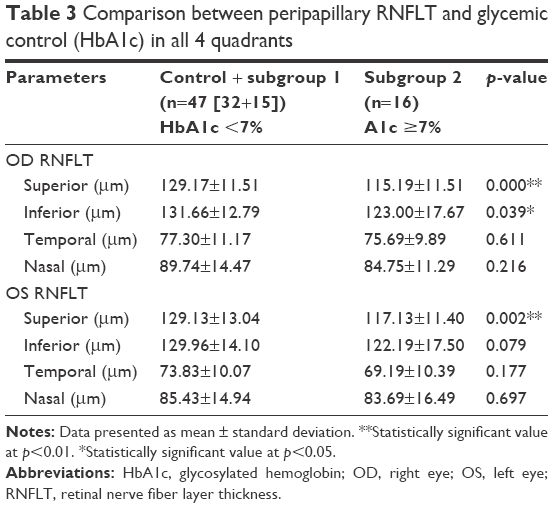 | Table 3 Comparison between peripapillary RNFLT and glycemic control (HbA1c) in all 4 quadrants |
The results of the present study revealed that the reduction in RNFLT was affected in the superior quadrant by the duration of diabetes, presence of DR, and the treatment regimen in insulin users. RNFLT reduced more in oral hypoglycemic users (Tables 4–6), which is consistent with previous studies.18,22 Hammes et al18 described that diabetes can induce apoptosis in retinal ganglion cells and Müller cells in an experimental diabetes model, and this supports the present findings of that RNFLT was decreased prior to the development of DR.
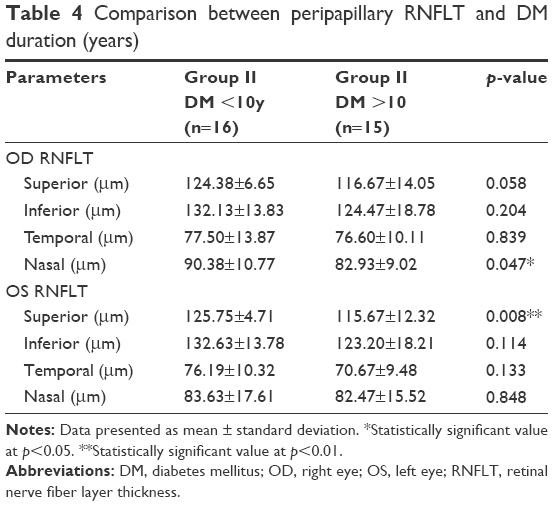 | Table 4 Comparison between peripapillary RNFLT and DM duration (years) |
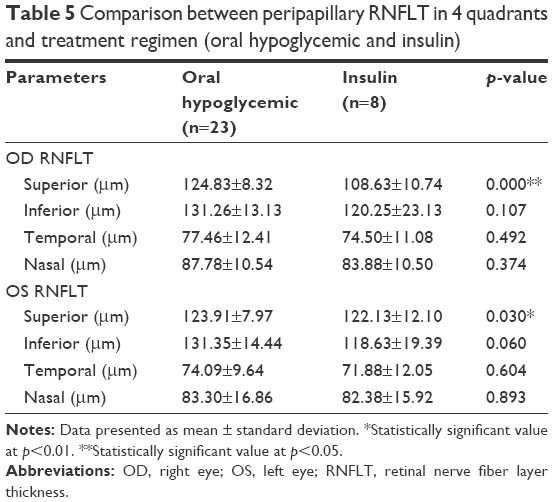 | Table 5 Comparison between peripapillary RNFLT in 4 quadrants and treatment regimen (oral hypoglycemic and insulin) |
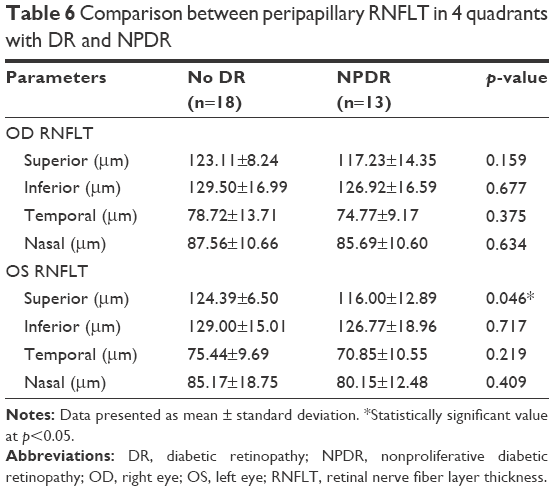 | Table 6 Comparison between peripapillary RNFLT in 4 quadrants with DR and NPDR |
Table 7 and Figure 4 demonstrate that the peripapillary RNFLT was negatively correlated with HbA1c in the superior, inferior, and nasal quadrants, while it was positively correlated in the temporal quadrant. This correlation was significant in the superior quadrant only, which is consistent with the findings by Srivastav et al.22
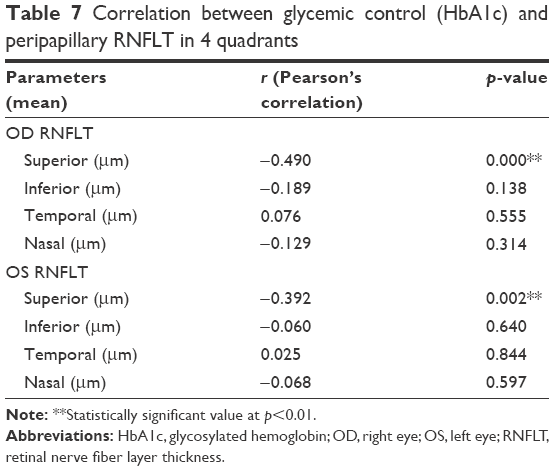 | Table 7 Correlation between glycemic control (HbA1c) and peripapillary RNFLT in 4 quadrants |
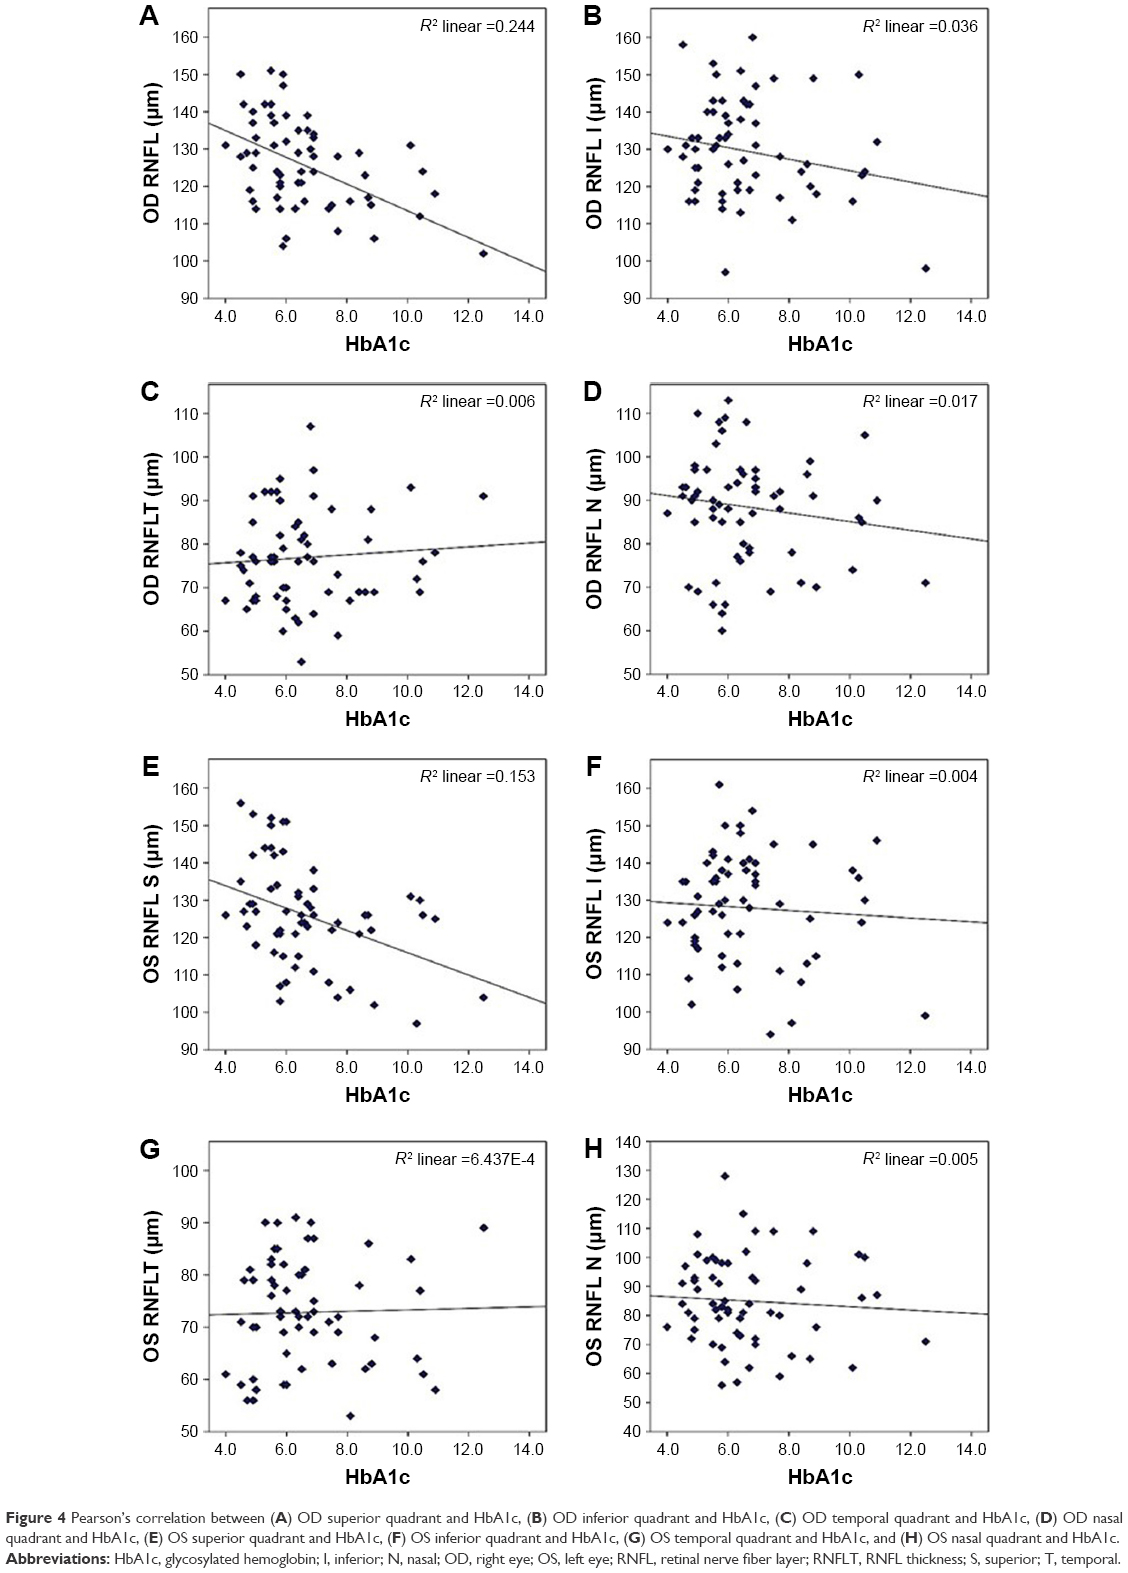 | Figure 4 Pearson’s correlation between (A) OD superior quadrant and HbA1c, (B) OD inferior quadrant and HbA1c, (C) OD temporal quadrant and HbA1c, (D) OD nasal quadrant and HbA1c, (E) OS superior quadrant and HbA1c, (F) OS inferior quadrant and HbA1c, (G) OS temporal quadrant and HbA1c, and (H) OS nasal quadrant and HbA1c. |
Conclusion
Impairment of glycemic control affects the peripapillary RNFLT mainly in the superior quadrant. This thickness also tends to be decrease with long-standing DM, use of DM medications, and development of DR. According to the results of the present study, peripapillary RNFLT may be used as a predictive marker of retinopathy development, which might help to avoid future devastating complications.
Acknowledgment
The authors extend their appreciation to the Deanship of Scientific Research at King Saud University for funding this work through research group number RG-1438-004.
Disclosure
The authors report no conflicts of interest in this work.
References
Samah S, Ramasamy K, Lim SM, Neoh CF. Probiotics for the management of type 2 diabetes mellitus: a systematic review and meta-analysis. Diabetes Res Clin Pract. 2016;118:172–182. | ||
Peng PH, Lin HS, Lin S. Nerve fibre layer thinning in patients with preclinical retinopathy. Can J Ophthalmol. 2009;44(4):417–422. | ||
WHO. WHO | about diabetes. Previously available from: http://www.who.int/diabetes/action_online/basics/2015. Accessed September 1, 2017. | ||
Zhang Y, Zhang H. Microbiota associated with type 2 diabetes and its related complications. Food Sci Human Wellness. 2013;2(3):167–172. | ||
American Diabetes Association. (13) Diabetes care in the hospital, nursing home, and skilled nursing facility. Diabetes Care. 2015;38(Suppl):S80–S85. | ||
Widger J, Hameed S, Ooi CY, Verge C. Using HbA1c as a screening tool for cystic fibrosis related diabetes. J Cyst Fibros. 2016;15(2):263–264. | ||
Li W, Katzmarzyk PT, Horswell R, Wang Y, Johnson J, Hu G. HbA 1c and all-cause mortality risk among patients with type 2 diabetes. Int J Cardiol. 2016;202:490–496. | ||
Pettitt DJ, Talton J, Dabelea D, et al. Prevalence of diabetes in US youth in 2009: the SEARCH for diabetes in youth study. Diabetes Care. 2014;37(2):402–408. | ||
Aring AM, Jones DE, Falko JM. Evaluation and prevention of diabetic neuropathy. Am Fam Physician. 2005;71(11):2123–2128. | ||
Kowluru RA, Mishra M. Contribution of epigenetics in diabetic retinopathy. Sci China Life Sci. 2015;58(6):556–563. | ||
Klonoff DC, Schwartz DM. An economic analysis of interventions for diabetes. Diabetes Care. 2000;23(3):390–404. | ||
Lutty GA. Effects of diabetes on the eye. Invest Ophthalmol Vis Sci. 2013;54(14):ORSF81–ORSF87. | ||
Keenan T, Johnston R, Donachie P, Sparrow J, Stratton I, Scanlon P. United Kingdom National Ophthalmology Database Study: Diabetic Retinopathy; Report 1: prevalence of centre-involving diabetic macular oedema and other grades of maculopathy and retinopathy in hospital eye services. Eye (Lond). 2013;27(12):1397–1404. | ||
Committee IE. International Expert Committee report on the role of the A1C assay in the diagnosis of diabetes. Diabetes Care. 2009;32(7):1327–1334. | ||
Virgili G, Menchini F, Casazza G, et al. Optical coherence tomography (OCT) for detection of macular oedema in patients with diabetic retinopathy. Cochrane Database Syst Rev. 2015;1:CD008081. | ||
Now+ AC. Multi-Test A1C System, Professional Procedure Guide. 2015. | ||
Zhang X, Saaddine JB, Chou CF, et al. Prevalence of diabetic retinopathy in the United States, 2005–2008. JAMA. 2010;304(6):649–656. | ||
Hammes HP, Federoff HJ, Brownlee M. Nerve growth factor prevents both neuroretinal programmed cell death and capillary pathology in experimental diabetes. Mol Med. 1995;1(5):527–534. | ||
Chen X, Nie C, Gong Y, et al. Peripapillary retinal nerve fiber layer changes in preclinical diabetic retinopathy: a meta-analysis. PLoS One. 2015;10(5):e0125919. | ||
Oñzdek S, Lonneville YH, Oñnol M, Yetkin I, Hasanreisoğlu BB. Assessment of nerve fiber layer in diabetic patients with scanning laser polarimetry. Eye. 2002;16(6):761–765. | ||
Sugimoto M, Sasoh M, Ido M, Narushima C, Uji Y. Retinal nerve fiber layer decrease during glycemic control in type 2 diabetes. J Ophthalmol. 2010;2010:pii:569215. | ||
Srivastav K, Saxena S, Ruia S, Mahdi AA, Khanna VK. Correlation of retinal nerve fibre layer thinning and central subfield thickness with type 2 diabetic retinopathy on spectral domain optical coherence tomography. Open Sci J Clin Med. 2015;3(6):194–198. |
 © 2018 The Author(s). This work is published and licensed by Dove Medical Press Limited. The full terms of this license are available at https://www.dovepress.com/terms.php and incorporate the Creative Commons Attribution - Non Commercial (unported, v3.0) License.
By accessing the work you hereby accept the Terms. Non-commercial uses of the work are permitted without any further permission from Dove Medical Press Limited, provided the work is properly attributed. For permission for commercial use of this work, please see paragraphs 4.2 and 5 of our Terms.
© 2018 The Author(s). This work is published and licensed by Dove Medical Press Limited. The full terms of this license are available at https://www.dovepress.com/terms.php and incorporate the Creative Commons Attribution - Non Commercial (unported, v3.0) License.
By accessing the work you hereby accept the Terms. Non-commercial uses of the work are permitted without any further permission from Dove Medical Press Limited, provided the work is properly attributed. For permission for commercial use of this work, please see paragraphs 4.2 and 5 of our Terms.