")
Back to Journals » Clinical Interventions in Aging » Volume 14
Correlation Between Depressive Symptoms And Quality Of Life, And Associated Factors For Depressive Symptoms Among Rural Elderly In Anhui, China
Authors Rong J, Chen G , Wang X, Ge Y, Meng N, Xie T, Ding H
Received 29 July 2019
Accepted for publication 18 October 2019
Published 4 November 2019 Volume 2019:14 Pages 1901—1910
DOI https://doi.org/10.2147/CIA.S225141
Checked for plagiarism Yes
Review by Single anonymous peer review
Peer reviewer comments 2
Editor who approved publication: Dr Zhi-Ying Wu
Jian Rong,1,* Guimei Chen,1,* Xueqin Wang,2 Yanhong Ge,1 Nana Meng,1 Tingting Xie,1 Hong Ding1
1Department of Health Services Management, School of Health Management, Anhui Medical University, Hefei 230032, People’s Republic of China; 2Department of Medical Engineering, The Second Hospital of Anhui Medical University, Hefei 230601, People’s Republic of China
*These authors contributed equally to this work
Correspondence: Hong Ding
School of Health Management, Anhui Medical University, No. 81 Meishan Road, Hefei 230032, People’s Republic of China
Tel +86 551 516 1220
Fax +86 551 512 8754
Email [email protected]
Purpose: We aimed to assess the current status of depressive symptoms and quality of life (QoL) among rural elderly in central China (Anhui Province) and explore their correlation and associated factors for depressive symptoms.
Methods: A multi-stage random sampling method was used to obtain 3349 participants (aged ≥60): 1206 poor and 2143 non-poor. The 30-item Geriatric Depression Scale (GDS-30) and five-dimensional European quality of health scale (EQ-5D) were employed to evaluate depressive symptoms and QoL, respectively.
Results: The prevalence of depressive symptoms was 52.9%, and that in the poor group (62.3%) was significantly higher than the non-poor group (47.6%). The GDS-30 score was 12.40 ± 7.089, and the poor group scored significantly higher (14.045 ± 6.929) than the non-poor group (11.472 ± 7.011). The EQ-5D score was 0.713 ± 0.186, and the poor group (0.668 ± 0.192) scored significantly lower than the non-poor group (0.738 ± 0.178). There was a significant negative correlation between depressive symptoms and QoL (r = −0.400, P-value <0.05). The following factors were associated with depressive symptoms: poverty, low EQ-5D score, female gender, older age, illiteracy, unemployed, chronic diseases, and hospitalization in previous year.
Conclusion: Rural elderly in central China have a high prevalence of depressive symptoms and low QoL. Poverty was associated with a higher prevalence of depressive symptoms and lower QoL.
Keywords: depressive symptoms, quality of life, rural elderly, central China
Introduction
Aging is an inevitable social problem around the globe, and China has the world’s largest elderly population. According to the National Bureau of Statistics, in 2018, the population aged 60 years and over in China was 249.49 million (17.9% of the total population), with more than two-thirds living in rural areas.1 It was predicted that the proportion of elderly persons aged 60 and over in China will exceed 30% of the total population by 2050.2 With this rapid growth, increasingly more elderly persons are suffering from age-related mental diseases. Depression is the most common mental disorder found in the elderly population around the world, putting tremendous pressure on the social health service system.3 In addition, with the medical and social developments for the aging population, elderly persons seek to have not only a long life but also high quality of life (QoL). Thus, researchers are increasingly interested in assessing depressive symptoms and QoL in older adults.
Depression is an important public health problem in the elderly population, as late-life depression might have serious consequences, such as an increased risk of suicide.4 In addition, it is anticipated that depression will become the second most common cause of disability in the world by 2020.5 The worldwide prevalence of depressive disorders varies between 4.5% and 37.4%.6 However, in recent years, especially in rural China, the prevalence of geriatric depression far exceeds this rate. A study on geriatric depression in rural China showed a prevalence rate of 30.8%.7 Previous research found that being female, older, illiterate, solitary, and cognitively impaired were risk factors for geriatric depression.8–11
The QoL of elderly persons has become another important public health problem because of demographic changes as a result of aging. Studies found that the QoL scores of elderly persons were lower than those of non-elderly individuals.12 Although QoL has been widely investigated for many years, there are scarce relevant research data on the QoL of the rural elderly population in central China. Most previous studies were mainly based on Chinese urban residents or special disease groups. Assessment scales mainly included the 12-Item Short-Form Health Survey (SF-12), the 36-Item Short-Form Health Survey (SF-36), and the World Health Organization Quality of Life (WHOQOL)-BREF and mainly aimed to identify factors influencing QoL.13–15
Previous studies revealed that QoL is an important factor affecting depression in the elderly.16 However, the impact of QoL on the psychology of the elderly is difficult to assess. There is currently a feasible method to assess the correlation between depression and QoL.17 However, there is limited research on this correlation among the rural elderly population of central China.
Anhui Province is located in the central part of China. The terrain consists of plains, hills, and mountains, with a geographical area of 140,100 km2. The per capita gross domestic product was 47,712 CNY (about 7210 dollars) in 2018,18 and the level of economic development was at a medium level in China. At the end of 2018, the resident population of the province was 63.236 million, of which the proportion aged 60 and over was 18.34%, and the proportion aged 65 and over was 12.97%.19 As in other provinces in China, aging has become a serious social problem. Anhui Province is the first province in China to implement a comprehensive reform of the primary health care system. Compared with western China, the health service level in Anhui Province is good, but it is lower relative to eastern China.20
We conducted this study to assess the current status of depressive symptoms and QoL among rural elderly (aged ≥60) in central China (Anhui Province) and explore their correlation and associated factors for depressive symptoms. We believe our findings will provide a scientific theoretical reference for further improving the physical and mental health of rural elderly, and promoting grassroots public health services in central China.
Methods
Study Design And Sample
A multi-stage sampling survey method was used to randomly select one county in the northern, central, and southern regions of Anhui Province in central China, respectively, from January to July 2018 for the current study. In each county, two towns were randomly selected, in each of which three villages were randomly chosen. This made a total of 18 villages as survey sites. In each of the selected villages, 50 households were randomly selected according to the list of poor households (the per capita net income of rural households in China was less than 2736 CNY in 2013). Simultaneously, non-poor survey households were selected among the neighbors of poor households in a ratio of 1:1.5. Participants were elderly persons (aged ≥60) from the poor and non-poor households. Among the households surveyed, all of the elderly aged 60 years and over were the participants. The investigation was conducted with the assistance of local health care committees, village committees, and village doctors. Questionnaires were completed through a face to face interview conducted by specially trained investigators visiting the participants’ homes.
We surveyed 3491 elderly persons (900 poor households and 1350 non-poor households) and obtained 3349 valid questionnaires (1206 poor and 2143 non-poor elderly respondents). The effective response rate was thus 95.93% (3349/3491).
Persons aged 60 years and over and living at their residence for at least 1 year participated in the survey. Exclusion criteria included having cognitive impairments and language communication barriers as well as being unavailable for the investigation.
The study was conducted in accordance with the Declaration of Helsinki and was approved by the Ethics Committee of Anhui Medical University. All respondents provided written informed consent and volunteered to participate in the survey.
Assessment Instruments
30-Item Geriatric Depression Scale (GDS-30)
The GDS-30 is a tool for measuring depressive symptoms in elderly adults and has been widely used in different countries around the world.21,22 Each item in the scale is a question that respondents need to answer using “Yes” or “No”. Scale items 1, 5, 7, 9, 15, 19, 21, 27, 29, and 30 are scored with 1 point for “No” and 0 points for “Yes”; the remaining 20 items are scored with 1 point for “Yes” and 0 points for “No”; thus, the total score ranges from 0 to 30 points. Previous research confirmed that the GDS-30 scale has high sensitivity (70.6%) and specificity (70.1%) in a Chinese sample aged 60 years and over, and internal consistency was confirmed by a Cronbach’s α value of 0.890.23 Elderly individuals with a GDS-30 score higher than or equal to 11 are considered to have depressive symptoms.24
Five-Dimensional European Quality Of Health Scale (EQ-5D)
The Chinese version of the EQ-5D scale was employed to assess the QoL of respondents. Previous research confirmed that the scale had good reliability and validity in a Chinese elderly sample.25 Internal consistency was confirmed by a Cronbach’s α value of 0.7026.26 The scale consists of the EQ-5D health state description system and the EQ-visual analogue scale (EQ-VAS) scores. The EQ-5D health state description system consists of five dimensions: mobility (M), self-care ability (SC), usual activities (UA), pain/discomfort (PD), and anxiety/depression (AD). The respondents self-rate the level of problem severity in each dimension using three levels: no problems, moderate problems, and extreme problems, coded as 1, 2, and 3, respectively. The EQ-VAS is a 20-cm visual scale, from 0 (representing the worst health condition in mind) to 100 (representing the best health condition in mind); respondents rate their health status on that day using the most appropriate point on the visual scale.
Considering geographic and ethnic factors, we used the Japanese scale utility scoring system, by which the utility score was calculated according to the following formulation: U(utility scoring) = 1-(0.152 + 0.075 * M2 + 0.418 * M3 + 0.054 * SC2 + 0.102 * SC3 + 0.044 * UA2 + 0.133 * UA3 + 0.080 * PD2 + 0.194 * PD3 + 0.063 * AD2 + 0.112 * AD3), where 0.152 is a constant term; M2, SC2, UA2, PD2, and AD2 represent the M, SC, UA, PD, and AD, respectively, in the second level (code 1); otherwise the code is 0. M3, SC3, UA3, PD3, and AD3 represent the M, SC, UA, PD, and AD in the third level (code 1); otherwise the code is 0.27 For example, “21223” stands for a state of having moderate problems in M, UA, and PD, and extreme AD; U = 1-(0.152+0.075+0+0.044+0.080+0.112) = 0.537. The higher the EQ-5D utility score, the better the QoL; while the higher the dimension score, the worse the dimension. The total utility score U ranges from −0.111 to 1.
Demographic Characteristics
The survey collected key demographic information of participants, including poverty, age, gender, education level, profession status, number of chronic diseases, living arrangement (others refer to living with a spouse and unmarried children, living with a spouse and married children, single elderly living with children, and living with their relatives), and hospitalization within previous year.
Statistical Analysis
A double data entry procedure was followed by two trained data-entry workers using EpiData 3.1 software (EpiData Association, Odense, Denmark). Data were analyzed using SPSS 16.0 (SPSS, Inc., Chicago, IL, USA). A descriptive analysis was used to describe the demographic characteristics of the sample. The chi-square test was used to compare the demographic characteristics of the two groups (i.e., poor and non-poor). Multiple linear regression was used to adjust for demographic characteristics. Partial correlation analysis was used to analyze the correlation between depressive symptoms and QoL. Binary logistic regression analysis was used to assess the associated factors for depressive symptoms, and the forced introduction method was used to include the independent variables. Covariates with a P-value < 0.2 on univariate analysis were included in multivariable model. A two-tailed P-value < 0.05 was considered to be statistically significant.
Results
Sample Characteristics
In total, 3349 respondents comprised the effective sample, including 1206 poor and 2143 non-poor elderly persons. Table 1 shows the demographic characteristics of the two groups. Age ranged from 60 to 97 years (mean age 71.17 ± 7.087 years), with the average age of the poor group (71.74 ± 7.121 years) being significantly higher than that of the non-poor group (70.84 ± 7.04 years). The proportion of males in the poor group (53.5%) was significantly higher than that in the non-poor group (46.8%). A total of 66.1% of the participants were illiterate, 64.1% were unemployed, and the proportion of illiterate (69.0%) and unemployed participants (71.0%) in the poor group was significantly higher than that in the non-poor group (64.5% and 60.2%, respectively).
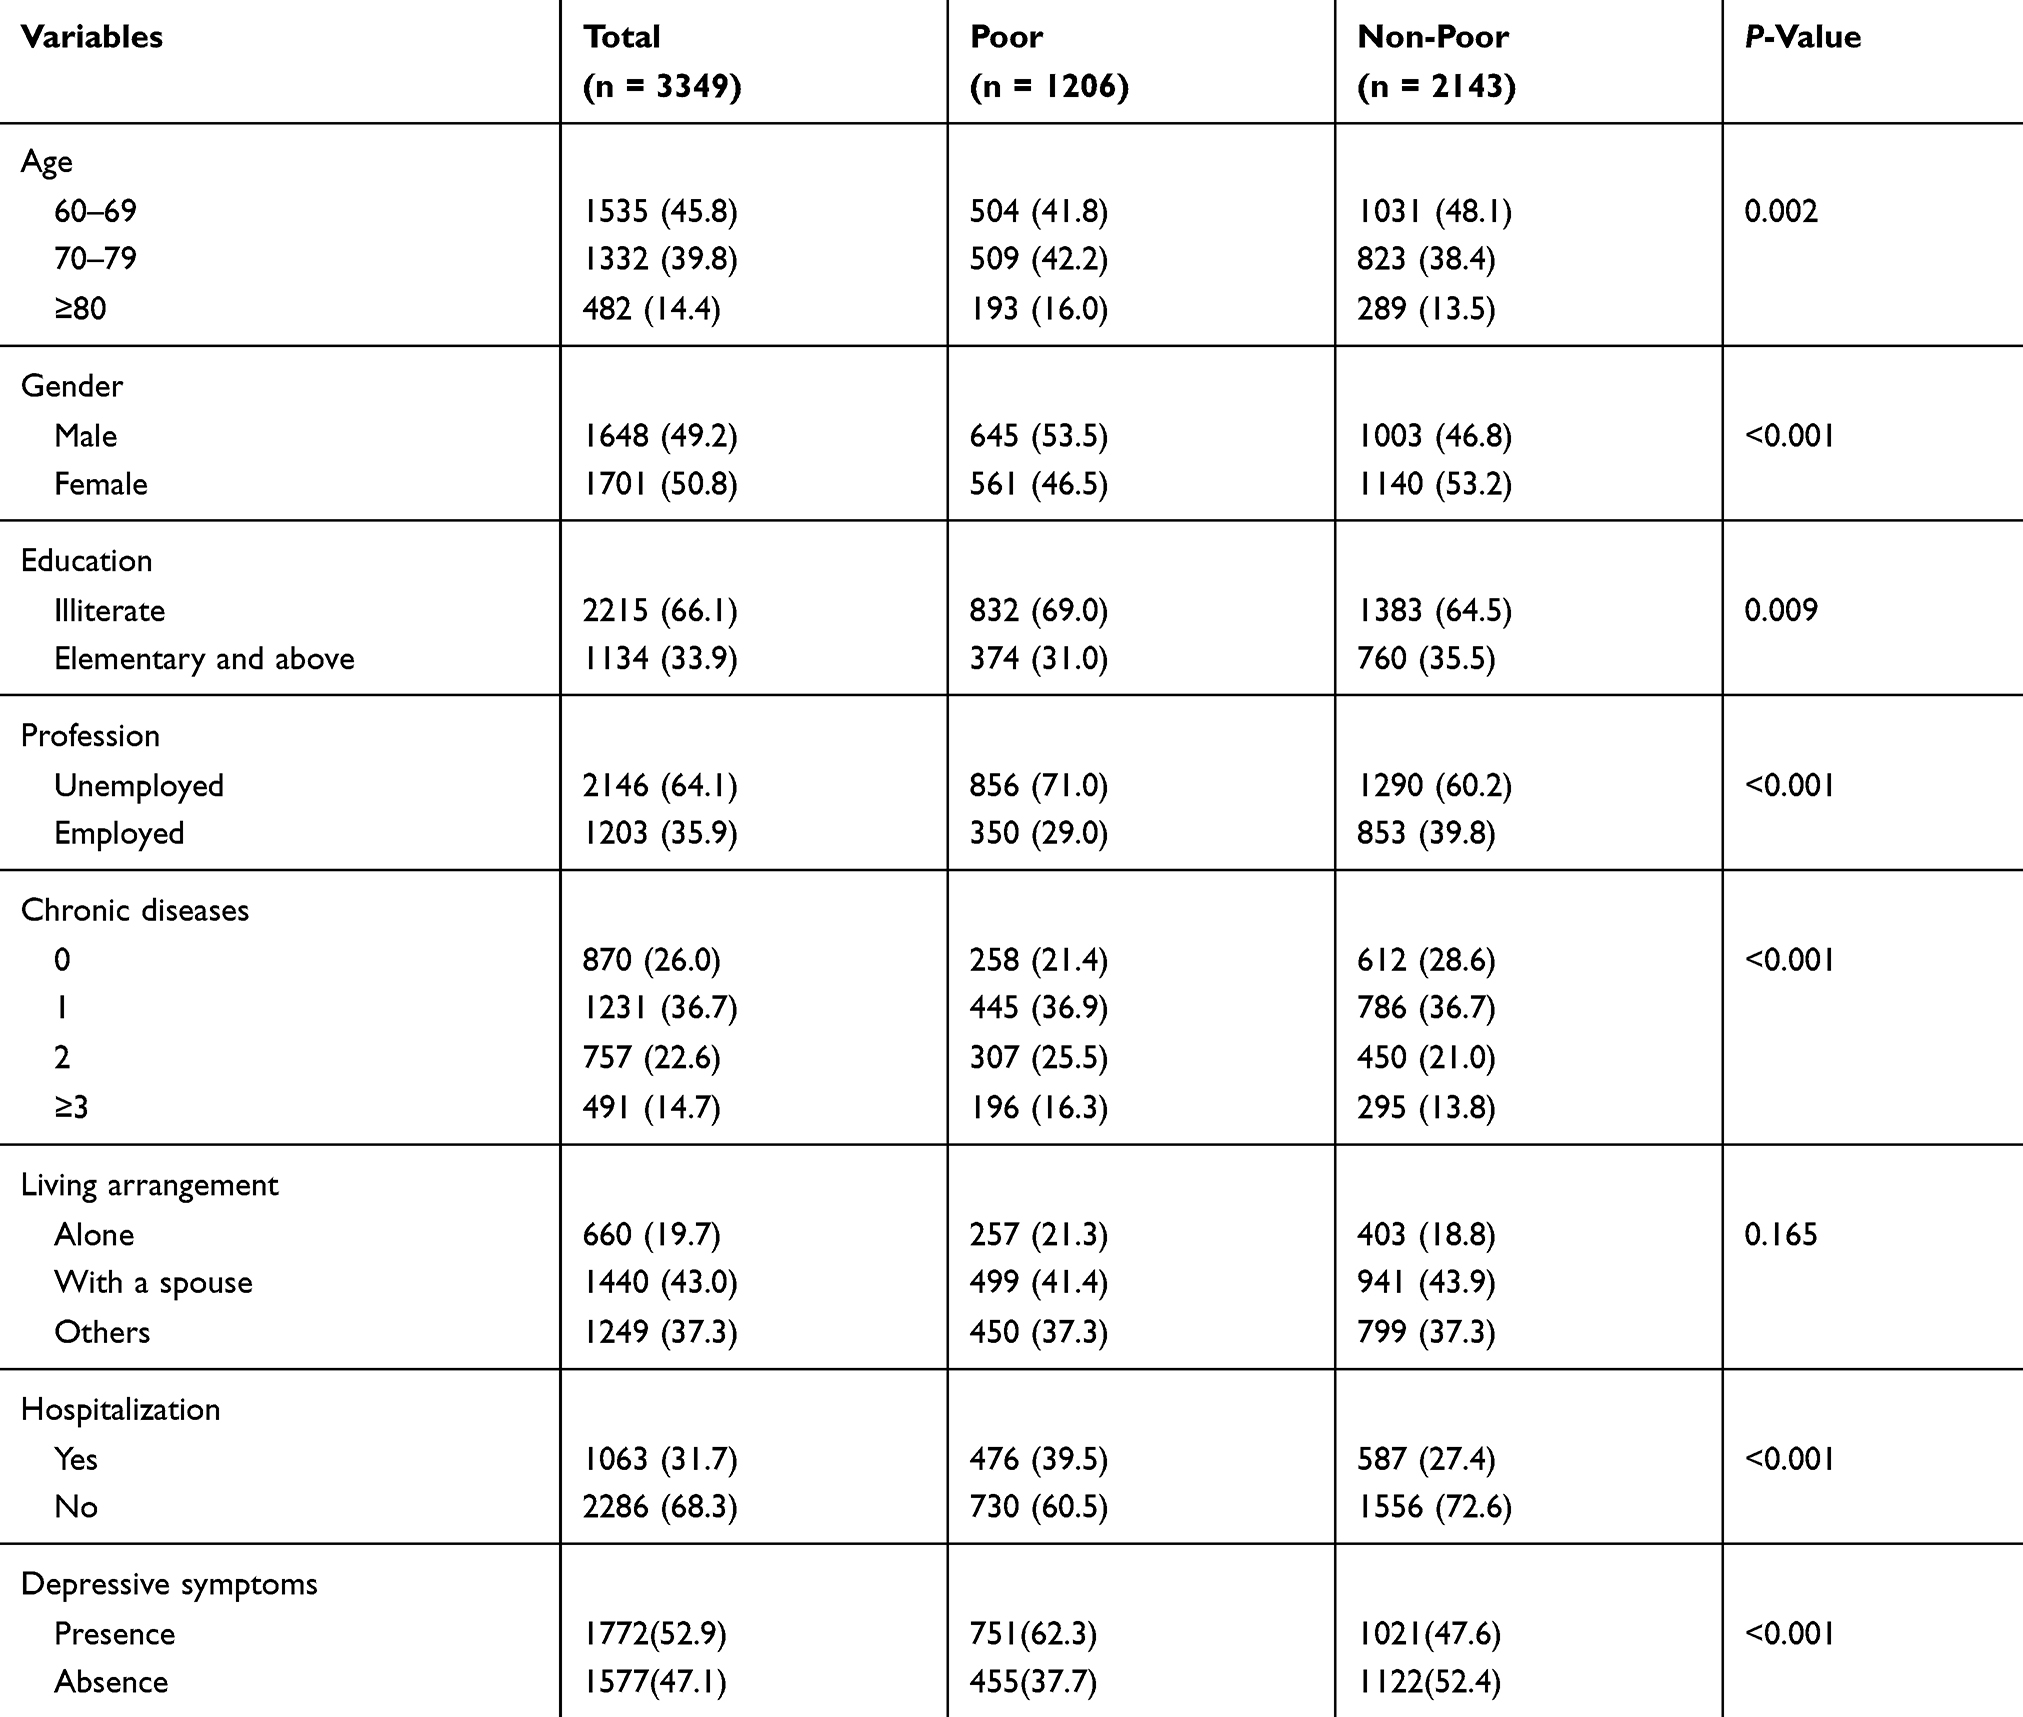 |
Table 1 Demographic Characteristics And Depressive Symptoms Of Respondents, N (%) |
A total of 74.0% of the participants had chronic diseases, and the proportion of individuals with two chronic diseases and three or more chronic diseases in the poor group was significantly higher than in the non-poor group. Moreover, 19.7% of the participants lived alone and 43.0% lived with a spouse, and there were no significant differences in living arrangements between the poor and non-poor groups. Finally, 31.7% of the participants had been hospitalized the year before the survey, and the percentage in the poor group (39.5%) was significantly higher than in the non-poor group (27.4%) (Table 1).
Depressive Symptoms And QoL
Table 1 also shows the evaluation of the prevalence of depressive symptoms in the survey sample, which was 52.9%. The prevalence of depressive symptoms in the poor group (62.3%) was higher than in the non-poor group (47.6%), and the difference between the two groups was statistically significant (P-value <0.001).
Table 2 shows the evaluation of depressive symptoms and QoL in the sample. The average GDS-30 score of the survey sample was 12.40 ± 7.089, and the poor group’s score (14.045 ± 6.929) was higher than that of the non-poor group (11.472 ± 7.011). After adjusting for demographic characteristics, the difference between the two groups was statistically significant (P-value <0.001).
 |
Table 2 Depressive Symptoms And QoL Scores (Mean ± SD) And Differences Between Poor And Non-Poor Groups By Multivariate Linear Regression |
The EQ-5D utility score for the whole sample was 0.713 ± 0.186, and the EQ-5D VAS score was 69.30 ± 16.820; the poor group’s EQ-5D utility score (0.668 ± 0.192) and EQ-5D VAS score (65.80 ± 13.159) were lower than those of the non-poor group (0.738 ± 0.178 and 71.27 ± 18.277, respectively). For each QoL dimension, the scores of the poor group were higher than those of the non-poor group, and the difference between the two groups was statistically significant after adjusting for demographic characteristics (P-value <0.001).
Correlation Of Depressive Symptoms And QoL
Table 3 shows the partial correlation analysis between depressive symptoms and QoL. After controlling for demographic characteristics, the partial correlation analysis showed a significant negative correlation between depressive symptoms and QoL (r = −0.400, P-value <0.001), and there was also a significant negative correlation between depressive symptoms and QoL in the poor and non-poor groups (P-value < 0.001).
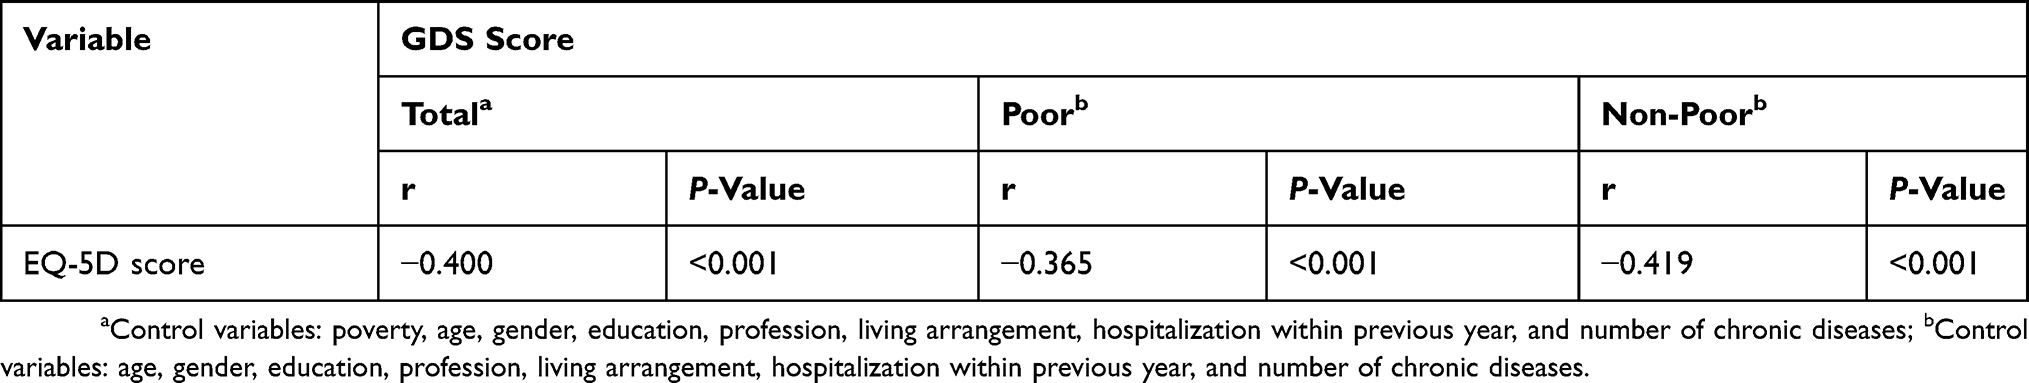 |
Table 3 Partial Correlation Between Depressive Symptoms And QoL |
Associated Factors For Depressive Symptoms
Binary logistic regression analysis was conducted with the presence of depressive symptoms as the dependent variable, and poverty, EQ-5D score, gender, age, education, profession, living arrangement, hospitalization in previous year, and number of chronic diseases as independent variables. The results showed that poverty (OR =1.402), low EQ-5D score (OR =0.010), female gender (OR =0.605), older age (OR =1.017), illiteracy (OR =1.340), unemployed (OR =1.234), suffering from chronic diseases (OR =1.101), and hospitalization in previous year (OR =1.445) were associated factors for depressive symptoms among rural elderly persons. Living arrangement had no effect on depressive symptoms (Table 4).
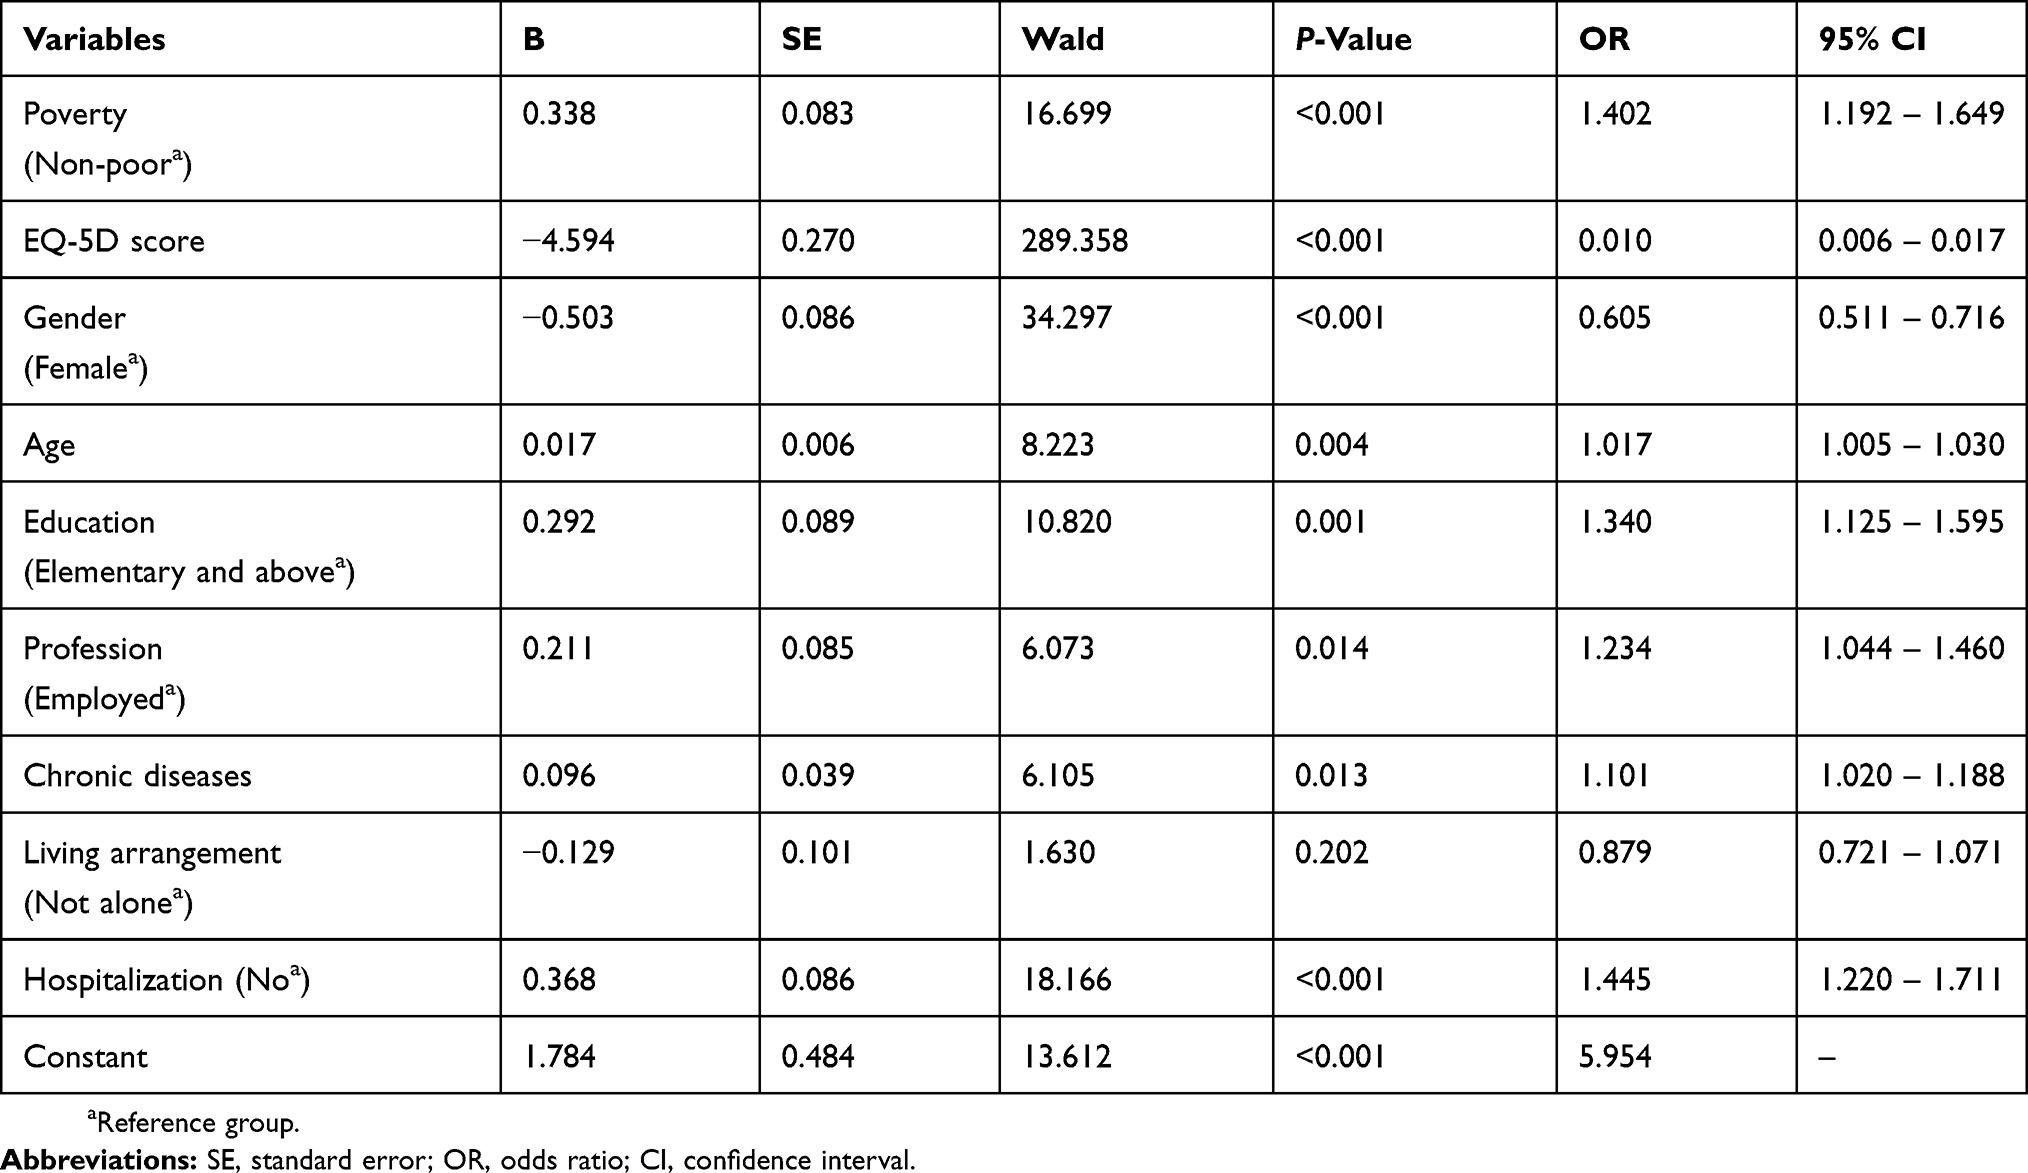 |
Table 4 Binary Logistic Regression Analysis Of Associated Factors For Depressive Symptoms |
Discussion
Depression and QoL in rural elderly persons are important public health issues that may have a major impact on primary health care systems. However, there are few studies examining depression and QoL among rural elderly individuals in central China, and the correlation between depressive symptoms and QoL in this population has not been previously reported. The results of this study provide a scientific theoretical basis and reference values for the prevention and control of depressive symptoms in rural elderly persons in central China.
Prevalence Of Depressive Symptoms
The results of the current study showed that the prevalence of depressive symptoms among rural elderly persons in central China was 52.9%, which is higher than previously reported rates of depression in rural Chinese elderly also using the GDS-30. For example, He G et al28 reported a prevalence of depression of 36.94% among elderly persons in rural China, and another survey in rural China reported 18.1%.29 The high prevalence of elderly depressive symptoms may be due to the rapid development of urbanization in China in recent years. The rural youth labor force has flocked to urban areas, resulting in a rapid increase in the proportion of rural elderly persons and weakening the family’s economic and spiritual support for elderly persons.
Using the same measurement tool, Park J et al30 reported a prevalence of depression in the elderly population in Korea was 30.3%; Arslantas D et al31 found that the prevalence of depression among elderly persons in Turkey was 45.8%; moreover, the prevalence of depression in Mexico elderly adults reported by Ortiz GG et al32 was 29.1%. The prevalence of depressive symptoms in rural elderly individuals in central China was higher than the above findings. The reasons may be as follows: First, the social security system for the elderly in rural areas in China is imperfect. Financial support from their children is the main form of support available to the elderly in rural areas, which is often unstable and unreliable. To a certain extent, this support system has increased the psychological burden on the elderly. Second, the concept of filial piety in Chinese traditional culture is crucial to the social support of rural elderly: children are the main source of social support for parents and families. However, with the rapid development of urbanization in China, rural young and middle-aged laborers have been flocking to cities, and the lack of family members to care for the rural elderly in daily life may be another reason for the high prevalence of depressive symptoms.
This study also found that the prevalence of depressive symptoms in poor elderly persons was higher than that in non-poor elderly persons, which is similar to the findings of Fang M et al.33 The poor economic situation of poor elderly persons may lead to negative attitude towards life, affect mental health, and generate a vicious circle, which may lead to depressive symptoms.
QoL
The utility score of EQ-5D in our study was 0.713 ± 0.186, which is lower than that reported by Zhou Z et al17 using the same scale with rural Chinese elderly in different living arrangements (living with a spouse: 0.8652, living alone: 0.8427, living with a spouse and adult children: 0.8652, single elderly living with adult children: 0.7720). Parker L et al34 used the EQ-5D with community elderly persons in the UK and reported a value of 0.78 ± 0.2. Moreover, Chen Y et al35 found that the education level was related to the QoL of elderly persons. The low QoL score in this study may result from the lower education level of rural elderly persons in this study. In addition, a low education level may indirectly affect individuals’ employment opportunities and even income.36 Our analysis also found that the QoL of the elderly with low economic level was also low. It may be that a low-income level cannot provide an adequate material life basis or medical services for the elderly, which affects their QoL.
Correlation Of Depressive Symptoms And QoL
A significant negative correlation between depression and QoL has been demonstrated in previous cross-sectional studies.37–39 Sivertsen H et al5 and González-Celis AL et al40 found a negative correlation between depression and QoL, consistent with the results of this study. As age increases, to some extent, elderly persons experience a decline in the function of the body organs due to biological and psychological changes, which leads to a gradual decrease in QoL.5 The psychological burden of elderly persons may be worsened by the long-term low QoL, leading to the occurrence or aggravation of depressive symptoms.
Associated Factors For Depressive Symptoms
This study found that poverty, low QoL, older age, female gender, illiteracy, unemployed, suffering from chronic diseases, and hospitalization in the previous year were associated factors for depressive symptoms among rural elderly, and studies have reported similar results.41,42
Consistent with the findings of Grant BF et al,43 this study found that older persons have a higher prevalence of depressive symptoms. With increased age, elderly persons’ physical function declines, and vulnerability to chronic diseases and negative emotions increase, leading to depressive symptoms.44
The prevalence of depressive symptoms among rural elderly women was higher than among men, which is consistent with the findings of Bossola M et al.45 In rural China, elderly women lose the role of traditional housewives when they age, especially after their husbands die, and they are often alone with reduced family support, which increases the possibility of depressive symptoms.41
The higher prevalence of depressive symptoms in elderly persons with lower education level and those unemployed is consistent with studies by Grant BF et al43 and Kong XY et al.46 Elderly persons with lower education level, who have fewer social resources than those with higher education, have lower self-care awareness and less able to adjust their emotions when experiencing negative life events.47 At the same time, a low education level may also affect the employment of elderly persons, resulting in poverty.
In addition, this study found that the prevalence of depressive symptoms in elderly persons who had been hospitalized in the previous year and those with chronic diseases was higher, consistent with the findings of Song AQ et al48 and Lebowitz BD et al.49 This may be because elderly individuals suffer from chronic diseases, which have long disease courses and are difficult to cure; thus, they need to be hospitalized frequently. Long-term medical expenses not only increase the family’s economic burden but also the psychological burden of the elderly, which can lead to the occurrence or aggravation of depressive symptoms in the long term.
However, this study found that rural elderly persons with different living arrangements did not differ in terms of prevalence of depressive symptoms. Kaneko Y et al50 showed that the prevalence of depression in elderly persons living alone was higher than those living in other arrangements. The reason for the different results may be that the units of rural communities in China are relatively small. Rural elderly people live in concentrated communities and have close communication with their neighbors in daily life, which means that there is little difference in daily lifestyle between those living alone and those not living alone. In addition, although family help is the main form of support for rural elderly people in China, the basic life of the elderly living alone or not living alone has been effectively protected since the Chinese government established the pension policy for the elderly in 2015.
Strengths And Limitations
The effective response rate of this study was 95.93%, which is very high. It is well known that the results obtained from surveys with high response rates and large samples are very reliable. At the same time, many potential associated factors were also investigated, including demographic characteristics, physical condition, and QoL. However, there were some limitations to this study. Most importantly, the included study sample was from Anhui Province in central China, and samples from other provinces in China and other countries should be included in further in-depth studies in the future. Secondly, the cross-sectional nature of this study limits the ability to infer causality. Further limitations include the use of the GDS-30 to measure depressive symptoms not combined with clinical depression diagnosis may cause accuracy of the results. Finally, this study was based upon self-reports, which may increase recall bias and exclude potentially important associated factors for depressive symptoms such as cognitive impairment or disability.
Conclusion
This was a large cross-sectional study investigating the status of depressive symptoms and QoL among rural elderly in central China, as well as the correlation between depressive symptoms and QoL, and the factors influencing depressive symptoms. Our study provides baseline information for future research and useful data on depressive symptoms and associated factors from China, which helps to better understand its epidemiology in China and compares China with other countries. We found that rural elderly persons in central China had a higher prevalence of depressive symptoms and lower QoL; the prevalence of depressive symptoms in poor elderly persons was higher than in non-poor elderly persons, and poor elderly persons’ QoL was lower than that of non-poor elderly participants. Poverty, lower QoL, female gender, older age, illiteracy, unemployed, chronic diseases, and hospitalization within the previous year were associated with depressive symptoms. These findings have a certain significance for health promotion and protection among the elderly population in rural China. It is important not only to perfect the mechanism of the aging security but also to establish elderly leisure and entertainment facilities to improve QoL in rural China. It is also necessary to introduce elderly clinics in medical care services and provide psychological counseling services for early detection and treatment of high-risk depressive symptom groups in order to improve the mental health of elderly persons in rural areas and promote healthy aging.
Acknowledgment
This research was funded by Research Projects of Humanities and Social Sciences in Colleges and Universities of Anhui Province (No. SK2018A0165) and Doctoral Fund Project of Anhui Medical University (No. XJ201545).
Disclosure
The authors report no conflicts of interest in this work.
References
1. National Bureau of Statistics. Statistical bulletin for national economic and social development. 2019. Available from: http://www.stats.gov.cn/tjsj/zxfb/201902/t20190228_1651265.html.
2. UNFPA and Help Age International. Ageing in the twenty-first century: a celebration and a challenge. 2012. Available from: https://www.unfpa.org/publications/ageing-twenty-first-century.
3. Huang C, Zhang X, Dong B, Lu Z, Yue J, Liu Q. Health status and risk for depression among the elderly: a meta-analysis of published literature. Age Ageing. 2010;39(1):23–30. doi:10.1093/ageing/afp187
4. Huang R, Wang K, Hu J. Effect of probiotics on depression: A systematic review and meta-analysis of randomized controlled trials. Nutrients. 2016;8(8):483. doi:10.3390/nu8080483
5. Sivertsen H, Bjørkløf GH, Engedal K, Selbæk G, Helvik A. Depression and quality of life in older persons: a review. Dement Geriatr Cogn. 2015;40(5–6):311–339. doi:10.1159/000437299
6. Luppa M, Sikorski C, Luck T, et al. Age- and gender-specific prevalence of depression in latest-life–systematic review and meta-analysis. J Affect Disord. 2012;136(3):212–221. doi:10.1016/j.jad.2010.11.033
7. Gao S, Jin Y, Unverzagt FW, et al. Correlates of depressive symptoms in rural elderly Chinese. Int J Geriatr Psych. 2009;24(12):1358–1366. doi:10.1002/gps.2271
8. Correll CU, Detraux J, De Lepeleire J, De Hert M. Effects of antipsychotics, antidepressants and mood stabilizers on risk for physical diseases in people with schizophrenia, depression and bipolar disorder. World Psychiatry. 2015;14(2):119–136. doi:10.1002/wps.v14.2
9. Lenze EJ, Mulsant BH, Blumberger DM, et al. Efficacy, safety, and tolerability of augmentation pharmacotherapy with aripiprazole for treatment-resistant depression in late life: a randomised, double-blind, placebo-controlled trial. Lancet. 2015;386(10011):2404–2412. doi:10.1016/S0140-6736(15)00308-6
10. Gonda X, Pompili M, Serafini G, Carvalho AF, Rihmer Z, Dome P. The role of cognitive dysfunction in the symptoms and remission from depression. Ann Gen Psychiatr. 2015;14(1). doi:10.1186/s12991-015-0068-9
11. Mut-Vitcu G, Timar B, Timar R, Oancea C, Citu IC. Depression influences the quality of diabetes-related self-management activities in elderly patients with type 2 diabetes: a cross-sectional study. Clin Interv Aging. 2016;11:471–479. doi:10.2147/CIA.S104083
12. Netuveli G, Blane D. Quality of life in older ages. Brit Med Bull. 2008;85(1):113–126. doi:10.1093/bmb/ldn003
13. Su S, Wang D. Health-related quality of life and related factors among elderly persons under different aged care models in Guangzhou, China: a cross-sectional study. Qual Life Res. 2019;28(5):1293–1303. doi:10.1007/s11136-019-02107-x
14. Li J, Yu J, Chen X, Quan X, Zhou L. Correlations between health-promoting lifestyle and health-related quality of life among elderly people with hypertension in Hengyang, Hunan, China. Medicine. 2018;97(e1093725).
15. Zhao Y, Hu C, Feng F, et al. Associations of self-neglect with quality of life in older people in rural China: a cross-sectional study. Int Psychogeriatr. 2017;29(6):1015–1026. doi:10.1017/S1041610217000229
16. Xie J, Ding S, Zhong Z, et al. Mental health is the most important factor influencing quality of life in elderly left behind when families migrate out of rural China. Rev Lat Am Enferm. 2014;22(3):364–370. doi:10.1590/0104-1169.3400.2425
17. Zhou Z, Zhou Z, Gao J, Lai S, Chen G. Urban-rural difference in the associations between living arrangements and the health-related quality of life (HRQOL) of the elderly in China—evidence from Shaanxi province. PLoS One. 2018;13(9):e204118.
18. National Bureau of Statistics. Anhui Province GDP per capita. 2019. Available from: http://www.stats.gov.cn/.
19. Anhui Provincial People’s Government. Statistical communique of Anhui national economic and social development. 2019. Available from: http://www.ah.gov.cn/UserData/DocHtml/1/2019/2/28/6043378589099.html.
20. Ding H, Sun X, Chang WW, Zhang L, Xu XP. A comparison of job satisfaction of community health workers before and after local comprehensive medical care reform: a typical field investigation in Central China. PLoS One. 2013;8(9):e73438. doi:10.1371/journal.pone.0073438
21. Ganguli M, Hendrie HC. Screening for cognitive impairment and depression in ethnically diverse older populations. Alzheimer Dis Assoc Disord. 2005;19(4):275–278. doi:10.1097/01.wad.0000190807.90254.24
22. Yunming L, Changsheng C, Haibo T, et al. Prevalence and risk factors for depression in older people in Xi’an China: a community-based study. Int J Geriatr Psychiatry. 2012;27(1):31–39. doi:10.1002/gps.2685
23. Chan AC. Clinical validation of the Geriatric Depression Scale (GDS): Chinese version. J Aging Health. 1996;8(2):238–253. doi:10.1177/089826439600800205
24. Dong Q, Liu JJ, Zheng RZ, et al. Obesity and depressive symptoms in the elderly: a survey in the rural area of Chizhou, Anhui province. Int J Geriatr Psychiatry. 2013;28(3):227–232. doi:10.1002/gps.3815
25. Wang H, Kindig DA, Mullahy J. Variation in Chinese population health related quality of life: results from a EuroQol Study in Beijing, China. Qual Life Res. 2005;14(1):119–132. doi:10.1007/s11136-004-0612-6
26. Liu WY. Study on the Quality of Life and the Influencing Factors of the Elderly [master’s thesis]. Nanchang: Jiaotong University of East China; 2015.
27. Li MH, Luo N. Euro 5-dimension questionnaire scale (EQ-5D) Chinese version application introduction. Chin Pharmacoecon. 2009;1:49–57.
28. He G, Xie J, Zhou J, Zhong Z, Qin C, Ding S. Depression in left-behind elderly in rural China: prevalence and associated factors. Geriatr Gerontol Int. 2016;16(5):638–643. doi:10.1111/ggi.12518
29. Li N, Chen G, Zeng P, et al. Prevalence of depression and its associated factors among Chinese elderly people: A comparison study between community-based population and hospitalized population. Psychiat Res. 2016;243:87–91. doi:10.1016/j.psychres.2016.05.030
30. Park J, Park TW, Yang J, Chung S. Factors associated with depression among elderly Koreans: the role of chronic illness, subjective health status, and cognitive impairment. Psychogeriatrics. 2016;16(1):62–69. doi:10.1111/psyg.12160
31. Arslantas D, Ünsal A, Ozbabalık D. Prevalence of depression and associated risk factors among the elderly in Middle Anatolia, Turkey. Geriatr Gerontol Int. 2014;14(1):100–108. doi:10.1111/ggi.12065
32. Ortiz GG, Arias-Merino ED, Flores-Saiffe ME, Velázquez-Brizuela IE, Macías-Islas MA, Pacheco-Moisés FP. Prevalence of cognitive impairment and depression among a population aged over 60 years in the metropolitan area of Guadalajara, Mexico. Curr Gerontol Geriatr Res. 2012;2012:1–6. doi:10.1155/2012/175019
33. Fang M, Mirutse G, Guo L, Ma X. Role of socioeconomic status and housing conditions in geriatric depression in rural China: a cross-sectional study. BMJ Open. 2019;9(5):e24046. doi:10.1136/bmjopen-2018-024046
34. Parker L, Moran GM, Roberts LM, Calvert M, McCahon D. The burden of common chronic disease on health-related quality of life in an elderly community-dwelling population in the UK. Fam Pract. 2014;31(5):557–563. doi:10.1093/fampra/cmu035
35. Chen Y, Sun G, Guo X, et al. Factors affecting the quality of life among Chinese rural general residents: a cross-sectional study. Public Health. 2017;146:140–147. doi:10.1016/j.puhe.2017.01.023
36. Gong FF. A Cross-Sectional Study on the Detection Rate of Depression and its Influencing Factors in Empty Nesters in a Rural Area of Anhui Province [master ’s thesis]. Hefei: Anhui Medical University; 2016.
37. Helvik A, Engedal K, Selbæk G. The quality of life and factors associated with it in the medically hospitalised elderly. Aging Ment Health. 2010;14(7):861–869. doi:10.1080/13607861003801003
38. Brown PJ, Roose SP. Age and anxiety and depressive symptoms: the effect on domains of quality of life. Int J Geriatr Psych. 2011;26(12):1260–1266. doi:10.1002/gps.2675
39. Akyol Y, Durmus D, Dogan C, Bek Y, Canturk F. Quality of life and level of depressive symptoms in the geriatric population. Turk J Rheumatol. 2010;25(4):165–173. doi:10.5152/tjr.
40. González-Celis AL, Gómez-Benito J. Spirituality and quality of life and its effect on depression in older adults in Mexico. Psychology. 2013;4(3):178–182.
41. Aly HY, Hamed AF, Mohammed NA. Depression among the elderly population in Sohag governorate. Saudi Med J. 2018;39(2):185–190. doi:10.15537/smj.2018.2.21353
42. Tiong WW, Yap P, Huat Koh GC, Phoon Fong N, Luo N. Prevalence and risk factors of depression in the elderly nursing home residents in Singapore. Aging Ment Health. 2013;17(6):724–731. doi:10.1080/13607863.2013.775638
43. Grant BF, Hasin DS, Stinson FS, et al. Prevalence, correlates, co-morbidity, and comparative disability of DSM-IV generalized anxiety disorder in the USA: results from the National Epidemiologic Survey on Alcohol and Related Conditions. Psychol Med. 2005;35(12):1747–1759. doi:10.1017/S0033291705006069
44. Riebe D, Garber CE, Rossi JS, et al. Physical activity, physical function, and stages of change in older adults. Am J Health Behav. 2005;29(1):70–80. doi:10.5993/AJHB.29.1.6
45. Bossola M, Di Stasio E, Antocicco M, et al. Functional impairment is associated with an increased risk of mortality in patients on chronic hemodialysis. BMC Nephrol. 2016;17(1). doi:10.1186/s12882-016-0302-y
46. Kong XY, Xiao QL, Li J. Urban-rural comparison of factors related to depressive symptoms in the elderly. Chin J Ment Health. 2018;32(8):648–655.
47. Bjelland I, Krokstad S, Mykletun A, Dahl AA, Tell GS, Tambs K. Does a higher educational level protect against anxiety and depression? The HUNT study. Soc Sci Med. 2008;66(6):1334–1345. doi:10.1016/j.socscimed.2007.12.019
48. Song AQ, Liang YJ, Wang WJ, Li YL, Guo LY. Correlation between depressive symptoms and chronic diseases and activities of daily living in the elderly. Chin J Health Manage. 2013;7(3):182–185.
49. Lebowitz BD, Pearson JL, Schneider LS, et al. Diagnosis and treatment of depression in late life. Consensus statement update. JAMA. 1997;278(14):1186–1190. doi:10.1001/jama.1997.03550140078045
50. Kaneko Y, Motohashi Y, Sasaki H, Yamaji M. Prevalence of depressive symptoms and related risk factors for depressive symptoms among elderly persons living in a rural japanese community: a cross-sectional study. Community Ment Hlt J. 2007;43(6):583–590. doi:10.1007/s10597-007-9096-5
 © 2019 The Author(s). This work is published and licensed by Dove Medical Press Limited. The full terms of this license are available at https://www.dovepress.com/terms.php and incorporate the Creative Commons Attribution - Non Commercial (unported, v3.0) License.
By accessing the work you hereby accept the Terms. Non-commercial uses of the work are permitted without any further permission from Dove Medical Press Limited, provided the work is properly attributed. For permission for commercial use of this work, please see paragraphs 4.2 and 5 of our Terms.
© 2019 The Author(s). This work is published and licensed by Dove Medical Press Limited. The full terms of this license are available at https://www.dovepress.com/terms.php and incorporate the Creative Commons Attribution - Non Commercial (unported, v3.0) License.
By accessing the work you hereby accept the Terms. Non-commercial uses of the work are permitted without any further permission from Dove Medical Press Limited, provided the work is properly attributed. For permission for commercial use of this work, please see paragraphs 4.2 and 5 of our Terms.