")
Back to Journals » Diabetes, Metabolic Syndrome and Obesity » Volume 15
Correlation Between Blood Glucose Control and Levels of Carbohydrate Antigen 19-9 and Carcinoembryonic Antigen in Patients with Type-2 Diabetes Mellitus
Authors Zhang D
Received 20 April 2022
Accepted for publication 22 July 2022
Published 15 August 2022 Volume 2022:15 Pages 2489—2495
DOI https://doi.org/10.2147/DMSO.S370511
Checked for plagiarism Yes
Review by Single anonymous peer review
Peer reviewer comments 2
Editor who approved publication: Professor Ming-Hui Zou
Dong Zhang
Department of Internal Medicine, The Second Hospital of Beijing, Beijing, 100031, People’s Republic of China
Correspondence: Dong Zhang, Department of Internal Medicine, The Second Hospital of Beijing, Beijing, 100031, People’s Republic of China, Tel +86 10 66061122, Email [email protected]
Objective: To investigate The relationship between glycemic control and serum levels of carbohydrate antigen 19– 9 (CA19-9) and carcinoembryonic antigen (CEA) in patients with type-2 diabetes mellitus (T2DM).
Methods: A total of 211 patients with T2DM who were hospitalized were enrolled and divided into two groups according to the glycosylated hemoglobin AlC (HbAlC) levels: Group A (HbAlC ≥ 7.5%) and Group B (6.5% < HbAlC < 7.5%). Additionally, 68 subjects with healthy physical examination results were selected as the control group (Group C). The differences in the clinical biochemical indicators of the three groups were compared as well as the analysis of the indicators related to CA19-9 and CEA.
Results: The levels of CA19-9 and CEA were highest in Group A and were lowest in the control group (P < 0.05). The levels of CA19-9 and CEA were significantly higher in the two T2DM groups compared with the control group (P < 0.01). The levels of FINS, FCP, and LDH in group A were higher than those in groups B and C (P < 0.05). The levels of HDL and BUN in groups A and B were lower, while the TSH and U-MA levels were higher than those in group C (P < 0.05). There was no significant difference in the levels of TC, TG, and Cr among the groups (P > 0.05). A correlation analysis revealed that both CA19-9 and CEA were positively correlated with HbAlC (P < 0.01). Multiple stepwise regression analysis showed that HbA1C and BUN were influencing factors for serum CA19-9 levels (P < 0.05), and HbA1C and U-MA were influencing factors for serum CEA levels (P < 0.05).
Conclusion: Both CA19-9 and CEA might be elevated at low levels in patients with T2DM; levels were closely correlated to the degree of glycemic control.
Keywords: diabetes mellitus type 2, tumor marker, carbohydrate antigen 19-9, carcinoembryonic antigen, glycosylated hemoglobin, influencing factor
Introduction
In recent years, diabetes mellitus (DM) has become a global health concern. The incidence of type-2 DM (T2DM) is increasing annually, and it has become the third most dangerous threat to human health after malignant tumors and cardiovascular and cerebrovascular diseases.1 China is becoming the country with the largest diabetic population in the world.
T2DM is closely related to malignant tumors and may increase the risk of developing different types of malignancies. Many large epidemiological studies and meta-analytical reviews have shown continued increases in the incidence of site-specific cancers in patients with T2DM, such as pancreatic cancer, cholangiocarcinoma, breast cancer, endometrial cancer, and colorectal cancer.2
The detection of tumor markers is an economical and convenient method for the diagnosis of malignant tumors. It also has predictive value for malignant tumors. Some tumor markers, such as serum carbohydrate antigen 19–9 (CA19-9) and carcinoembryonic antigen (CEA), may be abnormally elevated in patients with T2DM. It has been shown that the combined detection of CA19-9 and CEA in patients with diabetes can be an effective tool for the early diagnosis of pancreatic cancer.3 However, whether the elevated levels of CA19-9 and CEA in patients with T2DM indicate the occurrence of malignant tumors is still controversial. Elevated tumor markers have also been detected in patients with T2DM without malignancy.4 In this study, we aimed to analyze the correlation between the changes in the levels of CA19-9 and CEA and blood sugar control in non-malignant patients with T2DM.
Materials and Methods
General Materials
From August 2016 to August 2020, a total of 211 inpatients with new-onset T2DM in the comprehensive Internal Medicine Department of the Beijing Second Hospital were enrolled in the study. There were 135 males and 76 females, with an average age of 64.16 ± 13.4 years. According to the glycosylated hemoglobin AlC (HbAlC) levels, patients with T2DM were divided into two groups: Group A, HbAlC ≥ 7.5%) and Group B (6.5% < HbAlC < 7.5%). Meanwhile, 68 healthy subjects who underwent physical examinations in our hospital during the same period were adopted as the normal control group (Group C). This group included 40 males and 28 females, with an average age of 57.05 ± 11.77 years. The differences in age (F = 0.49) and gender (χ2 = 0.388) were not statistically significant among the three groups (P > 0.05), and the data were comparable.
The inclusion criteria were as follows: (1) Patients were diagnosed with T2DM diagnosed in accordance with the relevant diagnosis criteria for DM in the Chinese Guidelines for the Prevention and Treatment of Type 2 Diabetes (2017 edition);5 (2) with newly diagnosed T2DM or with disease duration less than three months; (3) were not treated with insulin and any hypoglycemic drugs; (4) Patients had complete medical records and laboratory test results; (5) Patients showed no sign of malignant tumors in ultrasound, CT, and other examination methods.
The exclusion criteria were as follows: (1) patients with type-1 DM, gestational diabetes, or special types of DM, (2) patients with serious chronic complications or serious cardiac, pulmonary, hepatic, or renal abnormalities, (3) patients with other endocrine disorders, such as hyperthyroidism, hypothyroidism, or Cushing’s syndrome, (4) patients with various acute complications, such as stress, ketosis, or infection, (5) patients with cirrhosis, cholecystitis, cholelithiasis, acute or chronic pancreatitis, surgery for pancreatic diseases, malignant tumors, or infectious diseases, and (6) patients who had recently medicated with drugs that might interfere with glucose and lipid metabolism, including indomethacin, phentolamine, furosemide, thiazole diuretics, phenytoin sodium, and cortisone.
Detection of Laboratory Indicators
All patients and subjects who underwent physical examinations fasted for 8–12 hours after admission, and fasting venous blood was drawn and sent for examination in the early morning of the following day. The blood specimens were placed in pre-cooled ethylenediamine tetra-acetic acid anticoagulation tubes, and the plasma was separated and stored in a refrigerator at −70°C for further analysis. The biochemical indicators in the fasting venous blood were measured by a fully automated biochemical analyzer (LX-20 model, Beckman Co.). Fasting plasma glucose (FPG) was detected by the glucose oxidase method. The enzymatic method was used for the detection of total cholesterol (TC) and triglycerides (TG). High-density lipoprotein (HDL) cholesterol and low-density lipoprotein (LDL) cholesterol were detected by the homogeneous method. The urease peroxidase coupling method was used to detect uric acid (UA). Blood urea nitrogen (BUN) was measured by a BUN test, and high-performance liquid chromatography was used to detect HbA1C. The chemiluminescence method was utilized for the detection of fasting insulin (FINS), fasting C-peptide (FCP), CA19-9, and CEA. Urinary microalbumin (U-MA) was detected by radioimmunoassay. The cyclic enzymatic method was used for the detection of serum homocysteine (Hcy), and serum thyroid-stimulating hormone (TSH) was detected by radioimmunoassay. C-reactive protein (CRP) was detected using the turbidimetry process.
Statistical Methods
SPSS™ Statistics v17.0 software was used for data processing. Measurement data that satisfied the normal distribution were expressed as means ± standard deviation (SD). A one-way analysis of variance was used for the comparison of means among multiple groups, and the least-significant-difference method was adopted for multiple comparisons among groups. Spearman correlation analysis was used to investigate the correlation of CA19-9 and CEA levels with other variables in the patients with diabetes. Multivariate analysis was performed using multiple stepwise regression analysis. A value of P < 0.05 was considered statistically significant.
Results
Comparison of the Biochemical Data Among the Different Groups
The levels of HbA1C and FPG were highest in Group A, then in Group B. They were lowest in Group C. The differences in these indicators were statistically significant between groups by multiple inter-group comparisons (all P < 0.05). The levels of FINS and FCP were lowest in Group A, then in Group B. They were highest in Group C (P < 0.05), but the differences in the two indicators were not statistically significant between Groups B and C (P > 0.05). The level of LDL cholesterol was higher in Group A than in Groups B and C (P < 0.05), but the difference was not statistically significant between Groups B and C (P > 0.05). The levels of HDL cholesterol and BUN were lower in Groups A and B than in Group C, and the TSH and U-MA levels were higher in Groups A and B than in Group C (P < 0.05). The differences in these indicators were not statistically significant between Group A and Group B (P > 0.05). The levels of UA and CRP were higher in Group A than in Group B (P < 0.05), but the differences in the two indicators were not statistically significant either between Group A and Group C or between Group B and Group C (P > 0.05). The Hcy level was higher in Group A than in Group C (P < 0.05), but the differences were not statistically significant either between Group A and Group B or between Group B and Group C (P > 0.05). The differences in TC, TG, and creatinine (Cr) were not statistically significant among the three groups (P > 0.05) (Table 1).
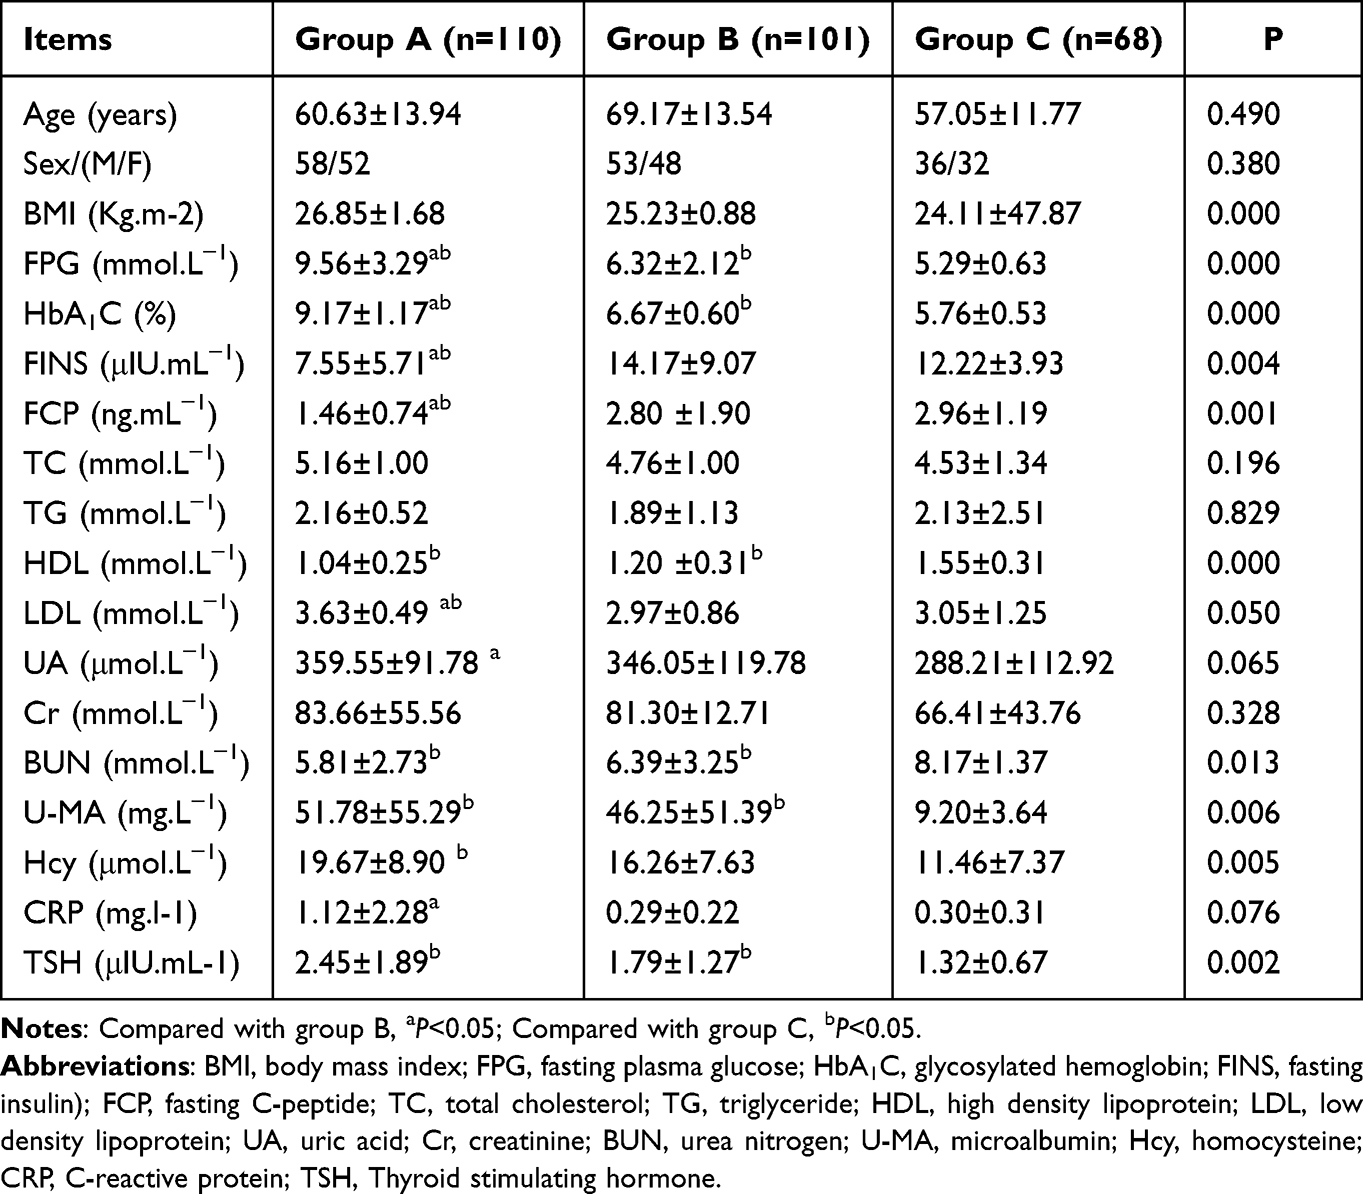 |
Table 1 Comparison of Biochemical Indexes of Patients in the Three Groups (Mean ± SD) |
Comparison of CA19-9 and CEA Levels Among Patients with T2DM with Different Levels of Glycemic Control
The levels of CA19-9 and CEA were highest in Group A, then in Group B. They were lowest in Group C, and the differences in the two indicators were statistically significant between the groups by inter-group comparisons (P < 0.01 in all) (Table 2).
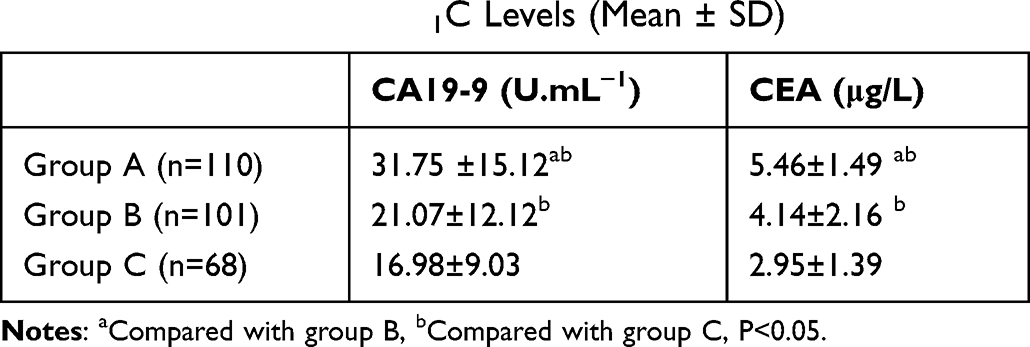 |
Table 2 Comparison of the Levels of CA19-9 and CEA in T2DM Patients with Different HbA1C Levels (Mean ± SD) |
Correlation Analysis of the Relationship Between the Levels of CA19-9 and CEA and Biochemical Indicators
A Spearman correlation analysis was conducted to investigate the correlation between the levels of CA19-9 and gender, age, body mass index, FPG, HbA1C, FINS, FCP, Cr, BUN, TC, TG, U-MA, TSH, Hcy, and CRP. The results showed that CA19-9 was positively correlated with both HbA1C (Rs = 0.500, P < 0.01) and TSH (Rs = 0.402, P < 0.05), while it was negatively correlated with BUN (Rs = −0.368, P < 0.05). The CEA level was positively correlated with HbA1C (Rs = 0.496, P < 0.01), FPG (Rs = 0.298, P < 0.05), Hcy (Rs = 0.272, P < 0.01), U-MA (Rs = 0.266, P < 0.05), and TSH (Rs = 0.345, P < 0.05), while it was negatively correlated with BUN (Rs = −0.288, P < 0.05). The highest correlation coefficients were between CA19-9 and HbA1C and between CEA and HbA1C, while there were no significant correlations with other variables (Table 3).
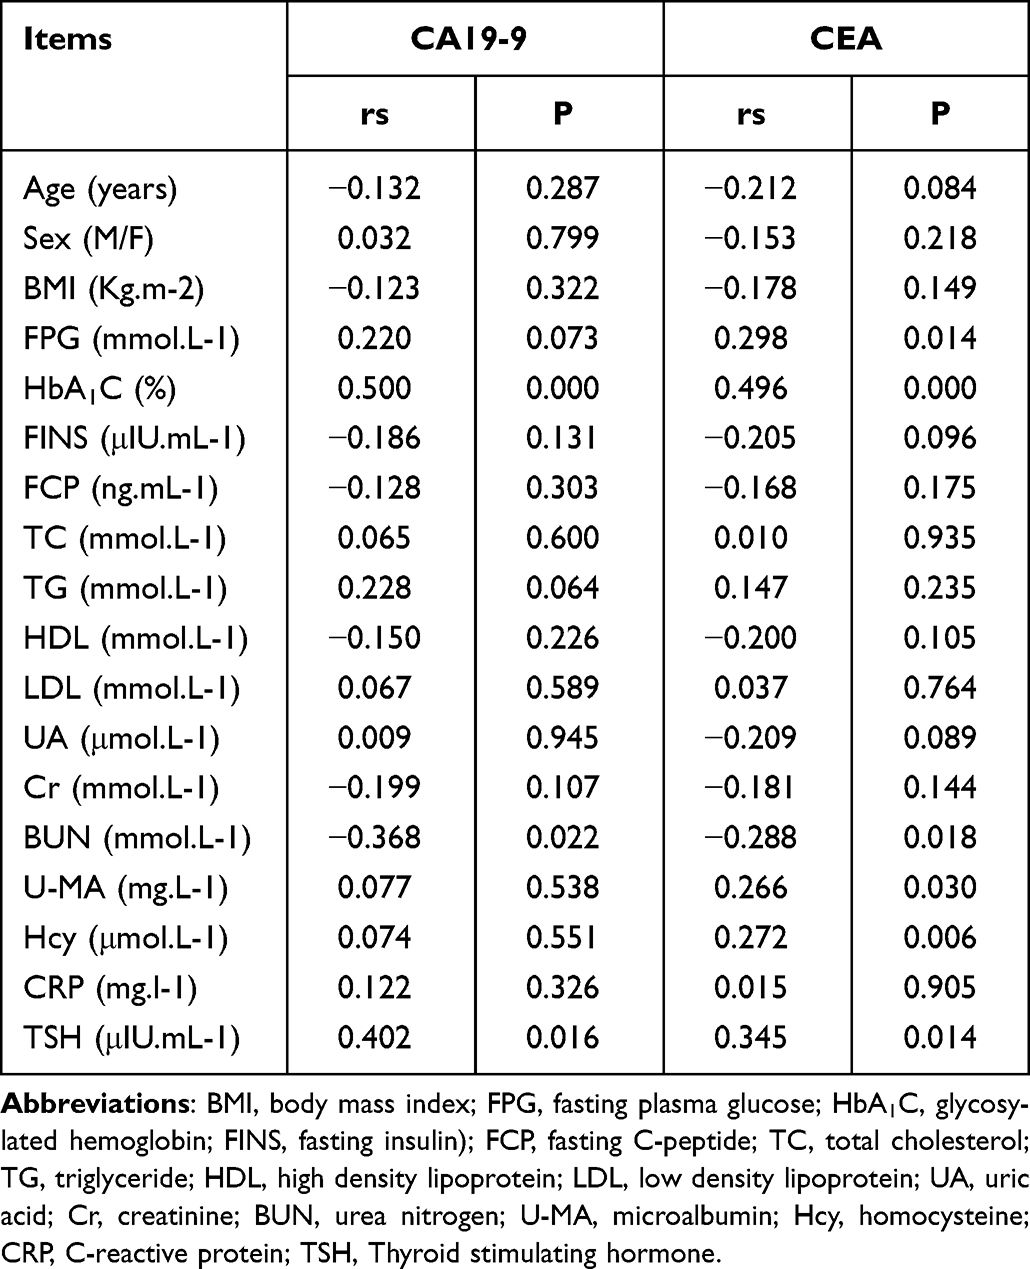 |
Table 3 Correlation Analysis of the Levels of CA19-9 and CEA |
Lastly, multiple linear regression was performed with CA19-9 as dependent variables, and age, gender, body mass index, FBG, HbA1C, FINS, FCP, TC, TG, HDL, LDL, UA, Cr, BUN, U-MA, Hcy, CPR, and TSH as independent variables. The results showed that HbA1C was a risk factor affecting the CA19-9 levels (β = 4.418, P < 0.01); BUN was a risk factor affecting the CA19-9 levels (β = −2.456, P < 0.05). Then, multiple linear regression was performed with CEA as dependent variables, and FBG, HbA1C, FINS, FCP, TC, TG, HDL, LDL, UA, Cr, BUN, U-MA, Hcy, CPR, and TSH as independent variables. The results revealed that HbA1C was a risk factor affecting the CEA levels (β = 0.466, P < 0.05); and U-MA was a risk factor affecting the CEA levels (β = 0.011, P < 0.05) (Table 4).
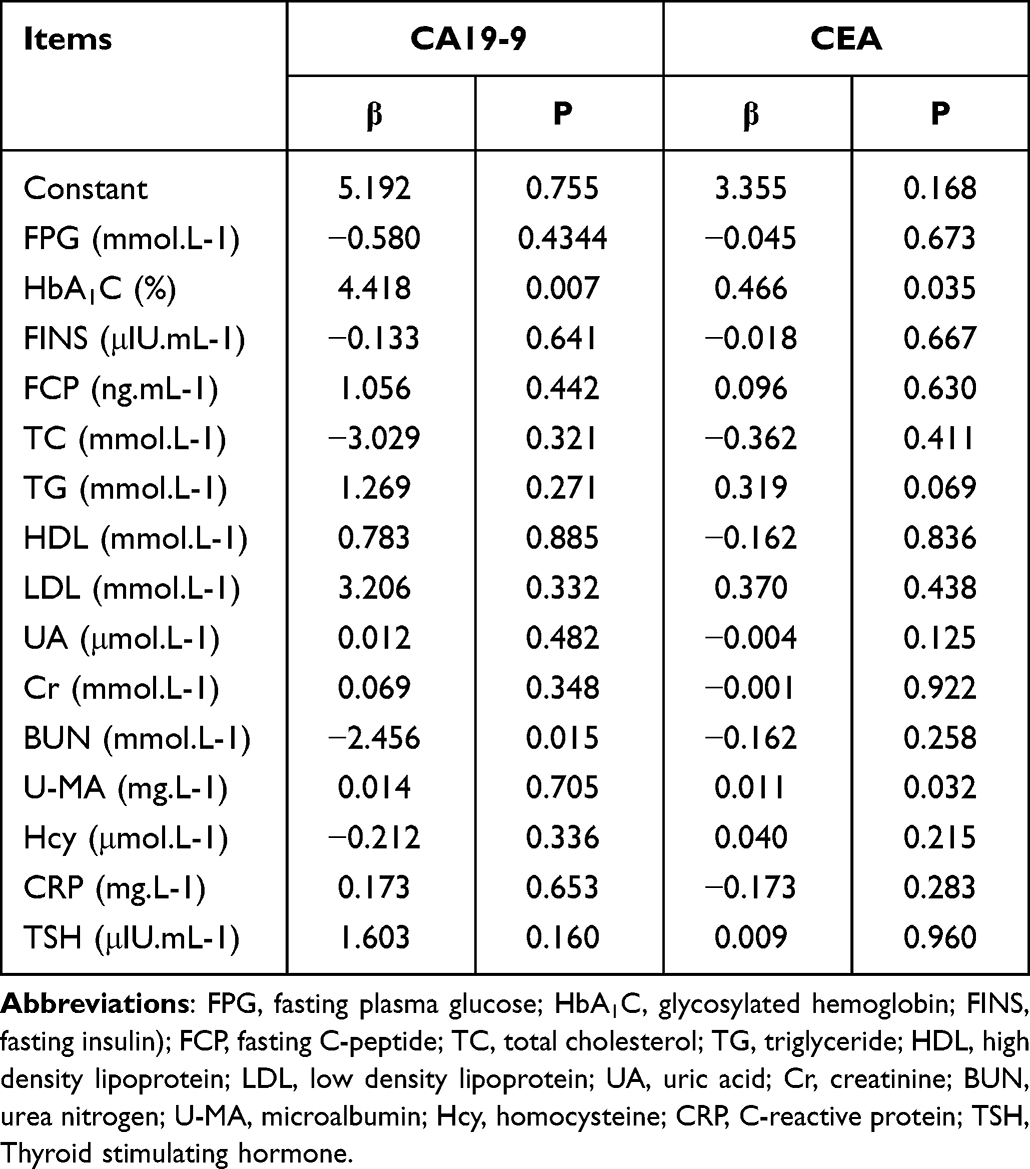 |
Table 4 Multivariate Linear Regression Analysis of the Levels of CA19-9 and CEA |
Discussion
The prevalence of T2DM, which is a chronic inflammatory disease of the pancreas, is increasing annually in China. According to the ADA standard, the prevalence of diabetes among Chinese adults is 12.8%, of which T2DM accounts for more than 95%.6 Complications of diabetes have become a major social public health problem that threatens human health. Patients with long-term disease may successively develop cardiovascular disease, diabetic nephropathy, and diabetic retinopathy. Long-term hyperglycemia may stimulate normal tissues, leading to their repeated destruction and repair, while adaptive selection may cause the malignant transformation of body cells to malignant tumor cells with a strong glycolytic capacity, thereby promoting the onset and development of malignancy.7 Epidemiological data have revealed that the incidence of malignant tumors in diabetic patients is on the rise, especially pancreatic cancer, digestive tract tumors, liver cancer, and breast cancer.2 Pearson-Stuttard et al showed that malignant tumor and diabetes have become the most common causes of death after cardiovascular disease.8 At present, comprehensive screening of malignant tumors in patients with T2DM has been highly valued in clinical practice, but how to prevent overdiagnosis in T2DM patients with malignant tumors remains a challenge to clinicians.
Among the various monitoring indicators for patients with diabetes, HbA1C indicates the overall level of blood glucose control within the past 1–3 months, which can reflect a patient’s overall level of blood glucose control. CA19-9 and CEA are commonly used diagnostic markers for tumors. CA19-9 and CEA are of great significance in clinical diagnosis, evaluation of treatment effect, and prognosis of tumors.
The level of CA19-9 is an important marker in the diagnosis and treatment of gastrointestinal tumors and pancreatic cancer; it occurs as salivated Lacto-N-Fucopentaose II, a glycoprotein component of mucin. CEA is a broad-spectrum marker that is widely found in gastrointestinal tumors of endodermal origin. It is also a polysaccharide-rich protein complex.9 Chen et al10 found that CA19-9 and CEA levels were higher in patients with T2DM than in healthy controls, and poor glycemic control was an independent factor affecting the levels of CA19-9 and CEA. These data suggest that elevated tumor markers also occur in non-malignant T2DM patients. The results of the present study were consistent with the findings of previous related studies in that the CA19-9 and CEA levels were significantly higher in patients with T2DM compared with the normal controls, indicating that CA19-9 and CEA might be abnormally elevated in patients with T2DM. Our study also showed that the levels of CA19-9 and CEA in the two groups of newly diagnosed T2DM patients were higher than those of the control group.
At present, there is no detailed explanation of the specific mechanism of the elevation of CA19-9 and CEA in patients with T2DM. Previous evidence has shown that elevation in the levels of CA19-9 and CEA might be correlated with chronic inflammation of the pancreas in patients with T2DM.11 Long-term hyperglycemia in patients with T2DM can cause vitreous degeneration and tissue necrosis in pancreatic cells, and some glycoprotein components in nucleated cells, including CA19-9 and CEA, can be released into the blood in large quantities.12 Additionally, the elevation of sialic acid levels and the accelerated salivation of the carbohydrate chains in patients with T2DM may also increase the concentrations of CA19-9 and CEA. However, these elevations are mild and much lower than those in patients with pancreatic cancer, which might be due to the existence of different mechanisms between the two conditions. In patients with pancreatic cancer, the increase in the levels of CA19-9 and CEA is mainly the result of the increased production of CA19-9 and CEA by malignant cells and the secretion of both.
It is now recognized that DM results from the long-term dysfunction of the endocrine system of the pancreas, which is functionally and structurally interconnected. Patients with DM are likely to have simultaneous involvement of the endocrine and exocrine glandular tissues, both of which transfer metabolites via the islet–alveolar portal system and affect each other.13 The levels of CA19-9 and CEA mainly manifest as low-level elevations in patients with T2DM. The present study revealed that the levels of CA19-9 and CEA were significantly higher in the diabetic group compared with the healthy control group, while the levels in Group A were higher than those in Group B.
The results of the Spearman analysis showed a positive correlation between the CA19-9 and CEA levels and HbA1C. Multiple linear regression analysis showed that HbA1C was a risk factor for CA19-9 and CEA (P<0.05), suggesting that changes in CA19-9 and CEA levels may be related to blood sugar control. These findings were consistent with a study of 268 T2DM patients, showing that the levels of CA19-9 and CEA were positively correlated with the HbA1c levels. It suggests14 that the hyperglycemic state might lead to pancreatic impairment, stimulating the increase of the CA19-9 and CEA levels. This indicates that elevated HbA1C and poor glycemic control lead to hyperglycemic toxicity, which would aggravate insulin deficiency, subsequently leading to impaired pancreatic exocrine function and the release of CA19-9 through the pancreatic ducts.15 Hyperglycemia might also produce late glycosylation end products through the nonenzymatic glycosylation pathway, which would activate a series of intracellular signaling pathways by binding to specific receptors, interfering with the original physiological functions of cells and leading to increased CEA levels.16 With the effective control of blood glucose in patients with diabetes with previous poor glycemic control, the re-examination of CA19-9 and CEA levels showed that, in most patients, the levels of CA19-9 and CEA could return to the normal range, thereby confirming that fluctuations in blood glucose might be an important cause of the above changes.17
In addition, the correlation analysis in the present study found that TSH was linearly correlated with CA19-9 (Rs = 0.402, P <0.05) and CEA (Rs = 0.345, P < 0.05). These positive correlations suggest that thyroid hormones might be involved in the production and release of CA19-9 and CEA. Multiple regression analysis showed that BUN was a risk factor for CA19-9 (β = −2.456, P < 0.05) and U-MA was a risk factor for CEA (β = 0.011, P < 0.05), suggesting that more attention should be paid to the possible effects of renal function changes on the metabolism of tumor markers in diabetic patients. No relevant studies are available at present, and the exact mechanism needs to be confirmed in further multicenter studies with large samples.
Conclusion
In summary, the serum levels of CA19-9 and CEA might be elevated to varying degrees in the absence of malignancy in patients with T2DM with poor glycemic control. Individualized analyses should be conducted according to a patient’s condition. It should not be assumed that elevated CA19-9 and CEA indicate malignant diseases. When no signs of malignant tumors are found, it can be temporarily considered whether it is caused by poor control of T2DM. If there is no significant improvement after blood sugar control, the possibility of malignant tumors should be considered. In the future, we should focus on the reference thresholds of tumor markers in patients with T2DM to provide an accurate, practical, and important reference basis for tumor screening in patients with T2DM, and also to prevent overdiagnosis of malignant tumors.
Ethics Approval and Consent to Participate
This study was conducted with approval from the Ethics Committee of the Second Hospital of Beijing. This study was conducted in accordance with the declaration of Helsinki. Written informed consent was obtained from all participants.
Disclosure
The author reports no conflicts of interest in this work.
References
1. Cho NH, Shaw JE, Karuranga S, et al. IDF diabetes atlas: global estimates of diabetes prevalence for 2017 and projections for 2045. Diabetes Res Clin Pract. 2018;138:271–281. PMID: 29496507. doi:10.1016/j.diabres.2018.02.023
2. Tsilidis KK, Kasimis JC, Lopez DS, Ntzani EE, Ioannidis JP. Type 2 diabetes and cancer: umbrella review of meta-analyses of observational studies. BMJ. 2015;350:g7607. PMID: 25555821. doi:10.1136/bmj.g7607
3. Huang SF, Zhang YF, Kang MX, et al. Research progress on pathogenesis and markers of pancreatic cancer-related diabetes. Chin J General Surg. 2018;33(6):531–533. Chinese.
4. Tang Y, Sun Q, Yang J, et al. Tumor markers changes among different blood glucose level people. Chin J Gerontol. 2018;38(24):5923–5926.
5. Diabetes Branch of Chinese Medical Association. Guidelines for the prevention and treatment of type 2 diabetes in China (2017). Chin J Diabetes. 2018;10(1):4–67. Chinese.
6. Li Y, Teng D, Shi X, et al. Prevalence of diabetes recorded in mainland China using 2018 diagnostic criteria from the American Diabetes Association: national cross sectional study. BMJ. 2020;369:m997. PMID: 32345662; PMCID: PMC7186854. doi:10.1136/bmj.m997
7. Yang J, Ren B, Yang G, et al. The enhancement of glycolysis regulates pancreatic cancer metastasis. Cell Mol Life Sci. 2020;77(2):305–321. PMID: 31432232. doi:10.1007/s00018-019-03278-z
8. Pearson-Stuttard J, Zhou B, Kontis V, Bentham J, Gunter MJ, Ezzati M. Worldwide burden of cancer attributable to diabetes and high body-mass index: a comparative risk assessment. Lancet Diabetes Endocrinol. 2018;6(6):e6–e15. PMID: 29195904; PMCID: PMC5805864. doi:10.1016/S2213-8587(17)30366-2
9. Gao Y, Wang J, Zhou Y, Sheng S, Qian SY, Huo X. Evaluation of serum CEA, CA19-9, CA72-4, CA125 and ferritin as diagnostic markers and factors of clinical parameters for colorectal cancer. Sci Rep. 2018;8(1):2732. doi:10.1038/s41598-018-21048-y
10. Chen YB, Zhang W, Wang WN, Lin ZZ. A study of serum CA199 levels in relation to glycemic control levels and age in patients with type 2 diabetes. Lab Med. 2020;38(1):68–70. Chinese.
11. Zhang F, Bao Y, Zhou J, et al. Serum ca19-9 level in diabetic patients and its relationship with pancreatic disease. Chin J New Drugs Clin Pract. 2011;2012(6):431–435.
12. Du ZX, Liang MM, Sun J, Wang WJ, Liu YH, Yang JH. Clinical significance of serum CA-125, CA19-9 and CEA in pulmonary tuberculosis with and without type 2 diabetes. Tuberculosis. 2017;107:104–110. PMID: 29050756. doi:10.1016/j.tube.2017.08.006
13. Zhang DD, Tang X, Jin DY, Hu YH, Gao P. 中国成年人糖尿病患病率Meta分析. [Prevalence of diabetes in Chinese adults: a meta-analysis]. Zhonghua Liu Xing Bing Xue Za Zhi. 2018. 39(6):852–857. Chinese. PMID: 29936760. doi:10.3760/cma.j.issn.0254-6450.2018.06.030
14. Shang X, Song C, Du X, Shao H, Xu D, Wang X. The serum levels of tumor marker CA19-9, CEA, CA72-4, and NSE in type 2 diabetes without malignancy and the relations to the metabolic control. Saudi Med J. 2017;38(2):204–208. PMID: 28133696; PMCID: PMC5329635. doi:10.15537/smj.2017.2.15649
15. Yu H, Li R, Zhang L, Chen H, Bao Y, Jia W. Serum CA19-9 level associated with metabolic control and pancreatic beta cell function in diabetic patients. Exp Diabetes Res. 2012;2012:745189. PMID: 22778715; PMCID: PMC3384953. doi:10.1155/2012/745189
16. Shang XJ, Du XM, Fang T, Zhang R, Tian FS. 2型糖尿病患者铁超载对肿瘤标志物CA199水平的影响. [Effect of iron overload on the level of carbohydrate antigen 199 in type 2 diabetes mellitus]. Zhonghua Yi Xue Za Zhi. 2019. 99(22):1722–1726. Chinese. PMID: 31216819. doi:10.3760/cma.j.issn.0376-2491.2019.22.008
17. Lu B, Fang LN, Zhong S. Correlation between serum CA199 level and glycemic control in patients with type 2 diabetes mellitus. J Bengbu Med Coll. 2012;37(12):1479–1481.
 © 2022 The Author(s). This work is published and licensed by Dove Medical Press Limited. The full terms of this license are available at https://www.dovepress.com/terms.php and incorporate the Creative Commons Attribution - Non Commercial (unported, v3.0) License.
By accessing the work you hereby accept the Terms. Non-commercial uses of the work are permitted without any further permission from Dove Medical Press Limited, provided the work is properly attributed. For permission for commercial use of this work, please see paragraphs 4.2 and 5 of our Terms.
© 2022 The Author(s). This work is published and licensed by Dove Medical Press Limited. The full terms of this license are available at https://www.dovepress.com/terms.php and incorporate the Creative Commons Attribution - Non Commercial (unported, v3.0) License.
By accessing the work you hereby accept the Terms. Non-commercial uses of the work are permitted without any further permission from Dove Medical Press Limited, provided the work is properly attributed. For permission for commercial use of this work, please see paragraphs 4.2 and 5 of our Terms.