")
Back to Journals » Clinical Ophthalmology » Volume 11
Corneal endothelium and central corneal thickness changes in type 2 diabetes mellitus
Authors El-Agamy A, Alsubaie S
Received 31 October 2016
Accepted for publication 30 November 2016
Published 2 March 2017 Volume 2017:11 Pages 481—486
DOI https://doi.org/10.2147/OPTH.S126217
Checked for plagiarism Yes
Review by Single anonymous peer review
Peer reviewer comments 2
Editor who approved publication: Dr Scott Fraser
Amira El-Agamy,1,2,* Shams Alsubaie3,*
1Department of Optometry and Vision Sciences, College of Applied Medical Sciences, King Saud University, Riyadh, Saudi Arabia; 2Mansoura Ophthalmic Center, Faculty of Medicine, Mansoura University, Mansoura, Egypt; 3Department of Optometry and Vision Sciences, Sulaiman Al Habib Hospital, Riyadh, Saudi Arabia
*These authors contributed equally to this work
Purpose: This study was conducted to compare the corneal endothelial cell density (ECD), morphological features, and central corneal thickness (CCT) in type 2 diabetes mellitus (DM) with age-matched, nondiabetic control subjects using EM-3000 Specular Microscope.
Study design: This was a prospective, hospital-based, nonrandomized, case–control, observational, and quantitative study.
Subjects and methods: The study included 57 patients (57 eyes) with type 2 DM and 45 control (nondiabetic) subjects (45 eyes). The corneal endothelial structure and CCT were examined in all eyes by noncontact specular microscopy using EM-3000 Specular Microscope. The endothelial structure was studied for ECD, coefficient of variation of cell area (CV), and percentage of hexagonal cells.
Results: The study included 36 eyes without diabetic retinopathy (DR), 14 eyes with nonproliferative DR, and 7 eyes with proliferative DR. There were 26 eyes with a duration of ≤10 years and 31 eyes with a duration of >10 years. Also, there were 24 eyes with HbA1c ≤7.5% and 33 eyes with HbA1c >7.5%. ECD was significantly lower in the diabetic cornea than in control group (P=0.014). CV was higher in diabetic cornea (P=0.008). The diabetic cornea group had lower percentage of hexagonal cells than the control group, but the difference was not statistically significant (P=0.603). Also, diabetic cornea was thicker than control group, but not statistically significant (P=0.301).
Conclusion: This study documented that type 2 DM causes a significant reduction of ECD and increased CV (polymegathism). Also, diabetic cornea has increased CCT and lower percentage of hexagonal cells than normal subjects, but without statistical significance.
Keywords: endothelial cell density, central corneal thickness, diabetes mellitus, diabetic retinopathy, noncontact specular microscopy
Introduction
Many studies have demonstrated considerable effects of diabetes mellitus (DM) on all the layers of the cornea. These studies have documented that diabetic cornea is vulnerable to many abnormalities such as corneal endothelial damage, recurrent corneal erosions, punctate epithelial keratopathy, persistent epithelial defects, impaired corneal sensitivity, ulcers, slowed wound repair, and superficial keratitis.1–3
Morphological features of the corneal endothelium in diabetic patients recognized by a number of studies include a decrease in endothelial cell density (ECD) and polymorphism (decrease in the percentage of hexagonal cells [the normal percentage >50%]) as well as polymegathism, which means increased coefficient of variation (CV) of cell area (CV values measured between 0.22 and 0.31 are considered normal and above 0.4 are abnormal) and increased central corneal thickness (CCT).4–6
EM-3000 Specular Microscope (CBD/Tomey, Phoenix, AZ, USA) is a noncontact specular microscope that avoids some disadvantages of the classic contact specular microscopes such as corneal ulceration and transmission of infectious diseases. It has the ability to assess corneal endothelium features and measure CCT at the same time with accuracy of ±10 μm.7
The aim of this study was to compare corneal ECD, morphological features, and CCT in type 2 DM with age-matched, nondiabetic control subjects using EM-3000 Specular Microscope. In addition, correlation between these corneal changes and the duration of DM and severity of diabetic retinopathy (DR) and glycemic control (glycated hemoglobin [HbA1c] level) were also assessed.
Study design
This study was a prospective, hospital-based, nonrandomized, case–control, observational, and quantitative study. It got the approval of Research Ethics Committee of College of Applied Medical Sciences, King Saud University, and Security Forces Hospital, Riyadh, Saudi Arabia. It adhered to the tenets of the Declaration of Helsinki. All the participants signed comprehensive consent after explanation of the possible consequences of the study prior to investigations.
Subjects and methods
The study included 57 patients (27 males and 30 females [57 eyes]) with type 2 DM and 45 control (nondiabetic) subjects (45 eyes [22 males and 23 females]). The age range of diabetic group was 42–80 years (mean: 57.08±8.37 years), and the age range of the control group was 40–76 years (mean: 50.80±8.39 years). All patients were recruited from ophthalmology department at Security Forces Hospital, Riyadh, Saudi Arabia, by nonrandomized convenience sampling method from February to April 2015. The diagnosis of type 2 DM was based on the criteria of the World Health Organization (WHO).8 Control patients did not have diabetes was confirmed by random blood sugar test. The mean duration of DM was 12.87±8.03 years (range: 1–40 years), and the mean value of HbA1c was 8.57%±2.09% (range: 6.3%–17.2%). Demographics of control and diabetic patients (eyes) are shown in Table 1.
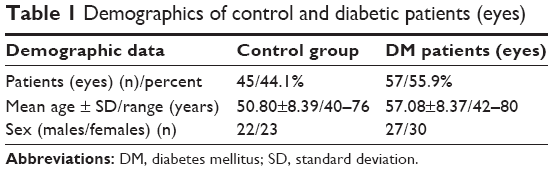 | Table 1 Demographics of control and diabetic patients (eyes) |
Exclusion criteria included presence of high myopia, history of past intraocular surgery or corneal disease or dystrophy such as Fuch’s endothelial dystrophy, active or previous eye infection or inflammation, previous ocular surgery or trauma, previous retinal photocoagulation, pterygium, entropion, trichiasis, contact lens wear, regular usage of any eyedrops or known tear-interfering systemic drugs (such as hormone replacement and antihistamines), systemic illness such as rheumatoid arthritis and systemic lupus erythematous that are known to impair tear function, pregnancy, labor, and glaucoma. In addition, patients who are unable to provide informed consent were excluded.
Age, gender, duration of diabetes, most recent HbA1c value, status of DR, other medical illness, and current medical treatment were recorded. In this study, only the right eye of each patient was tested. All subjects underwent a complete ophthalmic examination that included visual acuity assessment using the Snellen chart, refraction using auto-refractometer (Topcon, Tokyo, Japan), and intraocular pressure measurement using air puff tonometer, slit-lamp biomicroscopy, and fundus examination.
The corneal endothelial structure and CCT were examined in all eyes by noncontact specular microscopy using EM-3000 Specular Microscope, and this examination was done by a single examiner. The endothelial structure was studied by measuring a variety of factors, including ECD, CV, and percentage of hexagonal cells.
The patient was positioned on a chair in front of the EM-3000 Specular Microscope. His/her chin was placed on the chin rest and his/her forehead rested on the special head area. The patient was asked to fixate his/her eye for a few seconds on the red light coming from inside the device until the instrument automatically took a clear image of the corneal endothelium and measured the CCT at the same time. The measurements were done three times and the average was taken.
The diabetic eyes were classified into 3 groups according to the status of DR (group without DR, group with nonproliferative DR [NPDR], and group with proliferative DR [PDR]). Also, they were divided into 2 groups according to DM duration (group with a duration of ≤10 years and group with a duration of >10 years) and according to HbA1c value (group with HbA1c ≤7.5% and group with HbA1c >7.5%).
Statistical analysis
The data were analyzed using SPSS 21 for windows software (IBM, Armonk, NY, USA). The results were expressed as mean ± standard deviation. An independent sample t-test was performed to compare the means of CCT and corneal endothelium features in diabetic and control groups. The differences among 3 or more groups were analyzed by one-way analysis of variance. Pearson correlation test was performed to find the relationship between corneal changes and DM duration, HbA1c%, and DR status. A value of P≤0.05 was considered statistically significant.
Results
The study included 36 eyes without DR, 14 eyes with NPDR, and 7 eyes with PDR. There were 26 eyes with DM duration of ≤10 years and 31 eyes with DM duration of >10 years. Also, there were 24 eyes with HbA1c ≤7.5% and 33 eyes with HbA1c >7.5%. Classification of groups of diabetic eyes is shown in Table 2.
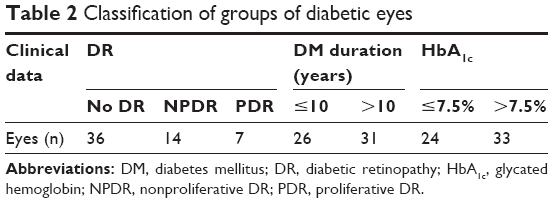 | Table 2 Classification of groups of diabetic eyes |
ECD was significantly lower in the diabetic cornea group (2,491.98±261.08 cell/mm2) than in the control group (2,629.68±293.45 cell/mm2) (P=0.014). CV was higher in the diabetic cornea group (0.41±0.07) than in the control group (0.37±0.08) (P=0.008, which was considered statistically significant). Diabetic cornea group had lower percentage of hexagonal cells (33.24%±10.25%) than control group (34.24%±8.73%), but the difference was not statistically significant (P=0.603). Also, cornea was thicker in the diabetic group (545.61±30.39 μm) than control group (539.42±29.22 μm), but not statistically significant (P=0.301). A comparison of the mean values of CCT, ECD, CV, and hexagonality between control and diabetic eyes is shown in Table 3. Specular microscope pictures taken from control and diabetic eyes are shown in Figures 1–4.
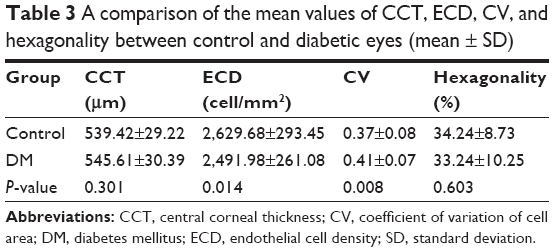 | Table 3 A comparison of the mean values of CCT, ECD, CV, and hexagonality between control and diabetic eyes (mean ± SD) |
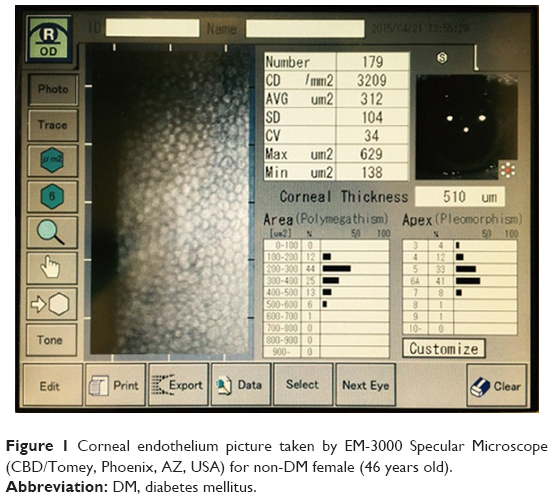 | Figure 1 Corneal endothelium picture taken by EM-3000 Specular Microscope (CBD/Tomey, Phoenix, AZ, USA) for non-DM female (46 years old). |
 | Figure 2 Corneal endothelium picture taken by EM-3000 Specular Microscope (CBD/Tomey, Phoenix, AZ, USA) for DM female (46 years old) with PDR (DM duration of 20 years and HbA1c =9.2%). |
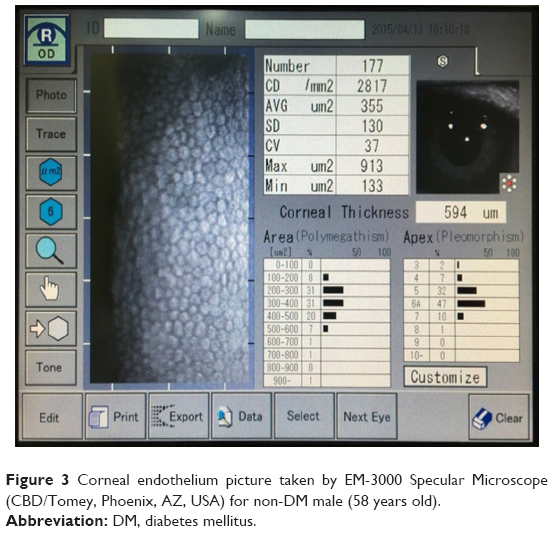 | Figure 3 Corneal endothelium picture taken by EM-3000 Specular Microscope (CBD/Tomey, Phoenix, AZ, USA) for non-DM male (58 years old). |
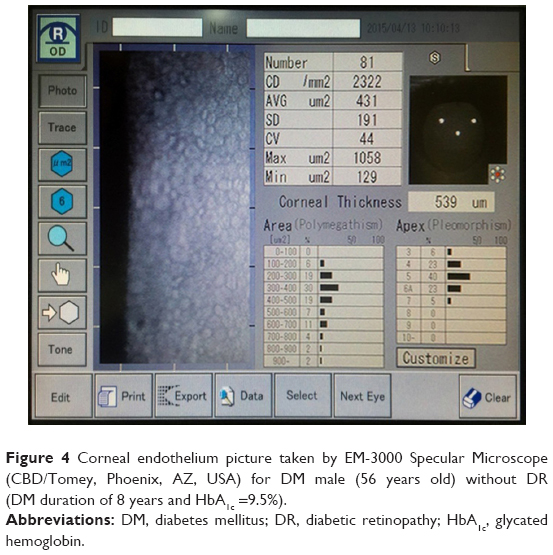 | Figure 4 Corneal endothelium picture taken by EM-3000 Specular Microscope (CBD/Tomey, Phoenix, AZ, USA) for DM male (56 years old) without DR (DM duration of 8 years and HbA1c =9.5%). |
Eyes with DM duration of ≤10 years had higher ECD (2,509.38±303.49 cell/mm2) than eyes with DM duration of >10 years (2,477.38±223.61 cell/mm2) (P=0.658), and they also had more hexagonality (35.61%±9.87%) than those with DM duration of >10 years (31.26%±10.29%) (P=0.111), but the differences were not significant. Also, there were no significant differences in CCT (P=0.431) and CV (P=0.927) between the 2 groups. A comparison of the mean values of CCT, ECD, CV, and hexagonality between the diabetic groups according to the duration of DM is shown in Table 4. Specular microscope pictures taken from diabetic eyes with DM duration of >10 years and ≤10 years are shown in Figures 2 and 4.
 | Table 4 A comparison of the mean values of CCT, ECD, CV, and hexagonality between the diabetic groups, according to duration of DM (mean ± SD) |
Diabetic patients with HbA1c% ≤7.5 had higher, but not statistically significant, ECD (2,537.62±311.86 cell/mm2) than those with HbA1c% >7.5 (2,458.78±216.06 cell/mm2) (P=0.293) and higher hexagonality (35.58%±10.09%) than the other group (31.54%±10.17%) (P=0.144). The mean of CV was significantly lower (P=0.017) in diabetic patients with HbA1c% ≤7.5 (0.39±0.05) than in the other group (0.43±0.07). Also, there was no statistically significant difference in CCT between the 2 groups (0.789). A comparison of the mean values of CCT, ECD, CV, and hexagonality between the diabetic groups according to HbA1c% is shown in Table 5.
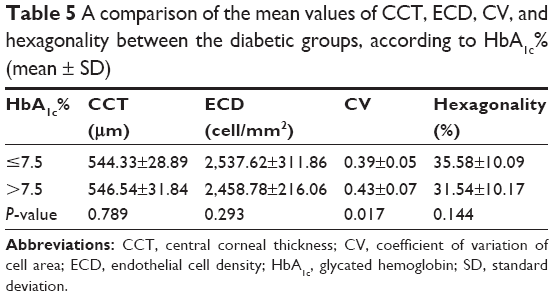 | Table 5 A comparison of the mean values of CCT, ECD, CV, and hexagonality between the diabetic groups, according to HbA1c% (mean ± SD) |
In addition, there were no significant differences between CCT, ECD, CV, and hexagonality percentage of the corneal endothelial cells in diabetic patients without DR, with NPDR, and with PDR (P=0.344, 0.806, 0.284, and 0.500, respectively) (Table 6).
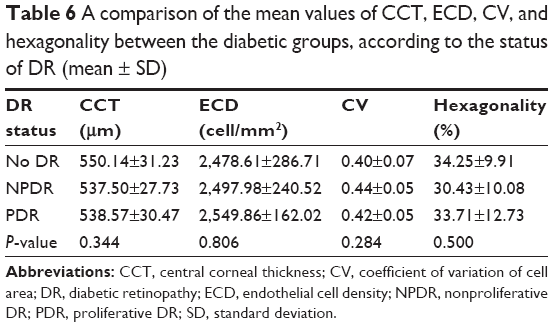 | Table 6 A comparison of the mean values of CCT, ECD, CV, and hexagonality between the diabetic groups, according to the status of DR (mean ± SD) |
Pearson correlation analysis showed that DM duration, HbA1c levels, and severity of DR had no significant correlations with CCT, CV, hexagonality, or ECD (Table 7).
 | Table 7 Correlation between corneal changes and DM duration, HbA1c%, and DR status |
Discussion
Diabetic cornea may give the impression that is healthy, but actually it may suffer from many morphological features affecting its function later on. This fact was evidenced by several studies.1–6
In this study, we found that diabetic corneas showed a statistically significant reduction in mean corneal ECD of 5.24% (P=0.014) compared to the corneas in the control group. This was similar to the results of Choo et al4 of 4.5% significant reduction in ECD (P<0.01) in Malaysian type 2 DM patients. Also, the results of Inoue et al’s9 study of the corneal endothelium and CCT in type 2 DM in Japan showed similar results of 4.1% (P=0.016) significant reduction in ECD in the diabetic group. However, results of Storr-Paulsen et al’s6 and Siribunkum et al’s10 studies of corneal endothelium morphology in type 2 DM according to ECD were not consistent with our findings. The CV of corneal endothelial cells was found to be significantly increased in diabetic patients (P=0.008). This increase indicated the presence of polymegathism, in which endothelial cells enlarge to fill the gaps between adjacent cells. This result was concordant with those obtained by Shenoy et al11 and Lee et al,12 but not similar to those of Sudhir et al5 and Chen et al.13
Also, our study demonstrated no significant difference in the percentage of hexagonal cells between the diabetic patients and the controls, which was in agreement with the results of Sudhir et al,5 Storr-Paulsen et al,6 and Inoue et al,9 and in disagreement with those of Choo et al,4 and Lee et al.12
Many studies4,14,15 have explained the morphological features of diabetic cornea. This was established by the assessment of polyol (sorbitol–aldose reductase) pathway in diabetic cornea. These studies documented that high glucose levels lead to increased activity of the aldose reductase, causing sorbitol buildup in the corneal epithelial and endothelial cells. This sorbitol acts as an osmotic agent and leads to swelling of endothelial cells. Also, DM diminishes Na+–K+ ATPase activity of the corneal endothelium, resulting in morphological and permeability changes in diabetic cornea, thereby leading to corneal destruction. Furthermore, endothelial pump function was proven to be affected by decreased ATP production as a result of slowing down of the Krebs cycle in diabetic cornea.
Regarding CCT in our study, there was no significant difference between diabetic and control groups. This result was in concordance with those of Choo et al4 and Sudhir et al.5 Other studies, for instance, Storr-Paulsen et al6 and Lee et al,12 demonstrated a statistically significant increase in CCT of diabetic compared to control subjects.
As regards the comparison of the mean values of CCT, ECD, CV, and cell hexagonality in patients with DM duration of ≤10 years and those with DM duration of >10 years, no statistically significant difference was detected in all these morphological features in this study. This finding was in agreement with Altay et al,16 who reported absence of statistically significant difference in CCT between the 2 groups. However, Lee et al12 documented that CCT and CV were significantly higher in patients with DM duration of >10 years compared with those with DM duration of ≤10 years, but there was no statistically significant difference regarding ECD and hexagonality between the 2 groups.
Concerning the comparison of the mean values of CCT, ECD, CV, and cell hexagonality in diabetic patients with HbA1c ≤7.5% and those with HbA1c >7.5% in our study, no significant differences were detected between the 2 groups in CCT, ECD, and hexagonality, but CV showed a statistically significant difference (P=0.017). Storr-Paulsen et al6 found significantly lower ECD in patients with elevated HbA1c, but without any influence on CCT. However, Altay et al16 documented significantly thicker CCT in hyperglycemic condition than in euglycemic condition in the same patient before and after successful control of HbA1c.
Regarding the comparison of the mean values of CCT, ECD, CV, and hexagonality between the 3 diabetic groups according to the status of DR, our study found no significant differences between the 3 groups. This finding was not in accordance with that of Shenoy et al,11 who demonstrated significantly lower ECD in eyes with DR than those without DR.
Pearson correlation analysis reported absence of significant correlations between DM duration, HbA1c levels, and severity of DR and morphological features of diabetic cornea such as CCT, CV, hexagonality, or ECD. These results were similar to those of Choo et al.4 However, Siribunkum et al10 found a significant correlation between DM duration and pleomorphism, polymegathism, and CCT. Severity of DR was correlated with ECD, but these correlations were low. However, the corneal morphological abnormalities were not correlated with HbA1c levels.
Conclusion
This study documented that type 2 DM resulted in a significant reduction of ECD and increased CV (polymegathism). Also, diabetic cornea had increased CCT and lower percentage of hexagonal cells than in the cornea of normal subjects, but this is not statistically significant. In addition, our study demonstrated that DM duration, HbA1c levels, and severity of DR had no significant correlations with CCT, CV, hexagonality, or ECD.
In this study, patients with a history of laser photocoagulation were excluded due to its influence on the corneal structures.17 This exclusion produced a small sample size because most of diabetic patients who came to the clinic had undergone laser treatments. Therefore, further studies with a large sample size are recommended to verify the extent of corneal damage caused by type 2 DM.
Disclosure
Dr Amira El-Agamy is financially supported by the Research Center of College of Applied Medical Sciences, King Saud University, Saudi Arabia. The authors report no other conflicts of interest in this work.
References
Herse PR. A review of manifestations of diabetes mellitus in the anterior eye and cornea. Am J Optom Physiol Optics. 1988;65:224–230. | ||
Thomas N, Jeyaraman K, Asha HS, Velevan J. A Practical Guide to Diabetes Mellitus. New Delhi, India: Jaypee Brothers Medical Publishers; 2012. | ||
Chawla R. Complications of Diabetes. New Delhi, India: Jaypee Brothers Medical Publishers 2012. | ||
Choo M, Prakash K, Samsudin A, Soong T, Ramli N, Kadir A. Corneal changes in type II diabetes mellitus in Malaysia. Int J Ophthalmol. 2010;3(3):234–236. | ||
Sudhir R, Raman R, Sharma T. Changes in the corneal endothelial cell density and morphology in patients with type 2 diabetes mellitus: a population-based study, Sankara Nethralaya Diabetic Retinopathy and Molecular Genetics Study (SN-DREAMS, Report 23). Cornea. 2012;31(10):1119–1122. | ||
Storr-Paulsen A, Singh A, Jeppesen H, Norregaard J, Thulesen J. Corneal endothelial morphology and central thickness in patients with type II diabetes mellitus. Acta Ophthalmol. 2013;92(2):158–160. | ||
Guthrie DW, Guthrie R. Management of Diabetes Mellitus: A Guide to the Pattern Approach. 6th ed. New York, NY: Springer Publishing Company; 2008. | ||
World Health Organization. Definition, Diagnosis and Classification of Diabetes Mellitus and Its Complications. Report of a WHO Consultation. Geneva, Switzerland: World Health Organization; 1999. | ||
Inoue K, Kato S, Inoue Y, Amano S, Oshika T. The corneal endothelium and thickness in type II diabetes mellitus. Jpn J Ophthalmol. 2002;46(1):65–69. | ||
Siribunkum J, Kosrirukvongs P, Singalavanija A. Corneal abnormalities in diabetes. J Med Assoc Thai. 2001;84(8):1075–1083. | ||
Shenoy R, Khandekar R, Bialasiewicz A, Al Muniri A. Corneal endothelium in patients with diabetes mellitus: a historical cohort study. Eur J Ophthalmol. 2009;19(3):369–375. | ||
Lee JS, Oum BS, Choi HY, Lee JE, Cho BM. Differences in corneal thickness and corneal endothelium related to duration in diabetes. Eye. 2006;20(3):315–318. | ||
Chen Y, Huang S, Jonna G, Channa P. Corneal endothelial cell changes in diabetes mellitus. Invest Ophthalmol Vis Sci. 2014;55(5):2054. | ||
Browning DJ. Diabetic Retinopathy: Evidence-Based Management. New York, NY: Springer; 2010. | ||
Tripathy BB, Chandalia HB, Das AK, Rao PV. Textbook of Diabetes Mellitus. New Delhi, India: Jaypee Brothers Medical Publishers; 2012. | ||
Altay Y, Burcu A, Ornek F. The change in central corneal thickness after successful control of hyperglycemia in diabetic patients. Int Eye Sci. 2014;14(4):575–578. | ||
Pardos GJ, Krachmer JH. Photocoagulation: its effect on the corneal endothelial cell density of diabetics. Arch Ophthalmol. 1981;99(1):84–86. |
 © 2017 The Author(s). This work is published and licensed by Dove Medical Press Limited. The full terms of this license are available at https://www.dovepress.com/terms.php and incorporate the Creative Commons Attribution - Non Commercial (unported, v3.0) License.
By accessing the work you hereby accept the Terms. Non-commercial uses of the work are permitted without any further permission from Dove Medical Press Limited, provided the work is properly attributed. For permission for commercial use of this work, please see paragraphs 4.2 and 5 of our Terms.
© 2017 The Author(s). This work is published and licensed by Dove Medical Press Limited. The full terms of this license are available at https://www.dovepress.com/terms.php and incorporate the Creative Commons Attribution - Non Commercial (unported, v3.0) License.
By accessing the work you hereby accept the Terms. Non-commercial uses of the work are permitted without any further permission from Dove Medical Press Limited, provided the work is properly attributed. For permission for commercial use of this work, please see paragraphs 4.2 and 5 of our Terms.